

Effects of Noise from Oil and Gas Development on Ungulates and Small Mammals—A Science Synthesis to Inform National Environmental Policy Act Analyses
Links
- Document: Report (13.8 MB pdf) , HTML , XML
- Version History: Version History (8.00 KB txt)
- Download citation as: RIS | Dublin Core
Acknowledgments
We would like to thank Patrick Anderson, Emma Dietrich, Jay Johnson, Sam Jordan, Jennifer Meineke, Benjamin Robb, Alex Stoneburner, and Carmia Woolley for reviews of early drafts of this synthesis. We also thank Janna Simonsen, Elroy Masters, and Daryl Ratajczak for their involvement in the conceptualization of this science synthesis and their support throughout the writing process. We thank Tim Hammond for helping us understand many of the nuances of applying this synthesis to management decisions. We are very grateful to Clint Francis and Gail Patricelli for providing independent peer reviews of this work. Finally, we gratefully acknowledge Colorado State University and FORT Writes guided writing sessions hosted by Kristina Quynn and Kimi Conro for providing expertise, time, incentive, and accountability that aided in the writing process.
Funding for this work was provided by the Bureau of Land Management National Operations Center. This synthesis project was supported in part by the U.S. Geological Survey Ecosystems Mission Area—Land Management Research Program.
Executive Summary
Background: The U.S. Geological Survey is working with Federal land management agencies to develop a series of science synthesis reports. These reports synthesize science information to support environmental effects analyses that agencies perform per the National Environmental Policy Act (NEPA). In this report, we synthesize science information relevant to environmental effects analyses for proposed oil and gas development activities on public lands. We focus specifically on the effects of noise from oil and gas development on two groups of terrestrial, North American wildlife: ungulates and small mammals, which we limited to rodents and leporids (in other words, rabbits and hares).
How this report can inform a NEPA analysis: We organized the sections of this synthesis to align with standard elements of NEPA environmental effects analyses. The report presents science information relevant to characterizing a proposed action and alternatives (section 1 of this report), characterizing the affected environment (section 2 of this report), identifying issues for analysis and potential environmental effects for each issue (sections 3 and 4 of this report), and mitigating potential adverse effects of the proposed action and alternatives (section 5 of this report). We have developed a flowchart illustrating an example quantitative environmental effects analysis and where to find the corresponding information in this document (fig. 1).
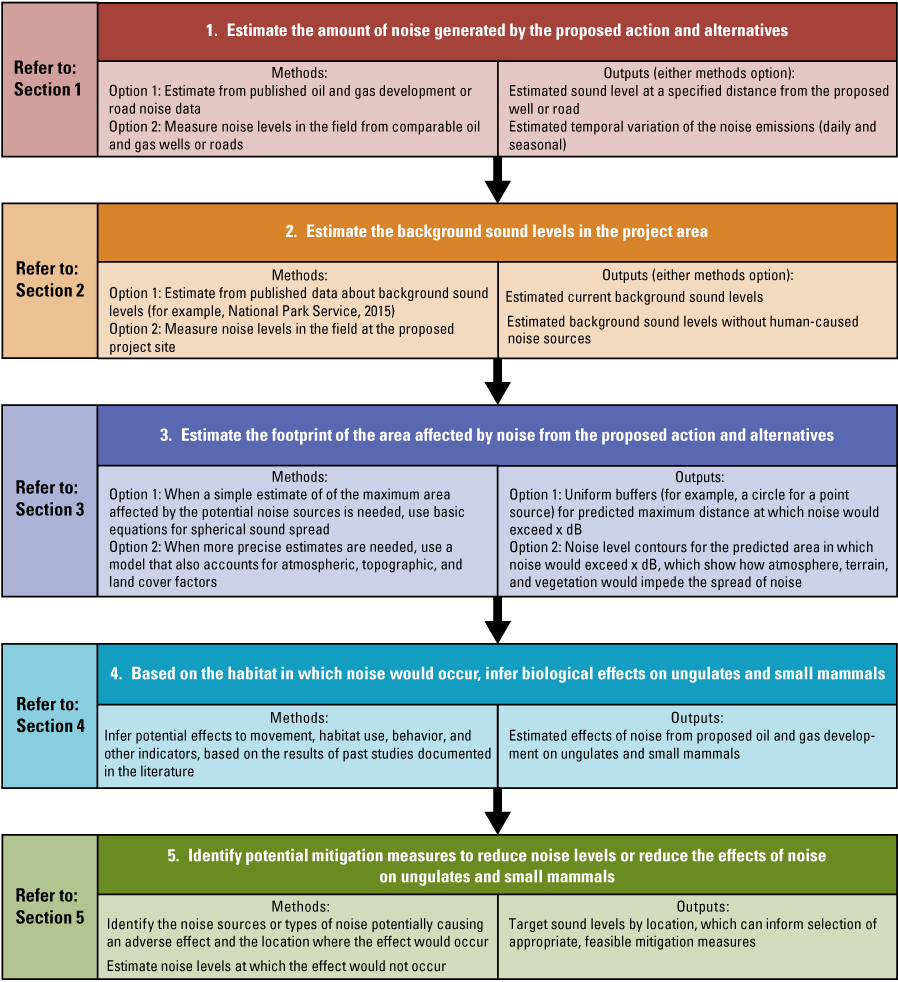
An example of potential methods steps in a quantitative analysis of the effects of noise from oil and gas development on ungulates and small mammals with references to the sections of this report that synthesize science information relevant to each methods step. [dB, decibels]
Noise produced by oil and gas development: Identifying the duration and extent of noise across the landscape is critical to understanding potential effects of proposed oil and gas activities on the landscape. Oil and gas development is a common source of human-caused noise on public lands. Human-caused noise in oil and gas fields comes from diverse sources such as heavy construction and drilling machinery, long-term production machinery, truck traffic, aircraft, and human activity. Noise from heavy equipment, machinery, trucks, and aircraft is generally loud across a broad spectrum of audible frequencies. Some infrastructure (for example, compressors that aid in transportation of natural gas) can produce sound 24 hours per day through the course of several years of production.
The perceived loudness of noise depends on existing ambient sound levels in the environment. For example, human development, wind, and rivers can elevate background sound levels. A decrease in background sound level would result in an increase in the perceived loudness of noise from oil and gas development, and undeveloped landscapes can be extremely quiet, causing noises to be heard farther away from the noise source than they would be near cities, roads, or rivers. Common techniques for measuring the existing acoustic environment and estimating the acoustic environment without human-caused noises include field data collection using a sound level meter or inference from previously measured or published data.
Effects of noise from oil and gas development on ungulates and small mammals: A substantial and growing body of research shows that human-caused noise can affect wildlife health and behavior. Noise has been shown to have different molecular-, physiological-, behavioral-, population-, and community-level effects across wildlife taxa, highlighting the importance of understanding how noise affects individual species. Few studies have documented the effects of noise from oil and gas wells on ungulate behavior and habitat use. Although these studies have shown consistent detectable effects of noise on ungulates, the body of literature is very small, and additional research could improve understanding of differences in effects from noise among species, among seasons, and on individual indicators of fitness.
Past studies have documented varied effects of human-caused noise from oil and gas development on small mammals. Several species of small mammal are highly dependent on audible signals for predator detection and communication, and noise has been shown to affect their vigilance and foraging behavior. In addition, noise can alter predator-prey relationships by impairing the hunting ability of predators that rely on acoustic cues to find prey, which could result in a positive effect on small mammals in noisy areas. However, other studies have documented no effects to rodents in noisy areas. The overall variability in results indicates that the effects of noise on rodents and leporids may differ by species and study system, making generalizability of known effects challenging.
Types of measures for mitigating the effects of noise from oil and gas development on ungulates and small mammals: Techniques suggested in the literature for reducing noise emissions or the negative effects of noise emissions on ungulates or small mammals include sound barriers, seasonal and daily timing restrictions, traffic control, and spatial considerations during project design, such as siting infrastructure and wells to take advantage of natural sound barriers. These measures can have varying levels of effectiveness depending on design and life history traits of the target species.
Conclusion: This science synthesis can facilitate the use of the best available science in public lands decisions about proposed oil and gas development. This report can be incorporated by reference in NEPA documentation, cited as supplemental information, or used as a general reference for understanding and identifying literature about the effects of noise from oil and gas development on ungulates and small mammals.
Methods for developing this synthesis: We did a structured search of recent published scientific literature to find published science about noise levels produced during oil and gas development, methods for analyzing sound propagation, the effects of noise on ungulates and small mammals, and measures to reduce noise emissions and their effects on ungulates and small mammals. This report was prepared in cooperation with staff from the Bureau of Land Management, the U.S. Fish and Wildlife Service, and the U.S. Geological Survey.
Purpose of This Report
Federal land management agencies permit and plan for many uses and activities on public lands across the United States. Per the National Environmental Policy Act of 1969 (NEPA; 42 U.S.C. 4321 et seq.), Federal agencies must analyze and disclose the potential environmental effects of major Federal actions that may significantly affect the quality of the human environment. Regulations for implementing the NEPA require the integrated use of the natural and social sciences in agency planning and decision processes (40 CFR § 1501.2). Science is foundational to understanding how proposed Federal actions may affect natural resources, ecosystems, and human communities.
The purpose of this report is to synthesize science information relevant to environmental effect analyses for proposed oil and gas development activities on public lands. Science syntheses can be useful mechanisms for sharing science information with public land managers to inform their decisions (Seavy and Howell, 2010; Ryan and others, 2018). Science syntheses integrate knowledge and research findings to increase the generality, applicability, and accessibility of that information (Wyborn and others, 2018).
This report focuses specifically on the effects of noise from various aspects of oil and gas development on wild, North American ungulates (in other words, large, hoofed mammals), rodents, and leporids (in other words, rabbits and hares) and identifies methods for characterizing noise and analyzing and mitigating its effects. Human-caused noise is widespread on public lands across the United States, and oil and gas development is a common source of that noise (Buxton and others, 2017). A substantial and growing body of research shows that human-caused noise can affect wildlife health and behavior (Shannon, McKenna, and others, 2016; Sordello and others, 2020). Noise has been shown to have molecular-, physiological-, behavioral-, population-, and community-level effects across wildlife taxa (Kight and Swaddle, 2011), highlighting the importance of understanding the effects of noise on specific taxa and species (Blickley and Patricelli, 2010).
How to Use This Report
The content, structure, and section numbering of this report are designed to support NEPA analyses and reflect the steps of project planning and NEPA analyses (table 1). This report is meant to be a general reference and could be used, for example, as follows:
-
• incorporated by reference in NEPA documentation (40 CFR § 1501.12) or to directly provide language for use in NEPA documentation (when incorporating by reference or drawing language from this report, please use the Rutherford and others [2023] suggested citation on p. ii of this report),
-
• included as supplemental information, or
-
• used as a resource to gather literature.
Table 1.
How the information in this report can inform steps in project planning and National Environmental Policy Act (NEPA) analysis.[CFR, Code of Federal Regulations]
Caveats to Use of This Report
Please note this report is a science synthesis rather than a comprehensive literature review. In addition, this report does not provide all information necessary to do a full environmental effects analysis or make conclusions regarding the significance of environmental effects. Resource planners and managers may need to supplement the information contained in this synthesis with local information. Information about specific design elements of the proposed project, local landscape conditions, and potential environmental effects from factors other than noise can complement the information contained in this synthesis.
We note that this report focuses on data about noise and does not provide information about how to obtain wildlife data. Information and data about the distribution and status of local wildlife populations are crucial to understanding what species, how many individuals, and how much habitat might be affected by noise from proposed oil and gas development.
Although the content of this report is focused on noise from oil and gas development, we note that this report may be useful for other types of actions on public lands. Many actions that occur on public lands involve machinery, traffic, and human activity and may produce noise like the noise associated with oil and gas activities. However, because of the specificity of the science synthesized in this report, we urge caution when generalizing its content to other types of actions.
Science Synthesis—Effects of Noise from Oil and Gas Development on Ungulates and Small Mammals
The following numbered sections are the science synthesis content of this report. The science synthesis sections are numbered to reflect a potential overall analysis workflow, as shown in figure 1, and facilitate internal referencing among sections. Our methods for conducting the literature search and synthesizing the science appear after this science synthesis content.
1. Characterizing Noise Caused by Oil and Gas Development
1.1. Sound Basics
Sound data are generally reported using several standard metrics. Two common metrics for characterizing sound are sound level (loudness) and sound frequency (pitch).
1.1.1. Sound Level
The loudness or amplitude of a sound is commonly measured as either sound pressure or sound power (definitions from the literature for bolded words appear in the Glossary section of this report).
-
• Sound pressure (the most common metric for loudness in the literature cited in this report) is a measure of change in barometric pressure caused by sound waves. Sound waves attenuate with distance from a sound source. Therefore, sound pressure varies based on the spatial relation between a sound source and a sound receiver, and sound pressure level is measured and reported as the sound pressure at the location of a receiver. Sound pressure at a receiver varies through time as sound sources move or change. Because of this, when reporting sound pressure levels, different statistics can be used to characterize different aspects of the acoustic environment through time at the receiver. Sound pressure level (L) statistics include the maximum sound pressure level (Lmax), minimum sound pressure level (Lmin), and logarithmic average of the sound pressure level (also known as the equivalent sound level [Leq]) during the timeframe of interest. In addition, studies often report the exceedance percentile (Lx), or the sound pressure level that was exceeded x percent of the timeframe of interest (Ambrose and Florian, 2014). Another commonly used sound pressure statistic is sound exposure level (SEL), which captures the total sound energy of acute noise by considering level and duration of sound (Pater and others, 2009).
-
• Sound power (a less common metric for loudness in the literature cited in this report) is a measure of the sound energy produced by a sound source per unit of time. Sound power is fixed per sound source and is unrelated to the position of a sound receiver.
The unit of measure for sound power level and sound pressure level is the decibel (dB; Houser and others, 2017).
Perception of the loudness of a specific sound level varies based on acoustic context and species. Acoustic context is critical when determining the loudness of a noise source because a specific sound level would be perceived as louder in quiet environments and quieter in loud environments. For example, a whisper that sounds quiet inside a noisy building would be perceived as much louder in an undeveloped desert on a calm night. In addition, perception of sound loudness varies among species because of evolved anatomic differences (app. 2). Therefore, sound pressure level is often decibel weighted to represent perceived loudness to human hearing, commonly called A-weighting and measured in A-weighted decibels (dBA; Houser and others, 2017). For reference, the sound of a soft whisper is approximately 30 dBA 1–5 meters (m) from the whisperer, and a chainsaw cutting wood at full throttle is greater than 110 dBA less than 1 m from the saw (see table 2 for additional examples; Berger and others, 2016). Sound measurements can also be weighted for other species if those species’ hearing capabilities are known (Pater and others, 2009). Another standard weighting system is C-weighting, which uses C-weighted decibels (dBC). C-weighting favors lower frequencies and is often used to measure sound from industrial sources and peak sound levels. Unweighted sound levels are sometimes reported as Z-weighted (dBZ), which is equivalent to unweighted decibels (dB) between 10 to 20,000 hertz (Hz; Houser and others, 2017), or flat frequency response (dBF), for which the frequency range is undefined (Blickley and Patricelli, 2013). Conversion of sound measurements between decibel weighting systems is dependent on sound frequency (fig. 2). Because most studies report a single sound level, which is an integrated measure of sound levels from across the set of frequencies at which that sound has occurred (see section “1.1.2. Sound Frequency”; Engineering ToolBox, 2003), comparing observed sound level results across weighting systems is difficult. Therefore, in this report, we report sound level results as they were documented in the original study without converting between weighting systems.
Table 2.
Range of measured sound pressure levels of several common sound sources.[All data are summarized in Berger and others (2016). All reported sound pressure levels are A-weighted to represent perceived loudness to human hearing and are the range of measurements reported in several studies. Note, perceived loudness of a noise level also depends on acoustic context, with quieter background sound levels resulting in an increase in perceived loudness. Duration of measurement may vary by source (Berger and others, 2016). Please refer to Berger and others (2016) for additional details and references to the original studies in which data were collected. dBA, A-weighted decibel; m, meter; ~, about]
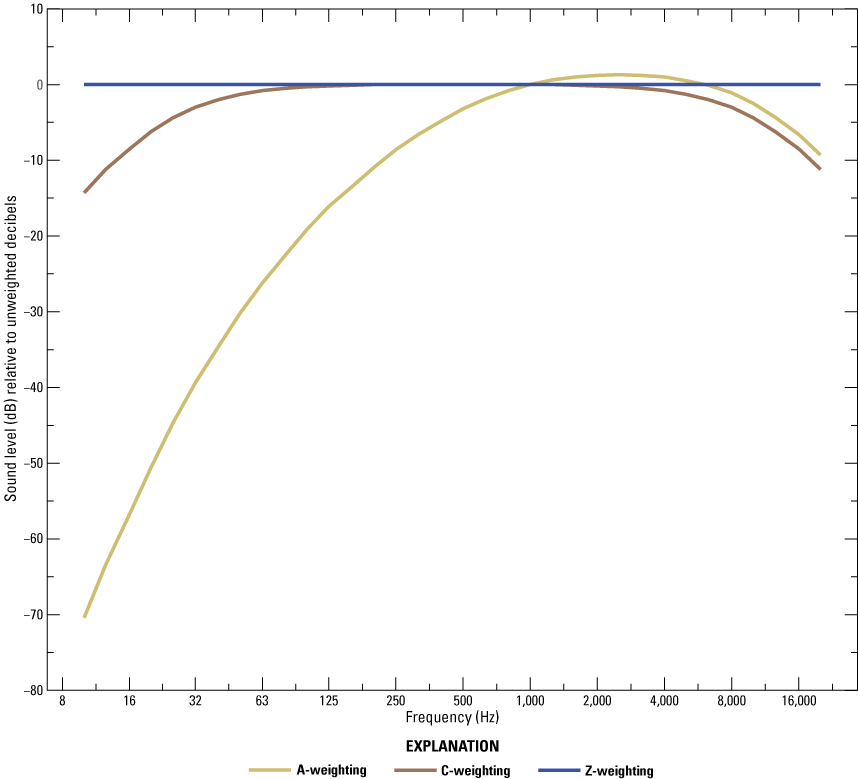
Difference between weighted and unweighted metrics for sound level (decibel [dB]) across frequencies 10–20,000 hertz (Hz). A-weighted decibels represent perceived loudness of a sound to human hearing. C-weighted decibels favor lower frequencies and are often used to represent sound from industrial sources. Z-weighted decibels are equivalent to unweighted decibels from 10 to 20,000 Hz. Data for this figure are from “American National Standards Institute/Acoustical Society of America S1.4-2014/Part 1/International Electrotechnical Commission 61672-1:2013” (Acoustical Society of America, 2014).
1.1.2. Sound Frequency
Frequency is a second important characteristic of sound and represents the wavelength of sound. The unit of measure for sound frequency is hertz (Hz), and changes in frequency are heard as changes in the pitch of a sound. A pure tone is a sound that occurs at a single frequency (Acoustical Society of America, 2013). Other sounds occur at multiple frequencies, ranging from a small set of harmonic frequencies, such as in a note from a musical instrument, to a broad range of frequencies (also known as “broadband”), such as in the noises produced by equipment used during oil and gas development (see section “1.2.3. Noise During the Phases of Oil and Gas Development”).
The distance sound travels and decays in different media varies by frequency. Lower frequency sounds attenuate less through the atmosphere and travel farther than higher frequency sounds (Naguib and Wiley, 2001; Pater and others, 2009). Hearing capabilities for frequency differ among species and among individuals within a species (app. 2). Most terrestrial mammals have hearing that is most sensitive in a middle range of frequencies and becomes progressively less sensitive at lower and higher frequencies (Heffner and others, 2001). For example, human hearing generally ranges from 20 to 20,000 Hz, but humans can hear sounds at the extreme ends of this range only at high sound levels (for example, greater than approximately 70 dB at 18,000 Hz), whereas they can hear sounds between 2,000 and 4,000 Hz at very low sound levels (less than approximately -6 dB; Jackson and others, 1999).
1.2. Characteristics of Noise from Oil and Gas Development
Sections 1.2 and 1.3 Highlights
• Noise during oil and gas development can range from short duration, such as a seismic blast or passing truck, to chronic, such as a compressor station.
• Environmental factors such as vegetation, snow, wind, temperature, humidity, and topography affect the distance noise can travel.
• Characteristics of noise vary across phases of oil and gas development, including exploration, construction, drilling and completion, production, and surface reclamation.
• Noise sources include helicopters, trucks, human activity, cannons, compressors, generators, drills, and other machinery, which cause low-frequency noise that can travel long distances.
• The primary method for estimating noise from a proposed action and alternatives is inference from data collected around analogous past oil and gas development based on field measurements or published data.
1.2.1. Temporal Factors That Affect Noise from Oil and Gas Development
Noise can be characterized by the onset, consistency, and regularity of the noise source. The onset of noise can be rapid and startling (for example, a gunshot) or gradual (for example, a car passing; Francis and Barber, 2013; Gill and others, 2015). Noise consistency can vary with the phase of oil and gas operations. Chronic noises are typically generated during the production phase and include compressors and pumpjacks, which can run 24 hours per day (Francis and others, 2009). Chronic high-amplitude infrastructure, such as compressor stations, can generate considerable noise and be the dominant noise source at a site. In an active oil and gas field in northern Alberta, chronic noise contributed to overall noise levels more than other noise sources such as traffic (Sánchez and others, 2022).
The temporal characteristics of noise can vary on short and long time scales. For example, intermittent noise can occur throughout development because of human presence, traffic, and machinery from exploration through surface reclamation (see section “1.2.3. Noise During the Phases of Oil and Gas Development”). The overall noise footprint of oil and gas development can vary from year to year across the broad scale of oil and gas fields (in other words, the total geographic area above an oil or gas reservoir) as activity shifts geographically and sets of well pads move through phases of development and maintenance (Sawyer and others, 2017). This indicates that the soundscape in an oil and gas field can change through time with some areas undergoing increases in sound production, whereas other areas become quieter.
1.2.2. Spatial Factors That Affect Noise from Oil and Gas Development
Noise propagates through space away from a source. In an idealized scenario with no noise barriers or atmosphere, noise would propagate spherically away from the source and attenuate according to the inverse square law, which roughly equates to a reduction of 6 dBA for every doubling of distance past approximately 15 m (Attenborough, 2002). In the real world, sound attenuation is modified by characteristics of the environment that act as sound barriers or reflectors (Francis and Barber, 2013). For example, the spread of sound through space can be affected by topographical features (Keyel and others, 2018) and vegetation structure or abiotic factors such as humidity, wind, and temperature (Naguib and Wiley, 2001; Boycott and others, 2019). Evidence from several studies exemplifies sound attenuation based on environmental context:
-
• In forested areas, trees and ground litter generally increase the rate of sound attenuation (Naguib and Wiley, 2001; Attenborough, 2002). However, variation in forest vegetation structure and ground characteristics can cause variation in sound attenuation (Boycott and others, 2019). For example, in an oil and gas field in northern Alberta, regardless of levels of industrial development, mature boreal forest (40–100 years) had the lowest noise levels compared to young (0–40 years) and old (100-plus years) forest at sites arranged across the landscape (Sánchez and others, 2022).
-
• In open, dryland ecosystems such as grasslands and sagebrush (Artemisia spp.) ecosystems, sound attenuation is primarily affected by atmospheric variables such as wind, which can mask low-frequency sound (Boycott and others, 2019). In a grassland study, noise from pipeline construction was greater than 65 dBA at the source and attenuated to 49 dBA at 250 m but remained above background sound levels (30–40 dBA) as much as 500 m from the source (Sutter and others, 2016). In a sagebrush ecosystem, sound levels depended on distance to oil and gas activity, and landscape sound levels were not affected by human-caused noise at distances greater than 3,200 m from the source (Ambrose and others, 2021).
-
• In arctic habitats, frozen ground covered by a layer of snow can efficiently absorb sound, and wind can be loud enough that human-caused noises do not exceed the acoustic baseline (Blix and Lentfer, 1992). In a study that measured noise from oil and gas exploration activities near simulated Ursus maritimus (polar bear) dens in Alaska, noise exceeded background levels within 100 m of the sound source, but strong wind prevented exceedance of background sound levels farther away (Blix and Lentfer, 1992).
In addition to environmental factors that affect sound attenuation and propagation, the location and movement of sources can affect overall intensity of sound across space. For example, because of frequent traffic during construction and well development, loud noise can be generated at a well pad and along access roads (Hays and others, 2017). At the scale of an oil and gas field, activity can concentrate in portions of the field as sets of wells progress through the phases of development (Walker and others, 2020). Concentration or dispersion of individual noise sources can affect the total sound in an area, with spatial and temporal overlap of sounds sometimes causing aggregate effects (Francis and Barber, 2013; Gill and others, 2015; Sánchez and others, 2022). For example, when two broadband sound sources of equal sound level overlap, the total sound level is approximately 3 dB louder than either of the individual sound sources alone (Engineering ToolBox, 2003). Each additional sound source of equal sound level would add progressively less to the total sound level; 10 sound sources of equal sound level would be 10 dB louder than any of the individual sound sources alone (Engineering ToolBox, 2003). When a sound source is much louder than other noise sources, such as loud, chronic noise from a natural gas compressor station, noise from the other noise sources is minimally additive to the sound levels in the area, and the loudest noise source is dominant (Engineering ToolBox, 2003; Sánchez and others, 2022). With a difference of 6 dB or greater between the sound pressure levels of two sound sources, the total sound pressure level is less than 1 dB greater than the independent sound pressure level of the louder sound source (Engineering ToolBox, 2003).
1.2.3. Noise During the Phases of Oil and Gas Development
The phases of onshore oil and gas development consist of exploration, construction, drilling and completion, production, and surface reclamation. Each phase involves a broad set of noise sources ranging from human presence to industrial machinery.
Most studies that have sought to characterize noise from oil and gas development have focused on measuring aggregate sound occurring at a location during construction, drilling and completion, or production. Fewer studies have documented noise during oil and gas exploration and reclamation. Construction, drilling and completion, and production can last many years at a single well location. Each of these phases of development uses machinery and vehicles that produce high-amplitude noise across frequencies (Scobie and others, 2016; Radtke and others, 2017). This section synthesizes in detail information from studies that have measured sound pressure and frequency near oil and gas wells. Table 3 provides a detailed list of sound pressure levels observed during past studies.
Table 3.
Observed sound levels, type of sound source, and distance from sound source for noise emitted during different phases of oil and gas development.[A selection of sound sources is presented based on information available in the literature and is not inclusive of all sound sources and all types of oil and gas development. Sound levels are presented as they were measured and weighted in the original study. Reported sound levels consist of both single locations and averages across several locations, and we refer the reader to the original study for further information about the site-specific and landscape context in which these sound pressure levels were observed, including vegetation or other incidental or intentional barriers to sound propagation. See sections “1.3. Guidance for Estimating Potential Noise from Proposed Oil and Gas Development” and “2. Characterizing the Acoustic Environment” for information about measuring and estimating sound pressure levels. Additional noise data summarized from unpublished reports are available in Hays and others (2017). m, meter; dBA, A-weighted decibel; min, minute; Leq, equivalent sound level; dBC, C-weighted decibel; mo, month; L50, median sound pressure level; dBZ, Z-weighted decibel; Lx, exceedance percentile; dBF, flat frequency response; avg., average; SEL, sound exposure level]
Exploration
Exploration involves several stages of geophysical study to identify probable locations for oil and gas deposits, followed by seismic survey and drilling of exploration wells. During the exploration phase, noise is typically intermittent and may be produced by helicopters, truck traffic, and detonation machinery, such as cannons or air guns, which are used for seismic testing (Brittingham and others, 2014). Noise from seismic vibrators is loudest at low frequencies, typically below 105 Hz (Bagaini and others, 2014). In a simulation of seismic testing noise, Bradshaw and others (1997) used a propane cannon to produce noise at amplitudes ranging from 90 to 110 dB at 2 m from the cannon mouth.
Construction, Drilling, and Completion
The construction, drilling, and completion phase covers a wide variety of activities that include common intermediate steps associated with drilling and completion such as hydraulic fracturing and well testing, which can involve flaring. Well pad and pipeline construction may last months to years and involve heavy machinery, road construction, and increased traffic. During drilling, a drill rig and drilling machinery can produce noise while creating the borehole.
Hydraulic fracturing is a commonly used postdrilling technique to fracture low-permeability formations at the bottom of a borehole to obtain oil and gas contained in the rock (Tiemann and Vann, 2015). Hydraulic fracturing is typically louder than the drilling process because horizontal drilling can last longer than traditional vertical drilling and the fracturing of the rock itself can generate loud noises (Hays and others, 2017; Radtke and others, 2017). In addition, hydraulic fracturing requires higher volumes of truck traffic than other phases because of the continuous need for materials used during the fracturing process. Allshouse and others (2019) observed approximately nine semitrailer trucks per hour, 24 hours per day during hydraulic fracturing activities, with an additional eight pickup trucks per hour during the daytime.
Flaring is a noise-producing process step that occurs in some locations during well testing after hydraulic fracturing and can last days to weeks. Flaring can also occur during maintenance and to prevent hazards from overpressurized equipment (Cushing and others, 2020). Noise levels from flaring depend on the volume of gas burning per unit of time, with higher rates of flaring resulting in higher noise levels (Dowling and Mahmoudi, 2015).
Well completion can involve various techniques of preparing the borehole for production, such as inserting production tubing, casing, and any necessary downhole tools. Flowback is a part of well completion during which the hydraulic fracturing fluids mixed with oil and gas flow out at high rates prior to production. Traffic volume can also be high during flowback activities (Massachusetts Institute of Technology, 2011); Allshouse and others (2019) observed 13.5 pickup trucks per hour during the daytime during flowback.
Like other stages of oil and gas development, most of the sound produced during construction, drilling, hydraulic fracturing, and well completion is high amplitude and broadband and is loudest at lower frequencies. During oil pipeline construction in Canada, noise was broadband, ranging from 6.3 to 20,000 Hz, and remained higher than background sound levels as much as 1 kilometer (km) from the pipeline (Sutter and others, 2016). In a study in Colorado, continuous noise from construction and drilling at sites with 9.8-m sound barrier walls led to an increase of 8.7–17.4 dBA over background sound levels, measured 320–550 m from the source (Blair and others, 2018). Noise varied throughout the day, increasing in the morning, decreasing midday, and increasing again in the afternoon (Blair and others, 2018). In another study in Colorado, the dominant frequency during drilling was 63 Hz, whereas the dominant frequency during hydraulic fracturing and completion was 125 Hz (Radtke and others, 2017). Importantly, sound pressure levels can vary depending on the types of machinery used during each phase and the landscape around the well site. For example, whereas Radtke and others (2017) documented that completion was slightly quieter on average than drilling and hydraulic fracturing, a different study in Colorado indicated that flowback during completion produced higher sound pressure levels than drilling, hydraulic fracturing, and production (table 3; Allshouse and others, 2019). These differences indicate the importance of considering site- and action-specific factors when estimating noise from a proposed action and alternatives (see section “1.3. Guidance for Estimating Potential Noise from Proposed Oil and Gas Development”).
Production
During production, noise may be produced from compressors, generators, engines, pumpjacks, screw pumps, and other large equipment that operate continuously for long periods of time. The types of production equipment present in a field may vary based on the type of well and the amount of processing that occurs in that field. For example, fields that include gas production may more often have noisy equipment associated with initial gas processing and transportation, such as compressor stations. Compressors and generator-powered well pumps (for example, pumpjacks and screw pumps) continuously produce sound at high amplitudes across frequencies, with the highest sound pressure at low frequencies (fig. 3; Koper and others, 2016; Warrington and others, 2018). Grid-powered pumpjacks and screw pumps are generally quieter than generator-powered wells (table 3; Koper and others, 2016). In a Colorado study, sound pressure level observations at production sites were at least 15 dBA lower than at drilling, hydraulic fracturing, and completion sites (table 3), and dominant frequencies were very low, ranging from 16 to 31.5 Hz (Radtke and others, 2017).
Traffic during the production phase is typically lower than during construction, drilling, and completion because traffic is limited to intermittent machinery maintenance (Zammerilli and others, 2014). Allshouse and others (2019) observed an average of one semitrailer truck and one pickup truck per hour during the daytime during production at a well in Colorado.
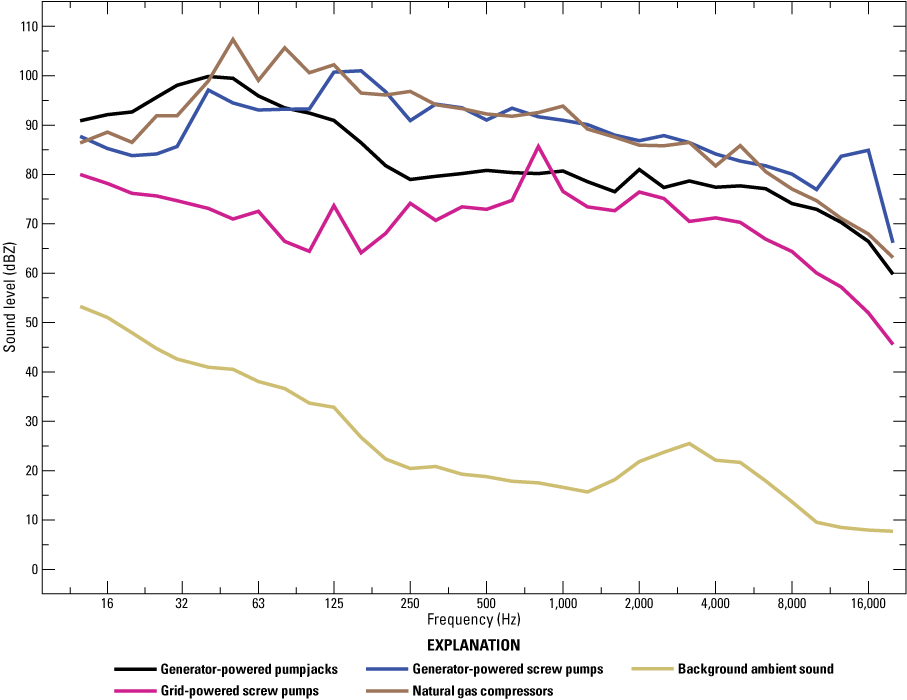
Average unweighted sound pressure levels (Z-weighted decibels [dBZ]) at frequencies of 12.5 to 20,000 hertz (Hz) for generator-powered pumpjacks (sample size equals [n=] 4), generator-powered screw pumps (n=5), grid-powered screw pumps (n=5), natural gas compressor stations (n=4), and background sound levels in an oil and gas field in mixed-grass prairie in southern Alberta (derived from Warrington and others (2018), used with permission of Oxford University Press). All measurements for infrastructure were taken less than 10 meters from the sound source. Background sound was recorded at control sites without infrastructure and at inactive infrastructure sites (n=41). Measurements were taken in each 1/3-octave frequency band and averaged across sites. Please note that this figure represents sound levels from production equipment in a particular study system; sound levels can vary by type of equipment, type of well, and environmental context, among other variables.
Reclamation
Surface reclamation is a set of activities intended to initiate ecosystem processes that will eventually return a site to its predisturbance ecosystem function. Reclamation generally involves recontouring and revegetating roads and well pads, which can entail a variety of noise-producing activities, including use of heavy machinery to move soil and prepare it for planting. Interim reclamation can begin as soon as well completion is finalized, meaning noise from interim reclamation can be concurrent with noise from production. Final reclamation occurs after production has closed and the well is abandoned (U.S. Department of the Interior and U.S. Department of Agriculture, 2007). We did not find literature measuring noise specific to reclamation activities; however, Sutter and others (2016) reported lumped measurements from construction and reclamation activities at an oil pipeline in Canada (table 3).
Traffic Noise (All Phases)
Traffic noise occurs throughout each phase of oil and gas development with variation in traffic volume and vehicle type depending on the phase of development (Radtke and others, 2017; Allshouse and others, 2019). Traffic noise along a specific road can be highly varied, depending on the type of vehicle, road gradient, road surface, vehicle speed, and traffic volume (Byrnes and others, 2012). For example, paved roads may generally have higher vehicle speeds and greater traffic volume than unpaved roads, though these factors can be location and situation specific. Chen and Koprowski (2015) measured how vehicle speed affects noise levels, finding that driving at 24 kilometers per hour (km/h) resulted in 1 dBA lower Leq and 1.5 dBA lower Lmax than driving at 40 km/h. Throughout the lifetime of one well, heavy-duty trucks may take more than 1,100 trips, with most traffic occurring during construction, drilling, and completion and decreasing during production, with infrequent traffic for maintenance of the well (Zammerilli and others, 2014). Traffic unrelated to oil and gas activity can also be common, presenting potential cumulative noise effects when combined with the oil and gas traffic (Scobie and others, 2016).
1.3. Guidance for Estimating Potential Noise from Proposed Oil and Gas Development
Noise from proposed oil and gas development can be estimated based on published data from past similar actions or gathered in the field from ongoing similar actions. Because of the variability of atmospheric, vegetation, and topographic characteristics across study systems, published data can provide a wide range of sound level estimates (for example, see table 3). Therefore, measurement of noise levels near other oil and gas development in the project or planning area typically is a more accurate method for estimating noise levels from a proposed action and alternatives. The National Park Service (NPS; NPS, 2013a) provided a step-by-step technical guide for acoustic field monitoring. Blickley and Patricelli (2013) also provided technical recommendations for accurate sound measurements in the field. Types of equipment, timing and location of measurements, and the presence of unexpected, nontarget sounds are all important technical considerations when gathering field data (Blickley and Patricelli, 2013; NPS, 2013a). Blickley and Patricelli (2013) recommended specialized technical training for all staff collecting field sound measurements. A sound level meter is the most common equipment used for measuring sound in the field. Recommendations for calibrating and positioning sound level meters, excluding interference, and selecting timeframes for measurement are available in Blickley and Patricelli (2013), NPS (2013a), Patricelli and others (2013), and Ambrose and Florian (2014). In general, selection of location and timing of measurements can be informed by the location of habitat, physical characteristics, and life history traits of the potentially affected animal species (Blickley and Patricelli, 2013). Location and timing of measurements can also vary by management goal, type of noise, or type of anticipated effects, such as flushing in response to acute noise versus increased stress in a chronically noisy location (Blickley and Patricelli, 2013).
In the absence of field data, published data can inform characterization of noise expected from a proposed action and alternatives. Published data appear in gray literature and peer-reviewed studies (for example, table 3). In addition, traffic data in existing oil and gas fields can be gathered from State and national public traffic databases or from existing publications (for example, Zammerilli and others, 2014; Allshouse and others, 2019).
2. Characterizing the Acoustic Environment
Section 2 Highlights
• Researchers recommend considering field data and previously published data when characterizing the acoustic environment.
• Common sound measurement techniques can help to identify the relative contributions of natural and human-caused sounds to the acoustic environment.
• Several previously published resources provide information about background sound levels in undeveloped lands in the United States.
The acoustic environment consists of all the sounds that can be heard at a location. The acoustic environment varies across a landscape and through time. Characteristics of the acoustic environment can provide a reference condition for measuring potential noise effects of a proposed action and alternatives. Data about the acoustic environment can be gathered in the field at the site of a proposed project or extrapolated from publicly available datasets or other published information. Blickley and Patricelli (2013) recommended considering previously published data in addition to new field data, when possible, because of the difficulty of measuring sound levels in very quiet environments and identifying natural sound levels in areas already heavily affected by human-caused noise. Equipment, temporal and spatial factors, and unexpected sounds are all important considerations when gathering field data to describe the acoustic environment (Blickley and Patricelli, 2013; NPS, 2013a). Use of sensitive sound measurement equipment is especially important when measuring background sound levels; many sound level meters (those with a rating of class 2 [Acoustical Society of America, 2014]) cannot measure sound levels quieter than 35 dBA, which exceeds background sound levels in most undeveloped landscapes (Blickley and Patricelli, 2013). Mismeasurement of background sound levels can result in underestimation of the spatial extent of the audibility of a noise source, with implications for effects analysis (see section “3. Methods for Predicting Noise Occurrence on the Landscape”) and noise management methods such as exceedance thresholds (see section “5. Mitigating the Effects of Noise from Oil and Gas Development on Ungulates and Small Mammals”). Section “1.3. Guidance for Estimating Potential Noise from Proposed Oil and Gas Development” contains an additional description of resources containing guidelines for gathering acoustic data.
In many landscapes, natural (for example, wind, bird songs, and rivers) and human-caused sound sources contribute to the acoustic environment. Common sound measurement techniques can be used to identify the relative contributions of different types of sounds to the acoustic environment, facilitating analysis of the potential cumulative effects of a proposed action and its alternatives (in other words, the effects of each alternative considered in combination with the effects of existing human-caused noise sources). A standard metric for characterizing the contributions of natural sounds to the acoustic environment is L90, which is the sound pressure level that is exceeded 90 percent of the time (Ambrose and Florian, 2014). L90 represents consistent, low-amplitude sounds and does not capture infrequent, short-duration noises such as occasional vehicles passing on low-traffic roads, making L90 useful for characterizing background sound levels in undeveloped areas (Ambrose and Florian, 2014). To characterize the total acoustic environment, including existing human-caused sounds, Ambrose and others (2021) recommend using L50 or Leq, which capture the median and logarithmic average of sound measurements.
Previously published data and models about background sound levels can provide a reference point to supplement local field data, which can be useful because of the difficulty of accurately measuring background sound levels (Blickley and Patricelli, 2013). Modeled background sound levels for the United States are available from the NPS (NPS, 2015). The model uses field-collected ambient sound data from NPS units from 2000 to 2011 to estimate the contributions of human-caused sound to background sound levels nationwide at a 270-m resolution (Mennitt and others, 2014). In addition to this model, observational data from past studies can be used to infer background sound levels in particular landscapes. Most published observations for largely undisturbed environments report background sound levels less than 30 dBA. For example, Lynch and others (2011) measured median L90 across 43 national parks in the United States at 21.8 dBA. In desert areas in southern California that were usually undisturbed by human-caused noises, 44 percent of daily sound measurements were between 20.5 and 25 dBA (Brattstrom and Bondello, 1983). Patricelli and others (2013) recommended using 16–20 dBA as the background acoustic environment for undeveloped sagebrush ecosystems. However, correcting for sound level meter self noise, Ambrose and others (2021) measured nighttime sagebrush sites as somewhat quieter, with an average Leq of 24 dBA, L50 of 11 dBA, and L90 of 8 dBA. Across the full 24 hours of measurements, they reported an average Leq of 26 dBA, L50 of 19 dBA, and L90 of 14 dBA (Ambrose and others, 2021).
3. Methods for Predicting Noise Occurrence on the Landscape
Section 3 Highlights
• Sound propagation modeling is a method for estimating where sound from a proposed action will occur on the landscape.
• Sound propagation models depend on three basic types of data: (1) how loud the noise source is, (2) how loud the acoustic environment is, and (3) environmental variables that impede the spread of sound.
• One simple option for estimating how far away a noise source could be heard is to consider only spherical sound spread, which can give a rough estimate of the maximum distance a noise will travel. This option is less complex and time intensive but also less precise.
• A second option would be to use a geospatial sound modeling tool. This option is more precise but also more complex and time intensive.
• The results of sound propagation modeling can be superimposed on wildlife habitat or occurrence data to predict the area in which individuals and populations may experience effects from noise.
3.1. Overview of Sound Propagation Modeling and Data Needs
An estimate of where and when noise will occur in a species’ habitat can provide the basis for an assessment of the effects of that noise on that species. A key method for estimating the locations in which noise from a proposed oil and gas development action will be audible is sound propagation modeling. Fundamentally, a sound propagation model shows how far a noise will travel based on the sound level at the noise source and environmental barriers that impede the spread of the noise. Spread and impedance are based on standardized equations for calculating the movement of sound waves (International Organization for Standardization, 1996). In addition, a sound propagation model accounts for the background acoustic environment because a noise is only audible when it is louder than ambient sound levels. Thus, a sound propagation model relies on three basic types of data:
-
• How loud the noise source is (refer to sections “1.2. Characteristics of Noise from Oil and Gas Development” and “1.3. Guidance for Estimating Potential Noise from Proposed Oil and Gas Development” for information about gathering or estimating this data). An estimate of the sound level at the noise source will likely vary through time (see section 1.2.1. “Temporal Factors That Affect Noise from Oil and Gas Development”), and the estimate should be based on relevant periods for the species (for example, maximum potential sound level during the calving season).
-
• How loud the acoustic environment is (refer to section “2. Characterizing the Acoustic Environment” for information about gathering or estimating this data). Noise levels must be compared to background sound levels to determine where the noise will be audible.
-
• Environmental variables including temperature, humidity, wind, elevation, topography, vegetation and ground cover, soil moisture, open water, and any other barriers (for example, a building or wall) that affect the spread of sound (see section “3.2. Options for Estimating Sound Propagation”). Because environmental factors generally impede the spread of sound, models that incorporate more variables typically output a smaller estimated noise footprint (fig. 4).
The output of a sound propagation model is an estimate of the spatial extent in which a noise can be heard at various sound levels, also known as sound level contours. The estimated spatial extent can be superimposed on habitat and species distribution data to quantify amounts of habitat and numbers of individuals potentially affected, and to identify locations that may exceed thresholds for effects, if known (see Ambrose and others [2021], for an example of an effect threshold). Information about the amount of habitat or number of animals affected by noise can help infer effects on indicators for fitness, such as physiology, behavior, or abundance, based on past studies described in the literature (refer to section “4. Potential Effects of Noise from Oil and Gas Development on Ungulates and Small Mammals”).
3.2. Options for Estimating Sound Propagation
We outline two options for estimating sound spread in sections “3.2.1. Option 1—Estimate Sound Propagation with Basic Equations for Spherical Spread of Sound” and “3.2.2. Option 2—Geospatial Sound Propagation Modeling Tools,” which differ by complexity and precision. Although complex models for noise propagation can yield more precise results by incorporating environmental variables that impede sound spread (fig. 4), simpler approaches are often more practical. The first option provides a method to roughly estimate maximum sound level contours around a stationary point noise source. This method relies on an accurate estimate of sound levels at a reference distance close to the noise source. The first option does not incorporate environmental factors and is based on general physical principles for the way sound waves attenuate spherically from a stationary point source with distance. This option is easily calculated but does not offer precise outputs and should be used with caution.
The second option consists of using geospatial modeling tools that incorporate atmospheric, topographic, and land cover factors to provide precise estimates of sound spread. This option requires more skills and time to prepare data and learn and run the models using geographic information systems (GIS) software.
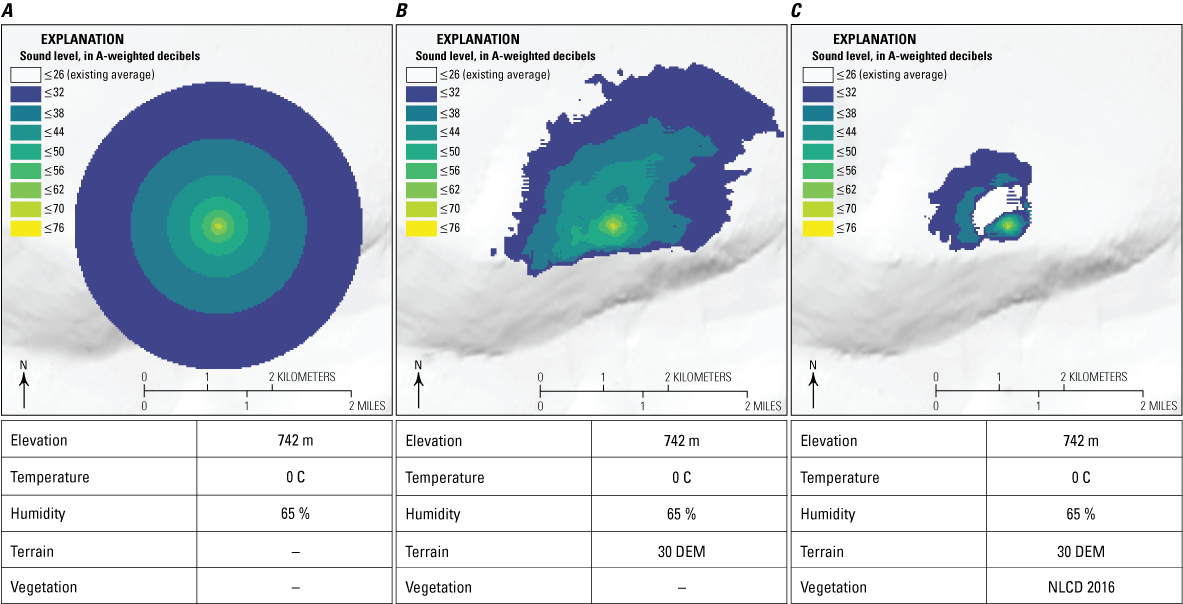
Differences in the outputs of the Noise Model Simulation (NMSim) sound propagation model (Ikelheimer and Plotkin, 2005) for a hypothetical illustrative scenario. Each panel shows a model output that includes progressively more impedance variables. A, model includes impedance from atmospheric variables and does not include impedance from terrain (digital elevation model [DEM], available at https://www.usgs.gov/programs/national-geospatial-program/national-map) and land cover (National Land Cover Database [NLCD], available at https://www.mrlc.gov/); B, model includes impedance from atmospheric variables and terrain and does not include impedance from land cover; C, model includes impedance from atmospheric variables, terrain, and land cover. The noise source is a hypothetical stationary, heavy truck that produces sound at 71 A-weighted decibels (dBA) measured 15 meters (m) from the truck. The color gradients in each panel indicate the area in which noise is perceived at various sound levels. Note that a downhill gradient causes sound to travel somewhat farther to the northeast in panel B than on flat terrain in panel A, and an uphill gradient impedes sound travel to the south. Inclusion of land cover in panel C substantially reduces the distance sound travels in all directions. We produced all images using the NMSim model within the Sound Mapping Tools package (Keyel and others, 2017) in ArcGIS Pro (Esri) and RStudio (Posit). ≤, less than or equal to; m, meter; C, degrees Celsius; %, percent.
3.2.1. Option 1—Estimate Sound Propagation with Basic Equations for Spherical Spread of Sound
Sound waves attenuate spherically from a stationary point source according to standard physical principles (International Organization for Standardization, 1996). Without atmosphere, wind, terrain, or land cover, sound pressure level decreases approximately 6 dB for every doubling of the distance that a sound wave travels. Table 4 provides example calculations of sound level values for propagation of a noises that are 75, 80, and 90 dB, measured 15 m from the source.
Table 4.
Example calculation of spherical sound propagation without atmospheric, terrain, or land cover attenuation at three initial sound levels measured at a reference distance of 15 meters (m) from the source.[Sound levels decrease 6 decibels (dB) for every doubling of distance from the source]
Under these hypothetical conditions, where environmental factors do not hinder the spread of sound, this basic calculation can be used to intentionally overestimate noise propagation. In other words, it can provide rough estimates of the maximum circular sound level contours around a stationary noise source. However, a critical caveat is that this method overestimates sound levels only when used to calculate sound propagation farther than the reference distance, because it ignores environmental factors that impede the spread of sound. When calculating out from an estimated reference distance of 15 m, for example, all calculations farther than 20 m would be overestimates if there were a tall wall 20 m from the noise source. Conversely, using this method to estimate sound levels closer to a noise source than the reference distance would result in underestimates of sound levels. For example, if an estimate of 60 dB at a reference distance 100 m from the noise source were used to calculate 66 dB at 50 m, this would underestimate sound level at 50 m if there were a sound barrier 75 m from the noise source.
In addition, this method should be used with caution, because it is sensitive to slight changes in estimates at short distances from the noise source. For example, an estimate of 80 dB at 20 m yields a calculation of 56 dB at 360 m, while an estimate of 80 dB at 15 m yields 56 dB at 240 m, resulting in a much smaller estimate of the area experiencing sound levels greater than 56 dB. Weighted sound level measures such as dBA may be less suitable for this method, because they apply different filters across frequency bands (see section “1.1.1. Sound Level”).
An expanded version of this method for manually calculating sound propagation using basic physical equations is available in Harrison and others (1980). In addition to spherical spread, Harrison and others (1980) provide data that facilitate calculating impedance factors, including atmosphere, vegetation and ground cover, wind, and barriers.
3.2.2. Option 2—Geospatial Sound Propagation Modeling Tools
Many sound propagation modeling tools have been developed for different types of noise sources in various environmental contexts. The Noise Model Simulation (NMSim) noise propagation model (Ikelheimer and Plotkin, 2005; Betchkal and Balantic, 2023) is commonly used in public lands contexts (Keyel and others, 2017). The NPS has used NMSim in environmental effects analyses for oversnow vehicles (NPS, 2013b) and air travel (NPS, 2011). SPreAD-GIS (link to software is available in Keyel and others, 2017) is another noise propagation model developed for managing noise on public lands (Harrison and others, 1980; Reed and others, 2012; Keyel and others, 2017). The NMSim and SPreAD-GIS model atmospheric absorption and general spherical spread of sound using identical methods. However, they differ in their calculation of how land cover, topography, and wind affect sound spread (Keyel and others, 2017). SPreAD-GIS is limited to modeling frequencies 125–2,000 Hz, whereas NMSim is not frequency-range limited (Keyel and Reed, 2017).
Although not specific to public lands contexts, many other sound modeling tools are available. For example, governments around the world use standard models for predicting noise emissions from highways (Federal Highway Administration, 2021; Khan and others, 2021). Each sound modeling tool has different limitations depending on its intended application, which is often specific to noise source and environmental context. In addition, tools that are not regularly maintained (for example, annually or biennially) may lose function on newer versions of the underlying software (for example, Esri ArcGIS).
Specific software needs, data needs, and user guides are typically available in the documentation for each modeling tool. The three general types of environmental data used by these sound propagation models are atmospheric, topographic, and land cover. Average atmospheric data for a location, including temperature, humidity, and elevation, are generally easily obtainable (see, for example, the National Centers for Environmental Information, available at https://www.ncei.noaa.gov/). In comparison, although topographic and land cover data are also generally easily obtainable (see, for example, The National Map, available at https://www.usgs.gov/programs/national-geospatial-program/national-map, for elevation data and the Multi-Resolution Land Characteristics Consortium, available at https://www.mrlc.gov/, for land cover data), they are geospatial data for which processing for sound propagation modeling is somewhat complex and requires experience using GIS software.
4. Potential Effects of Noise from Oil and Gas Development on Ungulates and Small Mammals
This section provides information relevant to the potential effects of noise from oil and gas development on ungulates and small mammals, specifically rodents and leporids. Information in this section may facilitate issue identification and dismissal during scoping and analysis of the environmental consequences of a proposed action and alternatives for a NEPA analysis.
4.1. How and Why Noise Affects Wildlife
Across taxonomic groups, existing research shows many effects of human-caused noise on wildlife (Shannon, McKenna, and others, 2016; Kunc and Schmidt, 2019). Animals’ responses to noise often vary based on characteristics of the noise (Francis and Barber, 2013). Acute noise can startle animals, causing a self-preservation response such as flight. Chronic noise can mask acoustic cues necessary for communication, predator detection, or spatial awareness (Barber and others, 2010). Individuals that remain in noisy habitats can experience difficulties with auditory communication and environmental awareness that may increase visual vigilance behaviors at the cost of foraging (Frid and Dill, 2002; Bednarz, 2020). Noise at varying frequencies and durations can also distract animals from other sensory inputs, such as visual or tactile signals (Chan and others, 2010; Francis and Barber, 2013). Human-caused noise can also interfere with predator-prey dynamics, resulting in decreased hunting success for predators (Mason and others, 2016) or increased visual vigilance for prey species reliant on audible cues (Quinn and others, 2006).
Responses to noise vary across and within species (Blickley and Patricelli, 2010). Variation among species is often based on species’ reliance on acoustic cues for functions such as predator avoidance, spatial orientation, mating, and other communication (Francis and Barber, 2013). Species can also be differentially sensitive to noise based on the daily timing of periods of activity (Francis and Barber, 2013). Behavioral responses, such as choosing to leave an area or hide, may depend on species body size and accessibility of refuges (Kleist and others, 2021). Individuals of the same species may also experience different effects of noise depending on traits such as body size, nutritional state, life stage, sex, and prior exposure to noise (Kleist and others, 2018; Harding and others, 2019).
4.2. The Effects of Noise on Ungulates
Section 4.2 Highlights
• Many types of ungulates are reliant on a combination of senses for predator detection, and noise can cause a need to increase visual vigilance at the expense of foraging.
• Noisy areas in oil and gas fields have been shown to reduce mule deer habitat use compared to quiet areas.
• Caribou and white-tailed deer have been shown to increase movement and avoid areas where simulated noise from oil and gas development is present.
• Noise from vehicle traffic has been shown to have varied effects on the behavior of deer, elk, and pronghorn.
• There is a need for research about the effects of nonmilitary aircraft on ungulates.
4.2.1. Why Noise Can Affect Ungulates
Ungulates are generally prey species, often reliant on a combination of visual, olfactory, and auditory cues to detect predators (Kleist and others, 2021; see app. 2 for a review of ungulate hearing capabilities). Noise can shrink an individual’s listening area, or the area in which individuals can perceive acoustic signals (Barber and others, 2010), intensifying the tradeoffs between visual vigilance and alternative behaviors such as foraging because of the need to rely on visual cues in loud environments (Lynch and others, 2015). In addition, because North American ungulates are large bodied with large home ranges, they generally respond to disturbance by avoiding an area (Rabanal and others, 2010; Kleist and others, 2021).
4.2.2. Studies About How Oil and Gas Development Can Affect Ungulates, With a Focus on the Effects of Noise
Several studies have documented the general (in other words, not noise specific) effects of minerals development on ungulate populations. Avoidance of oil and gas well sites, roads in oil fields, and surface mines has been shown for Rangifer tarandus (caribou; Dyer and others, 2001; Eftestøl and others, 2019), Odocoileus hemionus (mule deer; Sawyer and others, 2006; Northrup and others, 2015), Cervus elaphus (elk; Kuck and others, 1985), and Antilocapra americana (pronghorn; Sawyer and others, 2019), with observed negative effects on abundance (Sawyer and others, 2017) and migration (Sawyer and others, 2020; Chambers and others, 2022). Sawyer and others (2017) observed a greater than one-third decline in mule deer abundance through a 15-year period after initiation of oil and gas development, with no evidence of habituation, in open sagebrush habitats in western Wyoming. However, Northrup and others (2021) documented an increase in mule deer densities through a 5-year period of transition from the drilling to production phases in a wooded, topographically diverse oil and gas field in northwestern Colorado. Contrary to the avoidance behavior observed for other species, a study in boreal forest in an oil and gas field in northern Alberta indicated that Odocoileus virginianus (white-tailed deer) selected areas closer to well pads and roads, likely because of forage availability (Darlington and others, 2022). Overall behavioral responses and demographic outcomes for ungulates in oil and gas fields generally vary by study system (Northrup and others, 2021). These studies regarding general effects can contribute to an understanding of the potential cumulative effects of the many individual wells and roads that occur as part of oil and gas field development.
In addition to these general population and behavioral studies, a few studies have investigated the noise-specific effects of oil and gas development on North American ungulates (table 5; see app. 1 for additional detail). In the Piceance Basin in Colorado during the winter, mule deer vigilance in oil and gas fields had a quadratic relationship with sound pressure level; deer heightened vigilance when they moved into areas with moderate sound pressure levels but did not increase vigilance in the loudest and quietest areas (Lynch and others, 2015). A separate study on mule deer in Piceance Basin oil and gas fields during the spring, summer, and fall modeled effects from human-caused noise in relation to landscape factors including vegetation, topography, elevation, distance to infrastructure, and time since well pad drilling (Kleist and others, 2021). The study indicated that decreased human-caused noise at a site is a strong predictor of increased daily habitat use for mule deer, with the quietest sites having estimated daily detection rates that were 29 percent higher than the loudest sites (Kleist and others, 2021). Although this study’s goal was to isolate the effects of noise, its examination of the relation of noise to other potential disturbance types on the landscape may contribute to understanding the cumulative effects of noise with visual and physical changes and disturbances from oil and gas wells, roads, and other activities.
Table 5.
Effects of noise from oil and gas development on ungulates by type of effect and species.[Rangifer tarandus (caribou); Odocoileus virginianus (white-tailed deer); Odocoileus hemionus (mule deer); >, greater than; dBC, C-weighted decibel]
Some studies have also used simulated noise from oil and gas activities to test noise effects on ungulate species. For example, in a study in boreal forest in Quebec during the late summer and fall, white-tailed deer exposed to simulated drilling noise appeared to tolerate noise levels as much as 70 dBC and avoided areas with noise above this threshold (Drolet and others, 2016). The authors suggested that constant noise disturbance was likely associated with decreased habitat quality for white-tailed deer and led to reduced habitat use as much as 200 m from the noise source (Drolet and others, 2016). In another study in a boreal forest ecosystem in the winter, Bradshaw and others (1997) showed that simulated seismic exploration for mineral resources caused increased movement rates and habitat patch changes in Rangifer tarandus caribou (woodland caribou), indicating a potential energetic cost.
4.2.3. Studies About How Traffic Noise Can Affect Ungulates
Traffic noise from roads associated with oil and gas development can affect ungulate habitat occupancy. In the Piceance Basin, Kleist and others (2021) documented that loud areas near roadways were predicted to have the greatest reduction in mule deer daily habitat use probability. Traffic noise from other types of roadways has been shown to have varied effects on ungulate behavior. Buxton and others (2020) documented that white-tailed deer shifted activity away from roads during a summer motorcycle rally that caused median daily sound levels (L50) to increase by 20 dBA for 1 week. In another study, increased traffic levels and increased distance required to escape the traffic noise were associated with evidence of stress in Capreolus capreolus (roe deer; Iglesias-Merchan and others 2018). However, during a summer and early fall study in a busy national park, elk and pronghorn were slightly less responsive to other forms of disturbance with increasing noise levels, with only a weak association between noise and behavior (Brown and others, 2012).
4.2.4. Studies About How Aircraft Noise Can Affect Ungulates
Aircraft are associated with oil and gas development in some areas, such as the Arctic region of Alaska (Stinchcomb and others, 2019). Although no studies have isolated noise-specific effects of nonmilitary overflights, helicopter overflights during simulated oil pipeline construction in the Northwest Territories of Canada have been shown to frequently cause behavioral responses in caribou and Ovibos moschatus (muskox; Miller and Gunn, 1979). A recent study began to explore the potential for a relationship between aircraft activity and subsistence opportunities in Arctic Alaska by measuring the number of aircraft in several travel corridors during caribou harvest season, finding a median of 12 overflights per day near human development (Stinchcomb and others, 2020).
Though not directly related to oil and gas development, behavioral effects of noise from military aircraft overflights have been observed in other species including Ovis canadensis (bighorn sheep; Weisenberger and others, 1996; Krausman, Wallace, and others, 1998), Alces alces (moose; Andersen and others, 1996), and pronghorn (Krausman, Harris, and Ashbeck, 1998; Landon and others, 2003; Krausman and others, 2004). In addition, disturbance from helicopter overflights for recreational backcountry access has been shown for Oreamnos americanus (mountain goat) in Alaska (Goldstein and others, 2005; Côté and others, 2013).
4.2.5. Information Gaps Regarding the Effects of Noise from Oil and Gas Development on Ungulates
The literature about the effects of noise from oil and gas development on ungulates is limited primarily to studies on deer and caribou in boreal forests and deer in shrubland ecosystems. Studies about the effects of traffic and aircraft noise broaden the scope to other species that may commonly inhabit some oil and gas production areas, such as elk, moose, and pronghorn. Few studies have isolated the effects of noise from other types of disturbance or stressor, but the studies that have done so have documented that noise affected deer and caribou movement and distribution. Additional studies about noise effects on ungulates in active oil and gas fields, including the seasonality of those noise effects, could help to better understand contextual variables associated with the intensity of the effects. Finally, although several studies have assessed population-level effects of oil and gas development on ungulates, research on the direct effects of noise in oil and gas fields on biological indicators of individual animal health, such as stress-associated hormones, body mass, and reproductive outcomes, could be useful for more fully understanding effects of noise on ungulate populations.
4.3. The Effects of Noise on Rodents, Hares, and Rabbits
Section 4.3 Highlights
• North American rodents, hares, and rabbits include a diverse set of species with a wide variety of life histories and habitat requirements. Thus, rodents, hares, and rabbits have been shown to experience a wide variety of positive and negative effects from noise, indicating a need to study and understand effects at the level of individual ecosystems and species.
• Loud noise near oil and gas wells, such as from compressors, has been shown to have positive or neutral effects on rodent, hare, and rabbit abundance and habitat use, negative effects on rodent foraging efficiency, negative or neutral effects on rodent body condition, and neutral effects on rodent movement.
• Traffic noise has been shown to have a positive effect on foraging efficiency for nocturnal foraging rodents but also to cause increased vigilance and reduced habitat suitability for rodents reliant on intraspecific communication.
• For special-status species, such as Stephens’ kangaroo rats, Mount Graham red squirrels, or black-tailed prairie dogs, noise may present direct conservation concerns. For more common species, such as mice and chipmunks, the effects of noise might indicate shifts in predator-prey dynamics or other systemic changes, with potential broader implications for ecosystem conservation.
4.3.1. Why Noise Can Affect Rodents, Hares, and Rabbits
Studies about the effects of noise from oil and gas development and traffic on rodents and leporids cover a set of species with diverse habitat requirements and life histories. Thus, the literature shows a broad range of effects. Many small mammals communicate vocally (Mulligan and Nellis, 1975; Smith and others, 1977) or rely on vocalizations of other species (for example, birds) for risk detection (Magrath and others, 2015; Lilly and others, 2019). For species reliant on sound for risk detection, spatial awareness, and territory defense, human-caused noise could distract them or interfere with their ability to respond to biologically relevant sounds, such as those made by predators or territorial intruders (Chan and others, 2010). In contrast, noise could mask the sound of small mammal activity and vocalizations, providing protection from sound-reliant predators such as owls (Senzaki and others, 2016). In addition, some studies have documented potential physiological effects, such as decreased body condition (based on several metrics for body size; Willems and others, 2021), which can underlie changes to individual fitness (Kight and Swaddle, 2011).
4.3.2. Studies About How Noise from Oil and Gas Development Can Affect Rodents, Hares, and Rabbits
Several studies specific to oil and gas development have examined the effects of noise on abundance, habitat use, and behavior of mice, voles, hares, and rabbits (table 6; see app. 1 for additional detail). In an oil and gas field in New Mexico, Francis and others (2012) observed increased abundance of Peromyscus species (mice) in noisier locations and speculated that mice benefited from reduced predation risk from nocturnal predators reliant on acoustic cues or from reduced competition for food resources from birds sensitive to noise. However, other studies in the same system measured no effect of compressor noise on occupancy of Peromyscus truei (pinyon mouse) despite reduced body condition in noisy areas (Willems and others, 2021) and a decline in foraging efficiency for Peromyscus with increased sound levels (Willems and others, 2022). Similarly, in an oil and gas field in northwestern Colorado, leporid habitat use was not affected by average daily sound power levels (Kleist and others, 2021). Kleist and others (2021) speculated that the small home ranges and body sizes of leporids may reduce the distances they travel to refugia relative to larger mammals such as ungulates, which may decrease the likelihood leporids leave an area affected by an acute noise such as a passing truck. In a forested region in an oil field in northern Alberta, Shonfield and Bayne (2019) measured no difference in abundance, body mass, or movement of Peromyscus maniculatus (deer mouse) and Myodes gapperi (southern red-backed vole) at forest edges with or without roads or compressor stations. The authors suggested that the neutral effect may stem from masking of acoustic cues for these species and their potential predators or a lack of ability in these species to hear low frequencies produced by compressors and motor vehicles (Shonfield and Bayne, 2019).
Table 6.
Effects of noise from oil and gas development on rodents and leporids by type of effect and taxa or habitat community.Some studies have explored the potential for human-caused noise from oil and gas development to alter predator-prey dynamics for small mammals. Elevated noise levels from simulated compressor stations have been shown to impair prey detection and hunting success in Aegolius acadicus (northern saw-whet owl), which rely on acoustic cues to detect small mammalian prey (Mason and others, 2016). However, distributions of several other owl species (Aegolius funereus [boreal owl], Athene cunicularia [burrowing owl], Bubo virginianus [great horned owl], and Strix varia [barred owl]) were not affected by noise in oil and gas fields in forested and prairie regions of Alberta (Scobie and others, 2016; Shonfield and Bayne, 2017). Noise effects on predator foraging success could result in an indirect, positive effect on small mammal populations if they experience reduced predation pressure in noisier areas.
In addition to behavioral- and population-level effects, some studies have indicated potential physiological effects of noise from oil and gas development on small mammals. A field experiment in an oil and gas field documented that pinyon mice had lower body condition (based on several metrics for body size) in noisy areas than in quiet areas (Willems and others, 2021). The authors speculated that because low light conditions may have reduced the utility of visual vigilance, the decrease in body condition may have resulted from direct physiological effects from noise rather than tradeoffs between vigilance and foraging (Willems and others, 2021). Although no other studies about noise effects on small mammal physiology have occurred in oil and gas fields, studies in other systems corroborate the potential for physiological effects. Mus musculus (house mouse) captured in an area subject to airport noise showed increased adrenal gland size, an indicator of stress (Chesser and others, 1975). In addition, laboratory experiments have shown that chronic exposure to noise can affect stress indicators and circadian rhythm in wild rodents (Mancera and others, 2017; Issad and others, 2021).
4.3.3. Studies About How Traffic Noise Can Affect Rodents, Hares, and Rabbits
Many studies have used real or simulated traffic noise to investigate noise effects on small mammal behavior, abundance, and physiology (reviewed in Bednarz, 2020). Colonial species that use alarm calls, such as Cynomys species (prairie dogs) and other ground squirrels, tend to have behaviors indicative of tradeoffs between visual vigilance and foraging, typically increasing alert behavior and reducing foraging in the presence of noise (Rabin and others, 2006; Shannon and others, 2014; Buxton and others, 2020). In the presence of traffic noise, Cynomys ludovicianus (black-tailed prairie dog), a special-status species across much of its range, was also observed to spend less time aboveground and to increase movement (Shannon and others, 2014; Buxton and others, 2020). To test how noise affects predator evasion outcomes, Shannon, Crooks, and others (2016) simulated predation risk with an approaching human and showed that the presence of traffic noise accelerated black-tailed prairie dog flight response to humans.
Noncolonial species of rodents also respond to traffic noise. For Dipodomys stephensi (Stephens’ kangaroo rat), a listed threatened species per the Endangered Species Act, simulated traffic noise masked and mimicked footdrumming signals used for communication because the typical frequencies of traffic noise overlap those of footdrumming (Shier and others, 2012). The authors suggested that traffic noise could cause false alarm signals or missed detection of true alarm signals for Stephens’ kangaroo rats (Shier and others, 2012). Traffic noise has also been shown to change species distribution patterns. Vehicle noise from low-traffic forest roads was associated with reduced occupancy of Tamiasciurus hudsonicus grahamensis (Mount Graham red squirrel), a listed endangered species per the Endangered Species Act (Chen and Koprowski, 2015). To indicate predators and conspecific intruders, Mount Graham red squirrels use alarm calls that overlap the frequencies of traffic noise (Chen and Koprowski, 2015). Disruptions of rodent communication networks could ultimately have negative population effects because of reductions in area of suitable habitat (Chen and Koprowski, 2015; Le and others, 2019).
One study has examined the behavioral effects of traffic noise on solitary foraging rodents. In a rural area in the northeastern United States, traffic noise caused Tamias striatus (eastern chipmunk) and Peromyscus leucopus (white-footed mouse) to reduce vigilance and increase food intake in the presence of simulated predator noises, indicating that traffic noise may have caused a reduction in perceived predation risk in these rodents (Giordano and others, 2022). Similar to the effects of compressor noise, elevated noise levels from traffic have been shown to impair prey detection and hunting success in Asio species (owls) that rely on acoustic cues to detect small mammalian prey (Senzaki and others, 2016).
4.3.4. Information Gaps Regarding the Effects of Noise from Oil and Gas Development on Rodents, Hares, and Rabbits
Information about the effects of noise from oil and gas development on rodents and leporids is patchy and varied, indicating a potential need for further study. In particular, for species shown to have behavioral responses to general traffic noise, such as prairie dogs, more information about the effects of noise in areas subject to oil and gas development could be useful. Further study into the physiological effects of noise in wild populations could also be informative for understanding how oil and gas development may affect small mammal populations that do not flee chronically noisy areas. In addition, there is a need to explore the general effects of oil and gas development on rodents and leporids. For example, a small number of studies have explored the general effects of development in gas fields on Brachylagus idahoensis (pygmy rabbit) without isolating the relative effects of noise or other types of sensory disturbance, finding lower presence and abundance of pygmy rabbits with proximity to and density of gas development infrastructure (Germaine and others, 2017; Germaine and others, 2020). Such studies can contribute to understanding the cumulative effects of individual well and road development across a field. However, these findings are specific to the pygmy rabbit, which is a special-status species across its range. Additional work may be needed to understand noise-specific and general effects of oil and gas development on other types of small mammals.
5. Mitigating the Effects of Noise from Oil and Gas Development on Ungulates and Small Mammals
Section 5 Highlights
• Projects can be designed to help reduce noise emissions and reduce the effects of noise from oil and gas development on ungulates and small mammals.
• Types of management practices and project design features could include the following:
o siting wells to take advantage of natural topographic and vegetation sound barriers,
o concentrating wells spatially,
o building sound barriers at well pads,
o implementing seasonal or daily restrictions on oil and gas activity,
o reducing traffic volume and speed, and
o closing roads after completion of operations to prevent recreational use.
Projects can be designed to help reduce noise emissions and the effects of noise from oil and gas development on ungulates and small mammals. Practices primarily entail adjusting the timing or spatial configuration of development or adding supplementary structures to dampen sound travel. Because of differences in species’ habitats, life history traits, and noise sensitivity, use of multiple practices may be necessary to benefit a broader range of taxa (Blickley and Patricelli, 2010). Measures to reduce noise can be applied prior to, during, and after various phases of oil and gas development to address different noise sources in and around a well pad through time.
5.1. Well Pad Siting and Infrastructure Considerations
Ortega (2012) and Keyel and others (2018) recommended considering landscape- and habitat-specific features when planning the spatial configuration of well pads and infrastructure. These studies indicated that natural topographic and vegetation barriers may be useful for attenuating noise. Modeling sound propagation from hypothetical well locations, Keyel and others (2018) documented how use of sound propagation modeling can identify locations that optimize use of topographic barriers to block noise. Differences in terrain at alternative well locations as little as 1 km from one another reduced the area of noise propagation by as much as 65 percent for drilling noise and 35 percent for compressor station noise (Keyel and others, 2018).
Reducing the noise footprint may also be accomplished by concentrating disturbance and minimizing new road construction. Concentrating drilling operations at multiwell pads can increase the efficiency of onsite physical noise attenuation measures such as sound barriers (Bayne and others, 2008) but may increase noise levels and the intensity of effects in the immediate vicinity (Allshouse and others, 2019). Installing remote liquid-gathering systems, such as pipelines, reduces physical habitat disturbance, can reduce noise generated at a well pad, and can reduce the number of trucks needed to transport resources (Sawyer and others, 2009).
5.2. Sound Barriers
Sound reduction technology can take many forms, such as walls (fig. 5), blankets, or vegetation. Installing sound barrier walls around centralized compressor stations can decrease the distance noise travels (Bayne and others, 2008). For example, a study in a Pinus spp. (pinyon) – Juniperus spp. (juniper) landscape showed that noise-reducing walls around compressors reduced the size of the affected soundscape by 70 percent (Francis, Paritsis, and others, 2011). In Colorado, drilling sites with 9.8-m-tall noise walls had approximately 6-dBA-lower sound levels (average 59 dBA across three sites) than sites without barriers (average 65 dBA across four sites), measured 107 m from the source (Radtke and others, 2017). Similarly, noise blankets on generators during drilling at natural gas well sites reduced sound levels approximately 4 dBA, measured 152 m and 305 m from the source (Witter and others, 2013).
Noise barriers can be placed at sound-deflecting angles and use construction materials that absorb sound (Ekici and Bougdah, 2003). Ishizuka and Fujiwara (2004) documented that 3-m-high, soft T-shaped barriers had the same effectiveness as 10-m-high I-shaped barriers in blocking road traffic noise. Vegetation barriers or berms around noise-producing infrastructure or near roadways may also absorb some sound, particularly in forested areas where higher leaf and stem density increase sound absorption potential (Slabbekoorn and Ripmeester, 2008).
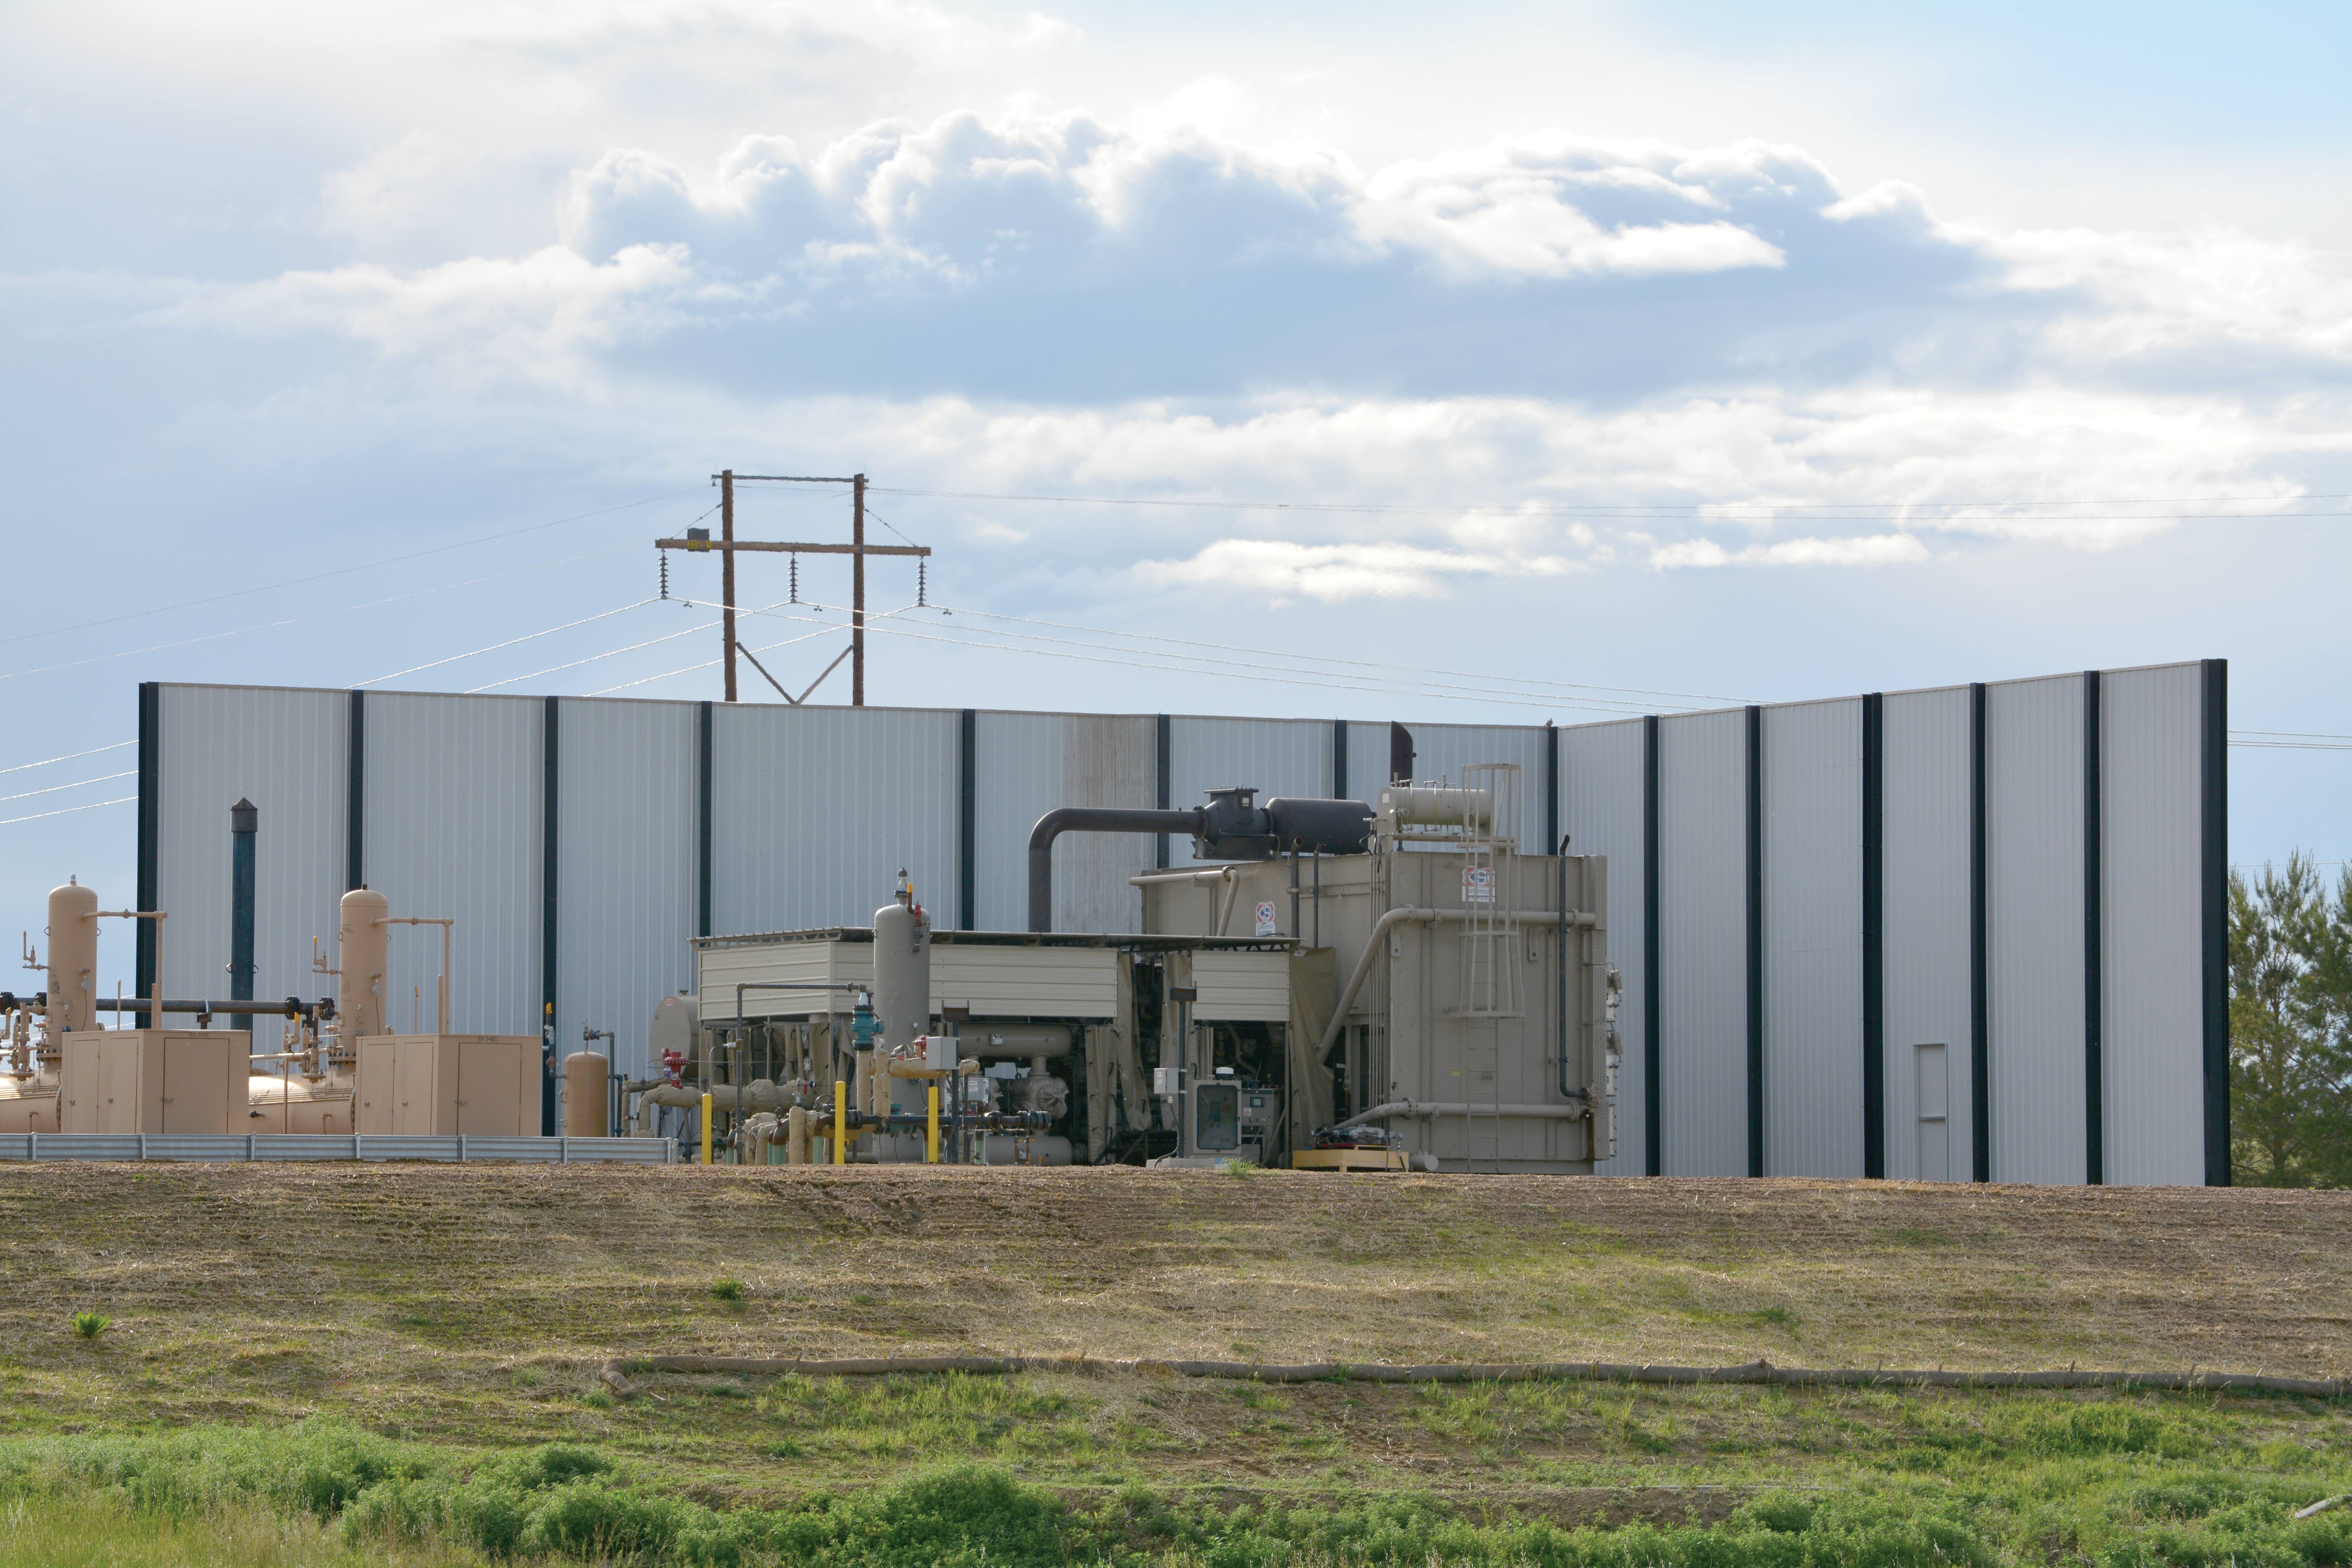
Sound-dampening walls around two sides of a natural gas compressor at an oil and gas well in the production phase in Colorado. The sound barrier is oriented to attenuate sound in the direction of a nearby residence. [Photograph from T. Rutherford, U.S. Geological Survey.]
5.3. Seasonal and Daily Timing Restrictions
Seasonal and daily timing restrictions on oil and gas activity are a tool to minimize noise effects (among other disturbances) to wildlife during crucial life-history stages, such as breeding and migration. For example, in a rangewide management plan for Centrocercus urophasianus (greater sage-grouse), the Bureau of Land Management (BLM) and the U.S. Department of Agriculture Forest Service prohibited projects from creating greater than 10 dB increases above background sound levels at the perimeter of sage-grouse leks in the morning during the breeding season (BLM, 2015a, b; U.S. Department of Agriculture Forest Service, 2015a, b). However, relative noise exceedance thresholds can be challenging to implement because of the difficulty associated with measuring background sound levels in quiet environments, which can result in overestimation of the sound level at which effects to a species may occur (see section “2. Characterizing the Acoustic Environment”).
Seasonality of activity restrictions may be particularly salient for ungulates because the season in which a disturbance occurs can dictate how ungulates respond to that disturbance. For example, pronghorn have been shown to be more sensitive to high-traffic roads during the fawning season (Gavin and Komers, 2007). Therefore, understanding seasonality of ungulate movement and habitat use could help to identify timing restrictions on activity to reduce the potential effects of noise on ungulates. Some studies have provided detailed information regarding seasonality of ungulate habitat use (Kauffman and others, 2022), and some State wildlife management agencies recommend restrictions on activity in ungulate habitat by season (for example, Wyoming Game and Fish Department, 2010; Colorado Parks and Wildlife, 2021).
Variability of the effects of oil and gas development by season is an important consideration in understanding the potential efficacy of seasonal restrictions. In the winter, methods to reduce effects from construction or well development on ungulate winter range may depend on local population dynamics, habitat availability, and area disturbed (Northrup and others, 2021). For example, Sawyer and others (2006) observed that restrictions on drilling during the winter months within crucial mule deer winter habitat did not prevent effects on deer distribution; deer used less suitable habitat farther from well pads despite a lack of drilling during the winter. The authors recommended that measures to reduce the effects of noise on ungulates be designed to consider all effects from oil and gas development across the project area and not be restricted to only winter ranges or well pads (Sawyer and others, 2006). In contrast to the loss of space on winter range, studies on spring migration of mule deer in oil fields have indicated that fidelity to migration routes can cause mule deer to select locations near infrastructure, but that they change their rate of migration and lose the functional benefits of following forage green up along those migration routes (Lendrum and others, 2012; Aikens and others, 2022).
5.4. Traffic Control
Because traffic noise is dependent on vehicle speed and road surface, measures to control these two variables can reduce noise effects on wildlife. Options include lowering speed limits and improving road surfaces (Shannon, McKenna, and others, 2016). Importantly, both measures include tradeoffs. Lowering the speed of a vehicle increases the duration of the noise exposure for an animal in the area, resulting in a longer, quieter noise compared to a shorter, louder noise. In addition, although improved road surfaces can reduce noise levels compared to vehicles traveling the same speed on a rougher road surface, they also allow for higher driving speeds, which can offset the intended noise reduction.
Another potential measure to reduce traffic noise is concentrating development spatially to reduce total road length in an oil field (see section “5.1. Well Pad Siting and Infrastructure Considerations”). In addition, after oil and gas development, deconstructing roads during the reclamation process can limit future public access and reduce potential traffic noise effects (Northrup and others, 2021).
Methods for Developing This Science Synthesis
We did a literature search to gather science about the effects of noise from oil and gas development on ungulates and small mammals. We sought information relevant to environmental effects analyses per the NEPA (Carter and others, 2023), including data about the acoustic environment, studies demonstrating effects of noise on ungulates and small mammals, methods for analyzing potential effects, and the efficacy of management practices to reduce potential adverse effects.
Our literature search had two components. First, we identified noise literature published 1932 to 2018 using a recently published systematic literature map (Sordello and others, 2020). The literature map includes a total of 1,794 peer-reviewed and gray literature publications (Sordello and others, 2020). Using data provided by the authors, we filtered this literature map by taxonomic class (“mammals”), environment (“terrestrial”), noise source (“industrial” or “transportation”), and language of publication (“English”). These filters returned 32 publications with “industrial” as the noise source, 75 publications with “transportation” as the noise source, and an additional 22 publications tagged with both “industrial” and “transportation.” We then manually screened titles and abstracts to identify studies specific to ungulates, rodents, or leporids, which yielded 21 publications for ungulates and 10 publications for rodents and leporids, excluding studies that used rodents and leporids for human medical research. We then expanded our search to articles not specific to industrial or transportation noise sources with a word search within the database using the terms, “ungulat,” “cervid,” “deer,” “moose,” “elk,” “caribou,” “antilocapr,” “pronghorn,” “ovis,” “sheep,” “bison,” “ovibos,” “muskox,” “musk ox,” “pecari,” “peccary,” “oreamnos,” “mountain goat,” “rodent,” “peromyscus,” “mus,” “rattus,” “rat,” “zapus,” “dipodomys,” “mouse,” “mice,” “thomomys,” “geomys,” “gopher,” “sciurid,” “tamias,” “chipmunk,” “glaucomys,” “squirrel,” “marmot,” “prairie dog,” “vole,” “muskrat,” “lemming,” “hamster,” “leporid,” “hare,” and “rabbit.” We chose these search terms with the intention of focusing on wild North American taxa potentially occurring on public lands, though we expected that the search would return results for species not occurring in North America. When opportunistically found, we included studies about species not occurring in North America in this synthesis if we determined them to be relevant to understanding noise effects from oil and gas development. On the basis of titles and abstracts, we selected an additional 11 relevant articles to review for ungulates and 2 articles to review for rodents and leporids, with noise sources urban, military, or recreation. Although these additional noise sources are not the focus of this synthesis, we considered potentially relevant noise effects revealed by the full body of research about these taxa.
To find literature outside of the timeframe captured by Sordello and others (2020), we searched for literature published between January 1, 2019, and May 19, 2022 (date of search) using a search of two citation indices (Web of Science, Scopus [accessed through the U.S. Geological Survey [USGS] Library]) and two Federal government publication databases (USGS ScienceBase, USGS Publications Warehouse; Kleist and Enns, 2021). To find literature about ungulates, we used the search phrase, ([“anthropogenic noise” OR “anthropogenic sound” OR “noise pollution” OR “sound pollution”] AND [“ungulat*” OR “cervid*” OR “deer” OR “moose” OR “elk” OR “caribou” OR “antilocapr*” OR “pronghorn” OR “ovis” OR “sheep” OR “bison” OR “ovibos” OR “muskox*” OR “musk ox” OR “pecari” OR “peccar*” OR “oreamnos” OR [“mountain” AND “goat*”]]). This search returned six publications. On the basis of titles and abstracts, we selected three of these six as relevant articles to review. To find literature about small mammals, we used the search phrase ((“anthropogenic noise” OR “anthropogenic sound” OR “noise pollution” OR “sound pollution”) AND (“rodent*” OR “peromyscus” OR “mus” OR “rattus” OR “zapus” OR “dipodomys” OR “mouse” OR “mice” OR “kangaroo rat” OR “thomomys” OR “geomys” OR “gopher*” OR “sciurid*” OR “tamias” OR “chipmunk*” OR “glaucomys” OR “squirrel*” OR “marmot*” OR “prairie dog” OR “prairie dogs” OR “vole*” OR “muskrat*” OR “lemming*” OR “hamster*” OR “leporid*” OR “hare*” OR “rabbit*”). This search returned 44 publications. On the basis of titles and abstracts, we selected 10 of these 44 publications as relevant articles to review.
These structured searches of the Sordello and others (2020) literature map and online databases directly informed section “4. Potential Effects of Noise from Oil and Gas Development on Ungulates and Small Mammals” of this science synthesis, which addressed the core question of identifying potential effects of noise from oil and gas development on ungulates, rodents, and leporids. The structured searches also indirectly informed the other sections of this synthesis, which address the broader topics of noise from oil and gas development (section “1. Characterizing Noise Caused by Oil and Gas Development”), collecting data to characterize an acoustic environment (section “2. Characterizing Noise Caused by Oil and Gas Development”), modeling the spatial extent of the potential spread of noise from a proposed action (section “3. Methods for Predicting Noise Occurrence on the Landscape”), and mitigation to reduce noise effects (section “5. Mitigating the Effects of Noise from Oil and Gas Development on Ungulates and Small Mammals”). For these sections, we gathered additional literature by snowballing (Wäldchen and Mäder, 2018) from key review articles and performing supplemental searches with online databases and search engines.
We synthesized information returned in these searches according to our objective to inform NEPA analyses. Rather than reporting all literature we found, we synthesize only the literature applicable to informing analyses of the potential effects of noise from oil and gas development projects on ungulates, rodents, and leporids. As such, this synthesis does not constitute a comprehensive literature review of all effects of noise on ungulates and small mammals. In addition, it is possible that our literature search methods missed some relevant studies.
Throughout the development of this report, we worked with staff from the BLM, U.S. Fish and Wildlife Service, and USGS to coproduce this report (Beier and others, 2017). We refined the structure and content of the report through close collaboration with multiple BLM staff throughout scoping, writing, and review.
References Cited
Aikens, E.O., Wyckoff, T.B., Sawyer, H., and Kauffman, M.J., 2022, Industrial energy development decouples ungulate migration from the green wave: Nature Ecology & Evolution, v. 6, no. 11, p. 1733–1741, accessed August 21, 2023, at https://doi.org/10.1038/s41559-022-01887-9.
Allshouse, W.B., McKenzie, L.M., Barton, K., Brindley, S., and Adgate, J.L., 2019, Community noise and air pollution exposure during the development of a multi-well oil and gas pad: Environmental Science & Technology, v. 53, no. 12, p. 7126–7135, accessed August 21, 2023, at https://doi.org/10.1021/acs.est.9b00052.
Ambrose, S., Florian, C., Olnes, J., MacDonald, J., and Hartman, T., 2021, Sagebrush soundscapes and the effects of gas-field sounds on greater sage-grouse: Western Birds, v. 52, no. 1, p. 23–46, accessed August 21, 2023, at https://doi.org/10.21199/WB52.1.2.
Andersen, R., Linnell, J.D.C., and Langvatn, R., 1996, Short term behavioural and physiological response of moose Alces alces to military disturbance in Norway: Biological Conservation, v. 77, no. 2, p. 169–176, accessed August 21, 2023, at https://doi.org/10.1016/0006-3207(96)00004-3.
Attenborough, K., 2002, Sound propagation close to the ground: Annual Review of Fluid Mechanics, v. 34, no. 1, p. 51–82, accessed August 21, 2023, at https://doi.org/10.1146/annurev.fluid.34.081701.143541.
Bagaini, C., Laycock, M., Readman, C., Coste, E., and Anderson, C., 2014, Seismo-acoustic characterization of a seismic vibrator, SEG Technical Program Expanded Abstracts 2014, p. 25–29, accessed August 21, 2023, at https://doi.org/10.1190/segam2014-1126.1.
Barber, J.R., Crooks, K.R., and Fristrup, K.M., 2010, The costs of chronic noise exposure for terrestrial organisms: Trends in Ecology and Evolution, v. 25, no. 3, p. 180–189, accessed August 21, 2023, at https://doi.org/10.1016/j.tree.2009.08.002.
Bayne, E.M., Habib, L., and Boutin, S., 2008, Impacts of chronic anthropogenic noise from energy-sector activity on abundance of songbirds in the boreal forest: Conservation Biology, v. 22, no. 5, p. 1186–1193, accessed August 21, 2023, at https://doi.org/10.1111/j.1523-1739.2008.00973.x.
Beier, P., Hansen, L.J., Helbrecht, L., and Behar, D., 2017, A how-to guide for coproduction of actionable science: Conservation Letters, v. 10, no. 3, p. 288–296, accessed August 21, 2023, at https://doi.org/10.1111/conl.12300.
Bernath-Plaisted, J., and Koper, N., 2016, Physical footprint of oil and gas infrastructure, not anthropogenic noise, reduces nesting success of some grassland songbirds: Biological Conservation, v. 204, p. 434–441, accessed August 21, 2023, at https://doi.org/10.1016/j.biocon.2016.11.002.
Betchkal, D.H., and Balantic, C., 2023, NMSIM-Python: NMSIM-Python software release, accessed June 19, 2023, at https://github.com/dbetchkal/NMSIM-Python.
Blair, B.D., Brindley, S., Dinkeloo, E., McKenzie, L.M., and Adgate, J.L., 2018, Residential noise from nearby oil and gas well construction and drilling: Journal of Exposure Science & Environmental Epidemiology, v. 28, no. 6, p. 538–547, accessed August 21, 2023, at https://doi.org/10.1038/s41370-018-0039-8.
Blickley, J.L., and Patricelli, G.L., 2010, Impacts of anthropogenic noise on wildlife—Research priorities for the development of standards and mitigation: Journal of International Wildlife Law & Policy, v. 13, no. 4, p. 274–292, accessed August 21, 2023, at https://doi.org/10.1080/13880292.2010.524564.
Blix, A., and Lentfer, J., 1992, Noise and vibration levels in artificial polar bear dens as related to selected petroleum exploration and developmental activities: Arctic, v. 45, no. 1, p. 20–24, accessed August 21, 2023, at https://doi.org/10.14430/arctic1369.
Boycott, T.J., Gao, J., and Gall, M.D., 2019, Deer browsing alters sound propagation in temperate deciduous forests: PloS ONE, v. 14, no. 2, article e0211569, 20 p., accessed August 21, 2023, at https://doi.org/10.1371/journal.pone.0211569.
Bradshaw, C.J., Boutin, S., and Hebert, D.M., 1997, Effects of petroleum exploration on woodland caribou in northeastern Alberta: The Journal of Wildlife Management, v. 61, no. 4, p. 1127–1133, accessed August 21, 2023, at https://doi.org/10.2307/3802110.
Brattstrom, B.H., and Bondello, M.C., 1983, Effects of off-road vehicle noise on desert vertebrates, in Webb, R.H., and Wilshire, H.G., eds., Environmental effects of off-road vehicles: New York, Springer-Verlag, p. 167–206, accessed August 21, 2023, at https://doi.org/10.1007/978-1-4612-5454-6_9.
Brittingham, M.C., Maloney, K.O., Farag, A.M., Harper, D.D., and Bowen, Z.H., 2014, Ecological risks of shale oil and gas development to wildlife, aquatic resources and their habitats: Environmental Science & Technology, v. 48, no. 19, p. 11034–11047, accessed August 21, 2023, at https://doi.org/10.1021/es5020482.
Brown, C.L., Hardy, A.R., Barber, J.R., Fristrup, K.M., Crooks, K.R., and Angeloni, L.M., 2012, The effect of human activities and their associated noise on ungulate behavior: PloS ONE, v. 7, no. 7, article e40505, 9 p., accessed August 21, 2023, at https://doi.org/10.1371/journal.pone.0040505.
Bureau of Land Management [BLM], 2015a, Bureau of Land Management Casper, Kemmerer, Newcastle, Pinedale, Rawlins, and Rock Springs Field Offices approved resource management plan amendment for greater sage-grouse: Cheyenne, Wyo., U.S. Department of the Interior, Bureau of Land Management, Wyoming State Office, 111 p., accessed March 7, 2024, at https://eplanning.blm.gov/public_projects/lup/103347/143767/177179/002_Wyoming_ARMPA_Main-Body.pdf.
Bureau of Land Management [BLM], 2015b, Record of decision and approved resource management plan amendments for the Rocky Mountain Region, including the greater sage-grouse sub-regions of Lewistown, North Dakota, Northwest Colorado, Wyoming and the approved resource management plans for Billings, Buffalo, Cody, HiLine, Miles City, Pompeys Pillar National Monument, South Dakota, Worland: Washington, D.C., U.S. Department of the Interior, Bureau of Land Management, 328 p., accessed March 7, 2024, at https://eplanning.blm.gov/public_projects/lup/105596/143663/176863/2015_Rocky_Mountain_Region_Record_GRSG_ROD_ARMPA_508.pdf.
Buxton, R.T., McKenna, M.F., Brown, E., Ohms, R., Hammesfahr, A., Angeloni, L.M., Crooks, K.R., and Wittemyer, G., 2020, Varying behavioral responses of wildlife to motorcycle traffic: Global Ecology and Conservation, v. 21, article e00844, 12 p., accessed August 21, 2023, at https://doi.org/10.1016/j.gecco.2019.e00844.
Buxton, R.T., McKenna, M.F., Mennitt, D., Fristrup, K., Crooks, K., Angeloni, L., and Wittemyer, G., 2017, Noise pollution is pervasive in U.S. protected areas: Science, v. 356, no. 6337, p. 531–533, accessed August 21, 2023, at https://doi.org/10.1126/science.aah4783.
Byrnes, P., Goosem, M., and Turton, S.M., 2012, Are less vocal rainforest mammals susceptible to impacts from traffic noise?: Wildlife Research, v. 39, no. 4, p. 355–365, accessed August 21, 2023, at https://doi.org/10.1071/WR11010.
Carter, S.K., Haby, T.S., Meineke, J.K., Foster, A.C., McCall, L.E., Espy, L.D., Gilbert, M.A., Herrick, J.E., and Prentice, K.L., 2023, Prioritizing science efforts to inform decision making on public lands: Frontiers in Ecology and the Environment, accessed September 12, 2023, at https://doi.org/10.1002/fee.2672.
Chambers, S., Villarreal, M.L., Duane, O., Munson, S.M., Stuber, E., Tyree, G., Waller, E.K., and Duniway, M.C., 2022, Conflict of energies: spatially modeling mule deer caloric expenditure in response to oil and gas development: Landscape Ecology, v. 37, no. 11, p. 2947–2961, accessed August 21, 2023, at https://doi.org/10.1007/s10980-022-01521-w.
Chan, A.A.Y.-H., David Stahlman, W., Garlick, D., Fast, C.D., Blumstein, D.T., and Blaisdell, A.P., 2010, Increased amplitude and duration of acoustic stimuli enhance distraction: Animal Behaviour, v. 80, no. 6, p. 1075–1079, accessed August 21, 2023, at https://doi.org/10.1016/j.anbehav.2010.09.025.
Chen, H.L., and Koprowski, J.L., 2015, Animal occurrence and space use change in the landscape of anthropogenic noise: Biological Conservation, v. 192, p. 315–322, accessed August 21, 2023, at https://doi.org/10.1016/j.biocon.2015.10.003.
Chesser, R.K., Caldwell, R.S., and Harvey, M.J., 1975, Effects of noise on feral populations of Mus musculus: Physiological Zoology, v. 48, no. 4, p. 323–325, accessed August 21, 2023, at https://doi.org/10.1086/physzool.48.4.30155657.
Colorado Oil and Gas Conservation Commission, 2022, Glossary of oil and gas terms: Colorado Oil and Gas Conservation Commission web page, accessed May 2, 2023, at https://cogcc.state.co.us/COGIS_Help/glossary.htm.
Colorado Parks and Wildlife, 2021, Colorado Parks and Wildlife's (CPW) recommendations to avoid and minimize impacts to wildlife from land use development in Colorado: Colorado Parks and Wildlife, accessed June 5, 2023, at https://cpw.state.co.us/Documents/Conservation-Resources/Energy-Mining/CPW_HPH-Map-Layers.pdf.
Côté, S.D., Hamel, S., St-Louis, A., and Mainguy, J., 2013, Do mountain goats habituate to helicopter disturbance?: The Journal of Wildlife Management, v. 77, no. 6, p. 1244–1248, accessed September 18, 2023, at https://doi.org/10.1002/jwmg.565.
Cushing, L.J., Vavra-Musser, K., Chau, K., Franklin, M., and Johnston, J.E., 2020, Flaring from unconventional oil and gas development and birth outcomes in the Eagle Ford Shale in South Texas: Environmental Health Perspectives, v. 128, no. 7, 9 p., accessed August 21, 2023, at https://doi.org/10.1289/EHP6394.
Darlington, S., Ladle, A., Burton, A.C., Volpe, J.P., and Fisher, J.T., 2022, Cumulative effects of human footprint, natural features and predation risk best predict seasonal resource selection by white-tailed deer: Scientific Reports, v. 12, no. 1, article 1072, 12 p., accessed August 21, 2023, at https://doi.org/10.1038/s41598-022-05018-z.
Dowling, A.P., and Mahmoudi, Y., 2015, Combustion noise: Proceedings of the Combustion Institute, v. 35, no. 1, p. 65–100, accessed March 8, 2024, at https://doi.org/10.1016/j.proci.2014.08.016.
Drolet, A., Dussault, C., and Côté, S.D., 2016, Simulated drilling noise affects the space use of a large terrestrial mammal: Wildlife Biology, v. 22, no. 6, p. 284–293, accessed August 21, 2023, at https://doi.org/10.2981/wlb.00225.
Dyer, S., O'Neill, J., Wasel, S., and Boutin, S., 2001, Avoidance of industrial development by woodland caribou: The Journal of Wildlife Management, v. 65, p. 531–542, accessed August 21, 2023, at https://doi.org/10.2307/3803106.
Eftestøl, S., Flydal, K., Tsegaye, D., and Colman, J.E., 2019, Mining activity disturbs habitat use of reindeer in Finnmark, Northern Norway: Polar Biology, v. 42, no. 10, p. 1849–1858, accessed August 21, 2023, at https://doi.org/10.1007/s00300-019-02563-8.
Ekici, I., and Bougdah, H., 2003, A review of research on environmental noise barriers: Building Acoustics, v. 10, no. 4, p. 289–323, accessed August 21, 2023, at https://doi.org/10.1260/135101003772776712.
Engineering ToolBox, 2003, Decibel A, B and C: The Engineering ToolBox web page, accessed April 6, 2023, at https://www.engineeringtoolbox.com/decibel-d_59.html.
Federal Highway Administration, 2021, Technical manual—Traffic Noise Model 3.1: Washington, D.C., U.S. Department of Transportation Federal Highway Administration Office of Natural Environment FHWA-HEP-21-041, 150 p., accessed March 7, 2024, at https://www.fhwa.dot.gov/environment/noise/traffic_noise_model/old_versions/tnm_version_31/fhwahep21041.pdf.
Flydal, K., Hermansen, A., Enger, P.S., and Reimers, E., 2001, Hearing in reindeer (Rangifer tarandus): Journal of Comparative Physiology A, v. 187, no. 4, p. 265–269, accessed August 21, 2023, at https://doi.org/10.1007/s003590100198.
Francis, C.D., and Barber, J.R., 2013, A framework for understanding noise impacts on wildlife: an urgent conservation priority: Frontiers in Ecology and the Environment, v. 11, no. 6, p. 305–313, accessed August 21, 2023, at https://doi.org/10.1890/120183.
Francis, C.D., Kleist, N.J., Ortega, C.P., and Cruz, A., 2012, Noise pollution alters ecological services: enhanced pollination and disrupted seed dispersal: Proceedings of the Royal Society B, Biological Sciences, v. 279, no. 1739, p. 2727–2735, accessed August 21, 2023, at https://doi.org/10.1098/rspb.2012.0230.
Francis, C.D., Ortega, C.P., and Cruz, A., 2009, Noise pollution changes avian communities and species interactions: Current Biology, v. 19, no. 16, p. 1415–1419, accessed August 21, 2023, at https://doi.org/10.1016/j.cub.2009.06.052.
Francis, C.D., Ortega, C.P., and Cruz, A., 2011, Vocal frequency change reflects different responses to anthropogenic noise in two suboscine tyrant flycatchers: Proceedings of the Royal Society B, Biological Sciences, v. 278, no. 1714, p. 2025–2031, accessed August 21, 2023, at https://doi.org/10.1098/rspb.2010.1847.
Francis, C.D., Paritsis, J., Ortega, C.P., and Cruz, A., 2011, Landscape patterns of avian habitat use and nest success are affected by chronic gas well compressor noise: Landscape Ecology, v. 26, no. 9, p. 1269–1280, accessed August 21, 2023, at https://doi.org/10.1007/s10980-011-9609-z.
Frid, A.F., and Dill, L., 2002, Human-caused disturbance stimuli as a form of predation risk: Conservation Ecology, v. 6, no. 1, article 11, 16 p., accessed August 21, 2023, at https://doi.org/10.5751/ES-00404-060111.
Gavin, S.D., and Komers, P.E., 2007, Do pronghorn (Antilocapra americana) perceive roads as a predation risk?: Canadian Journal of Zoology, v. 84, no. 12, p. 1775–1780, accessed August 21, 2023, at https://doi.org/10.1139/z06-175.
Germaine, S.S., Assal, T., Freeman, A., and Carter, S.K., 2020, Distance effects of gas field infrastructure on pygmy rabbits in southwestern Wyoming: Ecosphere, v. 11, no. 8, article e03230, 16 p., accessed August 21, 2023, at https://doi.org/10.1002/ecs2.3230.
Germaine, S.S., Carter, S.K., Ignizio, D.A., and Freeman, A.T., 2017, Relationships between gas field development and the presence and abundance of pygmy rabbits in southwestern Wyoming: Ecosphere, v. 8, no. 5, article e01817, 19 p., accessed August 21, 2023, at https://doi.org/10.1002/ecs2.1817.
Gill, S.A., Job, J.R., Myers, K., Naghshineh, K., and Vonhof, M.J., 2015, Toward a broader characterization of anthropogenic noise and its effects on wildlife: Behavioral Ecology, v. 26, no. 2, p. 328–333, accessed August 21, 2023, at https://doi.org/10.1093/beheco/aru219.
Giordano, A., Hunninck, L., and Sheriff, M.J., 2022, Prey responses to predation risk under chronic road noise: Journal of Zoology, v. 317, no. 2, p. 147–157, accessed August 21, 2023, at https://doi.org/10.1111/jzo.12968.
Goldstein, M.I., Poe, A.J., Cooper, E., Youkey, D., Brown, B.A., and McDonald, T.L., 2005, Mountain goat response to helicopter overflights in Alaska: Wildlife Society Bulletin, v. 33, no. 2, p. 688–699, accessed August 21, 2023, at https://doi.org/10.2193/0091-7648(2005)33[688:MGRTHO]2.0.CO;2.
Harding, H.R., Gordon, T.A.C., Eastcott, E., Simpson, S.D., and Radford, A.N., 2019, Causes and consequences of intraspecific variation in animal responses to anthropogenic noise: Behavioral Ecology, v. 30, no. 6, p. 1501–1511, accessed August 21, 2023, at https://doi.org/10.1093/beheco/arz114.
Hays, J., McCawley, M., and Shonkoff, S.B.C., 2017, Public health implications of environmental noise associated with unconventional oil and gas development: Science of The Total Environment, v. 580, p. 448–456, accessed August 21, 2023, at https://doi.org/10.1016/j.scitotenv.2016.11.118.
Heffner, H., and Masterton, B., 1980, Hearing in Glires—Domestic rabbit, cotton rat, feral house mouse, and kangaroo rat: The Journal of the Acoustical Society of America, v. 68, no. 6, p. 1584–1599, accessed August 21, 2023, at https://doi.org/10.1121/1.385213.
Heffner, H., Jr., and Heffner, H.E., 2010, The behavioral audiogram of whitetail deer (Odocoileus virginianus): The Journal of the Acoustical Society of America, v. 127, no. 3, p. EL111–EL114, accessed August 21, 2023, at https://doi.org/10.1121/1.3284546.
Heffner, H.E., 2023, Behavioral audiograms of mammals: The University of Toledo web page, accessed May 16, 2023, at https://www.utoledo.edu/al/psychology/research/psychobio/audiograms2.html.
Heffner, H.E., and Heffner, R.S., 1985, Hearing in two cricetid rodents—Wood rat (Neotoma floridana) and grasshopper mouse (Onychomys leucogaster): Journal of Comparative Psychology, v. 99, no. 3, p. 275–288, accessed August 21, 2023, at https://doi.org/10.1037/0735-7036.99.3.275.
Heffner, R.S., and Heffner, H.E., 1983, Hearing in large mammals: Horses (Equus caballus) and cattle (Bos taurus): Behavioral Neuroscience, v. 97, no. 2, p. 299–309, accessed August 21, 2023, at https://doi.org/10.1037/0735-7044.97.2.299.
Heffner, R.S., and Heffner, H.E., 1990a, Hearing in domestic pigs (Sus scrofa) and goats (Capra hircus): Hearing Research, v. 48, no. 3, p. 231–240, accessed August 21, 2023, at https://doi.org/10.1016/0378-5955(90)90063-U.
Heffner, R.S., and Heffner, H.E., 1990b, Vestigial hearing in a fossorial mammal, the pocket gopher (Geomys bursarius): Hearing Research, v. 46, no. 3, p. 239–252, accessed August 21, 2023, at https://doi.org/10.1016/0378-5955(90)90005-A.
Heffner, R.S., Heffner, H.E., Contos, C., and Kearns, D., 1994, Hearing in prairie dogs—Transition between surface and subterranean rodents: Hearing Research, v. 73, no. 2, p. 185–189, accessed August 21, 2023, at https://doi.org/10.1016/0378-5955(94)90233-X.
Heffner, R.S., Koay, G., and Heffner, H.E., 2001, Audiograms of five species of rodents—Implications for the evolution of hearing and the perception of pitch: Hearing Research, v. 157, no. 1–2, p. 138–152, accessed August 21, 2023, at https://doi.org/10.1016/S0378-5955(01)00298-2.
Houser, D.S., Yost, W., Burkard, R., Finneran, J.J., Reichmuth, C., and Mulsow, J., 2017, A review of the history, development and application of auditory weighting functions in humans and marine mammals: The Journal of the Acoustical Society of America, v. 141, no. 3, p. 1371–1413, accessed August 21, 2023, at https://doi.org/10.1121/1.4976086.
Iglesias-Merchan, C., Horcajada-Sánchez, F., Diaz-Balteiro, L., Escribano-Ávila, G., Lara-Romero, C., Virgós, E., Planillo, A., and Barja, I., 2018, A new large-scale index (AcED) for assessing traffic noise disturbance on wildlife—Stress response in a roe deer (Capreolus capreolus) population: Environmental Monitoring and Assessment, v. 190, no. 4, article 185, 16 p., accessed August 21, 2023, at https://doi.org/10.1007/s10661-018-6573-y
Ishizuka, T., and Fujiwara, K., 2004, Performance of noise barriers with various edge shapes and acoustical conditions: Applied Acoustics, v. 65, no. 2, p. 125–141, accessed August 21, 2023, at https://doi.org/10.1016/j.apacoust.2003.08.006.
Issad, S.M., Benhafri, N., El Allali, K., Farsi, H., Ouali-Hassenaoui, S., and Dekar-Madoui, A., 2021, Effects of prolonged night-time light exposure and traffic noise on the behavior and body temperature rhythmicity of the wild desert rodent, Gerbillus tarabuli: Chronobiology International, v. 38, no. 3, p. 415–425, accessed August 21, 2023, at https://doi.org/10.1080/07420528.2020.1862858.
Jackson, L.L., Heffner, H.E., and Heffner, R.S., 1997, Audiogram of the fox squirrel (Sciurus niger): Journal of Comparative Psychology, v. 111, no. 1, p. 100–104, accessed August 21, 2023, at https://doi.org/10.1037/0735-7036.111.1.100.
Jackson, L.L., Heffner, R.S., and Heffner, H.E., 1999, Free-field audiogram of the Japanese macaque (Macaca fuscata): Journal of the Acoustical Society of America, v. 106, no. 5, p. 3017–3023, accessed August 21, 2023, at https://doi.org/10.1121/1.428121.
Kauffman, M., Lowrey, B., Berg, J., Bergen, S., Brimeyer, D., Burke, P., Cufaude, T., Cain Iii, J.W., Cole, J., Courtemanch, A., Cowardin, M., Cunningham, J., DeVivo, M., Diamond, J., Duvuvuei, O., Fattebert, J., Ennis, J., Finley, D., Fort, J., Fralick, G., Freeman, E., Gagnon, J., Garcia, J., Gelzer, E., Graham, M., Gray, J., Greenspan, E., Hall, L.E., Hendricks, C., Holland, A., Holmes, B., Huggler, K., Hurley, M.A., Jeffreys, E., Johnson, A., Knox, L., Krasnow, K., Lockyer, Z., Manninen, H., McDonald, M., McKee, J.L., Meacham, J., Merkle, J., Moore, B., Mong, T.W., Nielsen, C., Oates, B., Olsen, K., Olson, D., Olson, L., Pieron, M., Powell, J., Prince, A., Proffitt, K., Reddell, C., Riginos, C., Ritson, R., Robatcek, S., Roberts, S., Sawyer, H., Schroeder, C., Shapiro, J., Simpson, N., Sprague, S., Steingisser, A., Tatman, N., Turnock, B., Wallace, C., and Wolf, L., 2022, Ungulate migrations of the western United States, volume 3: U.S. Geological Survey Scientific Investigations Report 2022–5088, 114 p., accessed September 18, 2023, at https://doi.org/10.3133/sir20225088.
Keyel, A.C., and Reed, S.E., 2017, Sound mapping tools—An ArcGIS toolbox for modeling the propagation of sounds in a wildland setting, version 4.4: Fort Collins, Colo., University, C.S., 50 p, accessed September 11, 2023, at https://docs.google.com/document/d/0B4ir69pS-kSTSmY0S3JUQ3Y5X1U/edit?resourcekey=0-lA0wacsHsZqJyFT2LDbtng.
Keyel, A.C., Reed, S.E., McKenna, M.F., and Wittemyer, G., 2017, Modeling anthropogenic noise propagation using the Sound Mapping Tools ArcGIS toolbox: Environmental Modelling & Software, v. 97, p. 56–60, accessed August 21, 2023, at https://doi.org/10.1016/j.envsoft.2017.07.008.
Keyel, A.C., Reed, S.E., Nuessly, K., Cinto-Mejia, E., Barber, J.R., and Wittemyer, G., 2018, Modeling anthropogenic noise impacts on animals in natural areas: Landscape and Urban Planning, v. 180, p. 76–84, accessed August 21, 2023, at https://doi.org/10.1016/j.landurbplan.2018.08.011.
Khan, J., Ketzel, M., Jensen, S.S., Gulliver, J., Thysell, E., and Hertel, O., 2021, Comparison of road traffic noise prediction models—CNOSSOS-EU, Nord2000 and TRANEX: Environmental Pollution, v. 270, article 116240, 13 p., accessed August 21, 2023, at https://doi.org/10.1016/j.envpol.2020.116240.
Kight, C.R., and Swaddle, J.P., 2011, How and why environmental noise impacts animals: an integrative, mechanistic review: Ecology Letters, v. 14, no. 10, p. 1052–1061, accessed March 23, 2022, at https://doi.org/10.1111/j.1461-0248.2011.01664.x.
Kleist, N.J., Buxton, R.T., Lendrum, P.E., Linares, C., Crooks, K.R., and Wittemyer, G., 2021, Noise and landscape features influence habitat use of mammalian herbivores in a natural gas field: Journal of Animal Ecology, v. 90, no. 4, p. 875–885, accessed August 21, 2023, at https://doi.org/10.1111/1365-2656.13416.
Kleist, N.J., and Enns, K.D., 2021, USGS BiblioSearch—A python tool to facilitate searching, cleaning, and compiling of literature citations from across multiple databases: U.S. Geological Survey software release, accessed June 5, 2023, at https://doi.org/10.5066/P9EW8BO5.
Kleist, N.J., Guralnick, R.P., Cruz, A., and Francis, C.D., 2017, Sound settlement—Noise surpasses land cover in explaining breeding habitat selection of secondary cavity‐nesting birds: Ecological Applications, v. 27, no. 1, p. 260–273, accessed August 21, 2023, at https://doi.org/10.1002/eap.1437.
Kleist, N.J., Guralnick, R.P., Cruz, A., Lowry, C.A., and Francis, C.D., 2018, Chronic anthropogenic noise disrupts glucocorticoid signaling and has multiple effects on fitness in an avian community: Proceedings of the National Academy of Sciences of the United States of America, v. 115, no. 4, p. E648–E657, accessed August 21, 2023, at https://doi.org/10.1073/pnas.1709200115.
Koper, N., Leston, L., Baker, T.M., Curry, C., and Rosa, P., 2016, Effects of ambient noise on detectability and localization of avian songs and tones by observers in grasslands: Ecology and Evolution, v. 6, no. 1, p. 245–255, accessed August 21, 2023, at https://doi.org/10.1002/ece3.1847.
Krausman, P.R., Harris, L.K., Blasch, C.L., Kiana, K.G.K., and Francine, J., 2004, Effects of military operations on behavior and hearing of endangered Sonoran pronghorn: Wildlife Monographs, v. 157, p. 1–41, accessed August 21, 2023, at https://doi.org/10.2193/0084-0173(2004)157[1:EOMOOB]2.0.CO;2.
Krausman, P.R., Wallace, M.C., Hayes, C.L., and DeYoung, D.W., 1998, Effects of jet aircraft on mountain sheep: The Journal of Wildlife Management, v. 62, no. 4, p. 1246–1254, accessed August 21, 2023, at https://doi.org/10.2307/3801988.
Kuck, L., Hompland, G.L., and Merrill, E.H., 1985, Elk calf response to simulated mine disturbance in southeast Idaho: The Journal of Wildlife Management, v. 49, no. 3, p. 751–757, accessed August 21, 2023, at https://doi.org/10.2307/3801706.
Kunc, H.P., and Schmidt, R., 2019, The effects of anthropogenic noise on animals—A meta-analysis: Biology Letters, v. 15, no. 11, article 20190649, 5 p., accessed August 21, 2023, at https://doi.org/10.1098/rsbl.2019.0649.
Landon, D.M., Krausman, P.R., Kiana, K.G.K., and Harris, L.K., 2003, Pronghorn use of areas with varying sound pressure levels: The Southwestern Naturalist, v. 48, no. 4, p. 725–728, accessed August 21, 2023, at https://doi.org/10.1894/0038-4909(2003)048<0725:PUOAWV>2.0.CO;2.
Le, M.L.T., Garvin, C.M., Barber, J.R., and Francis, C.D., 2019, Natural sounds alter California ground squirrel, Otospermophilus beecheyi, foraging, vigilance and movement behaviours: Animal Behaviour, v. 157, p. 51–60, accessed August 21, 2023, at https://doi.org/10.1016/j.anbehav.2019.08.014.
Lendrum, P.E., AndersonJr., C.R., Long, R.A., Kie, J.G., and Bowyer, R.T., 2012, Habitat selection by mule deer during migration—Effects of landscape structure and natural-gas development: Ecosphere, v. 3, no. 9, article 82, 19 p., accessed August 21, 2023, at https://doi.org/10.1890/ES12-00165.1.
Lilly, M.V., Lucore, E.C., and Tarvin, K.A., 2019, Eavesdropping grey squirrels infer safety from bird chatter: PLoS ONE, v. 14, no. 9, article e0221279, 15 p., accessed August 21, 2023, at https://doi.org/10.1371/journal.pone.0221279.
Lynch, E., Joyce, D., and Fristrup, K., 2011, An assessment of noise audibility and sound levels in U.S. National Parks: Landscape Ecology, v. 26, no. 9, p. 1297–1309, accessed August 21, 2023, at https://doi.org/10.1007/s10980-011-9643-x.
Lynch, E., Northrup, J.M., McKenna, M.F., Anderson, C.R., Angeloni, L., and Wittemyer, G., 2015, Landscape and anthropogenic features influence the use of auditory vigilance by mule deer: Behavioral Ecology, v. 26, no. 1, p. 75–82, accessed August 21, 2023, at https://doi.org/10.1093/beheco/aru158.
Magrath, R.D., Haff, T.M., Fallow, P.M., and Radford, A.N., 2015, Eavesdropping on heterospecific alarm calls—From mechanisms to consequences: Biological Reviews, v. 90, no. 2, p. 560–586, accessed August 21, 2023, at https://doi.org/10.1111/brv.12122.
Mancera, K.F., Lisle, A., Allavena, R., and Phillips, C.J.C., 2017, The effects of mining machinery noise of different frequencies on the behaviour, faecal corticosterone and tissue morphology of wild mice (Mus musculus): Applied Animal Behaviour Science, v. 197, p. 81–89, accessed August 21, 2023, at https://doi.org/10.1016/j.applanim.2017.08.008.
Mason, J.T., McClure, C.J.W., and Barber, J.R., 2016, Anthropogenic noise impairs owl hunting behavior: Biological Conservation, v. 199, p. 29–32, accessed August 21, 2023, at https://doi.org/10.1016/j.biocon.2016.04.009.
Massachusetts Institute of Technology, 2011, The future of natural gas—An interdisciplinary MIT study: Cambridge, Mass., Massachusetts Institute of Technology, 287 p., accessed April 6, 2023, at https://energy.mit.edu/wp-content/uploads/2011/06/MITEI-The-Future-of-Natural-Gas.pdf.
Mennitt, D., Sherrill, K., and Fristrup, K., 2014, A geospatial model of ambient sound pressure levels in the contiguous United States: The Journal of the Acoustical Society of America, v. 135, no. 5, p. 2746–2764, accessed August 21, 2023, at https://doi.org/10.1121/1.4870481.
Mulligan, B.E., and Nellis, D.W., 1975, Vocal repertoire of the Mongoose Herpestes auropunctatus: Behaviour, v. 55, no. 3/4, p. 237–267, accessed August 21, 2023, at https://doi.org/10.1163/156853975X00489.
Naguib, M., and Wiley, R.H., 2001, Estimating the distance to a source of sound—Mechanisms and adaptations for long-range communication: Animal Behaviour, v. 62, no. 5, p. 825–837, accessed August 21, 2023, at https://doi.org/10.1006/anbe.2001.1860.
National Park Service [NPS], 2015, Geospatial sound modeling: NPS DataStore, integrated resource management applications, U.S. Department of the Interior National Park Service web page, accessed June 5, 2023, at https://irma.nps.gov/DataStore/Reference/Profile/2217356.
Northrup, J.M., Anderson, C.R., Gerber, B.D., and Wittemyer, G., 2021, Behavioral and demographic responses of mule deer to energy development on winter range: Wildlife Monographs, v. 208, no. 1, p. 1–37, accessed August 21, 2023, at https://doi.org/10.1002/wmon.1060.
Northrup, J.M., AndersonJr., C.R., and Wittemyer, G., 2015, Quantifying spatial habitat loss from hydrocarbon development through assessing habitat selection patterns of mule deer: Global Change Biology, v. 21, no. 11, p. 3961–3970, accessed August 21, 2023, at https://doi.org/10.1111/gcb.13037.
Ortega, C.P., 2012, Chapter 2—Effects of noise pollution on birds—A brief review of our knowledge: Ornithological Monographs, v. 74, no. 1, p. 6–22, accessed August 21, 2023, at https://doi.org/10.1525/om.2012.74.1.6.
Pater, L.L., Grubb, T.G., and Delaney, D.K., 2009, Recommendations for improved assessment of noise impacts on wildlife: The Journal of Wildlife Management, v. 73, no. 5, p. 788–795, accessed August 21, 2023, at https://doi.org/10.2193/2006-235.
Perra, M., Brinkman, T., Scheifele, P., and Barcalow, S., 2022, Exploring auditory thresholds for reindeer, Rangifer tarandus: Journal of Veterinary Behavior, v. 52–53, p. 37–44, accessed August 21, 2023, at https://doi.org/10.1016/j.jveb.2022.05.002.
Quinn, J.L., Whittingham, M.J., Butler, S.J., and Cresswell, W., 2006, Noise, predation risk compensation and vigilance in the chaffinch Fringilla coelebs: Journal of Avian Biology, v. 37, no. 6, p. 601–608, accessed August 21, 2023, at https://doi.org/10.1111/j.2006.0908-8857.03781.x.
Rabanal, L.I., Kuehl, H.S., Mundry, R., Robbins, M.M., and Boesch, C., 2010, Oil prospecting and its impact on large rainforest mammals in Loango National Park, Gabon: Biological Conservation, v. 143, no. 4, p. 1017–1024, accessed August 21, 2023, at https://doi.org/10.1016/j.biocon.2010.01.017.
Rabin, L.A., Coss, R.G., and Owings, D.H., 2006, The effects of wind turbines on antipredator behavior in California ground squirrels (Spermophilus beecheyi): Biological Conservation, v. 131, no. 3, p. 410–420, accessed August 21, 2023, at https://doi.org/10.1016/j.biocon.2006.02.016.
Radtke, C., Autenrieth, D.A., Lipsey, T., and Brazile, W.J., 2017, Noise characterization of oil and gas operations: Journal of Occupational and Environmental Hygiene, v. 14, no. 8, p. 659–667, accessed August 21, 2023, at https://doi.org/10.1080/15459624.2017.1316386.
Reed, S.E., Boggs, J.L., and Mann, J.P., 2012, A GIS tool for modeling anthropogenic noise propagation in natural ecosystems: Environmental Modelling & Software, v. 37, p. 1–5, accessed August 21, 2023, at https://doi.org/10.1016/j.envsoft.2012.04.012.
Ryan, C.M., Cerveny, L.K., Robinson, T.L., and Blahna, D.J., 2018, Implementing the 2012 forest planning rule—Best available scientific information in forest planning assessments: Forest Science, v. 64, no. 2, p. 159–169, accessed August 21, 2023, at https://doi.org/10.1093/forsci/fxx004.
Sánchez, N.V., Sandoval, L., Hedley, R.W., St. Clair, C.C., and Bayne, E.M., 2022, Relative importance for Lincoln’s sparrow (Melospiza lincolnii) occupancy of vegetation type versus noise caused by industrial development: Frontiers in Ecology and Evolution, v. 10, article 810087, 15 p., accessed August 21, 2023, at https://doi.org/10.3389/fevo.2022.810087.
Sawyer, H., Beckmann, J.P., Seidler, R.G., and Berger, J., 2019, Long-term effects of energy development on winter distribution and residency of pronghorn in the Greater Yellowstone Ecosystem: Conservation Science and Practice, v. 1, no. 9, article e83, 11 p., accessed August 21, 2023, at https://doi.org/10.1111/csp2.83.
Sawyer, H., Kauffman, M.J., and Nielson, R.M., 2009, Influence of well pad activity on winter habitat selection patterns of mule deer: Journal of Wildlife Management, v. 73, no. 7, p. 1052–1061, accessed August 21, 2023, at https://doi.org/10.2193/2008-478.
Sawyer, H., Korfanta, N.M., Nielson, R.M., Monteith, K.L., and Strickland, D., 2017, Mule deer and energy development—Long-term trends of habituation and abundance: Global Change Biology, v. 23, no. 11, p. 4521–4529, accessed August 21, 2023, at https://doi.org/10.1111/gcb.13711.
Sawyer, H., Lambert, M.S., and Merkle, J.A., 2020, Migratory disturbance thresholds with mule deer and energy development: The Journal of Wildlife Management, v. 84, no. 5, p. 930–937, accessed August 21, 2023, at https://doi.org/10.1002/jwmg.21847.
Sawyer, H., Nielson, R.M., Lindzey, F., and McDonald, L.L., 2006, Winter habitat selection of mule deer before and during development of a natural gas field: Journal of Wildlife Management, v. 70, no. 2, p. 396–403, accessed August 21, 2023, at https://doi.org/10.2193/0022-541X(2006)70[396:WHSOMD]2.0.CO;2.
Scobie, C.A., Bayne, E.M., and Wellicome, T.I., 2016, Influence of human footprint and sensory disturbances on night-time space use of an owl: Endangered Species Research, v. 31, p. 75–87, accessed August 21, 2023, at https://doi.org/10.3354/esr00756.
Seavy, N.E., and Howell, C.A., 2010, How can we improve information delivery to support conservation and restoration decisions?: Biodiversity and Conservation, v. 19, no. 5, p. 1261–1267, accessed August 21, 2023, at https://doi.org/10.1007/s10531-009-9752-x.
Senzaki, M., Yamaura, Y., Francis, C.D., and Nakamura, F., 2016, Traffic noise reduces foraging efficiency in wild owls: Scientific Reports, v. 6, article 30602, 7 p., accessed August 21, 2023, at https://doi.org/10.1038/srep30602.
Shannon, G., Angeloni, L.M., Wittemyer, G., Fristrup, K.M., and Crooks, K.R., 2014, Road traffic noise modifies behaviour of a keystone species: Animal Behaviour, v. 94, p. 135–141, accessed August 21, 2023, at https://doi.org/10.1016/j.anbehav.2014.06.004.
Shannon, G., Crooks, K.R., Wittemyer, G., Fristrup, K.M., and Angeloni, L.M., 2016, Road noise causes earlier predator detection and flight response in a free-ranging mammal: Behavioral Ecology, v. 27, no. 5, p. 1370–1375, accessed August 21, 2023, at https://doi.org/10.1093/beheco/arw058.
Shannon, G., McKenna, M.F., Angeloni, L.M., Crooks, K.R., Fristrup, K.M., Brown, E., Warner, K.A., Nelson, M.D., White, C., Briggs, J., McFarland, S., and Wittemyer, G., 2016, A synthesis of two decades of research documenting the effects of noise on wildlife: Biological Reviews, v. 91, no. 4, p. 982–1005, accessed August 21, 2023, at https://doi.org/10.1111/brv.12207.
Shier, D.M., Lea, A.J., and Owen, M.A., 2012, Beyond masking—Endangered Stephen’s kangaroo rats respond to traffic noise with footdrumming: Biological Conservation, v. 150, no. 1, p. 53–58, accessed August 21, 2023, at https://doi.org/10.1016/j.biocon.2012.03.007.
Shonfield, J., and Bayne, E.M., 2017, The effect of industrial noise on owl occupancy in the boreal forest at multiple spatial scales: Avian Conservation and Ecology, v. 12, no. 2, 13 p., accessed August 21, 2023, at https://doi.org/10.5751/ACE-01042-120213.
Shonfield, J., and Bayne, E.M., 2019, Effects of industrial disturbance on abundance and activity of small mammals: Canadian Journal of Zoology, v. 97, no. 11, p. 1013–1020, accessed August 21, 2023, at https://doi.org/10.1139/cjz-2019-0098.
Sivian, L.J., and White, S.D., 1933, On minimum audible sound fields: Journal of the Acoustical Society of America, v. 4, p. 288–321, accessed August 21, 2023, at https://doi.org/10.1121/1.1915608.
Slabbekoorn, H., and Ripmeester, E.A., 2008, Birdsong and anthropogenic noise—Implications and applications for conservation: Molecular Ecology, v. 17, no. 1, p. 72–83, accessed August 21, 2023, at https://doi.org/10.1111/j.1365-294X.2007.03487.x.
Smith, W.J., Smith, S.L., Oppenheimer, E.C., and Devilla, J.G., 1977, Vocalizations of the black-tailed prairie dog, Cynomys ludovicianus: Animal Behaviour, v. 25, no. 1, p. 152–164, accessed August 21, 2023, at https://doi.org/10.1016/0003-3472(77)90078-1.
Sordello, R., Ratel, O., Flamerie De Lachapelle, F., Leger, C., Dambry, A., and Vanpeene, S., 2020, Evidence of the impact of noise pollution on biodiversity—A systematic map: Environmental Evidence, v. 9, no. 20, 27 p., accessed August 21, 2023, at https://doi.org/10.1186/s13750-020-00202-y.
Sorrels, J.L., Coburn, J., Bradley, K., and Randall, D., 2019, Flares, chap. 1 of Section 3.2—VOC destruction controls of Section 3—VOC Controls of EPA Air Pollution Control Cost Manual (7th ed.): Washington, D.C., U.S. Environmental Protection Agency, p. 71, accessed August 21, 2023, at https://www.epa.gov/economic-and-cost-analysis-air-pollution-regulations/cost-reports-and-guidance-air-pollution.
Stinchcomb, T.R., Brinkman, T.J., and Betchkal, D., 2020, Extensive aircraft activity impacts subsistence areas—Acoustic evidence from Arctic Alaska: Environmental Research Letters, v. 15, no. 11, article 115005, 10 p., accessed August 21, 2023, at https://doi.org/10.1088/1748-9326/abb7af.
Stinchcomb, T.R., Brinkman, T.J., and Fritz, S.A., 2019, A review of aircraft-subsistence harvester conflict in Arctic Alaska: Arctic, v. 72, no. 2, p. 131–150, accessed August 21, 2023, at https://doi.org/10.14430/arctic68228.
Sutter, G.C., Davis, S.K., Skiffington, J., Keating, L.M., and Pittaway, L.A., 2016, Nesting behaviour and reproductive success of Sprague’s pipit (Anthus spragueii) and vesper sparrow (Pooecetes gramineus) during pipeline construction: Canadian Field-Naturalist, v. 130, p. 99–109, accessed August 21, 2023, at https://doi.org/10.22621/cfn.v130i2.1833.
Wäldchen, J., and Mäder, P., 2018, Plant species identification using computer vision techniques—A systematic literature review: Archives of Computational Methods in Engineering, v. 25, no. 2, p. 507–543, accessed August 21, 2023, at https://doi.org/10.1007/s11831-016-9206-z.
Walker, B.L., Neubaum, M.A., Goforth, S.R., and Flenner, M.M., 2020, Quantifying habitat loss and modification from recent expansion of energy infrastructure in an isolated, peripheral greater sage-grouse population: Journal of Environmental Management, v. 255, article 109819, 15 p., accessed August 21, 2023, at https://doi.org/10.1016/j.jenvman.2019.109819.
Warrington, M.H., Curry, C.M., Antze, B., and Koper, N., 2018, Noise from four types of extractive energy infrastructure affects song features of Savannah sparrows: Condor, v. 120, no. 1, p. 1–15, accessed August 21, 2023, at https://doi.org/10.1650/CONDOR-17-69.1.
Webster, D.B., and Webster, M., 1972, Kangaroo rat auditory thresholds before and after middle ear reduction: Brain, Behavior and Evolution, v. 5, no. 1, p. 41–53, accessed August 21, 2023, at https://doi.org/10.1159/000123736.
Weisenberger, M.E., Krausman, P.R., Wallace, M.C., De Young, D.W., and Maughan, O.E., 1996, Effects of simulated jet aircraft noise on heart rate and behavior of desert ungulates: The Journal of Wildlife Management, v. 60, no. 1, p. 52–61, accessed August 21, 2023, at https://doi.org/10.2307/3802039.
Willems, J.S., Phillips, J.N., and Francis, C.D., 2022, Artificial light at night and anthropogenic noise alter the foraging activity and structure of vertebrate communities: Science of The Total Environment, v. 805, article 150223, 11 p., accessed August 21, 2023, at https://doi.org/10.1016/j.scitotenv.2021.150223.
Willems, J.S., Phillips, J.N., Vosbigian, R.A., Villablanca, F.X., and Francis, C.D., 2021, Night lighting and anthropogenic noise alter the activity and body condition of pinyon mice (Peromyscus truei): Ecosphere, v. 12, no. 3, article e03388, 18 p., accessed August 21, 2023, at https://doi.org/10.1002/ecs2.3388.
Witter, R.Z., McKenzie, L., Stinson, K.E., Scott, K., Newman, L.S., and Adgate, J., 2013, The use of health impact assessment for a community undergoing natural gas development: American Journal of Public Health, v. 103, no. 6, p. 1002–1010, accessed August 21, 2023, at https://doi.org/10.2105/AJPH.2012.301017.
Wyborn, C., Louder, E., Harrison, J., Montambault, J., Montana, J., Ryan, M., Bednarek, A., Nesshöver, C., Pullin, A., Reed, M., Dellecker, E., Kramer, J., Boyd, J., Dellecker, A., and Hutton, J., 2018, Understanding the impacts of research synthesis: Environmental Science & Policy, v. 86, p. 72–84, accessed August 21, 2023, at https://doi.org/10.1016/j.envsci.2018.04.013.
Glossary
- Acoustic environment
“the actual physical sound resources, regardless of audibility, at a particular location.” (NPS, 2013a, p. 94)
- Background sound level
“the [sound] level in a given environment without contributions from the source of interest.” (Ambrose and others, 2021, p. 25)
- Completion
“The installation of permanent wellhead equipment for the production of oil and gas.” (Colorado Oil and Gas Conservation Commission, 2022 [web page])
- Decibel (dB)
“a logarithmic measure of acoustic intensity, calculated by 10 log10 (sound intensity/reference sound intensity).” (Barber and others, 2010, p. 180)
- Decibel weighting
“auditory weighting functions transform sound measurements to take into account the frequency-dependent aspects of auditory sensitivity. They are mathematical functions used to emphasize frequencies where animals (human and nonhuman) are more sensitive and de-emphasize [sic] frequencies where animals are less sensitive.” (Houser and others, 2017, p. 1371–1372)
- Drilling
“The using of a rig and crew for the drilling, suspension, completion, production testing, capping, plugging and abandoning, deepening, plugging back, sidetracking, redrilling or reconditioning of a well (except routine cleanout and pump or rod pulling operations) or the converting of a well to a source, injection, observation, or producing well, and including stratigraphic tests. Also includes any related environmental studies. Associated costs include completion costs but do not include equipping costs.” (Colorado Oil and Gas Conservation Commission, 2022 [web page])
- Exploration phase
“The phase of operations which covers the search for oil and gas by carrying out detailed geological and geophysical surveys followed up where appropriate by exploratory drilling.” (Colorado Oil and Gas Conservation Commission, 2022 [web page])
- Field
“A geographical area under which an oil or gas reservoir lies.” (Colorado Oil and Gas Conservation Commission, 2022 [web page])
- Final reclamation
“To achieve final reclamation of a recently drilled dry hole, the well site must be recontoured to original contour or a contour that blends with the surrounding landform, stockpiled topsoil evenly redistributed, and the site revegetated. To achieve final reclamation of a formerly producing well, all topsoil and vegetation must be restriped from all portions of the old well site that were not previously reshaped to blend with the surrounding contour. All disturbed areas are then recontoured back to the original contour or a contour that blends with the surrounding landform, topsoil is redistributed, and the site revegetated.” (U.S. Department of the Interior and U.S. Department of Agriculture, 2007, p. 46–47)
- Flaring
“A high-temperature oxidation process used to burn waste gases containing combustible components such as volatile organic compounds (VOCs), natural gas (or methane), carbon monoxide (CO), and hydrogen (H2). The waste gases are piped to a remote, usually elevated location, and burned in an open flame in ambient air using a specially designed burner tip, auxiliary fuel, and, in some cases, assist gases like steam or air to promote mixing for nearly complete (e.g. [sic], ≥ 98% [sic]) destruction of the combustible components in the waste gas.” (Sorrels and others, 2019, chapter 1, p. 1).
- Fracturing
“A method of breaking down a formation by pumping fluid at very high pressures. The objective is to increase production rates from a reservoir.” (Colorado Oil and Gas Conservation Commission, 2022 [web page])
- Frequency (Hz and kHz)
“for a periodic signal, the maximum number of times per second that a segment of the signal is duplicated. For a sinusoidal signal, the number of cycles (the number of pressure peaks) in one second (Hz). Frequency equals the speed of sound (~340 ms-1) divided by wavelength.” (Barber and others, 2010, p. 180)
- Interim reclamation
“Interim reclamation consists of minimizing the footprint of disturbance by reclaiming all portions of the well site not needed for production operations. The portions of the cleared well site not needed for operational and safety purposes are recontoured to a final or intermediate contour that blends with the surrounding topography as much as possible. Sufficient level area remains for setup of a workover rig and to park equipment.” (U.S. Department of the Interior and U.S. Department of Agriculture, 2007, p. 45)
- Listening area
“the area of a circle whose radius is the [maximum distance at which a signal can be perceived]. Listening area is the same as the ‘active space’ of a vocalization, with a listener replacing the signaler as the focus, and is pertinent for organisms that are searching for sounds.” (Barber and others, 2010, p. 180)
- Leq (equivalent sound level)
“the logarithmic average (i.e. [sic], on an energy basis) of sound pressure levels over a specific time period. ‘Energy averaged’ sound levels are logarithmic values, and as such are generally much higher than arithmetic averages. Leq values are typically calculated for a specific time period (1-hour and 12-hour time periods are often used). Leq values are computed from all of the 1-second Leq values for the specific time period. Leq must be used carefully in quantifying natural ambient sound levels because occasional loud sound levels may heavily influence (increase) the Leq value, even though sound levels for that period of time are typically lower.” (Ambrose and Florian, 2014, p. 13–14)
- Lmax
“the maximum sound pressure level for a given period.” (Ambrose and Florian, 2014, p. 14)
- Lmin
“the minimum sound pressure level for a given period.” (Ambrose and Florian, 2014, p. 14)
- Lx (exceedance percentile)
“this metric is the sound pressure level (L), in decibels, exceeded x percent of the time for the specified measurement period. L50 is the sound pressure level exceeded 50 percent of the time (L50 is the same as the median).” (Ambrose and Florian, 2014, p. 14)
- Masking
“the amount or the process by which the threshold of detection for a sound is increased by the presence of the aggregate of other sounds.” (Barber and others, 2010, p. 180)
- Sound
“(a) Oscillation in pressure, stress, particle displacement, particle velocity, etc. [sic], propagated in a medium with internal forces (for example, elastic or viscous), or the superposition of such propagated oscillation. (b) Auditory sensation evoked by the oscillation described in (a).” (Acoustical Society of America, 2013, section 2.01)
- Sound exposure level
“A level quantity often used for auditory damage risk criteria * * *. This metric takes both level and duration of sound into account. Sound exposure is the time integral of the square of the instantaneous sound pressure.” (Houser and others, 2017, p. 1375)
- Sound power
“For a specified sound source, sound energy radiated per unit of time. Unit, watt (W); symbols, W or P.” (Acoustical Society of America, 2013, section 2.71)
- Sound power level (dB)
“Ten times the logarithm to the base ten of the ratio of a given sound power, in a stated frequency band, to the reference value for sound power.” (Acoustical Society of America, 2013, section 3.07)
- Sound pressure
“sound pressure is the instantaneous difference between the actual pressure produced by a sound wave and the average barometric pressure at a given point in space. Not all pressure fluctuations detected by a microphone are sound (e.g. [sic], wind over the microphone). Sound pressure is measured in Pascals (Pa), Newtons per square meter, which is the metric equivalent of pounds per square inch.” (Ambrose and Florian, 2014, p. 14)
- Sound pressure level (dB)
“the logarithmic form of sound pressure. Generally, sound pressure level refers to unweighted sound pressure levels of one-third octave bands.” (Ambrose and Florian, 2014, p. 14)
- Surface reclamation
“A restoration of the surface as for productivity or usefulness.” (Colorado Oil and Gas Conservation Commission, 2022 [web page])
Appendix 1. Results of Studies of the Effects of Noise from Oil and Gas Development on Ungulates, Rodents, and Leporids
Table 1.1.
Brief results from studies showing specific relationships between noise associated with oil and gas development and ungulate species in North America.[Note, findings from each study not specific to the effects of noise on ungulates are not included in this table. dB, decibel; m, meter; %, percent; dBC, C-weighted decibel; Hz, hertz]
| Noise type and description | Study system and geographic location | Season | Study findings related to the effects of noise from oil and gas development on ungulates | Intensity of effect (for example, duration of effect, spatial scale, or extent of effect) | Reference |
|---|---|---|---|---|---|
| Seismic exploration (simulated; 1 hour of exposure to 90–110 dB 2 m from the sources, occurring 1 second per minute 279–383 m from the test caribou) | Boreal mixed-woods and peatlands (Alberta) | Winter (January–March) | Noise treatment caused increased movement and habitat patch changes | Increased movement rate of approximately 43% for duration of 1-hour test period | Bradshaw and others (1997) |
| Increased rate of habitat patch changes of approximately 96% for duration of 1-hour test period | |||||
| Sound in an active oil and gas field in production phase (noise level measurements vary by site; reported continuously) | Mixed mountain shrub and pinyon-juniper woodlands (Colorado) | Winter | Increased vigilance (pauses during mastication) farther from natural gas facilities; no effect of distance to roads and well pads on vigilance | Long-term effects (chronic noise) 19% greater proportion of mastication bout spent vigilant at locations farthest from natural gas facilities compared to locations closest to natural gas facilities |
Lynch and others (2015) |
| Increased vigilance (pauses during mastication) in areas with moderate noise levels (quadratic relationship) | |||||
| Sound in an active oil and gas field in production phase (noise level measurements vary by site; reported continuously) | Mixed mountain shrub and pinyon-juniper woodlands (Colorado) | Spring, summer, fall (May–November) | Reduced habitat use in noisy sites | Long-term effect (chronic noise) | Kleist and others (2021) |
| 29% higher daily detection rate in the quietest sites compared to the loudest sites | |||||
| Drilling rig and generators (simulated; 3 weeks of continuous noise, 88 dBC at 50–20,000 Hz 15 m from the source; background sound level 40 dBC) | Boreal forests and peatlands (Québec) | Summer, fall (September–November) | Noise decreased habitat use around simulated drilling rigs and caused changes in distribution
of individuals Noise did not affect movement rate or home range size of individuals |
Effects lasted for the 3-week duration of the noise simulation experiment Individuals used areas that experienced greater than 70 dBC during the simulated noise 73% less than before and after the experiment; the avoidance zone was approximately 50–200 m around the simulated drilling rig |
Drolet and others (2016) |
Table 1.2.
Brief results from studies showing specific relationships between noise associated with oil and gas development and rodent and leporid species in North America.[Note, findings from each study not specific to the effects of noise on rodents or leporids are not included in this table. N/A, not applicable; spp., several species of; dBA, A-weighted decibel; %, percent]
| Noise type and description | Study system and geographic location | Study findings related to the effects of noise from oil and gas development on small mammals | Intensity of effect (for example, duration of effect, spatial scale, or extent of effect) | Reference |
|---|---|---|---|---|
| Sound in an active oil and gas field at wells with compressors, roads, and control sites at forest edges (effect of noise not isolated) | Upland boreal forest (Alberta) | No differences in abundance across sites | N/A | Shonfield and Bayne (2019) |
| Sound in an active oil and gas field at wells with compressors, roads, and control sites at forest edges (effect of noise not isolated) | Upland boreal forest (Alberta) | No differences in abundance across sites | N/A | Shonfield and Bayne (2019) |
| No differences in body mass across sites | ||||
| No differences in movement rates across sites | ||||
| Sound in an active oil and gas field at wells with and without compressors (noisy sites approximately 14 dBA louder than control sites; reported categorially) | Pinyon-juniper woodlands interspersed with sagebrush shrublands (New Mexico) | Increased mouse abundance at noisy sites | Long-term effect (chronic noise) | Francis and others (2012) |
| Mice were detected 18% more often at noisy sites | ||||
| Sound in an active oil and gas field at wells with and without compressors and artificial night lighting (noise level measurements vary by site; reported continuously) | Pinyon-juniper woodlands interspersed with sagebrush shrublands (New Mexico) | Reduced foraging efficiency of mice with increased noise | Long-term effect (chronic noise) | Willems and others (2022) |
| Small effect of noise relative to moonlight | ||||
| Sound in an active oil and gas field at wells with and without compressors and artificial night lighting (noise level measurements vary by site; reported continuously) | Pinyon-juniper woodlands interspersed with sagebrush shrublands (New Mexico) | No effect of noise on pinyon mouse abundance | Long-term effect (chronic noise) | Willems and others (2021) |
| Reduced pinyon mouse body condition with increased noise | Small effect of noise on body condition relative to dominant vegetation type and sex | |||
| Sound in an active oil and gas field at wells with compressors, roads, and control sites at forest edges (effect of noise not isolated) | Upland boreal forest (Alberta) | No differences in abundance across sites | N/A | Shonfield and Bayne (2019) |
| No differences in body mass across sites | ||||
| No differences in movement rates across sites | ||||
| Sound in an active oil and gas field in production phase (noise level measurements vary by site; reported continuously) | Mixed mountain shrub and pinyon-juniper woodlands (Colorado) | No effect of noise on leporid habitat use | N/A | Kleist and others (2021) |
References Cited
Bradshaw, C.J., Boutin, S., and Hebert, D.M., 1997, Effects of petroleum exploration on woodland caribou in northeastern Alberta: The Journal of Wildlife Management, v. 61, no. 4, p. 1127–1133, accessed August 21, 2023, at https://doi.org/10.2307/3802110.
Drolet, A., Dussault, C., and Côté, S.D., 2016, Simulated drilling noise affects the space use of a large terrestrial mammal: Wildlife Biology, v. 22, no. 6, p. 284–293, accessed August 21, 2023, at https://doi.org/10.2981/wlb.00225.
Francis, C.D., Kleist, N.J., Ortega, C.P., and Cruz, A., 2012, Noise pollution alters ecological services: enhanced pollination and disrupted seed dispersal: Proceedings of the Royal Society B, Biological Sciences, v. 279, no. 1739, p. 2727–2735, accessed August 21, 2023, at https://doi.org/10.1098/rspb.2012.0230.
Kleist, N.J., and Enns, K.D., 2021, USGS BiblioSearch—A python tool to facilitate searching, cleaning, and compiling of literature citations from across multiple databases: U.S. Geological Survey software release, accessed June 5, 2023, at https://doi.org/10.5066/P9EW8BO5.
Lynch, E., Northrup, J.M., McKenna, M.F., Anderson, C.R., Angeloni, L., and Wittemyer, G., 2015, Landscape and anthropogenic features influence the use of auditory vigilance by mule deer: Behavioral Ecology, v. 26, no. 1, p. 75–82, accessed August 21, 2023, at https://doi.org/10.1093/beheco/aru158.
Shonfield, J., and Bayne, E.M., 2019, Effects of industrial disturbance on abundance and activity of small mammals: Canadian Journal of Zoology, v. 97, no. 11, p. 1013–1020, accessed August 21, 2023, at https://doi.org/10.1139/cjz-2019-0098.
Willems, J.S., Phillips, J.N., and Francis, C.D., 2022, Artificial light at night and anthropogenic noise alter the foraging activity and structure of vertebrate communities: Science of The Total Environment, v. 805, article 150223, 11 p., accessed August 21, 2023, at https://doi.org/10.1016/j.scitotenv.2021.150223.
Willems, J.S., Phillips, J.N., Vosbigian, R.A., Villablanca, F.X., and Francis, C.D., 2021, Night lighting and anthropogenic noise alter the activity and body condition of pinyon mice (Peromyscus truei): Ecosphere, v. 12, no. 3, article e03388, 18 p., accessed August 21, 2023, at https://doi.org/10.1002/ecs2.3388.
Appendix 2. Ungulate and Small Mammal Hearing Capabilities
Ungulate Hearing Capabilities
Industrial and traffic noises associated with oil and gas development typically occur at sound pressure levels audible to North American ungulate species (Heffner and Heffner, 2010; Scobie and others, 2016; Perra and others, 2022). Ungulates have similar hearing capabilities across species (fig. 2.1; Flydal and others, 2001). Audiograms of hearing thresholds have been published for caribou (Flydal and others, 2001; Perra and others, 2022), white-tailed deer (Heffner and Heffner, 2010), and several domestic species (for example, Heffner and Heffner, 1983, 1990a).
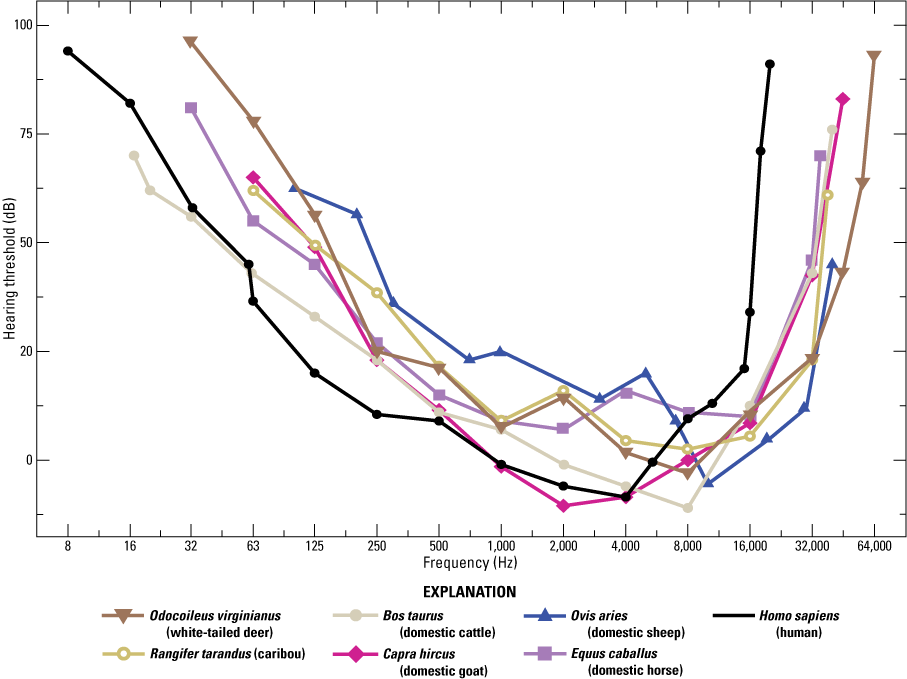
Average audiograms of six ungulate species. An average human audiogram is included for reference. Each point represents the average minimum sound pressure level (decibel [dB]) threshold at which the species can hear a sound at that frequency. Ungulates can generally hear sounds less than 25 dB at frequencies between 1,000 and 16,000 hertz [Hz]. All data are reproduced from Heffner (2023). Heffner (2023) cites previous publications as sources for data as follows: Odocoileus virginianus (white-tailed deer) data were previously published in Heffner and Heffner (2010); Rangifer tarandus (caribou) data were previously published in Flydal and others (2001); Bos taurus (domestic cattle) and Equus caballus (domestic horse) data were previously published in Heffner and Heffner (1983); Capra hircus (domestic goat) data were previously published in Heffner and Heffner (1990a); Ovis aries (domestic sheep) data were previously published in Wollack (1963); Homo sapiens (human) data were previously published in Sivian and White (1933), Jackson and others (1999), and ISO 226:1961 (International Organization for Standardization, 1961).
Rodent and Leporid Hearing Capabilities
Rodent and leporid hearing capabilities vary widely based on life history and anatomy of the ears (fig. 2.2; Heffner and Masterton, 1980; Jackson and others, 1997; Heffner and others, 2001), leading to potential variation in the magnitude of effects from loud, low-frequency industrial noises. Some rodents, including several species of mice (Acomys cahirinus [spiny mouse], house mouse, Phyllotis darwini [Darwin’s leaf-eared mouse]) and rats (Sigmodon hispidus [hispid cotton rat]), are unable to hear sounds with frequencies below 500 hertz (Heffner and Masterton, 1980; Heffner and others, 2001). In contrast, small mammals such as prairie dogs, Sciurus niger (fox squirrel), Oryctolagus cuniculus (domestic rabbit), and Dipodomys merriami (kangaroo rat) have been documented to have relatively better low-frequency hearing (fig. 2.2; Heffner and Masterton, 1980; Jackson and others, 1997). Other small mammals have restricted hearing capabilities. For example, Geomys bursarius (plains pocket gopher), a fossorial small mammal that spends most of its life underground, hears only a small range of frequencies, hears those frequencies only at high sound pressure levels, and has a poor ability to locate sound (fig. 2.2; Heffner and Heffner, 1990b).
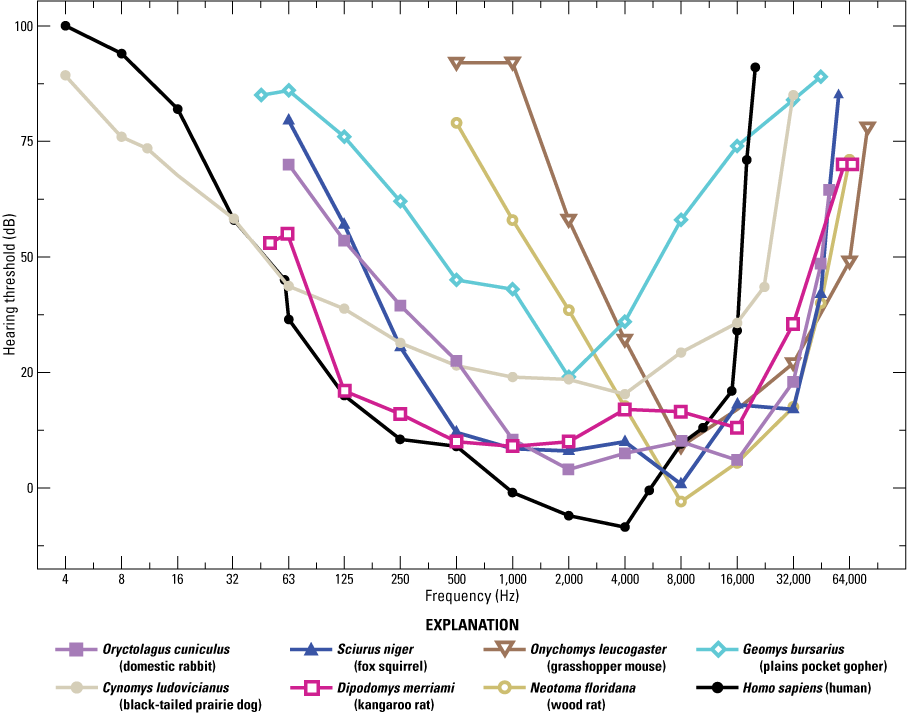
Average audiograms of seven small mammal species. An average human audiogram is included for reference. Each point represents the average minimum sound pressure level (decibel [dB]) threshold at which the species can hear a sound at that frequency (hertz [Hz]). Note the variation in low-frequency hearing thresholds. All data are reproduced from Heffner (2023). Heffner (2023) cites previous publications as sources for data as follows: Oryctolagus cuniculus (domestic rabbit) data were previously published in Heffner and Masterton (1980); Cynomys ludovicianus (black-tailed prairie dog) data were previously published in Heffner and others (1994); Sciurus niger (fox squirrel) data were previously published in Jackson and others (1997); Dipodomys merriami (kangaroo rat) data were previously published in Webster and Webster (1972) and Heffner and Masterton (1980); Onychomys leucogaster (grasshopper mouse) and Neotoma floridana (wood rat) data were previously published in Heffner and Heffner (1985); Geomys bursarius (plains pocket gopher) data were previously published in Heffner and Heffner (1990b); Homo sapiens (human) data were previously published in Sivian and White (1933), Jackson and others (1999), and ISO 226:1961 (International Organization for Standardization, 1961).
References Cited
Flydal, K., Hermansen, A., Enger, P.S., and Reimers, E., 2001, Hearing in reindeer (Rangifer tarandus): Journal of Comparative Physiology A, v. 187, no. 4, p. 265–269, accessed August 21, 2023, at https://doi.org/10.1007/s003590100198.
Heffner, H., and Masterton, B., 1980, Hearing in Glires—Domestic rabbit, cotton rat, feral house mouse, and kangaroo rat: The Journal of the Acoustical Society of America, v. 68, no. 6, p. 1584–1599, accessed August 21, 2023, at https://doi.org/10.1121/1.385213.
Heffner, H., Jr., and Heffner, H.E., 2010, The behavioral audiogram of whitetail deer (Odocoileus virginianus): The Journal of the Acoustical Society of America, v. 127, no. 3, p. EL111–EL114, accessed August 21, 2023, at https://doi.org/10.1121/1.3284546.
Heffner, H.E., 2023, Behavioral audiograms of mammals: The University of Toledo web page, accessed May 16, 2023, at https://www.utoledo.edu/al/psychology/research/psychobio/audiograms2.html.
Heffner, H.E., and Heffner, R.S., 1985, Hearing in two cricetid rodents—Wood rat (Neotoma floridana) and grasshopper mouse (Onychomys leucogaster): Journal of Comparative Psychology, v. 99, no. 3, p. 275–288, accessed August 21, 2023, at https://doi.org/10.1037/0735-7036.99.3.275.
Heffner, R.S., and Heffner, H.E., 1983, Hearing in large mammals: Horses (Equus caballus) and cattle (Bos taurus): Behavioral Neuroscience, v. 97, no. 2, p. 299–309, accessed August 21, 2023, at https://doi.org/10.1037/0735-7044.97.2.299.
Heffner, R.S., and Heffner, H.E., 1990a, Hearing in domestic pigs (Sus scrofa) and goats (Capra hircus): Hearing Research, v. 48, no. 3, p. 231–240, accessed August 21, 2023, at https://doi.org/10.1016/0378-5955(90)90063-U.
Heffner, R.S., and Heffner, H.E., 1990b, Vestigial hearing in a fossorial mammal, the pocket gopher (Geomys bursarius): Hearing Research, v. 46, no. 3, p. 239–252, accessed August 21, 2023, at https://doi.org/10.1016/0378-5955(90)90005-A.
Heffner, R.S., Heffner, H.E., Contos, C., and Kearns, D., 1994, Hearing in prairie dogs—Transition between surface and subterranean rodents: Hearing Research, v. 73, no. 2, p. 185–189, accessed August 21, 2023, at https://doi.org/10.1016/0378-5955(94)90233-X.
Heffner, R.S., Koay, G., and Heffner, H.E., 2001, Audiograms of five species of rodents—Implications for the evolution of hearing and the perception of pitch: Hearing Research, v. 157, no. 1–2, p. 138–152, accessed August 21, 2023, at https://doi.org/10.1016/S0378-5955(01)00298-2.
Jackson, L.L., Heffner, H.E., and Heffner, R.S., 1997, Audiogram of the fox squirrel (Sciurus niger): Journal of Comparative Psychology, v. 111, no. 1, p. 100–104, accessed August 21, 2023, at https://doi.org/10.1037/0735-7036.111.1.100.
Jackson, L.L., Heffner, R.S., and Heffner, H.E., 1999, Free-field audiogram of the Japanese macaque (Macaca fuscata): Journal of the Acoustical Society of America, v. 106, no. 5, p. 3017–3023, accessed August 21, 2023, at https://doi.org/10.1121/1.428121.
Perra, M., Brinkman, T., Scheifele, P., and Barcalow, S., 2022, Exploring auditory thresholds for reindeer, Rangifer tarandus: Journal of Veterinary Behavior, v. 52–53, p. 37–44, accessed August 21, 2023, at https://doi.org/10.1016/j.jveb.2022.05.002.
Scobie, C.A., Bayne, E.M., and Wellicome, T.I., 2016, Influence of human footprint and sensory disturbances on night-time space use of an owl: Endangered Species Research, v. 31, p. 75–87, accessed August 21, 2023, at https://doi.org/10.3354/esr00756.
Sivian, L.J., and White, S.D., 1933, On minimum audible sound fields: Journal of the Acoustical Society of America, v. 4, p. 288–321, accessed August 21, 2023, at https://doi.org/10.1121/1.1915608.
Webster, D.B., and Webster, M., 1972, Kangaroo rat auditory thresholds before and after middle ear reduction: Brain, Behavior and Evolution, v. 5, no. 1, p. 41–53, accessed August 21, 2023, at https://doi.org/10.1159/000123736.
Abbreviations
BLM
Bureau of Land Management
CFR
Code of Federal Regulations
CO
carbon monoxide
dB
decibel
dBA
A-weighted decibel
dBC
C-weighted decibel
dBF
flat frequency response
dBZ
Z-weighted decibel
FORT
Fort Collins Science Center
GIS
geographic information system
H2
hydrogen
Hz
hertz
L
sound pressure level
L50
the sound pressure level exceeded 50 percent of the timeframe of interest
L90
the sound pressure level exceeded 90 percent of the timeframe of interest
Leq
equivalent sound level
Lmax
maximum sound pressure level during the timeframe of interest
Lmin
minimum sound pressure level during the timeframe of interest
Lx
exceedance percentile
NEPA
National Environmental Policy Act
NMSim
Noise Model Simulation
NPS
National Park Service
SEL
sound exposure level
spp.
several species of
U.S.C.
United States Code
USGS
U.S. Geological Survey
VOC
volatile organic compound
Species Names
Common name
Scientific name
barred owl
Strix varia
bighorn sheep
Ovis canadensis
black-tailed prairie dog
Cynomys ludovicianus
boreal owl
Aegolius funereus
burrowing owl
Athene cunicularia
caribou
Rangifer tarandus
Darwin's leaf-eared mouse
Phyllotis darwini
deer mouse
Peromyscus maniculatus
domestic cattle
Bos taurus
domestic goat
Capra hircus
domestic horse
Equus caballus
domestic rabbit
Oryctolagus cuniculus
domestic sheep
Ovis aries
eastern chipmunk
Tamias striatus
elk
Cervus elaphus
fox squirrel
Sciurus niger
grasshopper mouse
Onychomys leucogaster
great horned owl
Bubo virginianus
greater sage-grouse
Centrocercus urophasianus
hare
Lepus spp.
hispid cotton rat
Sigmondon hispidus
house mouse
Mus musculus
human
Homo sapiens
kangaroo rat
Dipodomys merriami
juniper
Juniperus spp.
mice
Peromyscus spp.
moose
Alces alces
Mount Graham red squirrel
Tamiasciurus hudsonicus grahamensis
mountain goat
Oreamnos americanus
mule deer
Odocoileus hemionus
muskox
Ovibos moschatus
northern saw-whet owl
Aegolius acadicus
pinyon
Pinus spp.
pinyon mouse
Peromyscus truei
plains pocket gopher
Geomys bursarius
polar bear
Ursus maritimus
pronghorn
Antilocapra americana
pygmy rabbit
Brachylagus idahoensis
rabbit
Sylvilagus spp.
roe deer
Capreolus capreolus
sagebrush
Artemisia spp.
southern red-backed vole
Myodes gapperi
spiny mouse
Acomys cahirinus
Stephens' kangaroo rat
Dipodomys stephensi
white-footed mouse
Peromyscus leucopus
white-tailed deer
Odocoileus virginianus
wood rat
Neotoma floridana
woodland caribou
Rangifer tarandus caribou
Publishing support provided by the Science Publishing Network,
Denver Publishing Service Center
For more information concerning the research in this report, contact the
Center Director, USGS Fort Collins Science Center
2150 Centre Ave., Bldg. C
Fort Collins, CO 80526-8118
(970) 226-9100
Or visit the Fort Collins Science Center website at:
Disclaimers
Any use of trade, firm, or product names is for descriptive purposes only and does not imply endorsement by the U.S. Government.
Although this information product, for the most part, is in the public domain, it also may contain copyrighted materials as noted in the text. Permission to reproduce copyrighted items must be secured from the copyright owner.
Suggested Citation
Rutherford, T.K., Maxwell, L.M., Kleist, N.J., Teige, E.C., Lehrter, R.J., Gilbert, M.A., Wood, D.J.A., Johnston, A.N., Mengelt, C., Tull, J.C., Haby, T.S., and Carter, S.K., 2023, Effects of noise from oil and gas development on ungulates and small mammals—A science synthesis to inform National Environmental Policy Act analyses (ver. 1.1, July 2024): U.S. Geological Survey Scientific Investigations Report 2023–5114, 44 p., https://doi.org/10.3133/https://doi.org/10.3133/sir20235114.
ISSN: 2328-0328 (online)
| Publication type | Report |
|---|---|
| Publication Subtype | USGS Numbered Series |
| Title | Effects of noise from oil and gas development on ungulates and small mammals—A science synthesis to inform National Environmental Policy Act analyses |
| Series title | Scientific Investigations Report |
| Series number | 2023-5114 |
| DOI | 10.3133/sir20235114 |
| Edition | Version 1.0: October 2023; Version 1.1: July 2024 |
| Publication Date | October 25, 2023 |
| Year Published | 2023 |
| Language | English |
| Publisher | U.S. Geological Survey |
| Publisher location | Reston, VA |
| Contributing office(s) | Fort Collins Science Center |
| Description | x, 44 p. |
| Online Only (Y/N) | Y |