

Highway-Runoff Quality From Segments of Open-Graded Friction Course and Dense-Graded Hot-Mix Asphalt Pavement on Interstate 95, Massachusetts, 2018–21
Links
- Document: Report (4.80 MB pdf) , HTML , XML
- Data Release: USGS data release - Highway-monitoring data from segments of open-graded friction course and dense-graded hot-mix asphalt pavement in eastern Massachusetts, 2018–2021
- NGMDB Index Page: National Geologic Map Database Index Page (html)
- Download citation as: RIS | Dublin Core
Acknowledgments
The authors express their gratitude to Henry L. Barbaro, Stormwater Program Supervisor, Massachusetts Department of Transportation (MassDOT) for overall support throughout the project; Edward Naras, Pavement Supervisor, and Kevin Fitzgerald, Pavement Engineer, MassDOT, for their instrumental role in incorporating a section of dense-graded hot-mix asphalt into the Needham, Massachusetts, study area on Interstate 95; John Anthony, Survey Supervisor, MassDOT, for coordinating pavement elevation surveys of the study area sites; and Robert Hutcheon, Operations, District 6, MassDOT, for coordinating traffic control for semiannual permeameter tests.
The authors also thank Denise Argue, Leslie DeSimone, and Katherine Merriman of the U.S. Geological Survey (USGS) for their substantive technical reviews and Meghan Santos and Robert Bradley of the USGS for their reviews of continuous-monitoring records.
Abstract
Highway runoff is a source of sediment and associated constituents to downstream waterbodies that can be managed with the use of stormwater-control measures that reduce sediment loads. The use of open-graded friction course (OGFC) pavement has been identified as a method to reduce loads from highway runoff because it retains sediment in pavement voids; however, few datasets are available in New England to characterize runoff quality from OGFC pavement. To meet this data need, the U.S. Geological Survey, in cooperation with the Massachusetts Department of Transportation, conducted a field study from October 2018 through September 2021 to monitor runoff from a section of traditional dense-graded hot-mix asphalt (HMA) and from a section of OGFC pavement on Interstate 95 near Needham, Massachusetts. A robust dataset that includes suspended sediment concentrations for nearly every runoff event during the study period was generated to compare runoff from the two 4,180-square-foot sections of highway pavement under identical traffic volume and maintenance characteristics.
Automatic-monitoring techniques were used to collect over 6,500 samples at each station to characterize all runoff-generating events during the study period (226 events for the HMA site and 168 events for the OGFC site). Suspended sediment concentrations were consistently lower in runoff from the OGFC pavement throughout the study period, with median event-mean concentrations for all runoff events of 29 and 15 milligrams per liter for the HMA and OGFC sites, respectively. The total load of sediment less than 6.0 millimeters in diameter from the HMA section (202 kilograms [kg]) was 41 percent greater than the load measured from the OGFC pavement (120 kg), and the total load of sediment less than 2.0 mm in diameter was 49 percent greater (168 kg and 85 kg from the HMA and OGFC sites, respectively). The greatest differences in loads between the two pavement segments were in the particle-size ranges less than 2.0 millimeters in diameter, indicating that these particles are retained by the voids in the OGFC pavement. The relative difference between annual sediment-load estimates at each site over the study period indicates that OGFC pavement became clogged, a condition that permeameter test results also reflected. Specifically, the average total load of sediment for the first 2 years of the study was 68 percent lower at the OGFC site than the HMA site, but the difference between the respective loads decreased to 19 percent in the third year of the study.
Study-period loads for most total-recoverable metals in runoff from each pavement type were between 7 and 64 percent higher from the HMA site, except for loads of arsenic, cadmium, and zinc, which were higher from the OGFC pavement. Study-period loads for total phosphorus were similar from each pavement type. Despite the same application rate of deicing chemicals, sodium and chloride loads in runoff were about two times greater from the OGFC section than from the HMA pavement during years with average snowfall amounts but were approximately equal at both sites during the mild winter in 2020.
Introduction
Highway runoff can adversely affect the quality of receiving water and may result in the failure of a waterbody to meet Massachusetts’ surface-water-quality standards or in the development of conditions that exceed aquatic-life criteria. Many studies have shown that highway runoff can be a source of suspended solids, sediment, nutrients, and metals (Breault and Granato, 2000; Smith, 2002; Kayhanian and others, 2003; Smith and Granato, 2010). The Massachusetts Department of Transportation (MassDOT) is responsible for implementing structural- and nonstructural-source control methods to reduce the loading of various constituents from roadway surfaces to receiving waterbodies while adhering to transportation-safety standards. Land adjacent to highways is often unavailable for the construction of structural-source controls (for example, wet ponds or gravel wetlands) used to treat highway runoff, and routine use of nonstructural-source controls (street sweeping) is generally not practical or feasible on major highways. Therefore, structural-source controls that can be implemented on the highway surface are desirable to achieve reductions in constituent loads from runoff.
The application of an open-graded friction course (OGFC) pavement layer to the highway surface is a linear, structural-source control that can provide both water-quality and safety benefits by conveying runoff from the roadway through the porous OGFC layer instead of over the pavement surface. OGFC pavement, which is often referred to by colloquial names, such as porous pavement, plant mix seal, popcorn-mix pavement, concrete friction course, and permeable European mix, should not be confused with pervious pavement that allows rainfall to percolate from the paved surface to the soil below the pavement. OGFC pavement consists of a layer of permeable pavement (usually 1–2 inches [in.] in depth) that spreads over the surface of traditional impervious dense-graded hot-mix asphalt (HMA) where runoff that drains into the OGFC layer moves laterally to the pavement edge. OGFC pavement is composed of coarse and fine aggregates, as well as asphalt binder and stabilizing additives (Cooley and others, 2009). The proportions of coarse and fine aggregates in the pavement mix are designed to create void space. Unlike traditional HMA, which has 4 to 6 percent air-void content (Asphalt Institute, 2015), OGFC pavements typically have air-void content ranging from 12 to 22 percent (Cooley and others, 2009). The air-void content of an OGFC mix and the thickness of the layer applied to the highway surface are selected to achieve a desired minimum permeability specification that is determined on the basis of local climate characteristics (such as rainfall volume and intensity). Rain and meltwater flow through the void structure of OGFC pavement, but the structure can limit the movement of sediment (including solids, natural organic matter, pavement particles, and other anthropogenic particles—herein referred to as sediment). Because a portion of this sediment becomes trapped in the OGFC void structure, studies have demonstrated that the use of OGFC pavement reduces the loads of sediment and sediment-associated constituents in highway runoff (Eck and others, 2012; Sampson and others, 2014). Furthermore, safety benefits that result from the removal of runoff from the pavement surface are achieved, such as reductions in noise, vehicular spray, nighttime surface glare during rain, undercarriage washoff, and hydroplaning and increases in wet pavement friction (Mallick and others, 2000; A.P. Greibe, 2002, as presented in National Academies of Sciences, Engineering, and Medicine [NASEM], 2009; Root, 2009; Winston and others, 2012). However, these benefits can diminish over time because pavement permeability decreases as the void structure of OGFC becomes clogged with sediment. Therefore, the service life, the period over which the pavement structure remains intact, is expected to exceed that of the performance life, the period over which the safety and water-quality benefits persist.
MassDOT has adopted the use of OGFC as the standard wearing surface for limited-access highways in parts of Massachusetts on the basis of many of the original design specifications that provide safety and water-quality benefits. Although studies have demonstrated these benefits, variability in the characteristics of study locations (for example, traffic volume, climate, and OGFC composition) and study-design parameters (for example, sampling frequencies and methods) may limit the transferability of results. The existing data collected in the United States on the water-quality benefits of OGFC are generally limited to highways with average traffic volumes of 17,000 to 60,000 vehicles per day in North Carolina and Texas, where the climate is substantially different from that of Massachusetts. Furthermore, the standard OGFC gradation specification used by MassDOT, which refers to the size ranges of aggregates that compose the OGFC mix, differs from those implemented in other parts of the country; for example, gradations used by MassDOT are finer than those specified by Texas (Texas Department of Transportation, 2004). Because OGFC is widely implemented by MassDOT, scientifically defensible data are needed to help evaluate OGFC as a linear, structural-source control for the protection of the quality of receiving waters and aquatic life. Monitoring runoff quality and pavement conditions associated with HMA and OGFC pavement can improve understanding of the water-quality benefits that this pavement can provide in Massachusetts and other New England States.
Purpose and Scope
To provide information on the quality and volume of highway runoff from OGFC pavement, the USGS, in cooperation with MassDOT, designed this study to monitor a section of OGFC pavement and an adjacent section of traditional HMA pavement under identical traffic volume and maintenance practices on Interstate 95 near Needham, Massachusetts, during a 3-year study period from October 1, 2018, through September 30, 2021 (water years1 [WYs] 2019–21; table 1). The study sites were designed to capture runoff from each highway section and convey it through a monitoring structure, where discharge measurements and runoff samples were collected to characterize highway-runoff quantity and quality for all runoff-generating events during the study period. This report documents the study area and site characteristics, data collection methods, quality control methods and results, analytical methods, and resulting concentrations and loads of suspended sediment (SS), salt (chloride [Cl] and sodium [Na]), and sediment-associated constituents (total phosphorus [TP] and total-recoverable metals) conveyed from the highway surface by runoff, wind, or vehicle turbulence from each type of pavement. The sediment loads and concentrations are also characterized by particle-size distribution because OGFC pavement only accommodates sediment particles that are finer than the void spaces. The pavement sections were monitored to evaluate the frequency of various wet and icy road-weather conditions, and permeability of the OGFC pavement was measured semiannually during the study period to provide information about whether the pavement was becoming clogged.
A water year is the period between October 1 and September 30 and is designated by the year in which it ends.
Table 1.
U.S. Geological Survey station numbers, locations, and other highway attributes for highway monitoring sites along Interstate 95 near Needham, Massachusetts, 2018–21.[Traffic volume data from Massachusetts Department of Transportation (2023). Locations of stations are shown in figure 1. USGS, U.S. Geological Survey; ADT, average daily traffic]
Previous Investigations
Oregon was the first State to experiment with OGFC mixes in the 1930s (NASEM, 2009). Since then, improved formulations of OGFC have been used throughout the United States (Mallick and others, 2000; Kandhal, 2002; Cooley and others, 2009). Because of its widespread implementation, studies have been conducted to characterize the water-quality benefits of applying a layer of OGFC to roadways. For example, when Winston and others (2012) compared studies and study locations in North Carolina, they found that concentrations of sediment in runoff (measured as total suspended solids [TSS]) from porous pavement sites are between 69 and 95 percent lower than runoff from dense-graded asphalt. They also found that these reductions result in lower concentrations of TP. Barrett and others (2006) also report concentration reductions due to porous pavement (94 percent for TSS; 75 percent for total-recoverable copper; 93 percent for total-recoverable lead) in a comparison of runoff from dense-graded asphalt and runoff from porous pavement subsequently applied at the same monitoring location in Texas. However, Barrett and others (2006) indicated that these reductions did not extend to dissolved constituents, such as nitrate and nitrite, dissolved copper and zinc, and dissolved phosphorus. Eck and others (2012) concluded from data for three monitoring locations in Texas that concentrations of TSS or sediment-associated constituents were lower in runoff from OGFC pavement (greater than 90 percent for TSS and total-recoverable lead; 56 to 69 percent for total-recoverable copper; 87–90 percent total-recoverable zinc) than from traditional HMA pavement. The durations of these studies varied from 8 months to 6 years, which resulted in sample sizes between 5 and 48.
Although the service life of OGFC is expected to exceed the performance life, studies to characterize the performance life have yielded variable results. These findings may be due, in part, to the limitations on study design, such as study duration and number of samples, as well as the variability in study location characteristics. The service life of OGFC is expected to last between 7 and 12 years (Barrett, 2008; Cooley and others, 2009; Watson and others, 2018); raveling (dislodgment of the aggregate materials) and cracking are reported as common causes for failure (Huber, 2000). The performance life can vary substantially depending on mix specifications, sedimentation, and maintenance. Findings reported by Eck and others (2012), who examined TSS concentrations in runoff from OGFC pavement at 3 locations in Texas with pavement ages between 0 and 5 years and 4 locations in North Carolina with pavement ages between 8 and 10 years, indicate that OGFC can provide water-quality improvements throughout its service life. However, others have demonstrated that the water-quality benefits of OGFC decline over time as the permeability of the pavement decreases as sediment is retained in the pavement void structure (Isenring and others, 1990; Moores and others, 2013). The clogging of porous pavement may be prevented intentionally through maintenance practices, but evidence indicates that a “self-cleaning” action may also occur when traffic volume and speed are sufficient (Van Heystraeten and Moraux, 1990). The available research on OGFC pavement reflects substantial variability in performance, which indicates that local studies are required to provide accurate information about this linear structural source-control measure.
Study Area and Site Characteristics
The segments of HMA and OGFC pavement that were monitored in this study are on Interstate 95 near Needham, Massachusetts (fig. 1). At this location, Interstate 95 runs north to south through a residential and commercial area. The average daily traffic volume for Interstate 95 at the study location is generally greater than 155,000 vehicles per day but decreased in 2020 because of the COVID–19 pandemic (table 1; Massachusetts Department of Transportation, 2023). This section of highway is relatively straight with a slight grade banking to the east and contains 8 travel lanes and 2 breakdown lanes separated by a concrete median barrier (fig. 1). In August 2018, Interstate 95 was resurfaced with OGFC (fig. 2), except for a full-width 328 feet (ft) segment of southbound highway that was resurfaced with dense-graded HMA to serve as a control section for comparison with the OGFC pavement. A minimum 15-percent air-void structure was specified for the OGFC layer, resulting in a minimum permeability specification of about 64 inches per hour (in/hr) (Kevin Fitzgerald, MassDOT, written commun., 2018). The OGFC mix contains an asphalt-rubber binder that was created, in part, from vulcanized rubber processed from automobile and truck tires. About 90 to 95 percent of the OGFC aggregate at the study site is within a range of 2.36 to 12.5 millimeters (mm) in diameter, and the remaining 5 to 10 percent is less than 2.36 mm in diameter (table 2). The MassDOT OGFC mix contains no aggregates greater than 12.5 mm in diameter, but in some other States, as much as 45 percent of the OGFC mix may be greater than 12.5 mm in diameter (table 2). There is substantial variability among OGFC mixes used in the United States, as demonstrated by the ranges in aggregate-size distributions reported in table 2.
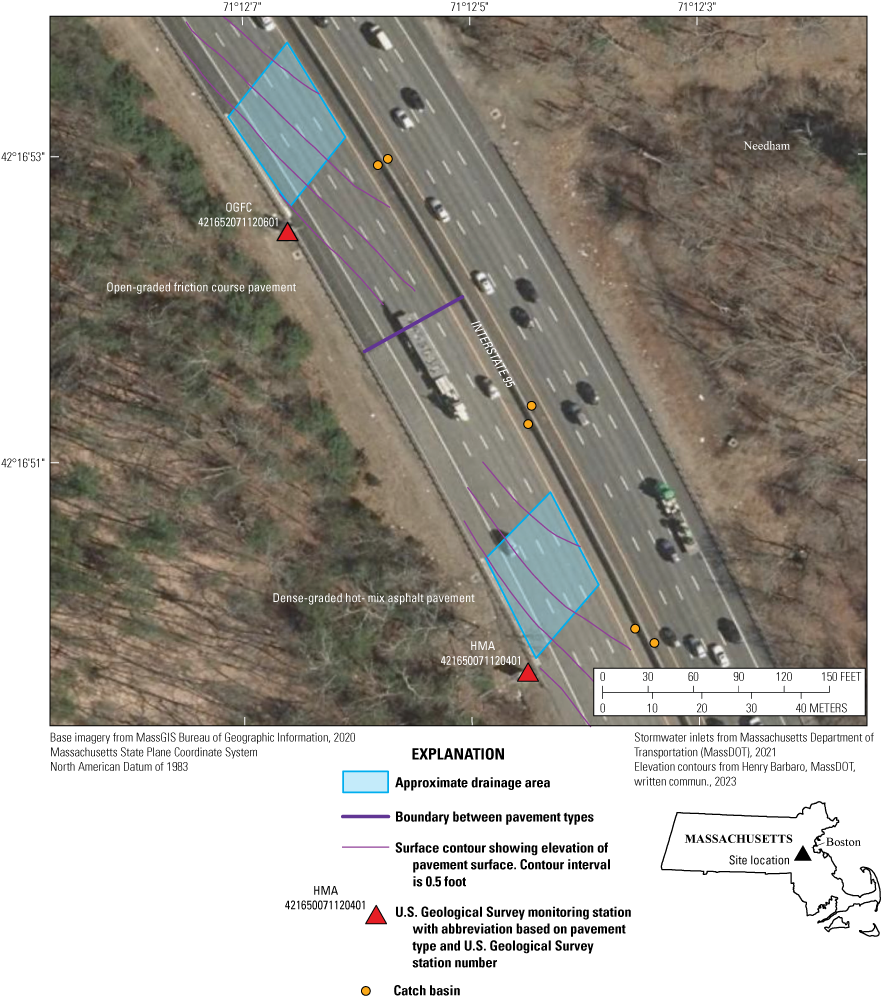
Locations of U.S. Geological Survey highway monitoring stations (421650071120401; 421652071120601) on Interstate 95 near Needham, Massachusetts, October 1, 2018, and September 30, 2021. Linear trench drains are colocated with the approximate drainage-area boundary adjacent to the highway monitoring stations. HMA, hot-mix asphalt; OGFC, open-graded friction course.
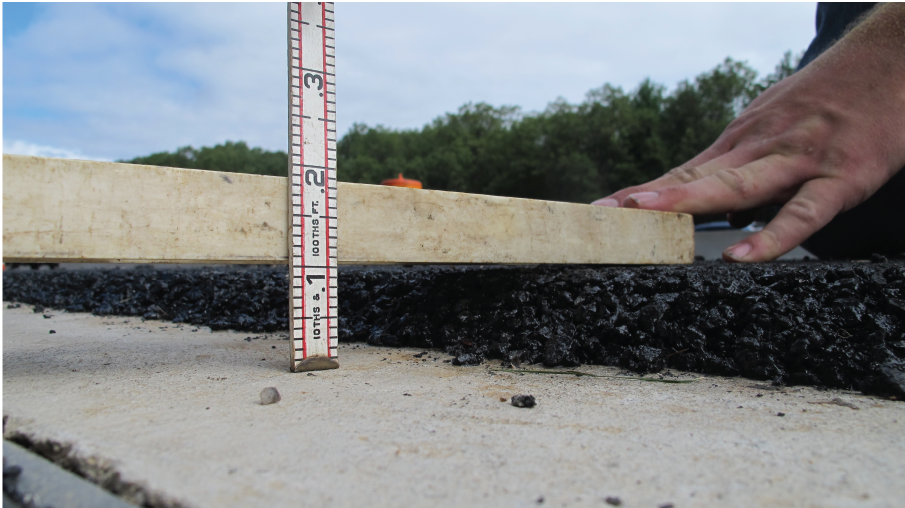
Photograph of open-graded friction course (OGFC) pavement layer that is 0.1 foot thick near the highway trench at U.S. Geological Survey station 421652071120601, on Interstate 95 near Needham, Massachusetts, 2018. Station location shown on figure 1. Photograph by the U.S. Geological Survey.
Table 2.
Ranges of aggregate-size distributions in the design of open-graded friction course pavement mixes in 19 States and at U.S. Geological Survey station 421652071120601, on Interstate 95 near Needham, Massachusetts.[Data are from a survey of transportation agencies reported by Cooley and others (2009). Ranges for OGFC in this study are from Kevin Fitzgerald (Massachusetts Department of Transportation, written commun., 2018). States may have reported more than one mix design with differing aggregate-size distributions. The number of States indicates the number of States that reported a pavement mix with specifications for a particular aggregate size. For each aggregate size, the minimum allowable range and maximum allowable ranges are given. OGFC, open-graded friction course; NA, not applicable]
Conveyance systems were installed adjacent to the highway that were designed to monitor runoff from a 4,180 square-foot (ft2) area of each pavement type (fig. 1). The systems convey runoff from the pavement into a linear trench that drains into a manhole equipped with a weir box and monitoring instruments (fig. 3). The trenches were installed by MassDOT along the southbound breakdown lane adjacent to each pavement section (fig. 4A). The trenches also serve as the western boundary of each pavement drainage area because runoff flows from east to west and includes four travel lanes and the breakdown lane (fig. 1). The linear trenches were constructed of presloped fiberglass sections with slotted cast-iron grates that meet highway semitruck 20-ton loading specifications. The trench adjacent to the HMA pavement was installed 157 ft south of the transition from the OGFC pavement, also referred to as the pavement boundary. The trenches (0.66 ft wide by 72 ft long) were embedded in concrete flush with the pavement course beneath the OGFC and flush with the HMA pavement surface to collect runoff from the highway. The south end of each trench terminated at an 8-in.-diameter polyvinyl chloride (PVC) pipe that diverted runoff to a metering manhole opposite the guardrail (fig. 4B). The highway was not curbed, and the shoulder area sloped away from the pavement at each test location to prevent shoulder sediments from draining into the trenches.
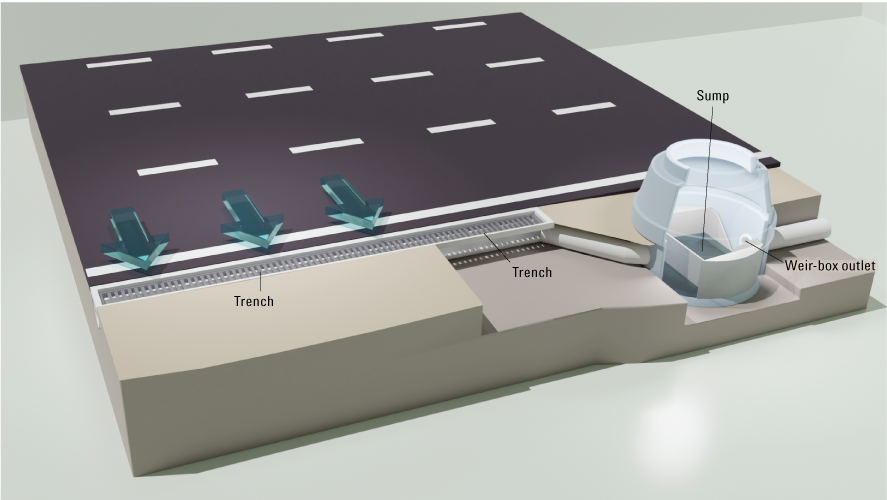
A three-dimensional diagram of the monitoring stations that shows locations of sample collection from the trench, weir sump, and weir-box outlet (not to scale).
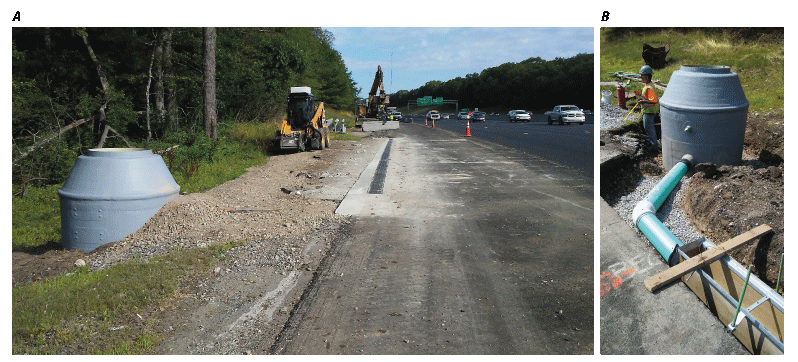
A, B, Photographs of the installation of the trench and metering manhole near the dense-graded hot-mix asphalt (HMA) at U.S. Geological Survey station 421650071120401, on Interstate 95 near Needham, Massachusetts, 2018. Station location shown on figure 1. Photographs by Henry L. Barbaro, Massachusetts Department of Transportation, used with permission.
Runoff from each trench drained into a prefabricated fiberglass metering manhole with an integrated weir box located about 5 ft from the breakdown lane, at the end of the trench opposite of the guardrail. The weir box is the structure that runoff flows through (fig. 5A); it includes a baffle plate, sump, and V-notch weir plate. The weir sump is the bottom of the weir box where water and sediment were retained between runoff events. The weir box was located below the frost zone to provide a thermally stable environment that was less prone to freezing. This location enabled the collection of water samples year-round during the study period. The weir box is approximately 4 ft long by 3 ft wide, with a standing pool of water below the weir notch of 1.3 ft. The vertical baffle plate was installed about 0.7 ft from the inlet of the weir box. Discharge was measured from a stainless-steel, 90-degree, thin-plate weir with a maximum discharge capacity of 1.17 cubic feet per second (ft3/s). The capacity of the weir was sufficient to characterize all discharge rates during the study period at each site. Discharge measurements were determined from gage-height measurements on the basis of a known relation between gage height and discharge over the weir.
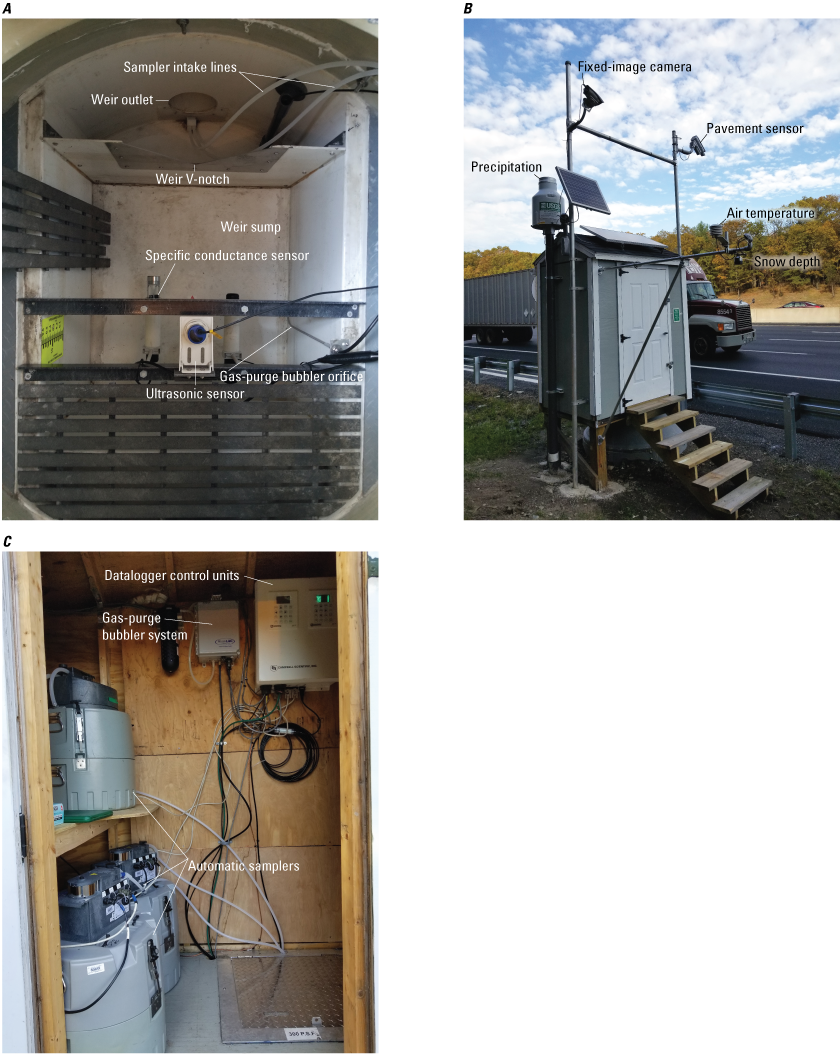
A, A top-down view of the weir box in the metering manhole, B, the highway monitoring station shelter adjacent to open-graded friction course (OGFC) pavement, and C, the instrumentation inside the monitoring shelter at U.S. Geological Survey station 421652071120601 on Interstate 95 near Needham, Massachusetts, 2018. Station location shown on figure 1. Photographs by the U.S. Geological Survey.
Shelters were constructed on top of each manhole at the monitoring stations adjacent to the HMA and OGFC pavement sections. The shelters housed monitoring systems used to operate the gage-height, specific conductance, and water-temperature sensors located in the weir box (fig. 5B–C). These systems also operated the automatic sampling equipment that was used to collect water samples during runoff-generating events. On masts attached to the outside of the shelters, noncontact pavement sensors were installed to measure pavement surface temperature and pavement conditions (specifically, road-weather conditions). Other sensors installed on the shelters collected meteorological data, including precipitation, snow depth, air temperature, and wind speed, to characterize storm events, dry periods, and winter weather. A battery bank maintained by a solar array at each station provided power to the monitoring systems and sensors.
Data Collection Methods
The methodology described herein includes a description of the data collection and analytical methods for samples of highway runoff and sediment. Continuous-monitoring and sampling systems were installed and operated from October 2018 through September 2021 at the HMA (USGS station number 421650071120401) and OGFC monitoring stations (USGS station number 421652071120601) (table 1). Prior to this period, the entire conveyance system, including the trench, pipes, and weir sump, was thoroughly cleaned to remove all sediment retained in the system during the construction period. Continuous measurements of discharge, water-quality, meteorological, and pavement parameters were recorded, and both discrete and composite samples of highway runoff were collected at each monitoring station. Highway sediments retained within the trench drain and weir sump were periodically removed, quantified, and sampled for chemical analyses. Pavement permeameter tests were collected semiannually in the breakdown lane and first travel lane at the OGFC site. Continuous records of discharge and specific conductance were used to estimate event-mean concentrations (EMCs) for Cl and Na for each runoff event.
Continuous-Monitoring Data
Automatic-monitoring techniques were used to collect continuous measurements of physical parameters at the monitoring stations from October 2018 through September 2021. Each station was equipped with a digital modem to transmit stored data and to enable the monitoring systems to be remotely programmed. Visits to the study sites were generally made on a weekly basis to collect samples and verify the accuracy of the sensor data. Continuous data collected during this study are published in the U.S. Geological Survey (USGS) National Water Information System (NWIS; U.S. Geological Survey, 2023b).
The dataloggers at each monitoring station were programmed to make gage-height (water level) measurements every minute. Baseline data (data that are recorded regardless of the state of runoff), including gage height, water temperature, and specific conductance, were recorded every 10 minutes, but recording increased to a 1-minute basis whenever the gage height exceeded 0.03 ft. Gage height in each weir box (fig. 5A) was measured by a gas-purge bubbler system and a National Institute of Standards and Technology traceable pressure sensor. Measurements made by this system were corrected for density effects that resulted from salt-laden runoff during the winter seasons by using concurrent measurements of specific conductance. Redundant measurements of gage height were made with a submersible pressure sensor and by an ultrasonic sensor. The ultrasonic sensor was recorded by a secondary logging system to reduce the likelihood of data loss during the monitoring period. Secondary gage-height measurements also were used to check the accuracy of the primary measurements. Continuous measurements of gage height were converted to continuous-discharge values by programming the dataloggers with the gage height-discharge relation for the weir (Rantz and others, 1982). A conductivity and water-temperature probe was mounted just below the static water surface in the weir box. The accuracy of measurements of specific conductance depends primarily on the amount of sensor drift and fouling. Corrections for fouling and drift, which were minimal, were applied to the data to improve the accuracy (Wagner and others, 2006). These corrections were made on the basis of the performance of the sensor before and after sensor maintenance and the response of the clean sensor after it was placed in three or more certified conductance standard solutions in the field.
Precipitation, snow-depth, and air-temperature data were measured at the OGFC monitoring station at a recording frequency of 5 minutes. Precipitation was measured with an electronic weighing-bucket gage having a 31-square-inch (in2) collection area and mounted about 10 ft above the ground surface. Snow depth was measured with a temperature-corrected ultrasonic sensor mounted about 7 ft above the ground surface on the south side of the monitoring shelter to shield the measurement area from snow plowing (fig. 5B). Nonfrozen precipitation (rainfall) was measured to estimate the volume of runoff based on the drainage area of each site, and the estimated volumes were used to determine flow-proportional sampling thresholds and runoff coefficients. In July 2020, two-dimensional sonic anemometers were installed to measure wind speed. The instruments were mounted about 1.3 ft from the ground surface at the center point of each trench near the guardrail. The sensors were operated during the summer and fall months and temporarily removed during the winter period. An anemometer also was installed above the roof line on the HMA shelter and was left in place for the duration of the study. Each sensor was mounted to correspond to a true-north bearing. Wind data were collected to better understand the prevailing direction and magnitude of wind as it relates to the transport of sediment from the road surface. Measurements were internally processed by the datalogger every 10 seconds, and daily average wind-vector direction and wind-vector magnitude were recorded for each sensor. The measurement locations for the meteorological sensors were not ideal and were limited by the local site characteristics, such as the limited width of area between the tree line and the highway and the snow-throw zone adjacent to the highway. The meteorological data were used to represent local site conditions and to aid in the interpretation of discharge, sediment transport, and road-condition values.
In November 2019, three soil sensors were installed 3, 9, and 15 ft from the edge of the HMA pavement to measure soil temperature, soil moisture, and bulk electrical conductivity in the highway shoulder. Sensors were buried about 4 in. below the ground surface in shallow pits filled with maintenance sand to provide a homogeneous measurement area for each location. The measurement volume for each sensor was about 0.27 cubic foot per second (ft3/s) with a sensing radius of 0.25 ft around the probe. Sensors were installed to help determine the linear extent of salt broadcast by the physical removal of salt-laden snow and slush by plow trucks, vehicular spray, and wind-blown deposition from the pavement surface. Sensors were not installed adjacent to the OGFC pavement because water often ponded during heavy rain in the shallow gully between the monitoring shelter and the west bank just beyond the shoulder, making the site conditions difficult to measure and too dissimilar for comparison to the HMA highway shoulder.
Noncontact pavement sensors were installed at each monitoring station to measure pavement surface temperature and pavement condition. Sensors were mounted on a mast (fig. 5B) about 16 ft above the pavement and at a 40-degree surface angle, which focused them on the first travel lane just inside the rightmost tire track at each site. Noncontact measurements of pavement temperature were made by an infrared thermometer with a 12-degree field of view, resulting in an elliptical area of measurement of approximately 22 ft2. Air temperature and relative humidity were measured within the device housing on the mast. The sensor also monitored the near infrared spectral differences of the roadway surface to determine the pavement surface condition and detected the state of water on the pavement (dry, damp, wet, snow, ice, standing water, deep snow, or black ice; High Sierra Electronics Inc., 2017). These measurements were made within a 1.6-degree field of view, resulting in an elliptical area of measurement of approximately 0.4 ft2 at each site. The pavement sensors were calibrated to dry pavement conditions during periodic site visits. In addition to the pavement sensors, high-resolution fixed-image cameras were mounted on the adjacent mast (fig. 5B) at each monitoring station and focused on the general measurement location of each pavement sensor. Images were periodically collected each day and used along with other recorded sensor data to confirm the accuracy of the pavement conditions. For example, precipitation occurring above the freezing point and elevated discharge values were expected for a wet or standing-water pavement condition.
Collection and Analysis of Samples
The conveyance of runoff from the pavement surfaces to the monitoring stations included three primary components: the trench, weir sump, and weir-box outlet (fig. 3). To accurately quantify the total amount of sediment exported from each pavement section, sediment retained in the trenches and weir sumps was measured in addition to sampling the runoff that was conveyed to the weir-box outlet (fig. 3). Samples of highway runoff were collected by using three unrefrigerated automatic samplers during runoff-generating events (rain, mixed precipitation, and snowmelt) and analyzed for concentrations of SS and SS particle-size distribution. For selected events, additional composite samples were measured for concentrations of dissolved major ions, total dissolved nitrogen (TDN), dissolved organic carbon (DOC), particulate nitrogen (PN), particulate carbon (PC), TP, TSS, and selected total-recoverable metals (table 3). The dry mass for selected particle-size classes of sediment retained in the trenches and weir sump (fig. 3) was determined annually, and subsamples for particle-size classes less than 2.0 mm in diameter were analyzed for concentrations of TP and selected total-recoverable metals (table 4). Dry-deposition samples were collected, beginning in the second monitoring year, to estimate the portion of SS collected in the trench (fig. 3) at each site resulting from wind and vehicle turbulence.
Table 3.
Constituents and physical properties measured in samples of highway runoff collected at U.S. Geological Survey monitoring stations (421650071120401; 421652071120601) on Interstate 95 near Needham, Massachusetts, between October 1, 2018, and September 30, 2021.[Concentrations that are determined below the detection limit are censored; they are remarked with a less than (<) symbol in the U.S. Geological Survey (USGS) National Water Information System (U.S. Geological Survey, 2023b). NTRU, Nephelometric turbidity units with ratiometric correction; EPA, U.S. Environmental Protection Agency; NEWSC, New England Water Science Center, Northborough, Massachusetts; µS/cm, microsiemens per centimeter at 25 degrees Celsius; mg/L, milligram per liter; ICP-AES, inductively coupled plasma-atomic emission spectroscopy; NWQL, USGS National Water Quality Laboratory; IC, ion chromatograph; μg/L, microgram per liter; N, nitrogen; cICP-MS, collision/reaction cell inductively coupled plasma-mass spectrometry; ICP-MS, inductively coupled plasma-mass spectrometry; KY, USGS Kentucky Sediment Laboratory; NA, not applicable]
| Physical property or constituent and units | Detection limit | Analytical technique | Analyzing laboratory | Reference | USGS parameter code |
|---|---|---|---|---|---|
| Turbidity, unfiltered, in NTRU | 0.05 | EPA 180.1 | NEWSC | Anderson, 2005 | 63676 |
| Laboratory specific conductance, in µS/cm | 5 | Wheatstone Bridge | NEWSC | U.S. Geological Survey, 2019 | 90095 |
| Calcium, filtered, in mg/L | 0.02 | ICP–AES* | NWQL | Fishman, 1993 | 00915 |
| Magnesium, filtered, in mg/L | 0.01 | ICP–AES* | NWQL | Fishman, 1993 | 00925 |
| Potassium, filtered, in mg/L | 0.3 | ICP–AES* | NWQL | Fishman and Friedman, 1989 | 00935 |
| Sodium, filtered, in mg/L | 0.4 | ICP–AES* | NWQL | Fishman, 1993 | 00930 |
| Alkalinity, filtered, laboratory, in mg/L as calcium carbonate | 4 | Titration | NWQL | Fishman and Friedman, 1989 | 29801 |
| Chloride, filtered, in mg/L | 0.02 | IC | NWQL | Fishman and Friedman, 1989 | 00940 |
| Sulfate, filtered, in mg/L | 0.02 | IC | NWQL | Fishman and Friedman, 1989 | 00945 |
| Total dissolved nitrogen (nitrate + nitrite + ammonia + organic-N), filtered, in mg/L as nitrogen | 0.05 | Alkaline persulfate digestion | NWQL | Patton and Kryskalla, 2003 | 62854 |
| Total phosphorus, unfiltered, in mg/L as phosphorus | 0.01 | Alkaline persulfate digestion | NWQL | Patton and Kryskalla, 2003 | 00665 |
| Particulate nitrogen, in mg/L as nitrogen | 0.03 | EPA 440.0 | NWQL | Zimmerman and others, 1997 | 49570 |
| Particulate carbon [inorganic plus organic], in mg/L | 0.05 | EPA 440.0 | NWQL | Zimmerman and others, 1997 | 00694 |
| Dissolved organic carbon, in mg/L | 0.23 | High temperature combustion oxidation and nondispersive infrared spectroscopy | NWQL | Clesceri and others, 1998 | 00681 |
| Aluminum, unfiltered, in µg/L | 3 | cICP–MS | NWQL | Garbarino and others, 2006 | 01105 |
| Arsenic, unfiltered, in µg/L | 0.1 | cICP–MS | NWQL | Garbarino and others, 2006 | 01002 |
| Barium, unfiltered, in µg/L | 0.6 | ICP–MS | NWQL | Garbarino and Struzeski, 1998 | 01007 |
| Cadmium, unfiltered, in µg/L | 0.03 | ICP–MS | NWQL | Garbarino and Struzeski, 1998 | 01027 |
| Chromium, unfiltered, in µg/L | 0.5 | cICP–MS | NWQL | Garbarino and others, 2006 | 01034 |
| Copper, unfiltered, in µg/L | 0.4 | cICP–MS | NWQL | Garbarino and others, 2006 | 01042 |
| Iron, unfiltered, in µg/L | 5 | ICP–AES* | NWQL | Garbarino and Struzeski, 1998 | 01045 |
| Lead, unfiltered, in µg/L | 0.06 | ICP–MS | NWQL | Garbarino and Struzeski, 1998 | 01051 |
| Manganese, unfiltered, in µg/L | 0.4 | ICP–MS | NWQL | Garbarino and others, 2006 | 01055 |
| Nickel, unfiltered, in µg/L | 0.2 | cICP–MS | NWQL | Garbarino and others, 2006 | 01067 |
| Zinc, unfiltered, in µg/L | 2 | cICP–MS | NWQL | Garbarino and others, 2006 | 01092 |
| Total suspended solids, in mg/L | 15** | Standard method 2540 part F | NWQL | Fishman and Friedman, 1989 | 00530 |
| Suspended sediment, in mg/L | 0.5 | Filtration/gravimetry | KY | Guy, 1969; Shreve and Downs, 2005 | 80154 |
| Suspended sediment, percent smaller than 0.0625 millimeter in diameter | NA | Filtration/sieving/gravimetry | KY | Guy, 1969; Shreve and Downs, 2005 | 70331 |
| Suspended sediment, percent smaller than 0.25 millimeter in diameter | NA | Filtration/sieving/gravimetry | KY | Guy, 1969; Shreve and Downs, 2005 | 70333 |
Table 4.
Constituents measured in samples of sediment collected from weir sumps at U.S. Geological Survey monitoring stations (421650071120401; 421652071120601) on Interstate 95 near Needham, Massachusetts, between October 1, 2018, and September 30, 2021.[The minimum detection levels for each constituent that were reported by the laboratory varied among analytical runs; the minimums of these detection levels are given. U.S. Geological Survey (USGS) parameter codes from the National Water Information System (USGS, 2023b). SM, standard method; samples analyzed by RTI Laboratories, Incorporated, in Livonia, Michigan]
| Constituent | Minimum detection level, in milligrams per kilogram | Analytical technique | Reference | USGS parameter code |
|---|---|---|---|---|
| Phosphorus as phosphorus | 0.073 | SM 4500-P part F | Clesceri and others, 1998 | 68075 |
| Aluminum | 9.3 | Digestion method 3050B; Inductively coupled plasma-atomic emission spectrometry, method 6010C | U.S. Environmental Protection Agency, 1996, 2000 | 65196 |
| Arsenic | 1.8 | 67876 | ||
| Barium | 8.9 | 67877 | ||
| Cadmium | 0.22 | 67880 | ||
| Chromium | 0.45 | 67882 | ||
| Copper | 4.5 | 67884 | ||
| Lead | 4.5 | 64181 | ||
| Manganese | 0.89 | 67888 | ||
| Nickel | 4.5 | 67890 | ||
| Zinc | 4.6 | 64180 |
Suspended Sediment Samples
Runoff samples for the analysis of SS and particle size were collected on a flow-proportional basis immediately downstream from the weir at the entrance of the 8-in. outlet pipe (weir-box outlet; fig. 3) by using automatic samplers (fig. 5C). Samples were collected for nearly every runoff event from October 2018 through September 2021. For sample collection, runoff events were defined as a function of discharge, where sequential measurements of discharge greater than or equal to 0.005 ft3/s were separated by 6 hours or more of discharge less than 0.005 ft3/s. Runoff events consisted of any form of runoff, including rainfall, mixed precipitation, and snowmelt. A discharge of 0.005 ft3/s was chosen as the cutoff for all automatic sample collection because it was the minimum value that produced a sufficient depth of water in the weir sump to reliably collect runoff samples.
Suspended Sediment Sample Collection
At each station, two (of three) automatic samplers were routinely operated under datalogger control to collect runoff samples. Each autosampler was configured to hold twenty-four 1-liter (L) polyethylene sample bottles into which between one and seven 0.13-L subsamples were composited. These 1-L bottles represent subcomposite samples of event runoff, whereas a composite sample represents the entirety of a runoff event. The first subsample was collected when flow exceeded the minimum discharge threshold (0.005 ft3/s), and subsequent samples were collected at flow-proportional intervals (samples collected at equal volumes of discharge) (fig. 6). After a runoff event was sampled and discharge subsided below 0.005 ft3/s for a minimum period of 6 hours, the datalogger was programmed to instruct the sampler to move the distributor arm to the next sample bottle or, if all bottles in the sampler were full, to the next automatic sampler. This method allowed for the collection of additional samples for subsequent runoff events without compromising the previously collected samples. Similarly, if the system determined sampler errors or three successive failures to collect samples, the datalogger would automatically instruct the secondary or tertiary sampler to resume sampling. Approximately 50 subsamples of runoff were collected for an equivalent runoff of 1 in. of rain, resulting in the same sampling resolution irrespective of storm size. The flow-proportional thresholds generally remained constant during the project; however, these thresholds were increased so the sampler capacity was not exceeded when field work was limited during the COVID–19 outbreak. Periodically, the secondary sampler was used to collect concurrent replicate subsamples. In such cases, both the primary and secondary samplers were triggered simultaneously by the datalogger throughout runoff events.
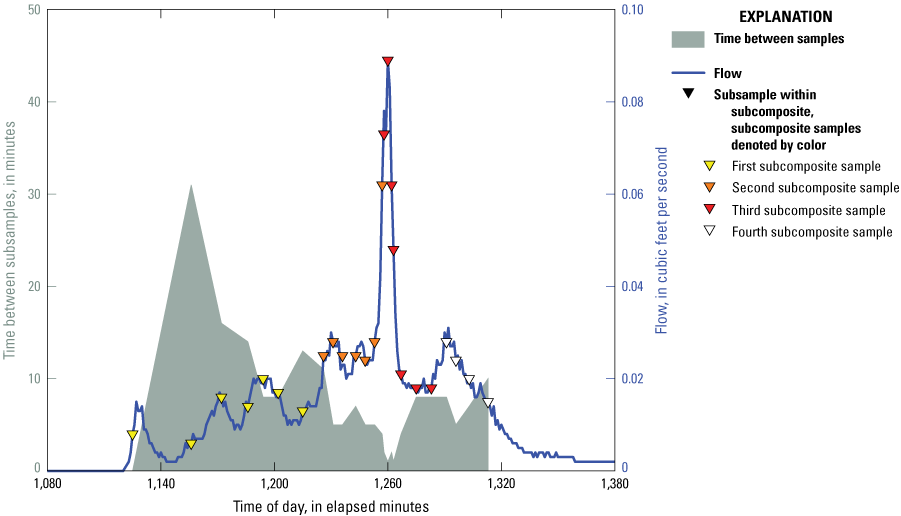
Example of automated flow-proportional collection of runoff subsamples at U.S. Geological Survey monitoring station (421650071120401) at Interstate 95 near Needham, Massachusetts, on July 22, 2019. Location of station is shown on figure 1.
Samplers were installed in a manner to ensure the best possible performance. Vertical distances from fixed sampling points to the sampler-pump heads were about 6 ft (9 ft in the case of the tertiary sampler) and within optimal suction limits (Bent and others, 2000). All sampler lines were mounted in a steep sloping manner to allow for the complete purging and draining of sample water between samples. Sampler intakes were oriented in a horizontal and downstream direction. This configuration minimizes debris accumulation by forming a small eddy that captures sand particles at the intake and thus allows the sampler to collect a more representative sample in regard to particle size (Edwards and Glysson, 1999). The sampler intake lines consisted of 0.5-in.-diameter polyethylene tubing attached to silicon pump-head tubing.
The vertical distribution of SS in pipe discharge is affected by water turbulence. Fine-grained particulates in the silt and clay size range (less than 0.0625 mm in diameter) are typically well mixed within the water column profile (Butler and others, 1996; Smith, 2002; Smith and Granato, 2010; Selbig and Bannerman, 2011), and concentrations should not be biased by sampling methods; however, a large bias can occur when samples are collected near the floor of a stormwater pipe, where concentrations of coarse sediment particles concentrate in the absence of turbulence. In this study, access to the 8-in.-diameter pipes conveying runoff from the trench system to the weir box precluded the installation of static mixers, stacked sampling ports, or various depth-integrated sample devices that are used with automatic samplers to reduce particle-size bias associated with the collection of stormwater samples. The weir box was chosen because it provided an accurate mechanism to measure discharge over the range of runoff conditions and because the sump area behind the weir plate provided a deposition zone where the coarse-grained sediment could periodically be removed and quantified. The collection of samples immediately downstream of the weir, where the sampling area was well mixed and the SS was dominated by fine-grained sediment, was expected to minimize bias in the sample concentration of the SS regardless of discharge rate, and the absence of coarse or sharp particles (gravel and road debris) that can damage pump-head tubing was expected to improve long-term performance and reliability of the sampling system.
Suspended Sediment Sample Processing and Analysis
Sample bottles for SS concentration and particle-size distribution analyses were collected on a weekly basis when storms occurred. Sample bottles were removed from the autosampler methodically to ensure that the bottles were labeled in the same chronological order in which they were collected. The subcomposite samples contained in each 1-L bottle were not split but analyzed in their entirety for concentrations of sediment and particle size to prevent bias or other issues associated with splitting samples. In cases when the last subcomposite sample bottle contained a single subsample, that subsample was added to the previous subcomposite sample bottle if space was available. Subcomposite samples were analyzed for SS and distribution of particle sizes (less than 0.0625 mm in diameter, greater than or equal to 0.0625 to 0.25 mm in diameter, and greater than 0.25 mm in diameter) at the USGS Kentucky Sediment Laboratory (table 3). Concentrations for subcomposite samples of highway runoff are available through the USGS NWIS (U.S. Geological Survey, 2023b).
Water-Quality Samples
Samples of runoff for the analysis of selected major ions, total nutrients, total-recoverable metals, TSS, and SS were collected on a flow-proportional basis immediately downstream from the weir (at the weir-box outlet) by using the automatic samplers for selected events (fig. 3). Composite samples that represent the entirety of a runoff event were collected in addition to the routine subcomposite samples for 15 storm events from June 2019 through September 2021. The samples were collected during storms with precipitation volumes ranging from 0.30 to 4.18 in. that resulted in sufficient runoff to exchange the water volume within the weir boxes several times. Composite samples represented a range of dry antecedent periods (dry periods separated by precipitation less than 0.02 in.), runoff durations, and mean and peak discharge values (table 5). The median dry antecedent period prior to sample collection was about 53 hours for the 15 composite samples. The median runoff duration, mean discharge, and mean peak discharge were about 6 hours, 0.011 ft3/s, and 0.055 ft3/s for the composite samples. Discrete samples that represent a single point in time also were collected (sample count=71), generally during the winter months, to characterize the relation between specific conductance and dissolved concentrations of Cl and Na.
Table 5.
Storm runoff characteristics for 15 sampled events at two U.S. Geological Survey monitoring stations at Interstate 95 near Needham, Massachusetts.[Locations of stations are shown in figure 1. Discharge and precipitation data are published in the U.S. Geological Survey (USGS) National Water Information System (USGS, 2023b). mm/dd/yyyy, month, day, year; ft3/s, cubic foot per second; HMA, hot-mix asphalt; OGFC, open-graded friction course; ND, not defined because periodic light drizzle resulted in little or no runoff since prior runoff-generating event]
Water-Quality Sample Collection
The tertiary automatic sampler at each monitoring station was periodically reconfigured to hold a single 14-L polyethylene churn with a cubitainer-style spigot into which flow-proportionally collected subsamples were composited. This configuration was used to collect composite samples of runoff for 15 paired events. The churn and sampler tubing were cleaned with phosphate-free, laboratory-grade soap and tap water; then immersed in a 5-percent solution of hydrochloric acid for a period of at least 6 hours; and finally rinsed with deionized water until the specific conductance of the waste rinse water was less than 1 microsiemens per centimeter at 25 degrees Celsius (μS/cm at 25 °C). The churns and clean tubing were installed in each station prior to an anticipated storm. Composite samples were collected concurrently with the collection of SS subcomposite samples (described previously in the “Suspended Sediment Sample Collection” section) by using the primary and secondary autosamplers. In a few cases, runoff from multiple small events occurring in the same day was collected in the same composite sample. Discrete samples that were analyzed for selected major ions also were collected with the tertiary automatic sampler; however, the sampler base was reconfigured to hold twenty-four 1-L polyethylene bottles. For these samples, the automatic sampler was triggered on the basis of an initial specific conductance threshold, and subsequent samples were collected on the basis of an incremental change of at least 5,000 μS/cm between samples.
Water-Quality Sample Processing and Analysis
Water samples were processed in the USGS laboratory in Northborough, Massachusetts, typically during the day following the conclusion of the runoff events. Subsamples for the analysis of selected major ions, total nutrients, total-recoverable metals, TSS, and SS were split from the 14-L polyethylene churn. Physical properties, including specific conductance and turbidity, were measured during sample processing. Subsamples for dissolved major ions and TDN were filtered through a 600-square-centimeter (cm2) capsule filter with 0.45-micrometer (μm)-sized pores. Sample-water particulates were processed by passing a known volume of sample water through a Teflon filter assembly and a 25-mm glass-microfiber filter with a 0.65-μm pore size (U.S. Geological Survey, 2002). The filters were analyzed for PN and PC. Total nitrogen was computed as the sum of TDN (USGS parameter code 62854) and PN (USGS parameter code 49570). After processing, discrete and composite samples were packed in ice and shipped overnight to the USGS National Water Quality Laboratory (NWQL) in Lakewood, Colorado, for analysis. Concentrations of SS and SS particle size were analyzed at the USGS Kentucky Sediment Laboratory in Louisville, Kentucky.
Weir-Sump and Trench Sediment Samples
Settleable material behind the weir in the sump at each monitoring station was removed annually to determine the mass, particle-size distribution, and quality (with respect to concentrations of TP and total-recoverable metals) of the retained sediment. The mass and particle-size distribution for materials collected in each trench also were determined in July 2020, September 2020, and September 2021.
Sediment Sample Collection
At the end of each water year (September), sediment and other retained materials (gravel, litter, leaves, and sticks) were removed from each weir sump (fig. 3). The materials were removed to prevent an increase of materials retained behind the weir from year to year from affecting the gage height-discharge relation; the removal was also done to document changes in sediment particle-size distributions conveyed to the structure over time. During each cleanout event, standing water was removed by lowering a small submersible pump just below the water surface to avoid disturbing the bottom sediment. Water was pumped into large storage containers where the water volume was measured, and samples were collected and analyzed for SS concentrations so the total mass of SS could later be determined. Once the water was eliminated from the weir sump, retained sediment and materials were removed with a plastic scoop and wet sieved on site through coarse (6.0-mm-diameter) and fine (0.25-mm-diameter) nylon sieves. The 6.0-mm screen was used to separate out most of the leaves, sticks, and litter, and the 0.25-mm screen was used to separate the water from the bulk of the sediment. Sieved water was collected in a storage container where the water volume was measured, and samples were collected and analyzed for SS concentrations so that the total mass of SS passing through the sieve could be determined. Materials greater than 6.0 mm in diameter and between 0.25 mm and 6.0 mm in diameter were placed in resealable polyethene bags, labeled, and transported to the USGS New England Water Science Center for further processing and analyses.
Each trench was routinely inspected during the collection of runoff samples and other site visits from the vantage point along the guardrail and generally appeared to be clean during the 2018–19 period; however, debris buildup in each trench was observed during 2020, resulting from retention of sediment. Therefore, in July 2020, and subsequently in September 2020 and 2021, the contents of each trench (fig. 3) also were removed and retained for analysis concurrently with the removal of retained material from each weir sump in September.
Sediment Sample Analysis
The mass and particle size of materials removed from the weir sumps and trenches were analyzed at the USGS laboratory in Northborough, Massachusetts, except for SS samples collected from the storage containers, which were analyzed at the USGS Kentucky Sediment Laboratory (table 3). Prior to dry sieving, the weir-sump and trench materials were dried in pretared, 2-in.-deep by 8-in.-diameter, stainless-steel pans at 70 degrees Celsius (°C) in a laboratory oven to a relatively constant mass to remove most of the moisture. Initial observations indicated that temperatures greater than 70 °C caused asphalt particles to become tacky, resulting in particle sticking and potentially affecting the mass of particle-size fractions during the dry-sieving process. The subsequent dry material from each location was mechanically sieved for 30 minutes into six particle-size fractions: (1) less than 0.25 mm in diameter, (2) greater than or equal to 0.25 mm to 0.50 mm in diameter, (3) greater than or equal to 0.50 mm to 1.0 mm in diameter, (4) greater than or equal to 1.0 mm to 2.0 mm in diameter, (5) greater than or equal to 2.0 mm to 6.0 mm in diameter, and (6) greater than or equal to 6.0 mm in diameter. Once the material was sieved, each particle-size fraction was redried in pretared stainless-steel trays at 105 °C to a constant weight, or until the change from the previous recorded weight was less than 1 gram (g) as determined by subsequent measurements made no more frequently than on an hourly basis. The resultant sediment masses, in grams, for each sampling event are available in the associated data release (Spaetzel and others, 2023).
Sediment Chemistry Samples
Sediment quality was determined annually from sediment deposited in each weir sump. Subsamples of dry-sieved weir-sump material (described above) in four particle-size ranges (less than 0.25 mm in diameter, greater than or equal to 0.25 mm to 0.50 mm in diameter, greater than or equal to 0.50 mm to 1.0 mm in diameter, and greater than or equal to 1.0 mm to 2.0 mm in diameter) were submitted to RTI Laboratories, Incorporated, in Livonia, Michigan, for analysis of TP and 10 total-recoverable metals (table 4). These four particle-size fractions represent particles in the silt, clay, and sand size range that are expected to enter the OGFC void structure.
Dry-Deposition Samples
Sediment is transported to the trenches from the pavement surface in runoff, and it also can be transported to each trench by wind or vehicular turbulence between runoff events. Sediment deposited in the trenches at the HMA and OGFC stations between runoff events was later transported through the conveyance system with subsequent runoff or remained in the trench drains until the trenches were cleaned out, which was done three times during the 3-year study period. The highway trench systems were rated for heavy vehicle loading with secure grating; therefore, routinely unbolting the trench grates to clean the trenches prior to storms was neither practical nor safe without scheduled traffic control. Because the trenches could not be cleaned routinely, they were considered part of the highway system at each study site. Samples of sediment deposition during the dry antecedent period between storms were collected from each trench, beginning in 2020, to estimate the sediment mass associated with dry-transport processes relative to the total sediment loads measured in the study.
Dry-Deposition Sample Collection
To quantify sediment accumulation in the trenches during selected dry antecedent periods, a 0.4- by 1.4-ft plastic tray was installed at the center of each trench (about 36 ft from the end) and below the grate. The trays were installed after runoff events during routine site visits, and the contents of the tray were collected prior to forecasted precipitation. Samples of dry deposition from each site were collected successfully for three separate periods from February 2020 to May 2020 for deployment durations of 4 to 8 days (Spaetzel and others, 2023); however, many other samples were compromised and discarded during this period because weather forecasts were not accurate or changed without sufficient warning, and storms occurred prior to the removal of the trays. To overcome the challenges of manual deployment of the trays, an automatic dry-deposition collection device was designed and installed beneath each trench grate to quantify sediment accumulation during dry antecedent periods (fig. 7). The same 0.4- by 1.4-ft plastic trays were mounted to a linear actuator and housed within a 6-in.-diameter PVC pipe mounted beneath the centermost grate. The dataloggers at each monitoring station were programmed to extend the tray from the PVC housing following the end of each storm and automatically retract the tray when rain was detected. A contact switch within the housing was measured by the datalogger and provided a secondary method to determine the position of the tray. The duration of time when the tray was extended from the PVC housing and exposed for collection of material was recorded by the datalogger. These devices represented a substantial improvement over manual attempts to collect samples of dry deposition between storm events because the trays were automatically deployed following each runoff event, and sequential dry antecedent periods were sampled between manual removal of the samples. These systems were operated from July 2020 through September 2021 and resulted in 11 sampling periods of 1 to 46 days in duration.
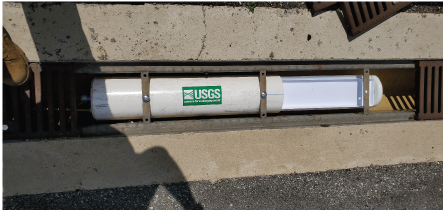
Photograph of the automatic dry-deposition sampler, with the collection tray in the open position, installed in the trench on Interstate 95 at USGS station 421652071120601, near Needham, Massachusetts, 2020.
Dry-Deposition Sample Processing
Samples of dry deposition were collected from each sample tray and placed into a resealable polyethene bag during routine visits. The material was dry sieved using a 2.0-mm screen to separate the larger gravel and debris from the finer silt and sand size particles (those most likely to be retained in the OGFC pavement). Particles less than 2.0 mm in diameter were dried in pretared stainless-steel trays at 105 °C to a constant weight, or until the weight change from the previous recorded weight was less than 0.5 milligram (mg) (Clesceri and others, 1998) at the USGS laboratory in Northborough, Massachusetts. The resultant sediment mass for particles less than 2.0 mm in diameter, in grams, was recorded for each deployment period (Spaetzel and others, 2023).
Pavement Leachate Samples
Highway runoff is a complex mix of constituents from multiple sources, including but not limited to atmospheric deposition, deposition of local soils and automobile residuals on pavement surfaces, highway construction residuals, and highway maintenance materials. Except for the pavement, the sources of various constituents are likely the same at each test, given their proximity to each other. Therefore, a pavement leaching test was done to determine if constituents leached from the two types of pavements differed substantially. Two samples of seasoned asphalt were collected from the edge of the breakdown lane near each trench at the end of the study period. Samples of asphalt were thoroughly cleaned with a plastic brush, a diluted solution of phosphate-free laboratory-grade soap, and tap water to dislodge and remove any trapped sediment before being rinsed with copious amounts of deionized water. Asphalt samples of similar mass (338.6 g HMA pavement and 355.4 g OGFC pavement) were allowed to soak in a clean polyethylene beaker containing 600 milliliters of deionized water for a period of 6 days. Then, the sample water (also referred to as the leachate) was filtered through a 600-cm2 capsule filter with 0.45-μm pore size. After processing, the leachate samples were packed in ice and shipped overnight to the USGS NWQL in Lakewood, Colorado, for analysis of TDN, TP, DOC, and selected total-recoverable metals (Spaetzel and others, 2023).
Permeameter Tests
Permeability (also referred to as hydraulic conductivity) is a measurement of the rate at which water flows through the porous-pavement layer and is represented by the coefficient of permeability (K). Semiannual permeameter tests were done in the breakdown lane and first travel lane on the OGFC segment within the study area to estimate changes in pavement permeability during the first 3 years of service. The permeameter design and measurement methods were developed by the National Center for Asphalt Technology, and measurements correlate closely with the results of laboratory tests on asphalt cores under saturated conditions (Cooley, 1999). A Gilson AP–1B falling-head permeameter was used to measure the permeability of the asphalt at the OGFC study site (Gilson Company, Inc., 2019). The field device consists of four stacked tiers of graduated clear plastic tubes, decreasing in diameter from bottom to top. The tiered design optimizes the measurement on the basis of the magnitude of the pavement permeability. In this study, only the bottom two tiers were used.
Permeameter tests were done in the center of the breakdown lane, the tire track area of the first travel lane (about 3 ft from the white line separating the first travel lane from the breakdown lane, also referred to as the fog line), and in the center of the first travel lane, with traffic support by MassDOT. The OGFC pavement in the breakdown lane may be the first area where permeability is affected by sediment deposition because traffic exposure is typically limited, and sediment is less likely to be hydraulically removed by tire action during wet conditions. The first travel lane carries the bulk of the traffic, including about 80 percent of the truck traffic, and may be most affected by deterioration or deformation of the pavement. Permeameter tests were generally done in the evening after traffic volume decreased, under dry conditions in the fall prior to frost conditions, and again later in the spring or early summer. In most cases, measurements were made at 13 equal-spaced locations adjacent to the trench in the center of the breakdown lane, in the tire-track area of the first travel lane, and in 4 to 13 locations near the center of the first travel lane. The number of overall measurements was limited by the amount of water brought to the site and by the duration of lane closures provided by traffic-control support.
Permeameter tests were made by removing any loose particles in the test area with a stiff brush to provide the best seal possible to the device. A moldable sealant was uniformly applied to the outer base of the permeameter to create a watertight seal with the pavement surface. The permeameter was placed on the test area and gently seated to the pavement surface to force the sealant material into the pavement texture. Weights were applied on each side of the device to compensate for head pressure resulting from the water column during testing. The device was filled with tap water at a steady rate up to the selected measurement line. As the water drained into the pavement, the time that elapsed for the water level to reach each specific graduation line was recorded (fig. 8). Pavement surface temperature data also were recorded with a handheld infrared thermometer to document pavement condition at the time of the tests.
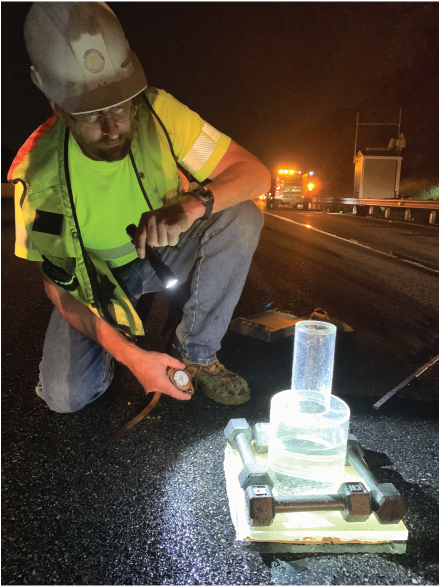
Photograph of a permeameter test on Interstate 95 near U.S. Geological Survey station 421652071120601, near Needham, Massachusetts, on July 9, 2019. Photograph by the U.S. Geological Survey.
Data Quality
Quality-control (QC) data were collected to determine bias and variability associated with sample data and flow measurements. QC data were assessed throughout the course of the study to ensure flow measurements and laboratory data were of sufficient quality to meet the project objectives. QC discharge measurements are published in the USGS NWIS (U.S. Geological Survey, 2023b), and QC sample data are published in the associated data release (Spaetzel and others, 2023).
Discharge
The theoretical relation between gage height and discharge (which is based on the weir dimensions) was tested at each station by simultaneously measuring the flow rate of a 9,600-gallon-per-hour centrifugal pump with an inline flowmeter and measuring gage height in the weir box. To assess the low end of the relation (discharge near 0.003 ft3/s), a small electric pump also was used to simulate low discharge values. Pump-flow values were within the range of flow estimated from a water level of plus or minus 0.01 ft around the theoretical gage height-discharge relation (U.S. Geological Survey, 2023b). The low-end measurement (less than 0.003 ft3/s) resulted in a larger error about the theoretical relation because of the nappe clinging to the downstream weir face; therefore, the shifted-control method (Kennedy, 1984) was used to adjust the gage height-discharge relation on the basis of this measurement. A range of plus or minus 0.01 ft in gage height represents the typical error for the measurements of the water level in the weir box, as determined by using the adjusted gage height-discharge relation. In general, discharge values less than 0.003 ft3/s may be less accurate where the sensitivity of the gage height-discharge relation was poor, and gage-height values often were affected by the formation of slush during extreme cold periods. These gage-height pump-flow tests indicate that the theoretical relation and adjusted low-end relation for each weir provided accurate estimates for discharge greater than or equal to about 0.003 ft3/s.
Suspended Sediment and Water-Quality Samples
QC samples, including field blank, concurrent replicate, and split replicate samples, were collected to identify potential bias in sampling and processing methods and any contamination resulting from the sampling equipment or the sample-collection, processing, and analysis processes. The QC data are summarized in the following sections and available in the companion data release (Spaetzel and others, 2023).
Field Blank Samples
Sixteen field blank samples were collected during the study period. Fourteen of these samples were analyzed for SS concentrations only, whereas two samples were analyzed for concentrations of SS, major ions, nutrients, and total-recoverable metals. Field blank samples were collected by pumping deionized water through automatic samplers at the monitoring stations and dispensing it directly into a 1-L polyethylene bottle or into a polyethylene churn splitter. Samples processed through the churn represent the potential contamination pathways that the composite samples were exposed to during sample collection and processing. Blank samples split from the churn were analyzed for concentrations of nutrients, major ions, and total-recoverable metals.
In 12 of 16 field blank samples, SS concentrations were less than the reporting limit of 0.5 milligram per liter (mg/L). Four samples had detected concentrations at 1 mg/L (just above the reporting limit). Although subcomposite environmental samples ranged in concentrations of SS from less than 0.5 to approximately 700 mg/L, more than 75 percent of environmental samples were greater than 6 mg/L; therefore, the infrequent, low-level detections do not indicate a substantive contamination issue. The tubing in the automated samplers was left in place without cleaning between storm events because it would not be practical to remove it after every runoff event. Churns were cleaned thoroughly between uses; one blank processed in a churn had a detection of 1 mg/L, whereas the other blank sample was less than the reporting limit of 0.5 mg/L. These results indicate that the collection, sample-preparation, and analytical processes did not result in positive bias of SS concentrations due to contamination.
Chemical-constituent concentrations in the field blank samples (n=2) were below the respective detection levels in both samples for concentrations of TP, PN, TDN, calcium, magnesium, Na, potassium, sulfate, arsenic, barium, cadmium, copper, iron, lead, manganese, nickel, zinc, aluminum, and alkalinity. Detections of PC, Cl, and chromium occurred once in the samples. However, for each of these detections, the concentrations were only marginally greater than the detection limits and still below the laboratory reporting levels and the minimum concentrations measured in environmental samples. In both blank samples, there were very low-level DOC detections (approximately equal to the detection limit). These results were extrapolated at the low end of the instrument calibration and were less than the reporting limit (0.46 mg/L) but above the detection limit. The minimum concentration of DOC measured in the composite runoff samples was 1.2 mg/L. Low-level DOC concentrations detected in field blank samples may reflect temporary laboratory issues in WYs 2019 and 2020, during which the NWQL had false positive rates of detections in blind blank samples of 7 and 2 percent (U.S. Geological Survey, 2023a). The rate of false positives returned to 0 percent in WY 2021. These results indicate that the collection, sample-preparation, and analytical processes did not result in positive bias due to contamination.
Concurrent and Split Replicate Runoff Samples
Concurrent replicates were collected to assess the precision of the sampling and analytical processes. Concurrent replicates were collected by two automatic samplers (primary and secondary samplers; fig. 5C) that were triggered simultaneously. Independent sampler lines were nearly identical in length, and the intakes were mounted near each other. Forty concurrent replicates were collected over the study period (October 2018 through September 2021). SS concentrations measured in replicate samples ranged from 5 to 489 mg/L at the HMA station and 6 to 150 mg/L at the OGFC station; these ranges represent 92 and 87 percent of environmental sample concentrations, respectively.
Replicate pairs were compared by determining the absolute value of the relative percent difference (absolute relative percent difference; RPD) of paired concentrations. The SS concentration RPDs ranged from 0 to 119 percent, with a median of 16 percent and a mean of 20 percent. In 60 percent of samples, the absolute value of the arithmetic concentration difference was less than 10 mg/L. The maximum arithmetic concentration difference was 58 mg/L, which was associated with a replicate pair that had SS concentrations higher than 99 percent of the samples (equal to 489 and 431 mg/L); therefore, the corresponding RPD was still relatively low, at 13 percent. The difference between replicate pairs may be the result of one sampler collecting a piece of debris. For example, the particle-size results for the replicate pair with the highest RPD (119 percent) indicate that 84 percent of the sediment in one sample was less than 0.0625 mm, whereas 97 percent of sediment in the paired sample was less than 0.0625 mm. The percentages of sediment less than 0.25 mm in each sample were similar (97 and 99 percent), indicating that a piece of debris in the 0.0625 to 0.25 mm particle-size range may account for the higher concentration of SS (that is, 47 as opposed to 12 mg/L) in one of the samples.
The accuracy of measured SS concentrations was evaluated by examining laboratory-performance data. As part of the USGS Quality Systems Branch (QSB) Sediment Laboratory Assurance Project, the USGS Kentucky Sediment Laboratory routinely analyzes standard reference samples. QSB results were limited to those standard reference samples with concentrations less than or equal to 100 mg/L because this range represents more than 90 percent of the concentrations measured in environmental samples in this study (U.S. Geological Survey, 2022). The difference in sample concentrations (standard reference sample target compared to measured value) ranged from about −28 to +1 percent (n=11); the median difference was −5 percent. These results indicate a small negative bias in the method at this laboratory for this specific concentration range.
Split replicates were collected by partitioning three composite samples into duplicate aliquots using a 14-L capacity polyethylene churn splitter. These replicate pairs were analyzed for major ions, nutrients, and total-recoverable metals (table 3) in addition to SS concentration. The RPDs of the split replicate concentrations ranged from 0 to 31 percent among all constituents measured. RPDs for major ions (calcium, magnesium, Na, potassium, Cl, and sulfate) were all less than 5 percent (table 6). Nutrient concentrations (TP, PN, and TDN) had RPD values between 2 and 27 percent (table 6). RPD cannot be determined when one or both replicates are censored. An RPD was not computed for the TP results of one replicate pair because one sample had a censored concentration of less than 0.01 mg/L, and the other sample had a concentration of 0.076 mg/L. This difference may be due to the 31-percent difference in the SS concentrations of the sample pair. The other two replicate pairs had RPDs of TP equal to 2 and 12 percent and SS concentration RPDs equal to 0 percent. RPDs of total-recoverable metal concentrations were more variable, ranging from 0 to 22 percent; however, most were below 5 percent. Although the RPD of cadmium concentrations in the first replicate pair was 22 percent, the arithmetic difference between the measurements was only 0.01 µg/L (0.048 and 0.038 µg/L). Because cadmium is measured at concentrations two to three orders of magnitude lower than the other total-recoverable metals, a small difference can result in an elevated RPD.
Table 6.
Laboratory replicate-analysis performance data and absolute relative percent differences between three split replicate, composite sample pairs of highway runoff collected at U.S. Geological Survey monitoring stations (421650071120401; 421652071120601) on Interstate 95 near Needham, Massachusetts, between October 1, 2018, and September 30, 2021.[Replicate sample data are published in an associated data release (Spaetzel and others, 2023), and U.S. Geological Survey (USGS) National Water Quality Laboratory replicate-analysis performance data are published by the USGS Quality Systems Branch (QSB) for water years 2007–21 or 2016–21 based on availability (U.S. Geological Survey, 2023a). RSD, relative standard deviation; <, less than; NA, not applicable because laboratory replicate-analysis performance data are not available for constituent]
The observed RPD values were compared with laboratory-performance data that reflect analytical variability. The USGS QSB reports performance data for the USGS NWQL collected by repeated measurements of double-blind quality-assurance samples over time as part of the Inorganic Blind Sample Project (U.S. Geological Survey, 2023a). Observed RPDs similar to or less than the QSB average relative standard deviation (RSD) indicate that sample collection and processing do not introduce more variability than is expected because of laboratory analysis alone. Table 6 reflects all RSD results provided by QSB for the constituent (and method code) of interest. These periods of data are from either WYs 2007–21 or WYs 2016–21, depending on QSB reporting periods. The RSD is the ratio of the standard deviation of many replicate concentrations to the mean of those concentrations and is written as a percentage. Ideally, the collection and processing of samples will not introduce variability; however, in practice, the RPDs of environmental replicates can be large for samples with low-level concentrations (near the respective detection limits) and small arithmetic differences between measured replicate concentrations and for constituents associated with sediment that can be difficult to split in a completely representative manner. Among the constituents for which comparisons to QSB blind sample RSDs were available, replicate variability for most constituents was near or below the laboratory RSD values for at least two of the three replicate pairs.
Composite samples (n=15 per site) were collected by using the tertiary automated samplers during selected storm events concurrently with the routine flow-proportional subcomposite sampling. The EMCs of SS calculated from the subcomposite samples may be compared with EMCs measured in the associated composite samples for events during which both kinds of sampling were done. Because composite samples were split by using a 14-L churn to satisfy different analytical needs, additional sample bias could be associated with the churn data. To examine this potential source of sample bias, RPDs were calculated for the pairs of estimated and measured EMCs (n=30). Although composite samples were collected concurrently with subcomposite samples, the start and end times occasionally differed because of insufficient liquid errors or volume requirements. The RPDs of all churn replicate samples ranged from 0 to 108 percent, with a median of 21 percent (table 7). These results are very similar to those discussed in the preceding paragraphs for the concurrent replicate SS results, which demonstrates not only that the precision is satisfactory for these additional data but also that little or no bias is associated with splitting the sample with the churn. This finding is reasonable because most of the SS is fine material (less than 0.0625 mm in diameter), which remains well mixed in the churn.
Table 7.
Comparison of event-mean concentrations (EMCs) of suspended sediment (SS) measured in highway-runoff samples composited in a churn and EMCs of SS estimated from individual subcomposite samples collected at U.S. Geological Survey monitoring stations (421650071120401; 421652071120601) on Interstate 95 near Needham, Massachusetts.[Composite sample data published in the U.S. Geological Survey National Water Information System (U.S. Geological Survey, 2023b), and estimated EMCs published in companion data release (Spaetzel and others, 2023). m/d/yy hh:mm (EST), month/day/year hour:minute in eastern standard time; EMC, event-mean concentration; mg/L, milligram per liter; RPD, absolute difference of the relative percent difference; HMA, hot-mix asphalt pavement; OGFC, open-graded friction course pavement]
Sediment Chemistry Source-Blank Samples and Replicates
To identify potential sources of contamination in the collection and processing of weir-sump sediment samples that were analyzed for concentrations of phosphorus and total-recoverable metals (table 4), clean silica well-packing sand was used to prepare source-blank QC samples. Source-blank samples were prepared directly from the source-blank material without being dried or sieved. Equipment blanks were samples of source-blank material that were sieved and dried in an oven for 2 days, similarly to the preparation of the environmental weir-sump sediment samples. One pair of replicate source-blank samples also was submitted for analysis at the beginning of the study (November 2019). Because the well-screen sand is not a true blank in the same sense that deionized water is a blank for water samples, the blank samples were evaluated by comparing the concentrations measured in the source-blank and equipment-blank samples as opposed to evaluating the blank samples on the basis of the presence and magnitude of detections of the relevant constituents.
The comparison of source-blank and equipment-blank sample pairs (table 8) does not indicate that sample processing introduced contamination; however, comparisons were complicated by the presence of multiple detection and reporting levels in the data, which were the result of analytical parameters used in the laboratory for each batch of samples. RPDs associated with positive arithmetic differences, indicating that the concentration in the equipment-blank sample was higher, ranged from 2 to 67 percent (median of 22 percent). Even the highest of these RPDs corresponded to an arithmetic difference of only 0.1 milligram per kilogram (mg/kg; environmental results range from 12 to 38 mg/kg, so this is not a substantial difference). The greatest RPDs and arithmetic differences were associated with samples that had higher concentrations of a constituent in the source-blank sample than in the equipment-blank sample. For cadmium (p67880) and zinc (p64180), these results are the consequence of the varying reporting limits (even within a single analytical run). The RPDs observed between source-blank and equipment-blank samples are similar to those observed in replicate environmental results, which are described next.
Table 8.
Comparison of concentrations of phosphorus and selected metals in three pairs of source-blank and equipment-blank samples.[Positive arithmetic differences indicate that the equipment-blank sample, which is the dried and sieved sample, had a concentration higher than the source-blank sample. The sediment-quality National Water Information System parameter code in parentheses is denoted by the letter p and the five-digit identification number (U.S. Geological Survey, 2023b). The full name of each constituent is listed in table 4. Data are published in the companion data release (Spaetzel and others, 2023). <, less than; ND, not determined due to censored analytical results; RPD, absolute value of the relative percent difference]
Replicate samples of sediment were collected by withdrawing two subsamples from the dried and sieved fraction of sediment collected from the weir sump. Six replicate pairs were collected during the study period; however, no results were returned for the concentration of total-recoverable metals for one of the replicates submitted for analysis (sample counts in table 9). The following were collected: two replicate sample pairs sieved to a particle size less than 0.25 mm in diameter (one of which was only analyzed for phosphorus), two replicate sample pairs sieved to greater than or equal to 0.25 to 0.50 mm, one replicate sample pair sieved to greater than or equal to 0.50 to 1.0 mm, and one replicate sample pair sieved to greater than or equal to 1.0 to 2.0 mm. The median RPD for each constituent ranged from 16 to 77 percent (table 9). RPDs were not consistently higher or lower in samples of a particular grain size, although concentrations tended to be higher in the smaller grain-size portions. A single replicate pair accounts for the highest RPDs observed for 9 of the 11 constituents. The variability observed does not show consistent evidence of bias.
Table 9.
Summary of split replicate samples analyzed for sediment chemistry, collected at two highway stations on Interstate 95 in Needham, Massachusetts, water years 2019–21.[Data published in companion data release (Spaetzel and others, 2023). The sediment-quality parameter code in parentheses is denoted by the letter p and the five-digit identification number (U.S. Geological Survey, 2023b). The full name of each constituent is listed in table 4]
Analysis Methods
Average yields of sediment entering the trenches during dry antecedent periods were estimated from samples of dry deposition composited between runoff events in each trench. The coefficient of permeability for the OGFC pavement was determined by using results of permeameter tests done throughout the study. Continuous measurements of discharge and precipitation were used to determine event runoff volumes and runoff coefficients. The runoff coefficients were determined to support autosampling parameterization during the study and assess potential changes in site characteristics. EMCs of SS were computed from the flow-proportional subcomposite runoff samples collected during nearly every event of the study period. Concentrations of SS, Cl, Na, TP, and selected total-recoverable metals measured in samples of runoff and sediment were used in conjunction with measurements of discharge and sediment mass to estimate loads of constituents exported from the pavement sections. Continuous estimates (that is, every 10 minutes during baseline conditions and every 1 minute during events) of Cl and Na concentrations were developed by using the relation between specific conductance and measured Cl and Na concentrations. TP and selected total-recoverable metal concentrations in runoff were estimated by using the average concentration of these constituents in composite samples.
Runoff and Precipitation Volumes
Continuous records of discharge and precipitation were used to define runoff-event periods and event-precipitation totals. Due to the minimum volume of water necessary to submerse the intake for the automatic samplers, the minimum discharge that resulted in a sampled runoff event was 0.005 ft3/s, as described in the “Collection and Analysis of Samples” section above. Runoff events were also characterized by using minimum discharge thresholds of 0.003, 0.002, and 0.001 ft3/s to estimate the volume of runoff below 0.005 ft3/s that was not sampled and to assess the sensitivity of salt-load estimates to discharge. In each iteration to determine runoff-event durations based on these three discharge thresholds, the start of a runoff event was defined as the time when discharge equaled or exceeded the threshold value. The end of the runoff event was defined as the time when the discharge decreased below the threshold and remained less than that value for 6 hours. The 6 hours of discharge below the threshold were not included in the runoff-event duration. The total discharge of each event was determined by summing the 1-minute frequency measurements of discharge (converted to volume, in cubic feet [ft3]) over the runoff-event duration. Unless otherwise noted, the loads of sediment and chemical constituents in this report represent the total loads associated with runoff greater than or equal to 0.003 ft3/s because discharge values less than this have substantial uncertainty, as described in the “Discharge” section. Precipitation totals for each event were determined by summing the instantaneous measurements (collected every 5 minutes) of precipitation over the runoff-event duration, including the 6 hours prior to the start of runoff. The precipitation totals multiplied by the drainage area resulted in the precipitation volume (in cubic feet); these event-precipitation volumes were subsequently used in the determination of runoff coefficients.
Runoff Coefficients
A runoff coefficient is the ratio of the volume of runoff to the volume of rainfall. Runoff coefficients for rainfall events between April 1 and October 31 (nonwinter periods) were calculated by dividing the runoff total by the product of the measured rain total and the drainage area for each site. These runoff coefficients were used during the study to select appropriate flow thresholds for triggering the automatic samplers and to identify changes in the pavement contributing area. The ratio of the volume of runoff to the volume of rainfall for a given area should range from zero (no runoff) to one (100 percent of the precipitation is measured in the runoff); however, if a runoff coefficient exceeds a value of one, there likely is an error in the measurement of precipitation, discharge, or contributing area (Church and others, 1999). Changes in the contributing area can result when discharge from an upgradient drainage area is diverted into the drainage area of interest, such as when the inlet of a catch basin is partially or completely blocked by deposits of sediment or debris. Runoff coefficients estimated in this study also were compared to a selection of runoff coefficients available in version 1.1.0 of the Highway-Runoff Database (HRDB; Granato, 2019). The HRDB data selection was limited to the months of April through October, precipitation events greater than 0.05 in., and sites with 100 percent impervious area to represent characteristics similar to the runoff coefficients examined in this study.
Event-Mean Suspended Sediment Concentrations and Loads
EMCs of SS were determined for all sampled runoff events (n=226 at the HMA station; n=168 at the OGFC station) by using the concentrations of SS measured in more than 1,000 subcomposite samples at each monitoring station. Each event was characterized by 1 to 46 subcomposite samples, and each subcomposite sample included 1 to 15 (but most commonly 7) subsamples (fig. 6). The EMC was computed as a flow-weighted average of the subcomposite concentrations collected during a single runoff event by using the following equation:
wherec
is the concentration of suspended sediment in one subcomposite sample, in milligrams per liter denoted i; and
a
is the number of subsamples that compose i.
Individual subcomposite concentrations of SS are published in the USGS NWIS database (U.S. Geological Survey, 2023b), and computed EMCs are published in the associated data release (Spaetzel and others, 2023).
In a few cases, subsamples were lost as a result of errors with the sampling equipment or issues during sample shipment or analysis. When a subcomposite sample collected during the event was lost, the subcomposite concentration was estimated by averaging the concentrations of the samples collected before and after the missing subcomposite. If the missing sample was either the first or last one collected, the most recent subcomposite concentration available was repeated to fill in the missing concentration. For 9 events at the HMA site and 2 events at the OGFC site, autosampler or laboratory errors resulted in the loss of all subsamples. SS EMCs were estimated for these events either by using concentrations from the events immediately before or after or, if a composite sample was being collected concurrently with the subcomposite samples, by using the measured EMC from the paired composite. The SS EMCs measured in composite samples (n=15 at each site) were compared to the calculated EMC values in the “Concurrent and Split Replicate Runoff Samples” section above. Filling in missing data with estimates, although done infrequently, was important to provide the best representation of the sediment load exported from each type of pavement over the 3-year study period. The calculated EMCs were paired with runoff volume to compute a sediment load for each runoff event.
Because the event sampling was based on a minimum discharge value of 0.005 ft3/s, the portion of SS load associated with discharge less than 0.005 ft3/s and greater than or equal to 0.003 ft3/s was estimated. As noted previously, the uncertainty of discharge data down to 0.003 ft3/s is well constrained, but the gage height-discharge relation is poor below 0.003 ft3/s. To estimate the unsampled SS load, the difference between the total annual volume of discharge determined from a minimum discharge threshold of 0.003 ft3/s and the total annual discharge determined from a minimum discharge threshold of 0.005 ft3/s was multiplied by the 10th percentile value of the annual subcomposite SS concentrations (for each site and for each water year).
To compare the magnitudes of SS EMCs between the two pavement types, two statistical tests were done to compare distributions of concentrations. A one-sided Wilcoxon rank-sum test (also referred to as a Mann-Whitney test) was done for the complete EMC populations for sampled runoff events (n=226 at the HMA station and n=168 at the OGFC station) as well as a subset of samples that corresponded to 165 approximately concurrent runoff-generating events at both stations. This subset (n=165 for each station) excludes events where discharge decreased below 0.005 ft3/s at the HMA station between periods of precipitation but persisted at the OGFC station, resulting in a single runoff-generating event at OGFC but two independent runoff-generating events at HMA station. The Wilcoxon rank-sum test is a nonparametric statistical test for comparing two independent groups of data of any given distributional shape; specifically, it determines if there is evidence that the groups are from the same population (Helsel and others, 2020). For the comparison of SS EMCs measured at HMA and OGFC monitoring stations, the null hypothesis was that SS EMCs measured at the HMA station were equal to or less than EMCs measured at the OGFC station. The null hypothesis was rejected if p-values were less than 0.05.
Total loads of sediment were calculated by summing the computed loads of SS in runoff and direct measurements of the mass of sediment retained in the weir sumps and trenches. The SS EMCs in runoff and the weir-sump sediment masses may be discretized into water-year totals because of the sampling intervals; however, the three trench masses represent 22-, 2-, and 12-month periods, respectively; therefore, they cannot be distributed by water year (see “Data Collection Methods” for description of trench sampling). For a representative comparison of total sediment load between water years, the total load of sediment (equal to the sum of SS in runoff collected from the weir-box outlet, retained weir-sump sediment, and retained trench sediment [fig. 3]) for water years 2019 and 2020 was averaged.
Estimated Chloride and Sodium Concentrations
Specific-conductance measurements are commonly used to estimate concentrations of dissolved major ions (Hem, 1982, 1985; Miller and others, 1988; Church and others, 1996; Granato and Smith, 1999; Smith and Granato, 2010; Smith, 2015; Spaetzel and Smith, 2022). Concentrations of dissolved Cl and Na, along with specific conductance, were measured in composite samples and discrete runoff samples (samples that represent a single point in time) at HMA and OGFC monitoring stations to determine a regression equation relating specific conductance to Cl and Na concentrations. Continuous specific-conductance data recorded in baseline 10-minute increments and event-based 1-minute increments were available at both stations nearly every day of the study period. Using these continuous records with the regression equations produced continuous estimates of Cl and Na concentrations that were summarized over storm events to determine EMCs of Cl and Na.
Cl and Na concentrations were estimated from continuous measurements of specific conductance on the basis of equations developed to relate specific conductance to concentrations of the respective ions (see eq. 2 below). These regression equations were developed with the Maintenance of Variance Extension Type 1 (MOVE.1) technique on the basis of concurrent measurements of log-transformed values of specific conductance and log-transformed concentrations of Cl and Na in runoff samples. Because the equation was developed with log-transformed values of specific conductance and concentration, the bias correction factor (BCF) also was determined (Duan, 1983) to correct for the bias introduced by retransforming values (taking the antilog) to estimate event-mean concentrations and loads of Cl and Na. The MOVE.1 technique was chosen for regression analysis because it minimizes errors in both the x and y directions. This technique generates a unique equation, which can then be used to estimate either variable from the other; the estimations reflect the variance of the measured concentrations (Helsel and others, 2020). The MOVE.1 equation is given as
whereC
is the concentration of the ion of interest, in milligrams per liter;
Spc
is the specific conductance, in microsiemens per centimeter at 25 degrees Celsius;
m
is the slope from the MOVE.1 analysis (table 10);
b
is the y-intercept from the MOVE.1 analysis (table 10); and
BCF
is the bias correction factor from the MOVE.1 analysis (table 10).
Two multisegment regressions were developed using pooled sample data from the stations (table 10). The ratios of Na to Cl, magnesium to Cl, calcium to Cl, and sulfate to Cl in samples collected from both sites were similar, which was expected because deicing compounds and the frequency and magnitude of application were the same at both stations (due to the proximity of the stations along Interstate 95, see fig. 1). The ratios of the four other ions to Cl were more variable in samples with specific-conductance values less than 400 μS/cm, but for most samples above 400 μS/cm, the ratio of Na to Cl was generally constant, ranging only between 0.57 and 0.62, whereas the ratios of magnesium, calcium, and sulfate to Cl dropped to near 0. Because of the variability of these ion ratios in samples within the lower range of specific-conductance values (generally less than 400 μS/cm), two-part regressions were selected to better represent the large range in specific-conductance values and ion concentrations. In the sample data (n=71), specific conductance ranged from 7 to 119,000 μS/cm, Cl concentrations ranged from 0.96 to 57,700 mg/L, and Na concentrations ranged from 0.72 to 34,600 mg/L. For specific-conductance values less than 400 μS/cm, part 1 of the equation was applied to estimate Cl or Na. For specific-conductance values greater than or equal to 400 μS/cm, part 2 of the equation was applied. Although applied to discrete ranges of specific conductance, the ranges of data used to develop each segment overlap to produce a continuous function (table 10) (Granato, 2006). The standard errors of regressions, also referred to as the root mean square errors, are 3.2 and 3.6 percent, respectively, for the Cl and Na equations for specific-conductance values greater than or equal to 400 μS/cm. The standard error of regressions was 16 percent for both ions at the lower specific-conductance values (less than 400 μS/cm) due to the variability in Cl and Na concentrations (fig. 9).
Table 10.
Data and regression equation coefficients used to estimate concentrations of chloride and sodium from values of specific conductance for U.S. Geological Survey monitoring stations (421650071120401; 421652071120601) on Interstate 95 near Needham, Massachusetts, between October 1, 2018, and September 30, 2021.[Data available in the U.S. Geological Survey National Water Information System (U.S. Geological Survey, 2023b). Parameter codes are given in table 3. BCF, bias correction factor; µS/cm, microsiemens per centimeter at 25 degrees Celsius]
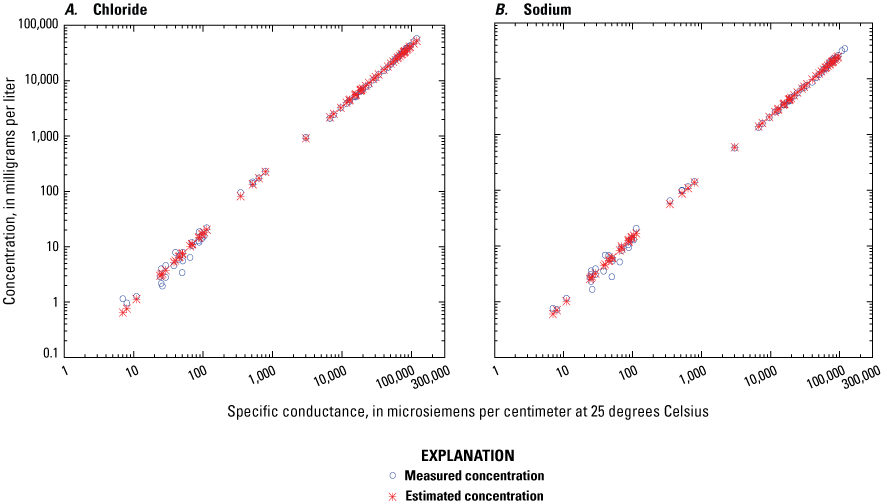
Measured and estimated concentrations of A, chloride and B, sodium in 71 runoff samples collected at U.S. Geological Survey monitoring stations (421650071120401; 421652071120601) on Interstate 95 near Needham, Massachusetts, between October 1, 2018, and September 30, 2021.
Loads of Total Phosphorus and Total-Recoverable Metals
Loads of TP and selected total-recoverable metals exported from the two highway pavement sections were estimated for the 3-year study period. To account for the total load of these constituents in highway runoff, data from three monitoring sublocations at each station were summed. These monitoring sublocations are represented in the monitoring-site diagram (fig. 3) and are the trench, weir sump, and weir-box outlet. Concentrations of TP and selected total-recoverable metals were measured in composite samples of runoff (n=15 at each site) collected at the weir-box outlet and in annual samples of the retained weir-sump sediment (fig. 3). The masses of sediment-bound TP and selected total-recoverable metals in the weir-sump and trench sediment were computed by multiplying the concentrations (in milligrams per kilogram) by the mass of sediment (in kilograms) corresponding to each particle-size class. Although concentrations of TP and selected total-recoverable metals were not measured in samples of sediment retained in the trench, the particle-size distributions of the trench and weir-sump sediment were similar; therefore, it was reasonable to use the concentrations measured on weir-sump sediment for estimating the constituent loads retained in the trench. The loads of TP and metals associated with the runoff collected at the weir-box outlet were estimated at each site by multiplying the average concentration measured in the composites (n=15 at each site) by the total volume of flow for the study period. Forty percent of the cadmium concentrations measured at each site were reported as less than the detection limit (0.03 microgram per liter [µg/L], except for one diluted sample reported as less than 0.06 µg/L). Due to the presence of censored data and to avoid biasing the average by substituting half the detection limit for censored results, the nonparametric Kaplan-Meier method (Kaplan and Meier, 1958; Helsel, 2011) was used to estimate the mean concentration of cadmium in the 15 composite runoff samples collected at each site. Ninety-five percent confidence intervals about the means were computed by using a nonparametric bootstrapping method with 10,000 replicates. The Kaplan-Meier estimate of mean concentrations (for cadmium) and 95-percent bootstrap confidence intervals (for all constituents) were computed in the R programming language (R Core Team, 2018) using packages EnvStats (Millard and Kowarik, 2022) and boot (Canty and Ripley, 2022).
Dry Deposition
Sediment was collected from sampling trays in each trench during dry antecedent periods from February 2020 through September 2021. The mass of sediment in these samples and the duration of the collection period were used to estimate rates of sediment entering the trench during dry periods. Sediment collected from the trays (1.4 ft in length) was assumed to represent the typical deposition rate throughout the 72-ft trench. The mass of sediment less than 2.0 mm in diameter collected in the 1.4-ft trays was multiplied by 51.4 (to scale up to the full length of the trench) and divided by the duration of the collection period (in days) to estimate a daily rate of sediment deposition in the trench for each deployment period (in grams per day). The average daily rate for WY 2021 was multiplied by the sum of dry antecedent periods (in days) to estimate a WY 2021 load of sediment less than 2.0 mm in diameter that was deposited in the trench during dry periods. Sediment greater than or equal to 2.0 mm in diameter generally consisted of gravel, woody debris, and litter; therefore, rates were not estimated for this fraction.
Pavement Permeability
Permeability measurements were made on Interstate 95 near USGS station 421652071120601 on the OGFC pavement shortly after the road was resurfaced in the fall of 2018 and semiannually through October 2021. Measurements were made in the center of the breakdown lane, the tire-track area of the first travel lane, and the center of the first travel lane by using a falling-head permeameter. Pavement cores were not taken at the study site, so the depth of the OGFC layer at each test location was assumed to be similar to the 0.1-ft design specifications, which is consistent with the OGFC pavement layer depth measured near the edge of the highway next to the trench (fig. 2). The coefficient of permeability was calculated for each measurement by using equation 3, as follows:
whereK
is the coefficient of permeability, in inches per hour;
a
is the inside cross-sectional area, in square centimeters of the tier observed;
L
is the open-graded friction course thickness, in centimeters, assumed to be 3.05;
A
is the cross-sectional area of permeameter, in square centimeters;
T
is the elapsed time, in seconds, between selected graduations (h1 and h2);
h1
is the initial head, in centimeters;
h2
is the final head, in centimeters; and
C
is the conversion factor (1417.323) for K, in inches per hour.
The coefficients of permeability determined for the permeameter tests are published in the companion data release (Spaetzel and others, 2023).
Pavement Conditions
The sections of HMA and OGFC pavement monitored in this study were characterized with respect to drainage area (by examining runoff coefficients), permeability (for OGFC exclusively), and frequency of various road-weather conditions (such as wet, standing water, snow, and ice). These data provide information about event-to-event and year-to-year variability in site conditions as well as information about changes through time as pavement is worn by use.
Runoff Coefficients
Runoff coefficients, the ratio of runoff to rainfall volume, were computed for runoff events with a minimum discharge value greater than or equal to 0.003 ft3/s and minimum rainfall greater than or equal to 0.05 in. to evaluate the accuracy of drainage-area estimates. Events that occurred in winter months (November through March) were excluded from runoff coefficient summaries because the presence of snow and ice impacts the timing and volume of runoff associated with precipitation events. For example, the addition of snowmelt to runoff volume during a winter rain event will result in a runoff coefficient greater than 1. As described previously, the theoretical bounds of runoff coefficients are 0 to 1, but these bounds may be violated due to site-specific and event-specific conditions that impact the drainage area. Granato and Cazenas (2009) noted that among stations compiled for the HRDB, 46 percent had runoff coefficients that varied by more than one order of magnitude, which is true of the two highway sites in this study. Although the range of runoff coefficients observed in the selected HRDB dataset reflects variability across a far greater number of events (n=697) and sites (n=60), the median is not substantially higher than those observed at the HMA and OGFC stations in this study (fig. 10).
The distributions of runoff coefficients were similar at the HMA and OGFC stations and over time during the study period (fig. 11) but reflect a wide range of values as a result of event characteristics such as rainfall intensity, traffic conditions, and wind speed or direction. Nonwinter event runoff coefficients over the 3-year study period varied from less than 0.03 to 2.0 for HMA and 0.01 to 1.7 for OGFC, with medians equal to 0.66 and 0.70, respectively. Runoff coefficients greater than 1 were computed for 3 percent of events at HMA and 11 percent of events at OGFC, which indicates that under certain storm conditions, the drainage area increases. These increases may result from a shift in the drainage pathways due to standing-water conditions or spillover from adjacent drainage areas. For example, there are catch basins in the inner breakdown lane opposite the south end of both trenches (fig. 1). Based on elevation data and design specifications, the inner breakdown lane drains parallel to the road from north to south; however, the elevation differences within the inner breakdown lane are subtle (less than 0.05 ft in some cases; fig. 12). If the catch basin is obstructed due to leaves or debris, water may back up in the inner breakdown lane, raising the surface elevation and causing water to flow perpendicular to the roadway (from east to west) into the lanes that drain to the trench. Similarly, the water elevation in the inner breakdown lane may equal or exceed the adjacent travel lanes during high-intensity storms when standing water is likely to occur (fig. 12). These kinds of shifts in drainage areas can substantially affect runoff volume and have been observed in other highway studies (Church and others, 1999; California Department of Transportation, 2000; Smith and others, 2018). Because the runoff coefficients greater than 1 are associated with events that span a range of rainfall amounts, intensities, and durations, it is not possible to identify a single causative factor that leads to excess runoff. Although runoff coefficients greater than 1 indicate that drainage area fluctuated under some conditions, the limited frequency of runoff coefficients greater than 1 (3 and 11 percent at HMA and OGFC stations, respectively), as well as the site-to-site similarities, indicate that the drainage-area estimates (table 1) are valid. Because the drainage areas are the same for each pavement section, loads of sediment and constituents discussed in this report may be directly compared between the two sites.
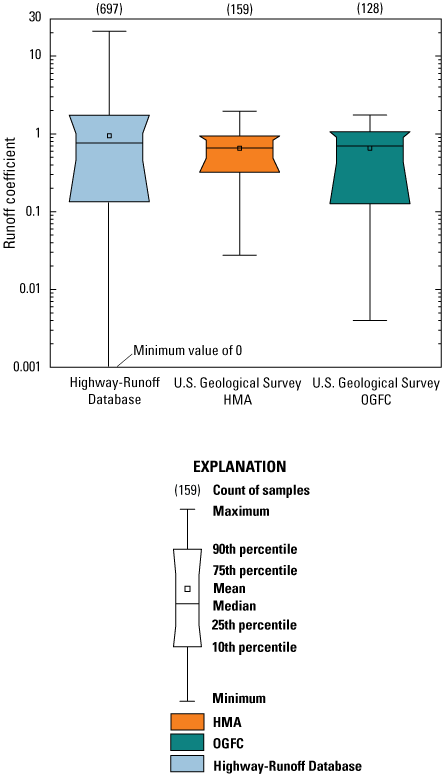
Comparison of runoff coefficients determined for nonwinter months (October, April through September) at U.S. Geological Survey monitoring stations on sections of hot-mix asphalt (HMA; 421650071120401) and open-graded friction course pavement (OGFC; 421652071120601) on Interstate 95 near Needham, Massachusetts, between October 1, 2018, and September 30, 2021, and runoff coefficients determined in other United States highway studies available in the Highway-Runoff Database, version 1.1.0 (Granato, 2019).
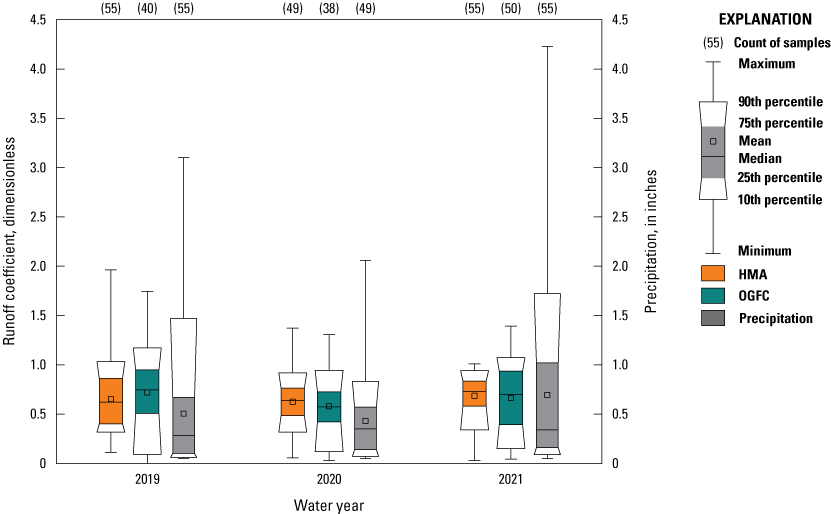
Distribution of runoff coefficients and precipitation volumes for events with more than 0.05 inch of rainfall that occurred in the nonwinter months (October, April through September) of each water year at U.S. Geological Survey monitoring stations on sections of hot-mix asphalt (HMA; 421650071120401) and open-graded friction course pavement (OGFC; 421652071120601) on Interstate 95 near Needham, Massachusetts, between October 1, 2018, and September 30, 2021.
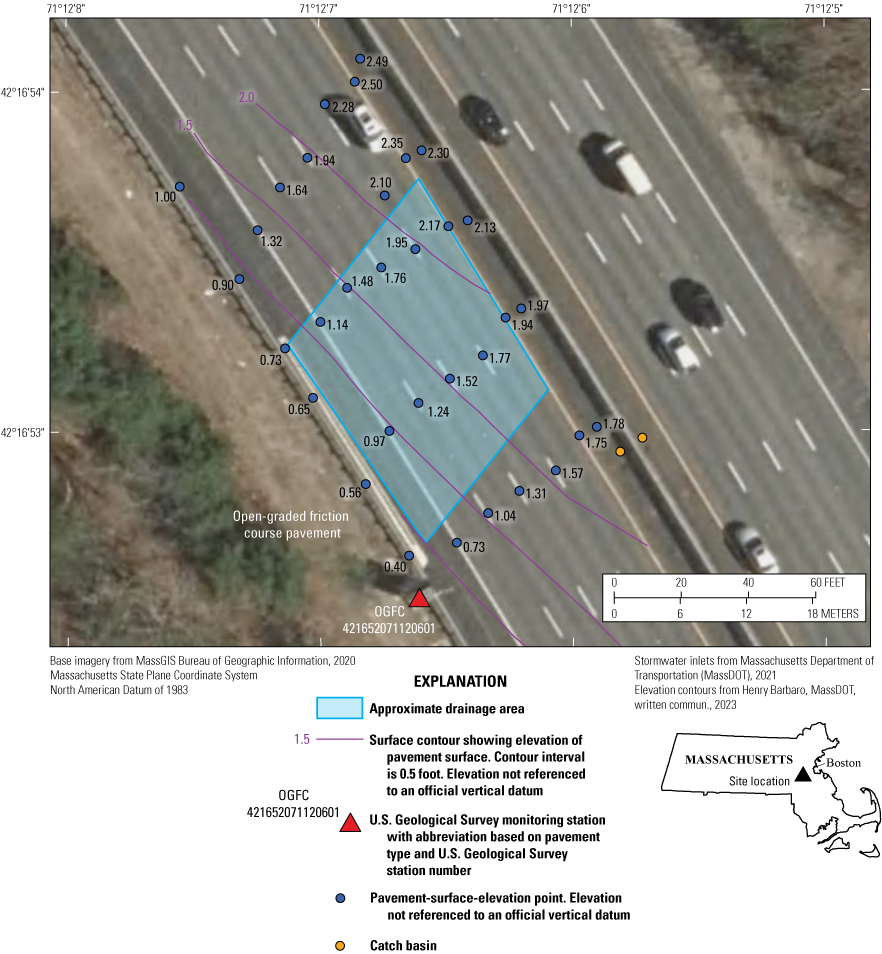
Pavement surface elevation data for the open-graded friction course (OGFC) section, U.S. Geological Survey monitoring station (421652071120601) on Interstate 95 near Needham, Massachusetts, November 2022.
Runoff losses due to splash and spray from vehicle turbulence and wind also affect runoff coefficients; however, the degree to which these mechanisms affect runoff volume is subject to many factors, from the traffic speed and traffic conditions during rainfall to wind speed and direction. These mechanisms may result in net losses or gains if rainfall from the northbound lanes is deposited on the southbound lanes draining to the study sites. In addition to the natural factors related to rainfall losses that vary from event to event, the error in precipitation measurements also varies with storm conditions. Smith and Granato (2010) observed that rainfall totals computed with colocated gages may differ by up to 0.10 in. but are commonly (95 percent of the time) within 0.04 in. of one another. Larger differences between the amounts of rain measured by precipitation gages could be the result of the physical mounting location and the direction and speed of wind during the storms.
Open-Graded Friction Course Pavement Permeability
The permeability of the OGFC layer is a function of the pavement design criteria, asphalt content, aggregate gradation, density of interconnected aggregate voids, and sediment loading. Permeability values of 164 in/hr are expected for properly functioning OGFC (Mallick and others, 2000; Kandhal, 2002). Mallick and others (2000) reported that the permeability coefficients for OGFC mixes consisting of more than 30 percent aggregates less than 4.75 mm in diameter are less than 46 in/hr, but the permeability coefficients increase substantially for mixes containing 25 to 15 percent aggregates (144 to 192 in/hr) in the same aggregate-size range. In this study, between 20 and 40 percent of the aggregates in the OGFC pavement are less than 4.75 mm in diameter (table 2), and this pavement layer has a design permeability of 64 in/hr (Kevin Fitzgerald, MassDOT, written commun., 2018). The permeability of the pavement layer affects the movement of water to the pavement edge and, in part, prescribes the thickness of the pavement mat that is required to prevent runoff from flowing across the pavement surface under most rainfall conditions. When runoff breaches the surface of the porous-pavement layer, the desired safety benefits of OGFC (including reductions in vehicular spray, nighttime surface glare, undercarriage wash off, and hydroplaning) are not achieved.
Initial permeameter measurements on Interstate 95 were made shortly after the OGFC pavement layer was installed in September 2018. Median permeability coefficients for the center of the breakdown lane and the center of the first travel lane were 210 and 82 in/hr, respectively (fig. 13). The median of permeability coefficients for measurements made in the breakdown lane after the first 10 months was the same (210 in/hr). However, the median of permeability coefficients for measurements made in the center of the first travel lane increased to 96 in/hr, but only four measurements were made at this time because additional measurements were made in the tire track of the first travel lane (median of 140 in/hr). Median values for measurements made in the breakdown and in the tire-track area of the first travel lane decreased throughout the study period (fig. 13). In the series of measurements taken at the end of the study in October 2021, the median permeability coefficients for the center of the breakdown lane and the center of the first travel lane decreased to 3.1 and 38 in/hr, respectively. The individual measurements made in the center of the first travel lane were more variable, in part because fewer measurements were made in this location (fig. 13).
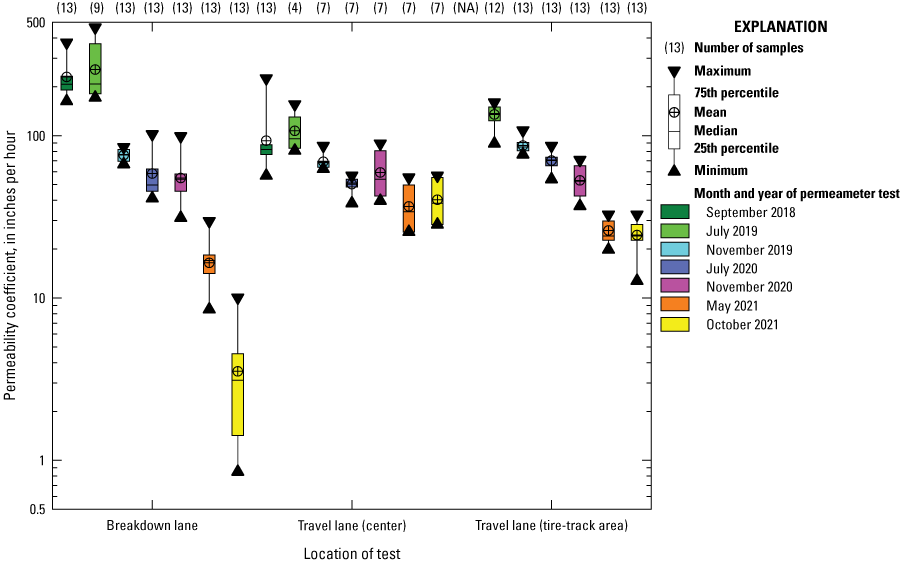
Distribution of calculated coefficient of permeability values from measurements made on the open-graded friction course (OGFC) asphalt rubber pavement near U.S. Geological Survey station 421652071120601 on Interstate 95 near Needham, Massachusetts, from September 2018 to October 2021. NA, not applicable because measurements were not made in tire track of the first travel lane in September 2018.
The average variabilities of measurements (interquartile range divided by median of each test set) made in the center of the breakdown lane, the center of the first travel lane, and the inner tire path of the first travel lane were about 29, 14, and 13 percent, respectively. Some of the variability could be due to variations in the thickness of the OGFC layer because permeability measurements are sensitive to the pavement-mat depth; a difference of 0.01 ft could affect the permeability coefficient by 10 percent or more. Pavement permeability in the breakdown lane decreased by nearly two orders of magnitude from September 2018 through October 2021, with the greatest change occurring in 2021 (fig. 13). Pavement permeability in the first travel lane decreased by about 53 percent in the center of the lane and by about 83 percent in the inner tire pathway during the study, although the first measurements in the inner tire pathway were not made until July 2019. These findings indicate that the void structure of the OGFC pavement was filling with sediment over the 3-year study period. The results also indicate that OGFC pavement permeability is maintained within the travel lanes longer than in the breakdown lane because of the cleaning pressure or suction caused by tires traveling over the layer (Isenring and others, 1990). The traffic volume and rate of speed also tend to promote this cleaning action (Van Heystraeten and Moraux, 1990; Putman, 2012).
Road-Weather Conditions
Road-weather conditions determined by noncontact measurements of the first travel lane at each monitoring station were collected during the study period to understand the differences in runoff behavior on each pavement types and to identify changes in runoff behavior related to decreases in OGFC pavement permeability over time. The frequencies of like measurements during nonwinter runoff periods are summarized for comparison (table 11). During the summer of 2019, the noncontact pavement sensor failed and was removed from the HMA monitoring station, and data were unavailable for several months while it was being repaired. As a result, only the data collected when both noncontact sensors were operating are listed in table 11. Pavement-condition data may be considered a semiquantitative measurement: a damp pavement condition implies that the road is moist but has insufficient water to cause tire spray, a wet pavement condition implies that the road has sufficient water to cause tire spray, and a standing-water condition implies that the depth of water on the pavement results in a wake behind the tires.
Table 11.
Percentage of dry, damp, wet, and standing-water pavement conditions and precipitation totals for April, May, and October of water year 2019 and April through October of water years 2020 and 2021 at U.S. Geological Survey monitoring stations on sections of hot-mix asphalt and open-graded friction course pavement on Interstate 95 near Needham, Massachusetts.[Data are available in the National Water Information System (U.S. Geological Survey, 2023b). Pavement-condition data may be considered a semiquantitative measurement, where a dry condition implies there is no moisture on the road; a damp pavement condition implies that the road is moist, but there is insufficient water to cause tire spray; a wet pavement condition implies that the road has sufficient water to cause tire spray; and a standing-water condition implies that the depth of water on the pavement results in a wake behind the tires. USGS, U.S. Geological Survey; HMA, hot-mix asphalt; OGFC, open-graded friction course]
During nonwinter months (April–October) of WYs 2019–20, a standing-water condition occurred in 0.25 and 0.24 percent of the measurements, respectively, at the OGFC site (table 11). Measurements of standing-water conditions for the same period were about five times more frequent at the HMA site, indicating that the runoff was draining into the OGFC layer as designed. Similarly, a wet condition occurred about five times more frequently at the HMA site than the OGFC site during WY 2019, but the frequency of a wet condition was about the same on each pavement type in WY 2020. Isenring and others (1990) suggest that porous asphalt layers remain wet longer after rain compared to dense-graded pavement layers because the water within the OGFC layer is pressured out by tire action. In WY 2021, wet and standing-water conditions were recorded more frequently on the OGFC pavement than the HMA pavement. It is unclear why these conditions occurred at a greater frequency on the OGFC pavement during this period. The increase in wet and standing-water conditions may be related to the substantial decrease in permeability coefficients in the breakdown lane at the OGFC site during WY 2021 (fig. 13). Because the OGFC permeability was decreased by sediment entrapment, the thickness of the OGFC layer at the measurement area was insufficient to accommodate the same amount of lateral flow, resulting in flow breaching the pavement surface. This condition may have been further increased by the greater precipitation volumes in the summer of WY 2021, which were substantially higher than in the prior WYs (table 11). Conversely, although the noncontact pavement sensors were routinely calibrated and verified, small changes in the macrotexture of the pavement could result in the shift of values from one condition to the next and in increased frequency of the wet or standing-water condition.
The effects of winter weather conditions on OGFC pavement, in particular the formation of ice and snow, are not fully understood. The permeability of the OGFC layer results in lower thermal conductivity than HMA pavement because the interconnected voids in the OGFC layer allow air movement throughout the pavement layer (Putman, 2012). As a result, the surface temperature of OGFC can be 1 to 2 °C lower than that of adjacent HMA (Isenring and others, 1990; G. Lefebvre, 1993, as presented in NASEM [2009]), which can lead to more frequent frost and ice formation. In this study, monthly median overnight (6 p.m. to 6 a.m.) temperatures of the OGFC pavement tended to be cooler than HMA temperatures by 0.1 to 0.5 °C in WYs 2019–20 and warmer than HMA temperatures by up to 0.3 °C in WY 2020; however, these differences were within the instrument accuracy (plus or minus 0.5 °C) (High Sierra Electronics Inc., 2017).
In this study, the two pavement sections were subject to identical deicing treatments, so differences in the frequency of various wet and icy road-weather conditions should reflect distinct properties of HMA and OGFC pavement. Pavement conditions reflecting winter weather, particularly “ice” conditions, were measured nearly twice as often on the HMA pavement as on the OGFC pavement (fig. 14A). The number of chemically active measurements, when the salinity of pavement water was sufficient to reduce the freezing point below 0.0 °C and maintain a damp or wet condition on the pavement surface, was marginally greater on the HMA pavement than on the OGFC pavement during WYs 2019 and 2020. In WY 2021, about 20 percent more chemically active measurements were recorded for the OGFC pavement than the HMA site (fig. 14B). Although salt crystals are likely to move into the porous structure of the OGFC pavement, much like sediment, research has shown that the salt solution can be pumped in and out of the void structure by the tire suction and high traffic volumes (A.P. Greibe, 2002, as presented in NASEM [2009]). It is unclear how the change in the permeability coefficients from winter to winter or the clogging of the breakdown lane at the OGFC site affected the pavement surface conditions, but pavement-condition measurements during the final winter indicate that damp and wet conditions on the first travel lane were more frequent at the OGFC site than the HMA site.
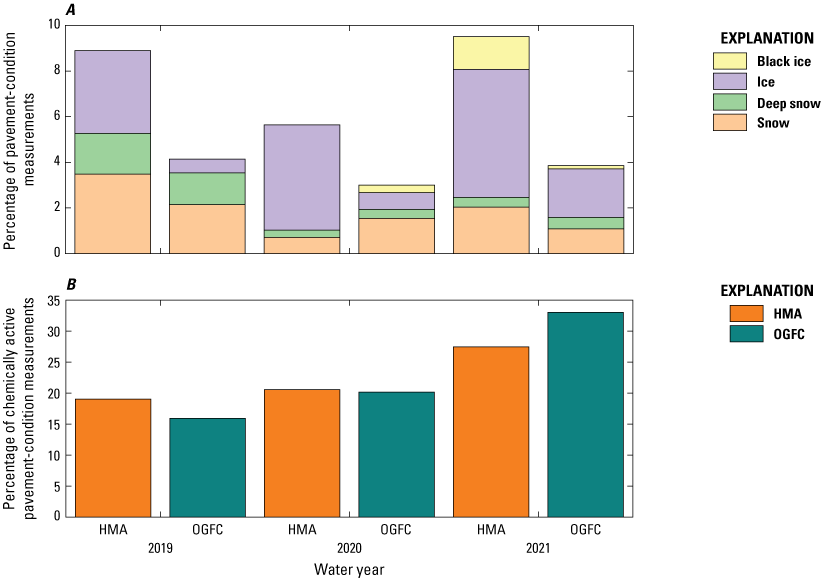
The percentage of wet pavement conditions representing A, snow, deep snow, ice, and black ice; and B, chemically active pavement conditions during the months of November through March at U.S. Geological Survey monitoring stations on sections of hot-mix asphalt (HMA; 421650071120401) and open-graded friction course pavement (OGFC; 421652071120601) on Interstate 95 near Needham, Massachusetts.
Event-Mean Concentrations and Loads
Concentrations of SS and sediment particle size were measured in more than 1,000 flow-proportional subcomposite samples of runoff collected from each monitoring station between 2018 and 2021 (U.S. Geological Survey, 2023b). Concentrations of total nutrients and total-recoverable metals were measured in 15 composite samples of runoff collected from each monitoring station. Samples of sediment retained in the weir sumps were sieved into selected particle-size classes and analyzed for concentrations of TP and selected total-recoverable metals on three occasions. These data were used to estimate loads and yields of SS and respective elements from each monitoring station. The comparison of loads and concentrations from these stations helps to characterize the effects of OGFC pavement on runoff quality, but these results do not reflect a typical mass-balance method of evaluating the inputs to and outputs from a stormwater control measure. The loads of sediment and selected constituents exported from the pavement sections were not compared to measured quantities of sediment and selected constituents that were deposited onto the pavement. However, because the pavement sections monitored in this study are located in series along the roadway (approximately 340 ft apart), they experienced the same traffic conditions and highway maintenance practices. These similarities indicate that although the inputs of sediment and selected constituents to the pavement surfaces were not quantified, the inputs are likely the same at both stations.
Suspended Sediment Concentrations
During the study period (October 1, 2018, to September 30, 2021), 2,040 flow-proportional subcomposite samples (fig. 15) were collected at the highway monitoring stations to characterize 226 and 168 sampling events at the HMA and OGFC stations, respectively. These subcomposite samples consist of about 6,700 (HMA station) and 6,500 (OGFC station) discrete subsamples collected on a flow-proportional basis. Although the stations experienced the same precipitation conditions, the number of sampled runoff events was greater at the HMA station. Runoff from some small runoff events did not exceed the discharge threshold (0.005 ft3/s) to trigger sampling at OGFC, and some events at OGFC encompassed multiple sampling events at HMA because the duration of runoff was often extended on the OGFC pavement. The median and average concentrations of SS in subcomposite samples over the study period were 20 and 34 mg/L in samples collected from HMA and 13 and 23 mg/L in samples collected from OGFC (fig. 15). In the particle-size distributions of SS in samples from both stations, generally 90 percent of the material was less than 0.0625 mm in diameter, and the median percentages of material less than 0.25 mm in diameter were 98 and 97 percent, respectively, at HMA and OGFC. Sediment greater than 0.25 mm in diameter was generally retained in the trench or weir box, where settling of larger material occurred. The SS EMCs computed for all events ranged from less than 0.5 to 677 mg/L at the HMA station and from 2.0 to 192 mg/L at the OGFC station, with respective median EMCs equal to 29 and 15 mg/L (fig. 16). The minimum SS EMC at the HMA station occurred during a small (0.05 in.) precipitation event that did not generate enough runoff to be sampled at the OGFC station; a single subcomposite was collected during the 1-hour event, and the concentration of SS was censored at less than 0.5 mg/L. Annual (WY) comparisons of the SS EMCs indicate that concentrations were consistently lower at the OGFC station during the study period (fig. 17). EMCs of SS were significantly higher in HMA samples, based on the Wilcoxon rank-sum tests for the full populations of EMCs and the subset of paired events (p-value less than 0.05; table 12), when considered over the entire study period and when grouped by each water year.
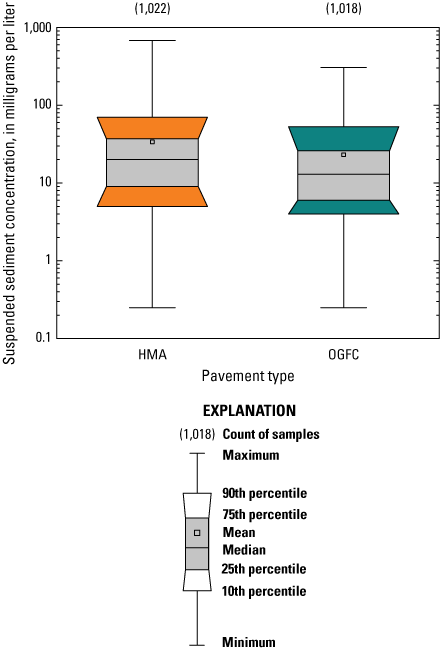
Concentrations of suspended sediment in subcomposite samples collected at U.S. Geological Survey monitoring stations on sections of hot-mix asphalt (HMA; 421650071120401) and open-graded friction course pavement (OGFC; 421652071120601) on Interstate 95 near Needham, Massachusetts, between October 1, 2018, and September 30, 2021. Locations of stations are shown on figure 1.
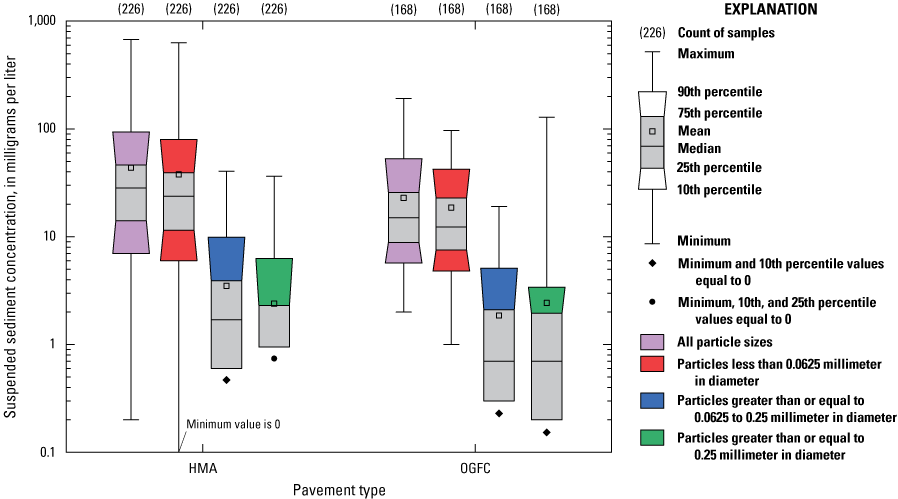
Event-mean concentrations of suspended sediment and associated distribution of particle sizes of suspended sediment less than 0.0625 millimeter in diameter, between 0.0625 and 0.25 millimeter in diameter and greater than or equal to 0.25 millimeter in diameter for samples collected at U.S. Geological Survey monitoring stations on sections of hot-mix asphalt (HMA; 421650071120401) and open-graded friction course pavement (OGFC; 421652071120601) on Interstate 95 near Needham, Massachusetts, between October 1, 2018, and September 30, 2021. Locations of stations are shown on figure 1.
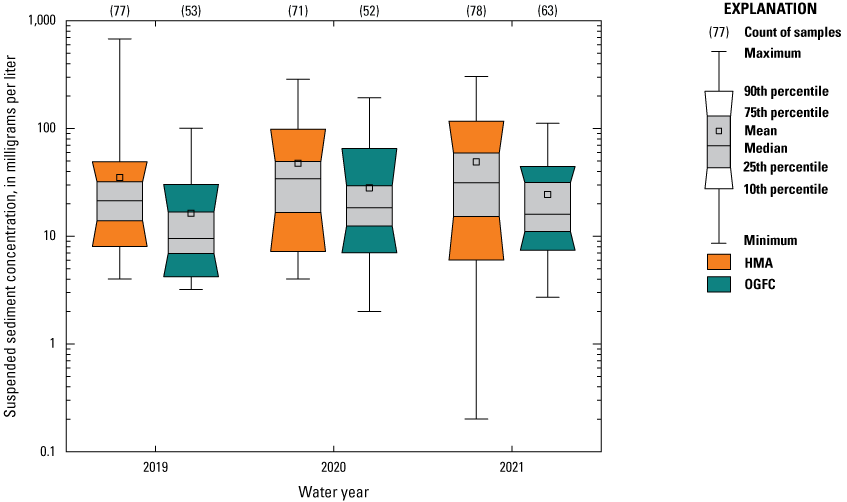
Event-mean concentrations of suspended sediment calculated from subcomposite samples collected at U.S. Geological Survey monitoring stations on sections of hot-mix asphalt (HMA; 421650071120401) and open-graded friction course pavement (OGFC; 421652071120601) on Interstate 95 near Needham, Massachusetts, between October 1, 2018, and September 30, 2021 (water years 2019–21). Locations of stations are shown on figure 1.
Table 12.
Results and attained significance levels (p-values) of Wilcoxon rank-sum statistical tests to compare event-mean concentrations of suspended sediment measured in samples collected at U.S. Geological Survey monitoring stations on sections of hot-mix asphalt and open-graded friction course pavement on Interstate 95 near Needham, Massachusetts, between October 1, 2018, and September 30, 2021.[Event-mean concentrations are published in the companion data release (Spaetzel and others, 2023). A water year is the period between October 1 and September 30 and is designated by the year in which it ends. Paired runoff events are a subset of samples that corresponded to 165 approximately concurrent runoff-generating events at both stations. HMA, hot-mix asphalt; OGFC, open-graded friction course; mg/L, milligram per liter; <, less than]
Sediment Loads
The total sediment load from each study site represents the mass of material conveyed off the highway section via runoff and material deposited by wind and vehicle turbulence in the trenches between runoff events. Sediment measured in the runoff samples, weir sump, and trench were summed over the 3-year study period. The total load of sediment (particle sizes up to 6.0 mm in diameter) was 202 kg from the HMA site and 120 kg from the OGFC site, a difference of 41 percent relative to the HMA site for particle sizes up to 6.0 mm. The proportions of total sediment load measured in the runoff samples were 17 and 19 percent at the HMA and OGFC monitoring stations, respectively. The largest proportion of the load was measured in the sediment retained in the weir sump, which accounted for 61 percent of the HMA load and 62 percent of the OGFC sediment load (table 13). The comparison of the study-period loads by particle-size class (fig. 18) indicates that the greatest differences in loads between the two stations were in the particle-size ranges less than 0.0625 mm to 2.0 mm in diameter, indicating that particles in this size range are readily retained by the voids in the OGFC pavement. Particles greater than 2.0 mm in diameter are in the gravel-size range and are similar to the smaller aggregates used in the OGFC pavement (table 2), so these particles are not trapped in the OGFC voids. The 3-year total load of sediment up to 2.0 mm in diameter at the OGFC site was 49 percent less than at the HMA site (loads equal to 85 and 168 kg, respectively). Of the total load of sediment particles less than 2.0 mm in diameter, 33.8 and 23.7 kg (20 and 27 percent) were estimated for runoff discharged from the HMA and OGFC sites, respectively, and sediment retained in the weir sump accounted for 58 percent of the HMA monitoring station load and 55 percent of the OGFC site load (table 13). The additional SS load that was estimated for unsampled discharges between 0.003 ft3/s and 0.005 ft3/s equaled less than 0.5 kg per year at both stations. This additional estimated SS load in runoff accounted for 3 to 12 percent of the annual SS loads and 0.9 percent (HMA station) and 1.8 percent (OGFC station) of the 3-year total sediment loads.
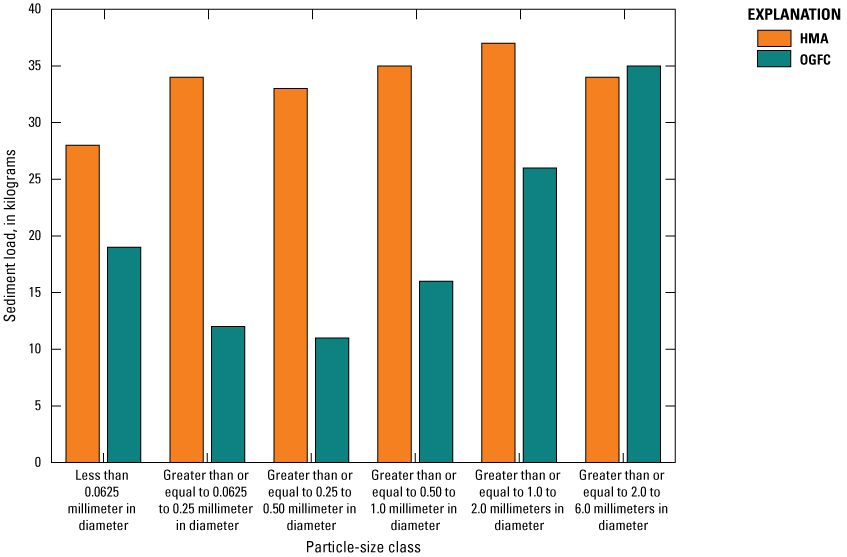
Total load of sediment by particle-size class measured at U.S. Geological Survey monitoring stations on sections of hot-mix asphalt (HMA; 421650071120401) and open-graded friction course pavement (OGFC; 421652071120601) on Interstate 95 near Needham, Massachusetts, between October 1, 2018, and September 30, 2021.
Table 13.
Mass of sediment measured in runoff samples, retained in the weir sump, and retained in the trench of U.S. Geological Survey monitoring stations on sections of hot-mix asphalt and open-graded friction course pavement on Interstate 95 near Needham, Massachusetts, collected between October 1, 2018, and September 30, 2021.[Data are available in companion data release (Spaetzel and others, 2023). Locations of stations are shown in figure 1. A water year is the period between October 1 and September 30 and is designated by the year in which it ends. Mass of sediment in the trench was not determined (ND) in water year 2019. USGS, U.S. Geological Survey; <, less than; mm, millimeter; HMA, hot-mix asphalt; OGFC, open-graded friction course]
Sediment and debris often accumulate on paved surfaces between runoff events. Highway sediments can be a mix of materials, including pavement particles, atmospheric dust, adjacent natural soils, vehicle residuals (rust, tire particles), and plant and leaf materials. On curbed roadways, between 75 and 90 percent of the street sediment often is deposited near the curb (Sartor and Boyd, 1972; Pitt, 1979; Selbig and Bannerman, 2007); however, the study sites on Interstate 95 lack curbing, and sediment is likely blown from the pavement surface to the highway shoulder by wind and vehicle turbulence. In this study, material deposited in the trenches was included in the measurement of total sediment loads because it was not feasible to clean the trenches between all events. Wind data were collected near the road surface adjacent to the guardrails at each site; wind was predominantly from the north, with a mean wind-vector speed of about 2 miles per hour. The prevailing wind direction and constant wind source indicate that sediment was likely blown off the highway surface rather than onto the highway surface from the adjacent shoulders; therefore, although this material was not conveyed to the trenches by runoff, it is an important component of the total load from the highway surface. Average extrapolated rates of sediment less than 2.0 mm in diameter deposited in the trenches during dry periods between February 2020 and September 2021 were 39.8 and 12.7 grams per day (g/d) for the HMA and OGFC trenches, respectively. The lower rate of deposition to the OGFC trench indicates that the sediment is retained in the void structure of the OGFC even under wind and vehicle turbulence. In WY 2021, the average deposition rates of sediment (less than 2.0 mm in diameter) in the HMA and OGFC trenches were 38.1 g/d and 14.5 g/d, respectively. The resultant annual dry-deposition sediment loads of 10.8 and 4.12 kg for the HMA and OGFC trenches represent about 17 and 8 percent, respectively, of the WY 2021 total sediment loads less than 2.0 mm in diameter. The addition of sediment in the trenches during the dry antecedent periods had a minimal effect on the total study-period loads.
The annual (water year) sediment loads indicate that OGFC pavement retention of sediment decreased during the study period. The average total load of sediment (particle sizes up to 2.0 mm in diameter) in WYs 2019–20 was 68 percent lower at the OGFC site than the HMA site, but this gap narrowed to 19 percent in WY 2021. Furthermore, in WY 2021, the load of sediment between 1.0 and 6.0 mm in diameter at the OGFC site exceeded the HMA sediment load in these particle-size classes (fig. 19). The raveling of OGFC pavement material may be contributing to the increased sediment load of particles greater than 1.0 mm in diameter because, as previously noted, the OGFC pavement is largely composed of particles greater than 2.36 mm (table 2). These observations in loads also are consistent with the decrease of pavement permeability and increases in standing-water conditions that were observed over the study period.
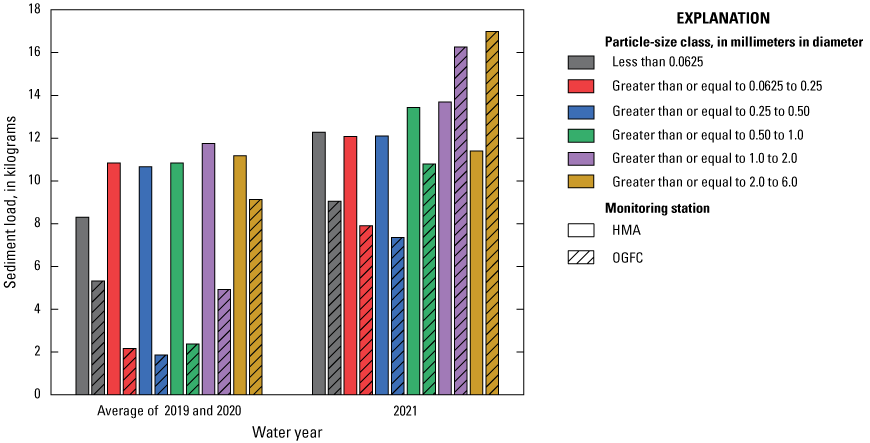
Total load of sediment by particle-size class and water year measured at U.S. Geological Survey monitoring stations on sections of hot-mix asphalt (HMA; 421650071120401) and open-graded friction course pavement (OGFC; 421652071120601) on Interstate 95 near Needham, Massachusetts, between October 1, 2018, and September 30, 2021.
Chloride and Sodium Concentrations
EMCs of Cl and Na were calculated from estimated dissolved concentrations of Cl and Na derived from regression equations between specific conductance and sample concentrations. Data representing each measurement interval (event duration) were summed to estimate an EMC for each runoff event based on a discharge threshold of 0.003 ft3/s. The Cl and Na EMCs are published in the companion data release (Spaetzel and others, 2023). The application of deicing compounds on both pavement sections was identical, with the maintenance strategy focused on the treatment of the primary OGFC pavement surface, yet the distribution of the EMCs from the OGFC pavement was slightly greater than the distribution of the EMCs from the HMA pavement (fig. 20). Median EMCs for Cl and Na were 26 and 20 mg/L from the HMA pavement, compared to 36 and 27 mg/L from the OGFC pavement. Although drainage behavior on the two types of pavement differs during runoff events, the cumulative effect is not fully accounted for over time. Much like the differences observed in the dry deposition between the two pavement sites, the loss of crystalline salt during dry conditions is likely limited, and as a result, a greater fraction of the salt remains on or in the OGFC pavement void structure rather than being blown from the roadway. Isenring and others (1990) suggest that salt tracking, where vehicle tires drag the salt down the road, occurs less on OGFC than HMA pavement for similar reasons.
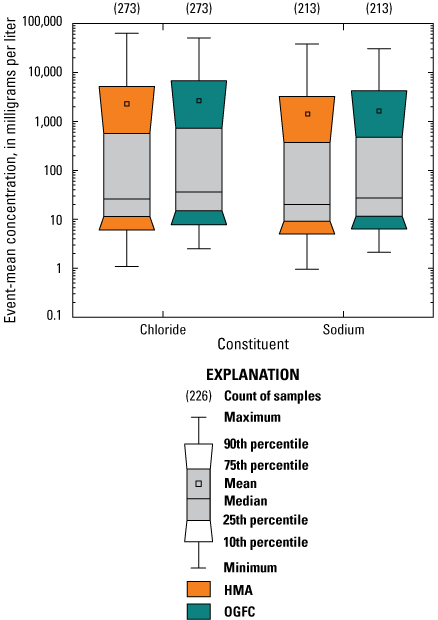
Estimated event-mean concentrations of chloride and sodium for all runoff events measured at U.S. Geological Survey monitoring stations on sections of hot-mix asphalt (HMA; 421650071120401) and open-graded friction course pavement (OGFC; 421652071120601) on Interstate 95 near Needham, Massachusetts, between October 1, 2018, and September 30, 2021.
Chloride and Sodium Loads
Loads of Cl and Na were computed on an annual basis by summing the runoff-event loads, which are the products of the estimated EMCs and the event discharge volumes. The sums of the Cl and Na loads are referred to herein as salt loads. Salt loads are reported for three discharge thresholds (see the “Analysis Methods” section) to demonstrate the sensitivity of salt-load estimates to discharge. Loads associated with discharges greater than or equal to 0.003 ft3/s are consistent with the loads of sediment and chemical constituents given in this study because discharge values below 0.003 ft3/s are subject to greater uncertainty (see the “Discharge” section, within the larger section “Data Quality”).
Loads of salt estimated for discharge greater than or equal to 0.003 ft3/s were highest in WY 2019 (789 and 1,480 kg at HMA and OGFC, respectively) and lowest in WY 2020 (530 and 523 kg at HMA and OGFC, respectively) (fig. 21). The total snowfall in WY 2020 was 26.6 in., whereas the total snowfall amounts in WYs 2019 and 2020 (45.9 and 54.3 in., respectively; table 14) were more similar to the long-term average snowfall of 51.4 in. (computed for WYs 1973–2021) (National Oceanic and Atmospheric Administration, 2023). MassDOT (2020) identified the winter of WY 2020 as the fourth mildest winter between 2001 and 2020. Accordingly, MassDOT applied deicing material to the highway on fewer days in WY 2020 than in WYs 2019 and 2021 (table 14), and at the statewide level, this difference corresponded to a 41-percent decrease in salt usage compared to the long-term (20 year) average (Massachusetts Department of Transportation, 2020).
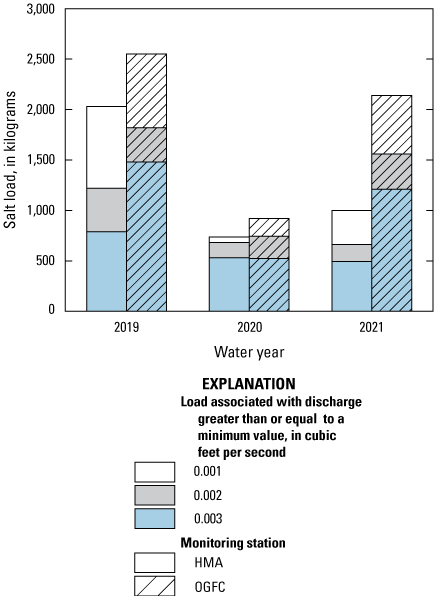
Loads of salt measured in runoff from U.S. Geological Survey monitoring stations on sections of hot-mix asphalt (HMA; 421650071120401) and open-graded friction course pavement (OGFC; 421652071120601) on Interstate 95 near Needham, Massachusetts, between October 1, 2018, and September 30, 2021.
Table 14.
Summary of precipitation, antecedent conditions, and winter conditions at or near U.S Geological Survey monitoring stations on sections of dense-graded hot-mix asphalt (421650071120401) and open-graded friction course pavement (421652071120601) on Interstate 95 near Needham, Massachusetts, between October 1, 2018, and September 30, 2021.[Precipitation measured at U.S. Geological Survey station 421652071120601 (U.S. Geological Survey, 2023b). Snowfall data from National Oceanic and Atmospheric Administration (2023) Walpole, Massachusetts, station. Dates of salt application provided by Massachusetts Department of Transportation (MassDOT) (Marc Sullivan, MassDOT, written commun., 2023). A water year is the period between October 1 and September 30 and is designated by the year in which it ends]
The relative magnitudes of annual salt loads were largely driven by winter conditions and deicing practices; however, the variability between sites was affected by the relative proportion of salt export by three primary mechanisms. These transport mechanisms are physical removal of salt-laden frozen precipitation by snowplow, export of salt crystals by wind or vehicle turbulence, and direct runoff of dissolved salt. In this study, loads were measured on the basis of the concentrations of Cl and Na in runoff and do not account for salt export off the highway surface by snowplow or wind. Because the application of deicing compounds was the same on each pavement section (due to proximity, see fig. 1), differences in salt loads between the two sites were driven by pavement characteristics that affect the relative magnitudes of the three transport mechanisms. For example, snow and salt is trapped in the OGFC voids, which removes the salt and snow from the surface where it is available for export off the pavement via wind, vehicle turbulence, or snowplow. The retention of snow and salt in OGFC pavement results in higher salt loads and longer periods of discharge (specifically, longer runoff-event tails). Figure 22 illustrates these differences by showing the timing and magnitude of the Cl load associated with a winter runoff event in WY 2020. Discharge exceeded 0.001 ft3/s at the OGFC station about 2 hours after the HMA station because discharge was attenuated in the porous-pavement layer. Runoff from the HMA site reached the total Cl load around 14:00, but the Cl load in runoff from the OGFC site continued to accumulate and exceed the HMA load as snowmelt from the voids continued to discharge highly concentrated (with respect to Cl) runoff.
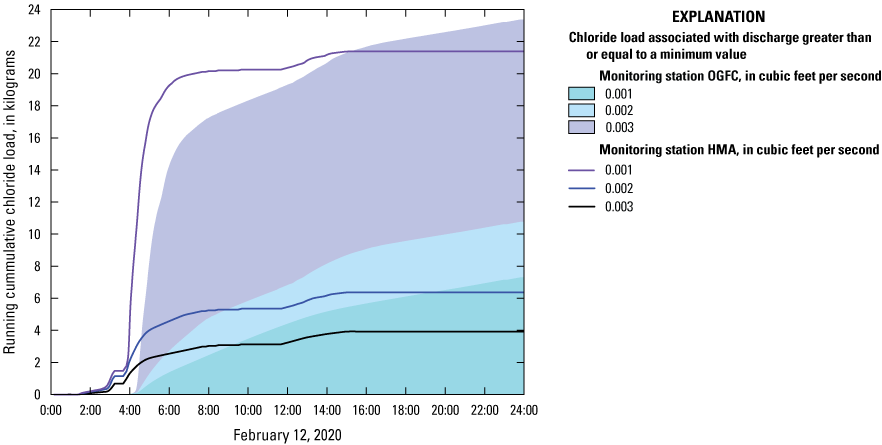
Comparison of cumulative chloride loads for a winter runoff event on February 12, 2020, at U.S. Geological Survey monitoring stations on sections of hot-mix asphalt (HMA; 421650071120401) and open-graded friction course pavement (OGFC; 421652071120601) on Interstate 95 near Needham, Massachusetts.
Transport of salt from the highway surface by wind, vehicle turbulence, or plow is evident in records of soil conductivity measured at 3, 9, and 15 ft from the edge of the HMA pavement (fig. 23). Increases in soil conductivity (up to about 4.1 decisiemens per meter at 25 degrees Celsius) during wet precipitation and snowmelt indicated that salt-laden water was being mobilized. These spikes in conductivity occurred most frequently at 9 and 15 ft from the pavement, where the bulk of snow was deposited from plow trucks. The mass of salt transported off the highway pavement by wind and plow cannot be determined from the available data. The consistent relation between increases in soil conductivity adjacent to the highway and discharge (due to precipitation and snowmelt) indicates that it may be a substantial component of salt loading that is not accounted for in the measurements of highway runoff from the weir-box outlet alone.
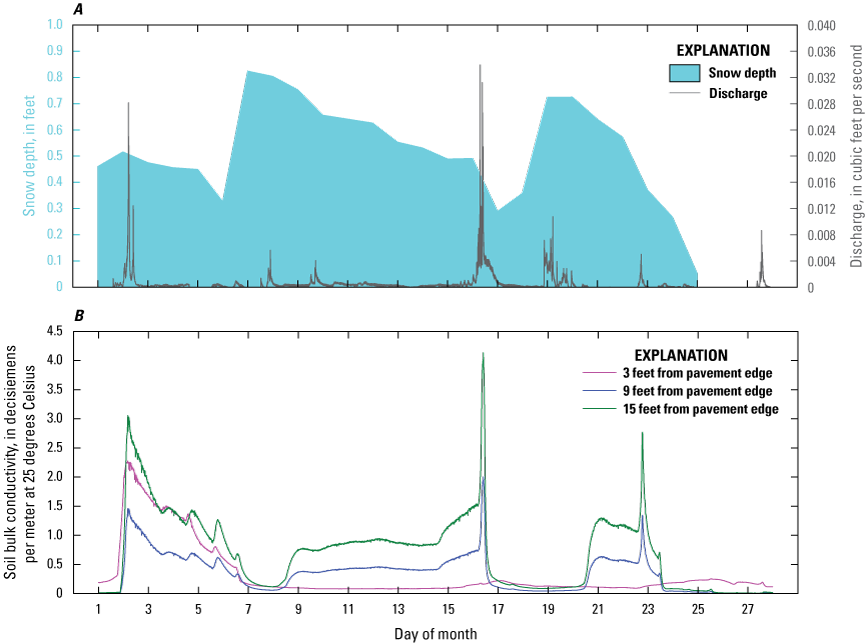
A, Recorded snow depth measured at U.S. Geological Survey station 421652071120601 (open-graded friction course [OGFC] pavement) and discharge measured at U.S. Geological Survey station 421650071120401 (hot-mix asphalt [HMA] pavement); and B, soil bulk electrical conductivity values measured 3 feet, 9 feet, and 15 feet from the HMA pavement edge on Interstate 95 near Needham, Massachusetts, February 2021.
The relative proportion of salt export by wind and vehicle turbulence is also affected by the duration of dry antecedent periods. After shorter dry antecedent periods, during which salt can crystalize on the road surface and become entrained by wind and turbulence, a higher proportion of the salt load is available for export in direct runoff. The average time between runoff events in WY 2020 (88 hours; table 14) was less than the average time between runoff events in WYs 2019 and 2021 (95 and 129 hours, respectively). The combination of the shorter antecedent conditions and the lower snowfall amounts (26.6 in.) in WY 2020 resulted in similarly low-magnitude salt loads at the two pavement study sites (530 and 523 kg at the HMA and OGFC sites, respectively, based on 0.003 ft3/s runoff).
Based on the data available in this study, under the same treatment of deicing materials, salt loads in runoff from the OGFC pavement were about two times greater than loads from the HMA pavement during years with average snowfall amounts but were approximately equal in an atypically mild year. Load estimates were between 1.2 and 2.6 times greater when loads associated with flows less than 0.003 ft3/s also were estimated because winter discharges in this low range are often highly concentrated with respect to salt. Although explanations are offered for the roles that the three salt-transport mechanisms play in the salt-load estimates, it is not possible to quantify the effect of variability in the relative significance of each mechanism from year to year and between the pavement sections.
Concentrations of Nutrients and Total-Recoverable Metals
Although the primary focus of this study was to quantify the sediment loads from HMA and OGFC pavement sections, concentrations and loads of chemical constituents from highway runoff also may adversely affect the quality of receiving waters. Therefore, the concentrations of nutrients and total-recoverable metals were measured over the 3-year study period at each site to estimate loads of these constituents. Concentrations were measured in composite stormwater samples collected from the outlet of the weir box and in samples of sediment retained in the weir sump (fig. 3). The weir-sump sediment samples represent the concentrations of constituents bound to sediment particles, whereas the runoff concentrations represent both dissolved (unfiltered) and particulate-bound fractions.
Composite samples of runoff were collected during 15 storms at the HMA and OGFC monitoring stations to characterize the runoff quality with respect to EMCs of SS, TSS, TDN, PN, total nitrogen, TP, carbon (dissolved and particulate), and total-recoverable metals. The selected events (table 5) represent runoff volumes in the upper 50 percent of the distribution of all runoff-event volumes (fig. 24A) and were collected primarily in the second half of the study period. Although the SS EMCs in the composite samples range from less than the 10th to greater than the 90th percentiles of SS EMCs in all runoff events (fig. 24B), the median and mean EMCs for the 15 storms at HMA and OGFC sites (table 15) were more similar to each other than to those observed in the overall population of SS EMCs. The median SS EMC of all runoff events was 29 mg/L at the HMA site and 15 mg/L at the OGFC site, whereas the medians of the composite runoff samples were 13 and 11 mg/L, respectively. TSS concentrations also reflect similar ranges of values but were typically censored at less than 15 mg/L. Of the HMA pavement results, 47 percent of samples were less than 15 mg/L, and uncensored values ranged from 17 to 128 mg/L. Seventy-three percent of samples from the OGFC pavement were less than 15 mg/L and had uncensored values ranging from 19 to 80 mg/L. Because the composite runoff samples (n=15 storms) represent narrower ranges of concentrations and lower central tendencies than the EMCs of all runoff events, the ranges and magnitudes of nutrient and total-recoverable metal concentrations and loads may be similarly affected.
Table 15.
Summary of concentrations of suspended sediment, total phosphorus, and total-recoverable metals measured in paired composite runoff samples collected during 15 storms at U.S. Geological Survey monitoring stations on sections of dense-graded hot-mix asphalt (421650071120401) and open-graded friction course pavement (421652071120601) on Interstate 95 near Needham, Massachusetts, between October 1, 2018, and September 30, 2021.[The water-quality parameter code in parentheses is denoted by the letter p and the five-digit identification number; the full name of each constituent is listed in table 3. Data are available in the National Water Information System (U.S. Geological Survey, 2023b). Confidence intervals computed using nonparametric bootstrap method. Mean for cadmium computed with nonparametric Kaplan-Meier method due to presence of censored data. mg/L, milligram per liter; HMA, hot-mix asphalt; OGFC, open-graded friction course; µg/L, microgram per liter]
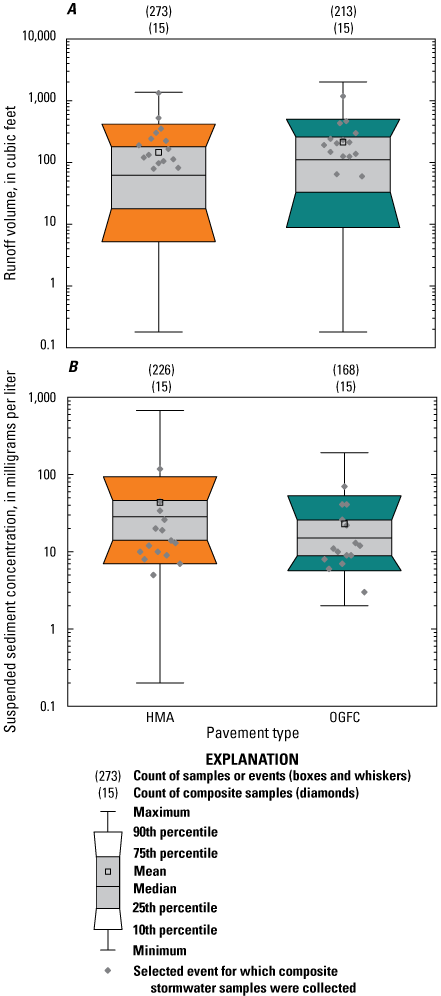
Distribution of A, runoff volumes and B, event-mean concentrations of suspended sediment in all runoff events and the 15 selected storms for which composite samples were collected for the analysis of total nutrient and total-recoverable metal concentrations at U.S. Geological Survey monitoring stations on sections of hot-mix asphalt (HMA; 421650071120401) and open-graded friction course pavement (OGFC; 421652071120601) on Interstate 95 near Needham, Massachusetts, between October 1, 2018, and September 30, 2021.
The concentrations of total-recoverable metals in composite runoff samples varied by an order of magnitude or more for many constituents and were not normally distributed (fig. 25). These distributions are common in highway and urban-runoff data because they are characterized by high variability and often include high-concentration outliers (Smith, 2002; Smith and Granato, 2010; Smith and others, 2018; Granato and Jones, 2019). The mean concentrations at the HMA and OGFC sites differed by less than 30 percent (computed as RPD) for all total-recoverable metals, except for arsenic (40 percent) and zinc (35 percent), although the mean concentrations at the OGFC site were commonly higher (in 6 out of 10 total-recoverable metals) (table 15). Higher concentrations of arsenic and zinc from the OGFC site may be the result of the constituents leaching from the asphalt-rubber binder or the pavement material. Leachate results from this study indicate that concentrations of dissolved arsenic (2.7 and 5.5 µg/L, USGS parameter code 01000) and dissolved zinc (4.5 and 10.0 µg/L, USGS parameter code 01090) leached from samples of HMA and OGFC pavement were 104 and 122 percent higher, respectively, in the OGFC pavement sample (Spaetzel and others, 2023). Other mean concentrations of stormwater composite samples differed by less than 20 percent for barium, chromium, copper, lead, and nickel. Even among the total-recoverable metals that differed by greater than 20 percent, the 95-percent confidence intervals about the means overlap substantially (table 15), which reflects both the high variability of the EMCs and the similarity in EMC magnitudes between the two pavement types.
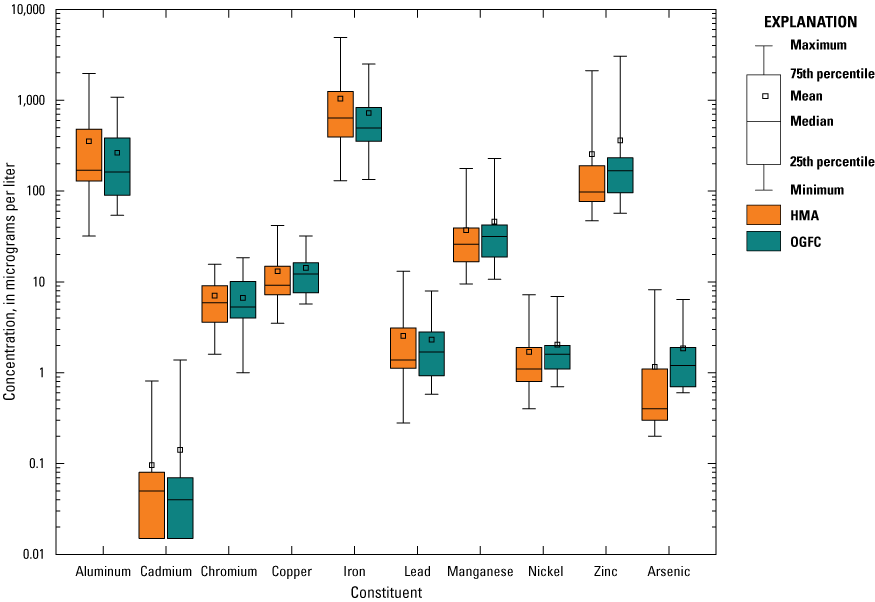
Distribution of concentrations of total-recoverable metals in 15 paired composite samples of runoff at U.S. Geological Survey monitoring stations on sections of hot-mix asphalt (HMA; 421650071120401) and open-graded friction course pavement (OGFC; 421652071120601) on Interstate 95 near Needham, Massachusetts, collected between October 1, 2018, and September 30, 2021. The minimum, 10th percentile, and 25th percentile values for cadmium are equal; 40 percent of cadmium results were censored.
The concentrations of carbon and nutrients also were similar in samples of runoff from the HMA and OGFC monitoring stations, with means and medians differing by less than 40 percent for most constituents (fig. 26). However, DOC was a notable exception, with distinctly higher concentrations in runoff samples from the OGFC pavement. The mean concentration in composite samples collected at the OGFC site (8.7 mg/L) was approximately two times greater than the mean of DOC concentrations in composite samples collected at the HMA site (4.5 mg/L) (fig. 26). The higher concentrations of DOC at the OGFC site may reflect the dissolution of organic carbon from the asphalt binder in the pavement material or from decomposition of organic matter (leaves and sticks) retained in the OGFC pavement layer. Laboratory studies of leachate from various permeable and open-graded pavement materials indicate that concentrations of DOC are less than 5 mg/L (Kayhanian and others, 2019). In this study, DOC leachate was about 31 percent higher (normalized to sample mass) in the OGFC pavement sample (5.5 mg/L) than the HMA pavement sample (4.2 mg/L) (Spaetzel and others, 2023). In part, this may explain some of the difference in DOC concentration; however, dissolution of organic matter retained in the OGFC pavement may be a greater source of DOC than the pavement itself. Because runoff from OGFC pavement interacts with more sediment and pavement surface area, greater differences in the concentrations of dissolved constituents (such as TDN) may have been expected (Roseen and others, 2012; Moores and others, 2013); however, this effect may have been obscured either by the high variability of runoff EMCs or because the composite samples represented only the upper 50 percent of runoff-event volumes.
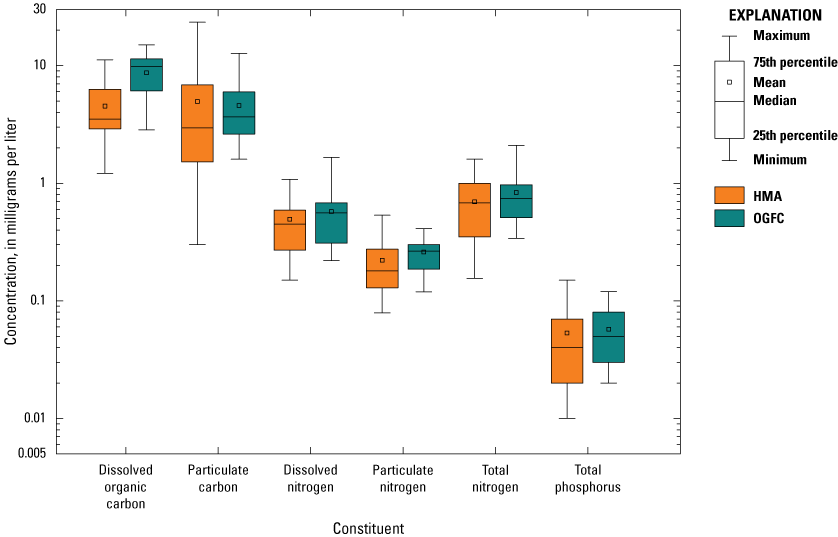
Distribution of concentrations of dissolved organic carbon; particulate carbon; dissolved, particulate, and total nitrogen; and total phosphorus in paired composite runoff samples collected during 15 storms at U.S. Geological Survey monitoring stations on sections of hot-mix asphalt (HMA; 421650071120401) and open-graded friction course pavement (OGFC; 421652071120601) on Interstate 95 near Needham, Massachusetts, between October 1, 2018, and September 30, 2021.
The concentrations of TP and total-recoverable metals measured in the annual sediment samples collected from the weir sump were similar at the HMA and OGFC sites. Among all paired concentrations, the average RPD between sites was 38 percent, and although RPDs varied from 0 to 150 percent, concentrations were not consistently higher or lower for a particular site. Concentrations also did not vary substantially year to year, except for TP, which varied by one to two orders of magnitude between WYs 2019 and 2020 (table 16). The low TP concentrations observed in WY 2019 (17 to 37 mg/kg across both sites and particle-size classes; table 16) were consistent with low-end ranges observed in Massachusetts bridge-deck sediment samples (particle sizes greater than 0.0625 mm) (Smith and others, 2018) and may reflect the natural variability of highway-sediment composition with respect to the proportions of organic plant matter, mineral sediment, and pavement material. Concentrations of TP and most of the total-recoverable metals were up to six times greater in the particle-size classes less than 0.25 mm in diameter than in the coarser material (between 1.0 and 2.0 mm in diameter), partly because of the inverse relation between sediment surface area and sediment grain size (Smith and Granato, 2010). Therefore, it was important to account for the effect of grain size on concentration to accurately estimate the loads of these constituents, especially because sediment grain sizes were distributed unequally across particle-size classes in samples from each site (fig. 27; Förstner and Wittmann, 1981; Horowitz and Elrick, 1987; Horowitz, 1991; Smith, 2002, 2005; Breault and others, 2005; Smith and Granato, 2010).
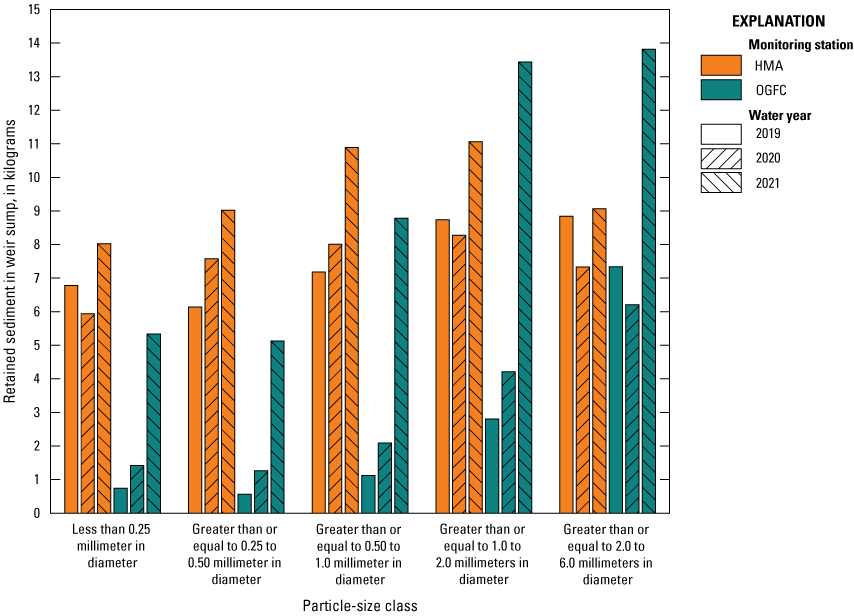
Mass of sediment, by particle-size class, retained in the weir sumps at U.S. Geological Survey monitoring stations on sections of hot-mix asphalt (HMA; 421650071120401) and open-graded friction course pavement (OGFC; 421652071120601) on Interstate 95 near Needham, Massachusetts, collected between October 1, 2018, and September 30, 2021.
Table 16.
Concentrations of total phosphorus and total-recoverable metals in samples of sediment collected annually from the weir sumps of two U.S. Geological Survey monitoring stations on Interstate 95 near Needham, Massachusetts, between October 1, 2018, and September 30, 2021.[Locations of stations shown in figure 1. Data are available in the National Water Information System (U.S. Geological Survey, 2023b). The alphanumeric identifiers starting with “p” are the U.S. Geological Survey parameter codes (U.S. Geological Survey, 2023b); see table 4 for full definitions. USGS, U.S. Geological Survey; HMA, hot-mix asphalt; <, less than; ≥, greater than or equal to; OGFC, open-graded friction course]
Nutrient and Total-Recoverable Metal Loads
Total loads of TP and metals over the 3-year study period represent the sums of the loads measured in runoff composite samples collected from the weir-box outlet, sediment retained in the weir sump, and sediment retained in the trench (fig. 3). Although five particle-size classes are represented in figure 27, concentrations were measured in samples representing the four particle-size classes in table 16; therefore, the total constituent loads are associated with sediment less than 2.0 mm in diameter. The materials greater than 2.0 mm in diameter primarily consisted of gravels, leaves, and debris. The total constituent loads were between 7 and 64 percent higher at the HMA site for most constituents, except arsenic, cadmium, and zinc (fig. 28). Of these constituents, the load from the OGFC site was higher but only by a maximum of 23 percent (zinc). The loads estimated for the weir and trench sediment reflect greater differences between the two monitoring stations than the total loads, where the HMA constituent loads in the retained sediment were two to five times greater than those at OGFC site. Although similar concentrations were observed in samples of sediment at the two sites (table 16), the distributions of sediment particle sizes were distinct (fig. 27). The sediment masses for the HMA samples were evenly distributed among the four size classes (25 percent in each of four particle-size classes on average). In comparison, OGFC samples had higher proportions of the larger diameter particles (41 to 54 percent of weir-sump sediment particles less than 2.0 mm in diameter were between 1.0 and 2.0 mm in diameter), which resulted in lower loads than those from the HMA site. The difference in particle-size distribution at HMA and OGFC sites is discussed in the “Sediment Loads” section and reflects the retention of sediment in OGFC pavement that diminished over time.
The relative proportions of the loads in runoff varied by constituent and monitoring station from 34 percent (aluminum at the HMA station) to 90 percent (barium at the OGFC station); however, for all constituents, the proportion of runoff load was higher at the OGFC site than at the HMA site (fig. 28A). The average concentrations of TP and total-recoverable metals were no more than 50 percent different between the two sites (although the OGFC load was higher for 7 out of the 11 constituents) in the runoff samples. The total discharge greater than or equal to 0.003 ft3/s over the 3-year study period was 14 percent higher at the OGFC site (39,900 and 45,500 ft3 from the HMA and OGFC sites, respectively). Consequently, the estimated runoff loads are higher despite similar constituent concentrations. As discussed previously, the 15 composite samples for each site represent a lower range of SS EMCs compared to the overall EMC population of events. Therefore, the constituent loads in runoff may be underestimated for the HMA station, based on the concentration data of the runoff composite samples. The sediment load estimated for the HMA site from EMCs of SS measured in all events was 31 percent greater (34 kg) than the estimate of load computed with the average SS EMC of the 15 runoff composite samples (26 kg), whereas the estimates for the OGFC site differed by no more than 2 kg (25 kg based on runoff composite samples and 23 kg based on all SS EMCs).
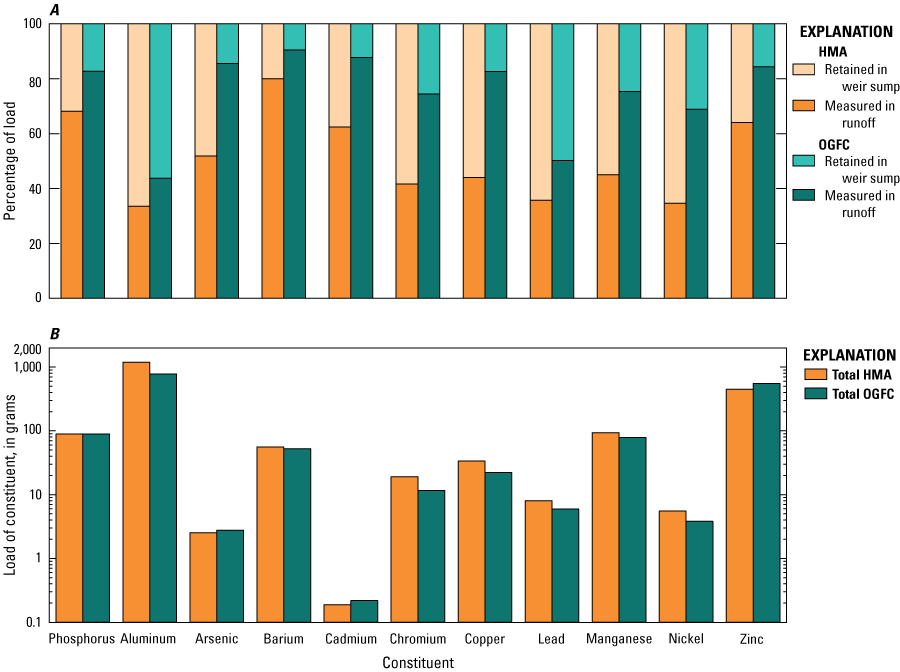
A, The percentages of phosphorus and total-recoverable metal loads measured in sediment retained in the weir sump and in runoff; and B, the total load of each constituent measured at U.S. Geological Survey monitoring stations on sections of hot-mix asphalt (HMA; 421650071120401) and open-graded friction course pavement (OGFC; 421652071120601) on Interstate 95 near Needham, Massachusetts, between October 1, 2018, and September 30, 2021.
Summary
The U.S. Geological Survey (USGS), in cooperation with the Massachusetts Department of Transportation (MassDOT), conducted a field study from October 1, 2018, through September 30, 2021, to document the quality of runoff from two serial sections of pavement on Interstate 95 near Needham, Massachusetts, under identical traffic volume and maintenance characteristics. The purpose of this study was to gain a better understanding of the water-quality benefits that open-graded friction course (OGFC) pavement can provide relative to traditional hot-mix asphalt (HMA) pavement. Scientifically defensible data are needed by MassDOT to help evaluate OGFC as a linear structural-source control for the protection of the quality of receiving waters and aquatic life. Data generated in this study may be relevant to other New England (or northern) States using similar OGFC mixes on high-traffic-volume roadways (155,000 vehicles per day on average). During the summer of 2018, Interstate 95 was resurfaced with a layer of OGFC pavement except for a 328-foot (ft) complete cross section that was resurfaced with traditional dense-graded HMA pavement to serve as a control section for comparison. The OGFC pavement layer is about 0.1 ft thick, with an air-void content of 15 percent and a minimum permeability specification of about 64 inches per hour (in/hr). The OGFC asphalt mix contains an asphalt-rubber binder created, in part, from vulcanized rubber processed from automobile and truck tires.
In 2018, at each study site, a 72-ft presloped fiberglass trench drain was installed by MassDOT on the right edge of the southbound breakdown lane to collect highway runoff across four travel lanes. Runoff was conveyed to a precast fiberglass manhole with an integrated weir box located opposite of the guardrail at the end of each trench. Monitoring systems were installed in an equipment shelter constructed above each manhole adjacent to the HMA pavement (USGS station number 421650071120401) and the OGFC pavement (USGS station number 421652071120601) to collect continuous measurements of water level, water temperature, specific conductance in each weir box and to collect samples of highway runoff. Noncontact pavement sensors were installed at each monitoring station to measure pavement surface temperature and pavement surface conditions representing a semiquantitative amount and state of water on the pavement (dry, damp, wet, snow, ice, standing water, deep snow, or black ice). Precipitation, air-temperature, and snow-depth measurements also were collected at the OGFC site. In 2020, wind sensors were installed on the HMA monitoring shelter and near the guardrail adjacent to the trench at each station to characterize the direction and magnitude of wind speed. Bulk soil conductivity sensors were installed on the shoulder adjacent to the HMA trench 3, 9, and 15 ft from the pavement edge.
Samples of highway runoff were collected on a flow-proportional basis by automatic samplers for nearly every runoff event during the study period (October 2018 through September 2021) and analyzed for concentrations of suspended sediment (SS) and SS particle size. Flow-proportional composite samples also were collected for 15 storms and analyzed for concentrations of major ions, total phosphorus (TP), dissolved nitrogen, particulate nitrogen, particulate carbon, and total-recoverable metals. Following the start of the field period in 2018, in September or October of each year, the sediment in each weir sump was removed, sieved into five particle-size ranges, and dried to determine the mass of each particle size. Samples of sieved sediment in four particle-size ranges less than 2.0 millimeters (mm) in diameter were analyzed for concentrations of TP and 10 total-recoverable metals. Similarly, the sediment in each trench was removed, sieved into five particle-size ranges, and dried to determine the mass of each particle size in July 2020, September 2020, and September 2021. Samples of dry deposition were collected manually and with automatic methods in the center of each trench to estimate sediment buildup in the trenches during dry antecedent periods. Semiannual permeameter tests were done on the OGFC pavement to estimate changes in pavement permeability during the study period.
Permeameter measurements were made semiannually on the OGFC pavement section adjacent to the trench in the center of the breakdown lane, in the center of the first travel lane, and in the tire-track area of the first travel lane. The median value of the initial permeability measurements made in the center of the breakdown lane was 210 in/hr, and the subsequent median value of measurements made 10 months later was the same (210 in/hr); however, pavement permeability in the breakdown lane decreased by nearly 2 orders of magnitude by the end of the study period in October 2021, with the greatest change in permeability occurring in 2021. The median value of the initial permeability measurements made in the center of the first travel lane was 82 in/hr and was 96 in/hr when measured again 10 months later. Over the study period, pavement permeability in the first travel lane decreased by about 53 percent in the center of the lane and by about 83 percent in the inner tire track, although the first measurements in the inner tire track were not made until July 2019. These findings indicate that the void structure of the OGFC pavement was clogging with sediment and that pavement permeability is maintained longer on the travel lane than the breakdown lane, likely because of the cleaning pressure or suction caused by tires traveling over the pavement layer. The thermal conductivity of the OGFC layer also appeared to be affected by the decrease in permeability by the third year of the study, in which monthly mean OGFC pavement surface temperature was similar to HMA pavement surface temperature during the winter months. During the first two winter seasons, surface temperature was lower on the OGFC pavement; however, air movement within the pavement layer was potentially restricted by increased sedimentation later in the study, resulting in thermal properties similar to those of the HMA pavement.
Road-weather conditions, which are semiquantitative measurements of water on the pavement surface, were determined by using noncontact pavement sensors on the first travel lane of each monitoring station. In water years (WYs) 2019 and 2020, a standing-water condition during nonwinter storms occurred about five times more frequently on the HMA pavement than on the OGFC pavement, indicating that water was draining into the OGFC void structure as designed. Similar observations were recorded for wet pavement conditions in WY 2019, but the frequencies of observations for the wet pavement condition were comparable at each monitoring station in WY 2020. In WY 2021, both wet and standing-water conditions were recorded more frequently on the OGFC pavement than the HMA pavement. It is unclear why this condition occurred at a greater frequency on the OGFC pavement during this period, but the measurements may be related, in part, to the decrease in the permeability of the OGFC pavement, which limited the flow through the pavement layer, causing the water to breach the pavement surface.
Pavement conditions reflecting winter weather (frozen water), particularly “ice” conditions, were measured nearly twice as often on the HMA pavement as on the OGFC pavement. The number of chemically active measurements, where a damp or wet condition was detected when the pavement temperature was below 0 degrees Celsius and the salt concentration of the pavement water was sufficient to lower the freezing point to or below the pavement surface temperature, was only marginally greater on the HMA pavement than the OGFC pavement during WYs 2019 and 2020; however, there were about 20 percent more chemically active measurements recorded on the OGFC pavement than the HMA pavement in WY 2021. Unlike on HMA pavement, where salt is washed from the pavement surface, salt water saturates the OGFC pavement and is pumped from the void structure by tire suction; such action is further driven by high traffic volumes.
Flow-weighted event-mean concentrations (EMCs) of SS were determined for 226 runoff events at the HMA monitoring station and for 168 runoff events at the OGFC monitoring station; the EMCs were calculated from concentrations measured in over 1,000 subcomposite samples collected at each monitoring station. The SS EMCs computed for all events ranged from less than 0.5 to 677 milligrams per liter (mg/L) at HMA monitoring stations and from 2.0 to 192 mg/L at OGFC monitoring stations, with respective median EMCs of 29 and 15 mg/L. Although the stations experienced the same precipitation conditions, discharge from some small runoff events did not exceed the discharge threshold (0.005 cubic foot per second [ft3/s]) to trigger sampling at OGFC, and, due to the extension of runoff that often occurred on the OGFC pavement, some events at the OGFC station encompassed multiple sampling events at the HMA station. EMCs of SS were significantly higher in HMA monitoring station samples according to Mann-Whitney test results (p-value less than 0.05) over the entire study period and when grouped by each WY.
Sediment loads were estimated from runoff samples collected at the weir-box outlet and from the mass of sediment removed from each weir sump and trench over the 3-year study period. Loads of SS discharged from each weir box were estimated from EMCs of SS and the respective runoff volume for each runoff event. The SS load was estimated for periods of discharge less than 0.005 ft3/s and greater than or equal to 0.003 ft3/s, representing the unsampled load on the basis of the 10th percentile concentration of the annual subcomposite SS concentrations for each monitoring station. The additional SS loads based on this method were less than 0.5 kilograms (kg) per year for both monitoring stations, which represents 3 and 12 percent of the annual SS runoff loads or 0.9 and 1.8 percent of the 3-year total loads at the HMA and OGFC stations, respectively. Over the study period, the total load of sediment for particle sizes up to 6.0 mm in diameter was 202 kg from the HMA pavement and 120 kg from the OGFC pavement, representing a difference of 41 percent relative to the HMA pavement. Comparison of the study-period loads by particle-size class indicates that the greatest differences between the loads from the two stations were in the five particle-size ranges less than 2.0 mm in diameter, indicating that particles in these ranges are retained by the voids in the OGFC pavement. The 3-year total load of sediment less than 2.0 mm in diameter at the OGFC monitoring station was 49 percent lower than the load of sediment at the HMA monitoring station (loads equal to 168 and 85 kg, respectively). The relative difference between sediment-load estimates at each station over the study period indicates that OGFC pavement was clogging, a condition that also affected the permeability of the pavement. Specifically, the average total load of sediment in WYs 2019–20 was 68 percent lower at the OGFC monitoring station than from the HMA monitoring station, but the difference between the respective loads decreased to 19 percent in the third year of the study. Furthermore, in WY 2021, the load of sediment between 1.0 and 6.0 mm in diameter at the OGFC monitoring station exceeded the HMA monitoring station sediment load in this particle-size class. The raveling of OGFC pavement material, which is consistent with this particle-size class, may be contributing to the increase in the sediment load.
To assess the portion of load associated with wind-blown sediment, dry-deposition samplers were installed in WY 2020, and samples were collected for the duration of the study period. The mass of dry deposition collected from the trench adjacent to the HMA pavement was almost consistently higher than the observed mass from the trench adjacent to the OGFC pavement. The rate of dry deposition did not vary substantially between WY 2020 and 2021, but insufficient data were available to estimate the proportion of sediment load in WY 2020. However, dry-deposition estimates for WY 2021 represent about 17 and 8 percent of the HMA and OGFC sediment loads less than 2.0 mm in diameter, respectively.
EMCs and loads of chloride (Cl) and sodium (Na) were estimated from continuous records of discharge and specific conductance by using relations between measurements of specific conductance and concentrations of ions in discrete and composite samples collected throughout the study period. Median EMCs for Cl and Na were 26 and 20 mg/L from the HMA pavement and 36 and 27 mg/L at the OGFC pavement. The distribution of the Cl and Na EMCs was consistently higher at the OGFC monitoring station than the HMA monitoring station each year during the study, although the application of deicing compounds at each of the sites was identical. This observation indicates that more salt is retained on or within the OGFC pavement layer, allowing a greater proportion to be exported from the pavement by runoff. Conversely, a greater amount of salt is removed from the HMA pavement in salt-laden snow and slush by snowplow and by wind or turbulence when the road is dry, which is consistent with dry-deposition data collected in this study. The relocation of salt from the pavement surface to the adjacent shoulder near the HMA pavement by these transport mechanisms is evident in surges of up to 4.1 decisiemens per meter at 25 degrees Celsius in continuous records of soil bulk conductivity measured 3, 9, and 15 ft from the edge pavement during winter snowmelts or rain events.
Loads of Cl and Na were computed annually by summing the runoff-event loads of each constituent for three discharge thresholds to demonstrate the sensitivity of salt-load estimates to discharge. Loads of sodium chloride (salt) estimated for discharge greater than or equal to 0.003 ft3/s were highest in WY 2019 (789 and 1,480 kg at HMA and OGFC monitoring stations, respectively) and lowest in WY 2020 (530 and 523 kg at HMA and OGFC monitoring stations, respectively). The magnitudes of load estimates were between 1.2 and 2.6 times greater when loads associated with flows less than 0.003 ft3/s also were estimated because winter discharges in this low range are often highly concentrated with salt; however, the quality of discharge data in this low range is poor, and as such, the salt loads estimated with discharge less than 0.003 ft3/s are considered less accurate. Loads of salt in runoff from the OGFC pavement were about two times greater than loads from the HMA pavement in WYs 2019 and 2021, which had average snowfall amounts, but were approximately equal in WY 2020, which had a mild winter. As discussed previously, snow and salt are trapped in the OGFC voids, which removes the salt and some snow or water content from the pavement surface where it is available for export by wind, vehicle turbulence, or snowplow. The retention of snow and salt in OGFC pavement results in higher salt loads and extension of the discharge hydrograph during the tail of the storm.
Flow-proportional composite samples were collected during 15 storms that were targeted to ensure that the volume of the weir box was exchanged several times, which resulted in sample events that represent runoff volumes in the upper 50 percent of the distribution of all runoff-event volumes during the study period. Composite samples were analyzed for concentrations of TP and total-recoverable metals to estimate the load of each constituent discharged from the weir. The EMCs of SS in the composite samples ranged from less than the 10th to greater than the 90th percentiles of SS EMCs in all runoff events; however, the median and mean EMCs for the 15 storms at HMA and OGFC monitoring stations were more similar to each other than those observed in the overall population of SS EMCs. The concentrations of total-recoverable metals in the composite runoff samples varied by an order of magnitude or more for many constituents and were not normally distributed. Conversely, the concentrations of total-recoverable metals and TP measured in the sieved sediment samples collected annually from the weir box were similar at the HMA and OGFC monitoring stations, with an average relative difference between sites of 38 percent, and concentrations were not consistently higher or lower for a particular site. Concentrations for sediment constituents also did not vary substantially year to year, except TP, which varied by one to two orders of magnitude between water years 2019 and 2020. Concentrations of TP and most of the total-recoverable metals were up to six times greater in the particle-size classes less than 0.25 mm in diameter than in the particles between 1.0 and 2.0 mm in diameter, partly because of the inverse relation between sediment surface area and sediment grain size. Therefore, the mass of each sediment class and the associated constituent concentration was used to accurately estimate the constituent loads at each site. This method of estimation was particularly important because the distribution of sediment grain sizes was unique from each type of pavement.
Loads of TP and selected total-recoverable metals from the two pavement sections were estimated for the 3-year study period on the basis of (1) constituent concentrations in runoff and (2) constituent concentrations associated with sediment retained in the weir and trench. The weir and trench sediment samples were sieved to five particle-size classes (ranging from less than 0.250 mm to 2.0 mm in diameter) for chemical analyses. Concentrations measured in composite samples of stormwater represent the concentrations of both dissolved and particulate-bound fractions, whereas the sediment samples represent the concentrations of constituents bound to sediment particles. Loads of total-recoverable metals were between 7 and 64 percent higher at the HMA monitoring station for most constituents, except for arsenic, cadmium, and zinc, which were 10, 15, and 23 percent higher at the OGFC monitoring station. The distributions of constituent loads across the sediment and runoff components were dissimilar at each monitoring station. Constituent loads associated with the retained sediment estimated for the HMA monitoring station were two to five times greater than those at OGFC monitoring station, which largely was the result of the differences in the distribution and mass of sediment particle sizes at each site. The sediment masses in each particle-size class for samples from the HMA station were evenly distributed, whereas OGFC samples had higher proportions of particles between 1.0 and 2.0 mm in diameter, resulting in lower loads relative to those from the HMA monitoring station.
The relative proportions of the loads in runoff varied by constituent and site; however, for all constituents, the proportion of runoff load was higher at the OGFC monitoring station than at the HMA monitoring station. This difference was partly because the total discharge greater than or equal to 0.003 ft3/s over the 3-year study period was 14 percent higher at the OGFC monitoring station, and as a result, the estimated runoff loads are higher for similar constituent concentrations. The SS concentrations in the composite samples for each site represent a relatively low range of SS EMCs compared to the overall EMC population of all events. Therefore, the constituent loads in runoff may be underestimated for the HMA station, based on the concentration data of the runoff composite samples. The SS load estimated from sample data for all runoff events at the HMA monitoring station was 8 kg greater than the SS load estimated with the average SS EMC of the 15 runoff composite samples, whereas the estimates for the OGFC station differ by no more than 2 kg using the same method. Median nonwinter event runoff coefficients for the HMA and OGFC monitoring stations were 0.66 and 0.70, respectively, and indicate that the drainage-area estimates are reasonable for each pavement section; therefore, loads of sediment and constituents discussed in this report may be directly compared between the two monitoring stations. The relative difference between the loads at each station should not be confused with a measure of performance because the load to the pavement is not known in either case; however, the study design is unique in that many control variables, including traffic type, volume, density, speed, and highway maintenance practices, are identical between the sites, indicating that sediment and chemical loads to the pavement surface are similar at both sites.
References Cited
Anderson, C.W., 2005, Turbidity, in Wilde, F.D., and Radtke, D.B., eds., Field measurements (2d ed.): U.S. Geological Survey Techniques of Water-Resources Investigations, book 9, chap. A6.7, 55 p., accessed March 23, 2023, at https://doi.org/10.3133/twri09A6.7.
Barrett, M.E., 2008, Effects of permeable friction course on highway runoff: Journal of Irrigation and Drainage Engineering, v. 134, no. 5, p. 646–651, accessed May 10, 2017, at https://doi.org/10.1061/(ASCE)0733-9437(2008)134:5(646).
Barrett, M.E., Kearfott, P., and Malina, J.F., Jr., 2006, Stormwater quality benefits of a porous friction course and its effect on pollutant removal by roadside shoulders: Water Environment Research, v. 78, no. 11, p. 2177–2185, accessed March 23, 2015, at https://doi.org/10.2175/106143005X82217.
Bent, G.C., Gray, J.R., Smith, K.P., and Glysson, G.D., 2000, A synopsis of technical issues for monitoring sediment in highway and urban runoff: U.S. Geological Survey Open-File Report 00–497, 51 p. [Also available at https://doi.org/10.3133/ofr2000497.]
Breault, R.F., and Granato, G.E., 2000, A synopsis of technical issues of concern for monitoring trace elements in highway and urban runoff: U.S. Geological Survey Open File Report 00–422, 67 p. [Also available at https://doi.org/10.3133/ofr2000422.]
Breault, R.F., Smith, K.P., and Sorenson, J.R., 2005, Residential street-dirt accumulation rates and chemical composition, and removal efficiencies by mechanical- and vacuum-type sweepers, New Bedford, Massachusetts, 2003–04: U.S. Geological Survey Scientific Investigations Report 2005–5184, 27 p. [Also available at https://doi.org/10.3133/sir20055184.]
Butler, D., May, R.W.P., and Ackers, J.C., 1996, Sediment transport in sewers, Part 1—Background: Proceedings of the Institution of Civil Engineers—Water and Maritime Engineering, v. 118, no. 2, p. 103–112. [Also available at https://doi.org/10.1680/iwtme.1996.28431.]
California Department of Transportation, 2000, District 7 litter management pilot study final report: Sacramento, Calif., California Department of Transportation, Report CTSW–RT–00–013, 543 p., accessed September 14, 2022, at https://citeseerx.ist.psu.edu/viewdoc/download?doi=10.1.1.436.733&rep=rep1&type=pdf.
Canty, A., and Ripley, B., 2022, boot—Bootstrap functions (originally by Angelo Canty for S), (v. 1.3–28.1): The Comprehensive R Archive Network web page, accessed February 14, 2023, at https://cran.r-project.org/package=boot.
Church, P.E., Armstrong, D.S., Granato, G.E., Stone, V.J., Smith, K.P., and Provencher, P.L., 1996, Effectiveness of highway-drainage systems in preventing contamination of ground water by road salt, Route 25, southeastern Massachusetts—Description of study area, data collection programs, and methodology: U.S. Geological Survey Open-File Report 96–317, 72 p. [Also available at https://doi.org/10.3133/ofr96317.]
Church, P.E., Granato, G.E., and Owens, D.W., 1999, Basic requirements for collecting, documenting, and reporting precipitation and stormwater-flow measurements: U.S. Geological Survey Open-File Report 99–255, 30 p. [Also available at https://doi.org/10.3133/ofr99255.]
Cooley, L.A., Jr., 1999, Permeability of superpave mixtures—Evaluation of filed permeameters: National Center for Asphalt Technology, Report 99–1, 61 p., accessed March 6, 2020, at https://rosap.ntl.bts.gov/view/dot/13975.
Cooley, L.A., Jr., Brumfield, J.W., Mallick, R.B., Mogawer, W.S., Partl, M.N., Poulikakos, L.D., and Hicks, G., 2009, Construction and maintenance practices for permeable friction courses: Transportation Research Board National Cooperative Highway Research Program Report 640, 120 p., accessed March 6, 2020, at https://doi.org/10.17226/14310.
Duan, N., 1983, Smearing estimate—A nonparametric retransformation method: Journal of the American Statistical Association, v. 78, no. 383, p. 605–610, accessed June 1, 2023, at https://doi.org/10.1080/01621459.1983.10478017.
Eck, B.J., Winston, R.J., Hunt, W.F., and Barrett, M.E., 2012, Water quality of drainage from permeable friction course: Journal of Environmental Engineering, v. 138, no. 2, p. 174–181, accessed March 31, 2015, at https://ascelibrary.org/doi/pdf/10.1061/%28ASCE%29EE.1943-7870.0000476.
Edwards, T.K., and Glysson, G.D., 1999, Field methods for measurement of fluvial sediment: U.S. Geological Survey Techniques of Water-Resources Investigations, book 3, chap. C2, 89 p. [Also available at https://pubs.usgs.gov/twri/twri3-c2/html/pdf.html.]
Fishman, M.J., ed., 1993, Methods of analysis by the U.S. Geological Survey National Water Quality Laboratory—Determination of inorganic and organic constituents in water and fluvial sediments: U.S. Geological Survey Open-File Report 93–125, 217 p., accessed March 23, 2023, at https://doi.org/10.3133/ofr93125.
Fishman, M.J., and Friedman, L.C., 1989, Methods for determination of inorganic substances in water and fluvial sediments: U.S. Geological Survey Techniques of Water-Resources Investigations, book 5, chap. A1, 545 p., accessed March 23, 2023, at https://doi.org/10.3133/twri05A1.
Förstner, U., and Wittmann, G.T.W., 1981, Metal pollution in the aquatic environment: New York, Springer-Verlag, 486 p. [Also available at https://doi.org/10.1007/978-3-642-69385-4.]
Garbarino, J.R., Kanagy, L.K., and Cree, M.E., 2006, Determination of elements in natural-water, biota, sediment, and soil samples using collision/reaction cell inductively coupled plasma-mass spectrometry: U.S. Geological Survey Techniques and Methods, book 5, chap. B1, 87 p., accessed March 23, 2023, at https://doi.org/10.3133/tm5B1.
Garbarino, J.R., and Struzeski, T.M., 1998, Methods of analysis by the U.S. Geological Survey National Water Quality Laboratory—Determination of elements in whole-water digests using inductively coupled plasma-optical emission spectrometry and inductively coupled plasma-mass spectrometry: U.S. Geological Survey Open-File Report 98–165, 101 p., accessed March 23, 2023, at https://doi.org/10.3133/ofr98165.
Gilson Company, Inc., 2019, National Center for Asphalt Technology (NCAT) Asphalt Field Permeameter Kit AP–1B operating manual: Lewis Center, Ohio, Gilson Company, Inc., accessed June 3, 2021, at https://www.globalgilson.com/ncat-asphalt-field-permeameter-kit.
Granato, G.E., 2006, Kendall-Theil Robust Line (KTRLine—version 1.0)—A visual basic program for calculating and graphing robust nonparametric estimates of linear-regression coefficients between two continuous variables: U.S. Geological Survey Techniques and Methods, book 4, chap. A7, 31 p. [Also available at https://doi.org/10.3133/tm4A7.]
Granato, G.E., 2019, Highway-Runoff Database (HRDB) version 1.1.0: U.S. Geological Survey data release, accessed December 10, 2022, at https://doi.org/10.5066/P94VL32J.
Granato, G.E., and Cazenas, P.A., 2009, Highway-Runoff Database (HRDB version 1.0)—A data warehouse and preprocessor for the stochastic empirical loading and dilution model: Federal Highway Administration, FHWA–HEP–09–004, 57 p., accessed February 20, 2023, at https://pubs.usgs.gov/sir/2009/5269/disc_content_100a_web/FHWA-HEP-09-004.pdf.
Granato, G.E., and Jones, S.C., 2019, Simulating runoff quality with the highway runoff database and the stochastic empirical loading and dilution model: Transportation Research Record: Journal of the Transportation Research Board, v. 2673, no. 1, p. 136–142, accessed February 27, 2023, at https://doi.org/10.1177/0361198118822821.
Granato, G.E., and Smith, K.P., 1999, Estimating concentrations of road-salt constituents in highway-runoff from measurements of specific conductance: U.S. Geological Survey Water-Resources Investigations Report 99–4077, 22 p. [Also available at https://doi.org/10.3133/wri994077.]
Guy, H.P., 1969, Laboratory theory and methods for sediment analysis: U.S. Geological Survey Techniques of Water-Resources Investigations, book 5, chap. C1, 58 p., accessed March 23, 2023, at https://doi.org/10.3133/twri05C1.
Helsel, D.R., 2011, Statistics for censored environmental data using Minitab and R (2d ed.): Hoboken, N.J., Wiley, 324 p. [Also available at https://doi.org/10.1002/9781118162729.]
Helsel, D.R., Hirsch, R.M., Ryberg, K.R., Archfield, S.A., and Gilroy, E.J., 2020, Statistical methods in water resources: U.S. Geological Survey Techniques and Methods, book 4, chap. A3, 458 p., accessed July 20, 2020, at https://doi.org/10.3133/tm4A3. [Supersedes USGS Techniques of Water-Resources Investigations, book 4, chap. A3, version 1.1.]
Hem, J.D., 1985, Study and interpretation of the chemical characteristics of natural water (3d ed.): U.S. Geological Survey Water-Supply Paper 2254, 263 p. [Also available at https://doi.org/10.3133/wsp2254.]
High Sierra Electronics Inc, 2017, Datasheet 5433 icesight road surface sensor: Grass Valley, Calif., High Sierra Electronics Inc., 2 p., accessed December 22, 2021, at https://hsierra.com/download/datasheet-5433-icesight-road-surface-sensor/.
Horowitz, A.J., 1991, A primer on sediment-trace element chemistry (2d ed.): U.S. Geological Survey Open-File Report 91–76, 136 p. [Also available at https://doi.org/10.3133/ofr9176.]
Horowitz, A.J., and Elrick, K.A., 1987, The relation of stream sediment surface area, grain size, and composition to trace element chemistry: Applied Geochemistry, v. 2, no. 4, p. 437–451. [Also available at https://doi.org/10.1016/0883-2927(87)90027-8.]
Huber, G., 2000, Construction and maintenance practices for permeable friction courses: Washington, D.C., National Academies of Sciences, Engineering, and Medicine, 85 p., accessed January 13, 2023, at https://doi.org/10.17226/14310.
Isenring, T., Köster, H., and Scazziga, I., 1990, Experiences with porous asphalt in Switzerland: Transportation Research Record: Journal of the Transportation Research Board, v. 1265, p. 41–53, accessed June 23, 2022, at https://onlinepubs.trb.org/Onlinepubs/trr/1990/1265/1265-005.pdf.
Kandhal, P.S., 2002, Design, construction, and maintenance of open-graded asphalt friction courses: Lanham, Md., National Asphalt Pavement Association Information Series 115, accessed February 10, 2023, at https://docshare.tips/is-115opengradedasphaltfrictioncoursespdf_588f1b92b6d87fed8c8b4ce1.html.
Kaplan, E.L., and Meier, P., 1958, Nonparametric estimation from incomplete observations: Journal of the American Statistical Association, v. 53, no. 282, p. 457–481, accessed March 1, 2021, at https://doi.org/10.1080/01621459.1958.10501452.
Kayhanian, M., Li, H., Harvey, J.T., and Liang, X., 2019, Application of permeable pavements in highways for stormwater runoff management and pollution prevention—California research experiences: International Journal of Transportation Science and Technology, v. 8, no. 4, p. 358–372, accessed March 3, 2023, at https://doi.org/10.1016/j.ijtst.2019.01.001.
Kayhanian, M., Singh, A., Suverkropp, C., and Borroum, S., 2003, Impact of annual average daily traffic on highway runoff pollutant concentrations: Journal of Environmental Engineering, v. 129, no. 11, p. 975–990. [Also available at https://doi.org/10.1061/(ASCE)0733-9372(2003)129:11(975).]
Kennedy, E.J., 1984, Discharge ratings at gaging stations: U.S. Geological Survey Techniques of Water-Resources Investigation Report, book 3, chap. A10, 59 p. [Also available at https://doi.org/10.3133/twri03A10.]
Mallick, R.B., Kandhal, P.S., Colley, A.L., Jr., and Watson, D.E., 2000, Design, construction, and performance of new-generation open-graded friction courses: National Center for Asphalt Technology Report 00–01, 28 p., accessed March 31, 2015, at https://ntl.bts.gov/lib/8000/8800/8813/rep00-01.pdf.
Massachusetts Bureau of Geographic Information [MassGIS], 2020, MassGIS Data—2019 Aerial Imagery: MassGIS web page, accessed December 10, 2022, at https://www.mass.gov/info-details/massgis-data-2019-aerial-imagery.
Massachusetts Department of Transportation [MassDOT], 2021, Inlet—Massachusetts geoDOT Open Data Portal: Massachusetts Department of Transportation web page, accessed December 10, 2022, at https://geo-massdot.opendata.arcgis.com/datasets/MassDOT:inlet/about.
Massachusetts Department of Transportation [MassDOT], 2023, Transportation data management system—Traffic volume counts: Massachusetts Department of Transportation database, accessed January 10, 2023, at https://mhd.public.ms2soft.com/tcds/tsearch.asp?loc=Mhd&mod=.
Millard, S.P., and Kowarik, A., 2022, EnvStats—Package for environmental statistics, including US EPA guidance (ver. 2.7.0): The Comprehensive R Archive Network web page, accessed February 14, 2023, at https://cran.r-project.org/package=EnvStats.
Miller, R.L., Bradford, W.L., and Peters, N.E., 1988, Specific conductance—Theoretical considerations and application to analytical quality control: U.S. Geological Survey Water-Supply Paper 2311, 16 p. [Also available at https://doi.org/10.3133/wsp2311.]
Moores, J.P., Pattinson, P.E., and Hyde, C.R., 2013, Variations in highway stormwater runoff quality and stormwater treatment performance in relation to the age of porous friction courses: Water Environment Research, v. 85, no. 9, p. 772–781, accessed November 21, 2018, at https://doi.org/10.2175/106143012X13461650921176.
National Academies of Sciences, Engineering, and Medicine [NASEM], 2009, Annotated literature review for NCHRP [National Cooperative Highway Research Program] Report 640: Washington, D.C., The National Academies Press, 297 p., accessed June 23, 2022, at https://doi.org/10.17226/23001.
National Oceanic and Atmospheric Administration, 2023, Station identifier COOP—198757, Walpole 2, Mass., in Welcome to SC ACIS version 2: Applied Climate Information System (ACIS) database, accessed February 16, 2023, at https://scacis.rcc-acis.org/.
Patton, C.J., and Kryskalla, J.R., 2003, Methods of analysis by the U.S. Geological Survey National Water Quality Laboratory—Evaluation of alkaline persulfate digestion as an alternative to Kjeldahl digestion for determination of total and dissolved nitrogen and phosphorus in water: U.S. Geological Survey Water-Resources Investigations Report 03–4174, 33 p., accessed March 23, 2023, at https://doi.org/10.3133/wri034174.
Pitt, R.E., 1979, Demonstration of nonpoint pollution abatement through improved street cleaning practices: U.S. Environmental Protection Agency report EPA/600/2–79/161, 269 p. [Also available at https://cfpub.epa.gov/si/si_public_record_Report.cfm?Lab=ORD&dirEntryID=44437.]
Putman, B.J., 2012, Evaluation of open-graded friction courses—Construction, maintenance, and performance: Federal Highway Administration Report FHWA–SC–12–04, 119 p., accessed June 23, 2022, at https://scdot.scltap.org/wp-content/uploads/2022/11/SPR-725-Final-Report-11-22-2021.pdf.
R Core Team, 2018, R—A language and environment for statistical computing (ver. 3.6.1, Action of the Toes): R Foundation for Statistical Computing software release, accessed July 19, 2020, at https://www.r-project.org/ and https://cran.r-project.org/src/base/R-3/.
Rantz, S.E., and others, 1982, Measurement and computation of streamflow—Volume 1, measurement of stage and discharge: U.S. Geological Survey Water-Supply Paper 2175, 284 p. [Also available at https://doi.org/10.3133/wsp2175.]
Root, R.E., 2009, Investigation of the use of open-graded friction courses in Wisconsin: Wisconsin Highway Research Program Report 09–01, 27 p., accessed September 1, 2022, at http://digital.library.wisc.edu/1793/53403.
Roseen, R.M., Ballestero, T.P., Houle, J.J., Briggs, J.F., and Houle, K.M., 2012, Water quality and hydrologic performance of a porous asphalt pavement as a storm-water treatment strategy in a cold climate: Journal of Environmental Engineering, v. 138, no. 1, p. 81–89, accessed March 2, 2023, at https://doi.org/10.1061/(ASCE)EE.1943-7870.0000459.
Sampson, L.C., Houston, A.V., Charbeneau, R.J., and Barret, M.E., 2014, Water quality and hydraulic performance of permeable friction course on curbed sections of highways: University of Texas at Austin Center for Transportation Research, Federal Highway Administration Publication Report FHWA/TX–14/0–6635–1, 91 p., accessed November 25, 2014, at https://library.ctr.utexas.edu/ctr-publications/0-6635-1.pdf.
Sartor, J.D., and Boyd, G.B., 1972, Water pollution aspects of street surface contaminants: U.S. Environmental Protection Agency report EPA–R2–72–081, 186 p. [Also available at https://nepis.epa.gov/Exe/ZyPDF.cgi/9100TDJJ.PDF?Dockey=9100TDJJ.PDF.]
Selbig, W.R., and Bannerman, R.T., 2007, Evaluation of street sweeping as a stormwater-quality-management tool in three residential basins in Madison, Wisconsin: U.S. Geological Survey Scientific Investigations Report 2007–5156, 103 p., accessed November 1, 2022, at https://doi.org/10.3133/sir20075156.
Selbig, W.R., and Bannerman, R.T., 2011, Characterizing the size distribution of particles in urban stormwater by use of fixed-point sample-collection methods: U.S. Geological Survey Open-File Report 2011–1052, 14 p. [Also available at https://doi.org/10.3133/ofr20111052.]
Shreve, E.A., and Downs, A.C., 2005, Quality-assurance plan for the analysis of fluvial sediment by the U.S. Geological Survey Kentucky Water Science Center Sediment Laboratory: U.S. Geological Survey Open-File Report 2005–1230, 28 p., accessed March 23, 2023, at https://doi.org/10.3133/ofr20051230.
Smith, K.P., 2002, Effectiveness of three best management practices along the Southeast Expressway, Boston, Massachusetts: U.S. Geological Survey Water-Resources Investigations Report 02–4059, 62 p. [Also available at https://doi.org/10.3133/wri024059.]
Smith, K.P., 2005, Hydrologic, water-quality, bed-sediment, soil-chemistry, and statistical summaries of data for the Cambridge, Massachusetts, drinking-water source area, water year 2004: U.S. Geological Survey Open-File Report 2005–1383, 110 p. [Also available at https://doi.org/10.3133/ofr20051383.]
Smith, K.P., 2015, Water-quality trends in the Scituate reservoir drainage area, Rhode Island, 1983–2012: U.S. Geological Survey Scientific Investigations Report 2015–5058, 57 p. [Also available at https://doi.org/10.3133/sir20155058.]
Smith, K.P., and Granato, G.E., 2010, Quality of stormwater runoff discharged from impervious surfaces of Massachusetts highways, 2005–07: U.S. Geological Survey Scientific Investigations Report 2009–5269, 198 p. [Also available at https://doi.org/10.3133/sir20095269.]
Smith, K.P., Sorenson, J.R., and Granato, G.E., 2018, Characterization of stormwater runoff from bridge decks in eastern Massachusetts, 2014–16: U.S. Geological Survey Scientific Investigations Report 2018–5033, 73 p. [Also available at https://doi.org/10.3133/sir20185033.]
Spaetzel, A.B., and Smith, K.P., 2022, Water-quality conditions and constituent loads, water years 2013–19, and water-quality trends, water years 1983–2019, in the Scituate Reservoir drainage area, Rhode Island: U.S. Geological Survey Scientific Investigations Report 2022–5043, 102 p., accessed August 17, 2022, at https://doi.org/10.3133/sir20225043.
Spaetzel, A.B., Smith, K.P., and Woodford, P.A., 2023, Highway-monitoring data from segments of open-graded friction course and dense-graded hot-mix asphalt pavement in eastern Massachusetts, 2018–2021: U.S. Geological Survey data release, https://doi.org/10.5066/P9FASAUV.
Texas Department of Transportation, 2004, Item 342 permeable friction course (PFC): Texas Department of Transportation, 16 p., accessed June 1, 2023, at https://ftp.txdot.gov/pub/txdot-info/cmd/cserve/specs/2004/standard/s342.pdf.
U.S. Environmental Protection Agency, 1996, Method 3050B—Acid digestion of sediments, sludges, and soils (revision 2): U.S. Environmental Protection Agency Method 3050B, 12 p., accessed April 17, 2005, at https://www.epa.gov/sites/production/files/2015-06/documents/epa-3050b.pdf.
U.S. Environmental Protection Agency, 2000, Method 6010B—Inductively coupled plasma-atomic emission spectrometry: U.S. Environmental Protection Agency Method 6010B, 25 p., accessed April 17, 2005, at https://www.epa.gov/sites/production/files/documents/6010b.pdf.
U.S. Geological Survey, 2002, Processing of water samples (ver. 2.0, April 2002): U.S. Geological Survey Techniques of Water-Resources Investigations, book 9, chap. A5, accessed August 20, 2018, at https://pubs.er.usgs.gov/publication/twri09A5.
U.S. Geological Survey, 2019, Specific conductance: U.S. Geological Survey Techniques and Methods, book 9, chap. A6.3, 15 p., accessed March 23, 2023, at https://doi.org/10.3133/tm9A6.3. [Supersedes USGS Techniques of Water-Resources Investigations, book 9, chap. A6.3, version 1.2.]
U.S. Geological Survey, 2022, Sediment laboratory quality assurance project (SLQA): U.S. Geological Survey Quality Systems Branch web page, accessed June 13, 2022, at https://bqs.usgs.gov/slqa/frontpage_study_results.htm.
U.S. Geological Survey, 2023a, Inorganic blind sample project (IBSP): U.S. Geological Survey Quality Systems Branch web page, accessed January 17, 2023, at https://qsb.usgs.gov/ibsp/charts.php.
U.S. Geological Survey, 2023b, USGS water data for the Nation: U.S. Geological Survey National Water Information System database, accessed January 19, 2023, at https://doi.org/10.5066/F7P55KJN.
Van Heystraeten, G., and Moraux, C., 1990, Ten years’ experience of porous asphalt in Belgium: Washington, D.C., Transportation Research Record 1265, National Research Council, p. 34–40, accessed February 2, 2023, at https://onlinepubs.trb.org/Onlinepubs/trr/1990/1265/1265-004.pdf.
Wagner, R.J., Boulger, R.W., Jr., Oblinger, C.J., and Smith, B.A., 2006, Guidelines and standard procedures for continuous water-quality monitors—Station operation, record computation, and data reporting: U.S. Geological Survey Techniques and Methods, book 1, chap. D3, 8 attachments, accessed April 10, 2006, at https://pubs.water.usgs.gov/tm1d3.
Watson, D., Gu, F., and Moore, J., 2018, Evaluation of the benefits of open graded friction course (OGFC) on NDOT Category-3 roadways: Nevada Department of Transportation, 91 p., accessed January 17, 2023, at https://www.dot.nv.gov/Home/ShowDocument?id=14253.
Winston, R.J., Hunt, W.F., Kennedy, S.G., Wright, J.D., and Lauffer, M.S., 2012, Field evaluation of storm-water control measures for highway runoff treatment: Journal of Environmental Engineering, v. 138, no. 1, p. 101–111, accessed March 23, 2015, at https://doi.org/10.1061/(ASCE)EE.1943-7870.0000454.
Zimmerman, C.F., Keefe, C.W., and Bashe, J., 1997, Method 440.0—Determination of carbon and nitrogen in sediments and particulates of estuarine/coastal waters using elemental analysis: U.S. Environmental Protection Agency, EPA/600/R–15/009, 10 p., accessed March 23, 2023, at https://cfpub.epa.gov/si/si_public_record_report.cfm?dirEntryId=309418.
Conversion Factors
U.S. customary units to International System of Units
Temperature in degrees Celsius (°C) may be converted to degrees Fahrenheit (°F) as follows:
°F = (1.8 × °C) + 32.
Temperature in degrees Fahrenheit (°F) may be converted to degrees Celsius (°C) as follows:
°C = (°F – 32) / 1.8.
Supplemental Information
Specific conductance is given in microsiemens per centimeter at 25 degrees Celsius (µS/cm at 25 °C). Soil bulk electrical conductivity is given in decisiemens per meter at 25 degrees Celsius.
Concentrations of chemical constituents in water are given in either milligrams per liter (mg/L) or micrograms per liter (µg/L).
Concentrations of chemical constituents in sediment are given in milligrams per kilogram (mg/kg).
A water year (WY) is the period between October 1 and September 30 and is designated by the year in which it ends.
Abbreviations
Cl
chloride
DOC
dissolved organic carbon
EMC
event-mean concentration
HMA
hot-mix asphalt
MassDOT
Massachusetts Department of Transportation
MOVE.1
Maintenance of Variance Extension Type 1
Na
sodium
NASEM
National Academies of Sciences, Engineering, and Medicine
NWIS
National Water Information System
NWQL
National Water Quality Laboratory
OGFC
open-graded friction course
PC
particulate carbon
PN
particulate nitrogen
PVC
polyvinyl chloride
QC
quality control
QSB
U.S. Geological Survey Quality Systems Branch
RPD
absolute relative percent difference
RSD
relative standard deviation
SS
suspended sediment
TDN
total dissolved nitrogen
TSS
total suspended solids
TP
total phosphorus
USGS
U.S. Geological Survey
For more information, contact
Director, New England Water Science Center
U.S. Geological Survey
10 Bearfoot Road
Northborough, MA 01532
or visit our website at
https://www.usgs.gov/centers/new-england-water-science-center
Disclaimers
Any use of trade, firm, or product names is for descriptive purposes only and does not imply endorsement by the U.S. Government.
Although this information product, for the most part, is in the public domain, it also may contain copyrighted materials as noted in the text. Permission to reproduce copyrighted items must be secured from the copyright owner.
Suggested Citation
Smith, K.P., Spaetzel, A.B., and Woodford, P.A., 2023, Highway-runoff quality from segments of open-graded friction course and dense-graded hot-mix asphalt pavement on Interstate 95, Massachusetts, 2018–21: U.S. Geological Survey Scientific Investigations Report 2023–5127, 59 p., https://doi.org/10.3133/sir20235127
ISSN: 2328-0328 (online)
Study Area
| Publication type | Report |
|---|---|
| Publication Subtype | USGS Numbered Series |
| Title | Highway-runoff quality from segments of open-graded friction course and dense-graded hot-mix asphalt pavement on Interstate 95, Massachusetts, 2018–21 |
| Series title | Scientific Investigations Report |
| Series number | 2023-5127 |
| DOI | 10.3133/sir20235127 |
| Publication Date | December 21, 2023 |
| Year Published | 2023 |
| Language | English |
| Publisher | U.S. Geological Survey |
| Publisher location | Reston, VA |
| Contributing office(s) | New England Water Science Center |
| Description | Report: xi, 59 p.; Data Release |
| Country | United States |
| State | Massachusetts |
| Online Only (Y/N) | Y |
| Additional Online Files (Y/N) | N |