

Ungulate Migrations of the Western United States, Volume 4
Links
- Document: Report (75.9 MB pdf) , HTML , XML
- Plates:
- Plate 1 (Low-Res)— (27.1 MB pdf) Migration Routes of 182 Unique Herds in the Western United States
- Plate 1 (Hi-Res)— (254 MB pdf) Migration Routes of 182 Unique Herds in the Western United States
- Related Works:
- Data Release: USGS data release - Ungulate migrations of the western United States, volume 4
- Download citation as: RIS | Dublin Core
Acknowledgments
Numerous agency biologists, wildlife officers, students, and postdoctoral researchers contributed thousands of hours of planning, collecting, analyzing, and visualizing the data to the herds mapped and described in this report. Map design and production were done by staff and students from the InfoGraphics Laboratory at the University of Oregon, including director Erik Steiner, cartographic production manager Alethea Steingisser, student project manager Peyton Carl, research assistant Joanna Merson, and student cartographers Dylan Blisard and Zhaoxu Sui. Coordination and administration of this work with the U.S. Department of the Interior and Western States were facilitated by Casey Stemler, Zach Bowen, and Jonathan Mawdsley.
In Arizona, numerous individuals contributed to data collection and coordination including, but not limited to the following: Clint Adams, Colin Beach, Sue Boe, Norris Dodd, Jim Heffelfinger, Tim Holt, Keith Knutson, Lee Luedeker, Tom McCall, T. Patrick McCarthy, Mathew Karam, Chad Loberger, Carl Lutch, Robert Nelson III, Lucas Olson, Larry Phoenix, Mike Rice, and Ray Schweinsburg.
In California, the following individuals at the California Department of Fish and Wildlife assisted with data collection, herd descriptions, and information collection: Josh Bush, Julie Garcia, Christine Found-Jackson, Richard Shinn, Richard Callas, Brian Ehler, Ben Gonzalez, Lora Konde, Craig Stevens, Joe Hobbs, Steffen Peterson, Kiana Hargreaves, Sean Ihle, Emily Monfort, Jon Ewanyk, and Melanie Gogol-Prokurat. Additionally, in California, Christopher Wilmers, John Randolph, and Bogdan Cristescu assisted with data collection and herd descriptions.
In Colorado, Brandon Diamond, Anna Markey, Bridget Alspach, Clayton Bondurant, Andrew Taylor, Lucas Martin, and Nick Gallowich with Colorado Parks and Wildlife assisted with data collection.
In Nevada, the following individuals at the Nevada Department of Wildlife assisted with data collection and coordination for Nevada’s wildlife connectivity programs: Tony Wasley, Joe Bennett, Alan Jenne, Jasmine Kleiber, Pat Cummings, and Brad Hardenbrook. The Humboldt-Toiyabe National Forest, Spring Mountains National Recreation Area, Red Rock Canyon National Conservation Area, University of Nevada-Reno, and the Bureau of Land Management Southern Nevada District Office assisted with project logistics.
In New Mexico, the following individuals, landowners, and agencies assisted with data collection or project logistics: Bandelier National Monument, Bureau of Land Management Taos Field Office, Ghost Ranch, Jicarilla Apache Nation, New Mexico, John Sherman, Kyle Tator, New Mexico State Land Office, Pueblo of Jemez, New Mexico, Santa Fe National Forest, Carson National Forest, and Valles Caldera National Preserve.
In Oregon, the following individuals at the Oregon Department of Fish and Wildlife contributed to captures, data collection, and project logistics: Philip Milburn, Scott Torland, John Gutcher, Jon Muir, Tom Collam, Mike Moore, Mary Jo Hedrick, Ryan Torland, Ryan Platte, Steve Cherry, Meldoy Henderson, Gabrielle McNassar, Bre Furfey, Jenny Dalton, Brian Ratliff, Justin Primos, Matt Keenan, Rod Klus, Lee Foster, Autumn Larkins, Chris Bottom, Travis Schultz, Shane Tally, and Pat Mathews.
In the Pueblo of Tesuque, New Mexico, the following individuals, landowners, and agencies assisted with wildlife capture, data collection, or project logistics: Joseph Abeyta, Walter Bigbee, Kai-T L. V. Blue-Sky, Anthony Dorame Jr., Cypriano Herrera, Joseph D. Herrera, Michael Martinez, Everett Moquino, Gailey Morgan III, John Stokely, Roxanne Swazo-Hinds, Thomas Tapia, Travis Vigil, Jeremy Yepa, the Pueblo of Tesuque, New Mexico Governor and Tribal Council, Christopher Atkinson (owner of Sendero Helicopters, LLC), Joaquin Brandi (owner of Gryphon Renaissance Helicopters), Aran Johnson with Southern Ute Indian Tribe of the Southern Ute Reservation, Colorado, Glenn Harper with the Pueblo of Santa Ana, New Mexico Department of Natural Resources, Pueblo of Nambe, New Mexico, Pueblo of San Ildefonso, New Mexico, Santa Fe National Forest, and the Bureau of Land Management Taos Field Office.
In Utah, the Utah Division of Wildlife Resources, Brigham Young University, Utah State University, Mule Deer Foundation, Bureau of Land Management, Sportsmen for Fish and Wildlife, U.S. Department of Agriculture Forest Service, Egen (formerly SpringML), Google, and personnel contributed to data collection, project logistics, herd descriptions, and information collection.
In Washington, the following individuals at the Washington Department of Fish and Wildlife contributed to captures, data collection, project logistics, or report review: Jeff Bernatowicz, Cindy Cole, Devon Comstock, Lance Downing, Johnna Eilers, Cathy Flick, Sara Hansen, Brock Hoenes, Eric Holman, Casey Heemsah, Melissa Hunt, Todd Jacobsen, Emily Jeffreys, Marcus Leuck, Kristin Mansfield, Scott McCorquodale, William Moore, Nicholle Stephens, Elizabeth Torrey, Sue VanLeuven, Erin Wampole, Steven Wetzel, Carly Wickhem, and Paul Whelan. Additionally, in Washington, the following organizations or individuals assisted with captures or project logistics: the U.S. Fish and Wildlife Service, and the many private landowners who allowed us to capture and collect data on their lands.
In Wyoming, the following individuals at the Wyoming Game and Fish Department contributed to data collection, herd descriptions, and information collection: Greg Anderson, Doug Brimeyer, Travis Crane, Teal Cufaude, Phil Damm, Rebecca Fuda, Grant Gerharter, Lynn Jahnke, Daryl Lutz, Nick Roberts, Seth Roseberry, Leslie Schreiber, Cheyenne Stewart, Dustin Shorma, Dan Thiele, Tim Thomas, Mary Wood, and Mark Zornes. Abel Guevara, Destin Harrell, and Tricia Hatle with the Bureau of Land Management assisted with the Carter Mountain pronghorn study. Additionally in Wyoming, Mike Mazur from the U.S. Fish and Wildlife Service and Ben Snyder, Justin Friday, Native Range, Wilma Wagon, and Ervin Brown from the Shoshone & Arapaho Fish & Game Department provided project and logistical support for the Wind River Reservation elk studies.
Funding for the collaring and collection of ungulate migration data for all States with herd maps was provided by the following organizations: Arizona Department of Transportation, Arizona Elk Society, Arizona Game & Fish Department (Habitat Partnership Committee Regions I, II, and III; and the Research, Contracts, and Game Branches), Black Diamond Minerals LLC, The Boone and Crockett Club, Bridger-Teton National Forest, Brigham Young University, British Petroleum North America, Bureau of Indian Affairs, Bureau of Indian Affairs Northern Pueblos Agency, Bureau of Indian Affairs Wind River Agency, Bureau of Land Management Cody Field Office, Bureau of Land Management Worland Field Office, California Deer Association, California Department of Fish and Wildlife, Charles Engelhard Foundation, Colorado Parks and Wildlife Auction and Raffle Program, Colorado Parks and Wildlife Habitat Partnership Program, Colorado Parks and Wildlife Terrestrial Section, Bureau of Land Management Colorado State Office, Cross Charitable Foundation, George B. Storer Foundation, Greater Yellowstone Coalition, Greater Yellowstone Coordinating Committee, Idaho Department of Fish and Game, Institute for Wildlife Studies, Kinross Gold, Knobloch Family Foundation, Lava Lake Institute for Science and Conservation, Linn Energy, Memorial Resource Development LLC, Mule Deer Foundation, The Nature Conservancy, New Mexico Department of Transportation, Nevada Department of Wildlife, Nevada Wildlife Heritage Program, New Mexico Department of Game and Fish, Oregon Department of Fish and Wildlife, Rocky Mountain Elk Foundation, Santa Fe National Forest, Shoshone National Forest, Safari Club International, Samson Resources LLC, Southwestern Regional Forest Service Office, Sportsmen for Fish and Wildlife, Teton County Wyoming, Teton Conservation District, University of Nevada-Reno, U.S. Department of Agriculture Animal and Plant Health Inspection Service, U.S. Fish and Wildlife Service, U.S. Fish and Wildlife Service Tribal Wildlife Grant, U.S. Fish and Wildlife Service Tribal Youth Conservation Corps, U.S. Fish and Wildlife Service Wildlife and Sport Fish Restoration Program, U.S. Department of Agriculture Forest Service, U.S. Geological Survey, Valles Caldera National Preserve, Victoria University of Wellington, Washington Department of Fish and Wildlife, Washington State Legislature, Wyoming Wildlife Heritage Foundation, Wyoming Department of Transportation, Wyoming Landscape Conservation Initiative, Wyoming Game and Fish Department, Wyoming Governor's Big Game License Coalition, Wyoming Wildlife Foundation, and the Veterinary Initiative for Endangered Wildlife.
The U.S. Geological Survey and the Rocky Mountain Elk Foundation provided the primary funding for the analysis and compilation of this report.
Dr. Laura Gigliotti and Benjamin Robb provided thoughtful and constructive comments that greatly improved the report.
Abstract
Broadly distributed across the Western United States, ungulates (hooved mammals) play an important role in ecosystem function by affecting vegetation communities and forming the prey base for large carnivores. Additionally, ungulates provide economic benefits to regional communities through tourism and hunting and hold cultural significance for many Tribal communities. Many ungulates migrate seasonally between distinct summer and winter ranges to take advantage of spatially and temporally variable food sources and avoid threats such as predators and deep snow. Increasingly, these migrations are threatened by the growing human footprint and associated subdivisions, energy development, and increased traffic volume. Efforts to study ungulate populations and conserve their migrations received support in recent years from the U.S. Department of the Interior Secretarial Order No. 3362, which provided Federal support for enhancing habitat quality for ungulates across the Western States. In response to Secretarial Order No. 3362, the U.S. Geological Survey (USGS) established the Corridor Mapping Team, a collaboration among USGS and participating State and Federal wildlife management agencies and numerous Tribal Nations. Together, the Corridor Mapping Team maps ungulate migrations throughout the Western United States in the USGS “Ungulate Migrations of the Western United States” report series. This report (volume 4) details migrations and seasonal ranges from 31 new herds throughout nine Western States. Additionally, this report includes updates to two herds published in previous reports. Including this report, the report series has provided the mapped migrations and seasonal ranges of 182 unique herds and has provided a map-based inventory of the documented ungulate migrations across the Western United States for biologists, managers, policy makers, and conservation practitioners. This report also discusses how the mapping efforts associated with the Corridor Mapping Team can be used to guide management and policy regarding renewable energy development and ungulate disease, specifically chronic wasting disease, in the Western United States.
Introduction
Throughout their broad distribution in the Western United States, ungulates (hooved mammals) play an important role in ecosystem function by affecting vegetation communities (Hobbs, 1996; Frank and Evans, 1997) and forming the prey base for large carnivores. Additionally, ungulates provide economic benefits to regional communities through tourism and hunting (Duffield and Holliman, 1988) and hold cultural significance for many Tribal communities. Throughout the Western United States, many ungulates use seasonal migrations to avoid predators and deep snow, and to take advantage of spatially and temporally variable food sources (Kauffman and others, 2021a). Global positioning system (GPS) collars help identify and describe numerous ungulate migrations throughout the vast and rugged landscapes of the Western United States (Kauffman and others, 2020a, 2022a, c). These detailed movement data have facilitated research on the ecological drivers and benefits that underpin migrations across taxa. Collectively, these efforts helped identify migration as a critical behavior enabling ungulates to persist in the varied landscapes that compose much of the Western United States.
Congruous with the increased understanding of ungulate migration in recent decades, the Western United States has undergone widespread infrastructure development. The expanding human footprint in the Western States increasingly makes the migratory journeys of ungulates more difficult, threatening the long-term persistence of existing migrations (Sawyer and others, 2013). Roads, especially those roads with increasing traffic volumes, create significant barriers to ungulate movement, causing direct mortality and severing migrations (Kauffman and others, 2018; Robb and others, 2022). Additionally, increasing human recreational activities on State and Federal lands throughout the Western States can decrease habitat quality and displace ungulates from high-quality areas, effectively causing habitat loss. Human activities also lead to the expansion of Juniperus spp. (juniper) woodlands into previously Artemisia spp. (sagebrush)-dominated areas, suppressing fire and reducing fuel load, which may affect ungulate movements (Morano and others, 2019). Common on Western landscapes, fences also alter animal movements and cause direct mortality (Jakes and others, 2018). Additional obstacles to ungulate movement include the fragmented mosaic of roads, well pads and other infrastructure associated with oil and gas (Sawyer and others, 2013), wind (Milligan and others, 2021), and solar energy development (Sawyer and others, 2022). Perhaps most significantly, private lands dominate the vast landscapes many migrations require (Gigliotti and others, 2022), and if developed, represent a lasting loss of habitat and landscape connectivity. Although various development forms can reduce corridor functionality (Wyckoff and others, 2018), the development thresholds that populations can tolerate before migratory behavior declines is difficult to study and rarely known (Sawyer and others, 2020). Studies of human development effects on ungulate migrations are further complicated by the likelihood that different species can have species-specific thresholds of human effects they can withstand before migrations are lost (Lambert and others, 2022).
Recognizing the significance of migration in sustaining robust ungulate populations, the U.S. Department of the Interior established Secretarial Order No. 3362 in 2018 to assist State wildlife management agencies with enhancing habitat quality of big game species winter ranges and migration corridors throughout the Western United States (U.S. Department of the Interior, 2018). As part of Secretarial Order No. 3362, the U.S. Geological Survey (USGS) was charged with assisting the Western State wildlife management agencies in mapping migration corridors and winter ranges, which prompted the USGS to establish the Corridor Mapping Team (CMT; Kauffman and others, 2020a). The CMT includes participation from all 11 Western States and from multiple Tribal and Federal agencies and works to design and implement a unified mapping effort for ungulates throughout the Western United States. As part of the effort, the CMT publishes the “Ungulate Migrations of the Western United States” report series, which includes maps and migration details of all included herds and makes the migration maps accessible to a wide range of stakeholders (Kauffman and others 2020a, 2022a, c). The map layers for most of the herds in the report series are also available from Kauffman and others (2020b, 2022b, d). This report, volume 4 in the series, details migrations and seasonal ranges from an additional 33 herds, including updated maps for two herds from Kauffman and others (2020a, 2022a). In aggregate, the report series documents 182 unique herd migrations throughout the Western United States (pl. 1). Odocoileus hemionus (mule deer) and Cervus canadensis (elk) have been the most commonly mapped species because of the abundance of datasets for both species; however, other species, such as Antilocapra americana (pronghorn), Odocoileus virginianus (white-tailed deer), Bison bison (bison), and Alces alces (moose), are included as data are collected, analyzed, and mapped (fig. 1).
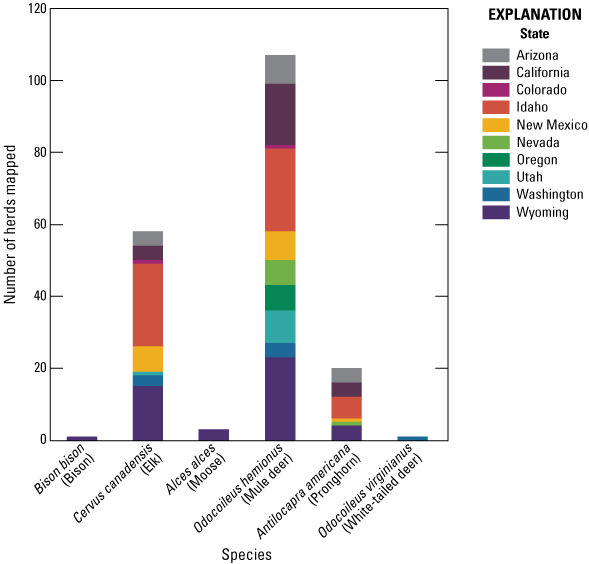
Number of herds mapped by species in this report and Kauffman and others (2020a, 2022a, 2022c). Across the Western United States, 34 of these herds traverse 32 different Tribal lands.
As the CMT continues mapping seasonal ungulate movements, the detailed migration maps are increasingly integrated into regional management, conservation, and policy decisions. Volume 3 in the report series described many of the ways the maps are used throughout the Western United States, such as identifying locations where underpasses or overpasses could ease ungulate movements across busy highways (Kauffman and others, 2022c). In this report, we build on the science published in previous reports and focus on additional areas where migration maps can help inform ungulate management and conservation decisions. More specifically, we discuss animal movement in the context of disease dynamics and detail the increased need to document ungulate migrations because of the expanding renewable energy footprint. In addition, Sidebar 1 broadly describes the varying Federal land ownership patterns for lands used by ungulates throughout the Western United States.
Sidebar 1. Federal Land Use
The CMT continues to build a framework promoting the long-term functionality of migrations by documenting and describing the seasonal movement patterns throughout the Western United States. Numerous State, regional, and national efforts are working to sustain migration corridors, and maps from this report series can be used to inform regional management, conservation, and policy (Kauffman and others, 2020b, 2022b, d). The CMT provides land summaries supporting the migration maps to Tribal and Federal agencies throughout the Western United States. For example, an analysis of 101 migration maps from Kauffman and others (2020a, 2022a) indicated 83 herds cross 45 Bureau of Land Management (BLM) field office lands, 19 herds cross 11 National Park Service park and monument lands, 22 herds cross 26 Tribal lands, 94 herds cross 33 U.S. Department of Agriculture Forest Service (FS) National Forest lands, and 16 herds cross 16 U.S. Fish and Wildlife Service Refuge lands (fig. 2). Through collaboration among State, Tribal, and Federal partners, the CMT is working to provide the science necessary to advance conservation and management of ungulate migrations in the changing Western United States.
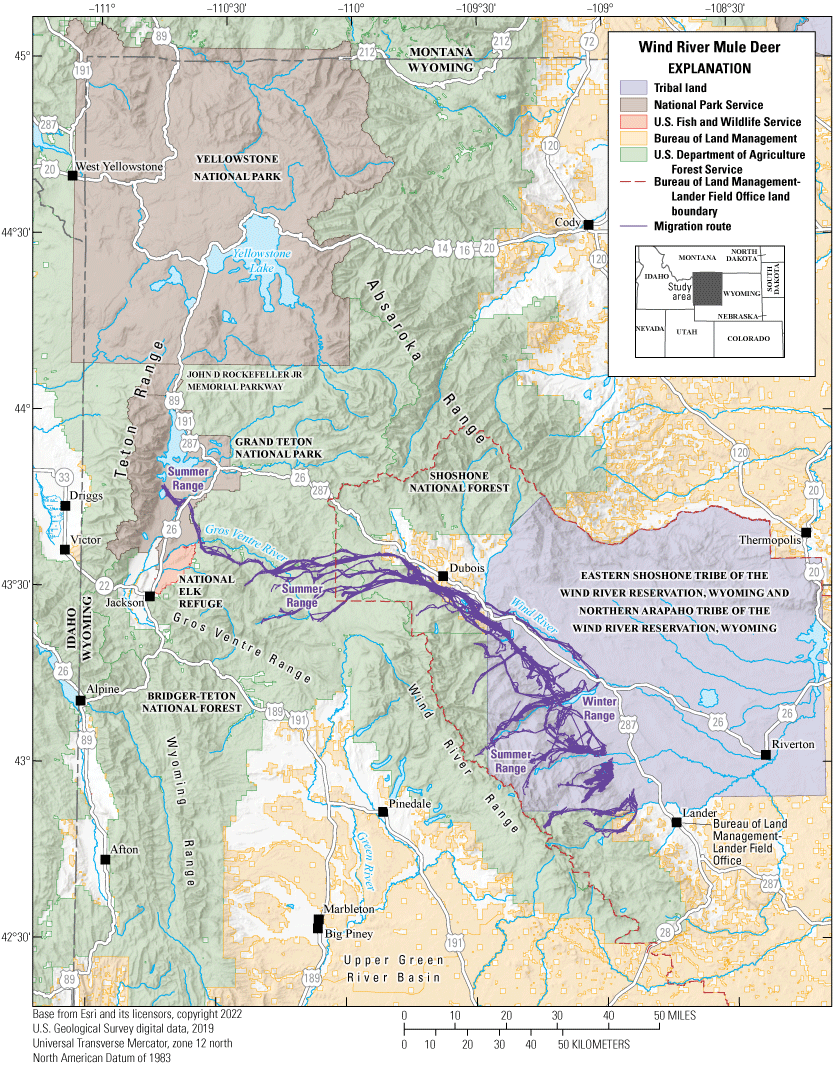
Migration of the Wind River mule deer herd as an example of the numerous Federal lands crossed by a single herd. Mule deer inhabit winter ranges primarily on the Wind River Reservation and then cross through the Bureau of Land Management-Lander Field Office land, Shoshone and Bridger-Teton National Forests, the National Elk Refuge, and Grand Teton National Park when migrating to their summer ranges.
Animal Movement and Disease Dynamics
Disease threatens many big game species throughout the Western United States. Most diseases spread through direct (for example, touching) or indirect (for example, environmental contamination) interactions among individuals. Thus, understanding herd social and movement behaviors is key to managing disease prevalence and spread. For instance, the spatial and temporal dynamics of individual hosts moving through the landscape underlie transmission in humans and wild animals (Dougherty and others, 2018; Merkle and others, 2018). Although the large movements of migratory animals can promote disease spread, recent research indicates these movements may also allow hosts to minimize time in infected areas, reduce disease prevalence when compromised individuals die during migration, and facilitate the evolution of less virulent pathogens (Altizer and others, 2011).
The social structure in and among species likely affects disease dynamics. In general, individuals living in closer proximity with higher direct or indirect contact rates should experience higher rates of disease transmission. However, these dynamics can be complex. Migrants can move individually or in groups and be closely associated or dispersed, or in fusion-fission societies where group membership readily changes (Milner-Gulland and others, 2011). For instance, it was long thought group size was a strong indicator of disease transmission. However, support has been mixed; some studies demonstrate higher disease transfer in large groups (Caillaud and others, 2013) and others show higher disease transfer in small groups (Semple and others, 2002). Social structure probably mediates these dynamics. When groups are fluid, any individual may only interact with a few others, but those individuals then interact with others, resulting in a branching network of contacts (Nunn and others, 2015). However, when groups are stable, each group can act as an isolated reservoir, thereby decreasing transmission among groups and overall transmission throughout the population (Wilson and others, 2003).
Chronic wasting disease (CWD) is a contagious and fatal prion disease infecting deer, elk, and moose and continues to spread throughout North America (Lubeck, 2020). Prions are transferred by direct contact or indirect pathways, causing stumbling, listlessness, dramatic weight loss, and ultimately death, resulting in subsequent population declines (Monello and others, 2014; DeVivo and others, 2017). Strategies to reduce CWD spread include regulations on (1) carcass management, (2) importing and raising captive deer, and (3) feeding or baiting practices. Population management strategies, such as “test and cull,” and increased harvest of specific population segments, may also prevent or reduce CWD spread (Uehlinger and others, 2016). Because prions can persist on the landscape and prevalence can lag after initial transmission, a proactive or rapid response at the population scale is best. Thus, understanding which herds facilitate CWD spread or increase prevalence may help prioritize management efforts. Doing so involves a better understanding of the movements and social structure (such as, group size and density and fusion-fission dynamics) of herds.
Of particular interest, CWD is now present in large parts of the Greater Yellowstone Ecosystem (GYE; Cotterill and others, 2018; Wyoming Game and Fish Department, 2022a; fig. 3A, B), one of the largest, intact temperate ecosystems in the world. The GYE is a highly dynamic system with individuals traveling as much as 150 miles (mi; 241 kilometers [km]) during a single migration (Middleton and others, 2020). The GYE also comprises Federal, Tribal, and private lands and is a useful study system to help understand CWD spread in ungulates. Migratory individuals with CWD potentially could spread the disease along migration corridors and to other herds, although this scenario has never been documented. Nonetheless, CWD spread is probably affected by migration distance, timing, and social attributes such as group size, time spent together, and interactions in and among herds. An understanding of these relations can help wildlife managers in the GYE identify probable routes of transmission and make informed surveillance area decisions.
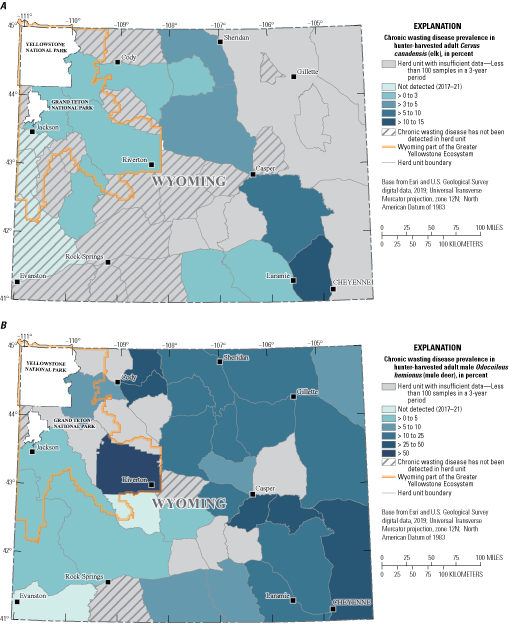
Percentage of chronic wasting disease prevalence in hunter-harvested adult A, Cervus canadensis (elk) and hunter-harvested adult male B, Odocoileus hemionus (mule deer) by herd unit in Wyoming. The prevalence levels and “Not detected” classification are specific to the study period, 2017–21. [>, greater than]
To understand how migratory movements can potentially mediate direct and indirect disease transmission, we analyzed movement data from mule deer in the Wyoming segment of the GYE as an illustrative example. We used a social network analysis framework (Farine and Whitehead, 2015). Hunt areas and national parks were represented by network nodes, and network edges represented connections between those areas based on the movements of GPS-collared mule deer (fig. 4). This analysis indicated four patterns: (1) strong mixing of mule deer in the Upper Green River Basin of Wyoming is apparent; (2) strong one-way movements occurred from the southern part of the Red Desert into the Upper Green River area, which includes the 200-mi (322-km) Red Desert to Hoback migration (Kauffman and others, 2020a); (3) gaps are apparent in the landscape where very few, if any, mule deer move through hunt areas (for example, the northeast to the southwest side of the Wind River Range); and (4) in some summer or winter ranges, such as in the core of the GYE, mule deer captured in different areas overlap, like individuals captured in Cody and Dubois, Wyoming, which overlapped on summer ranges. The findings from this initial effort highlighted the link among animal movement and sociality and the potential for disease spread. Migratory animals often share migration corridors, as shown in Kauffman and others (2020a, 2022a, c), and the results from this study indicated ample mixing of mule deer in hunt areas. An understanding of where individuals from different winter ranges overlap on summer ranges, which herds have overlapping migration corridors, and the direction of these movements can help wildlife managers understand and predict where to expect diseases to spread. As CWD continues to spread throughout the Western United States, understanding how the social structure in and among herds affects disease can play a crucial role in informing regional management decisions.
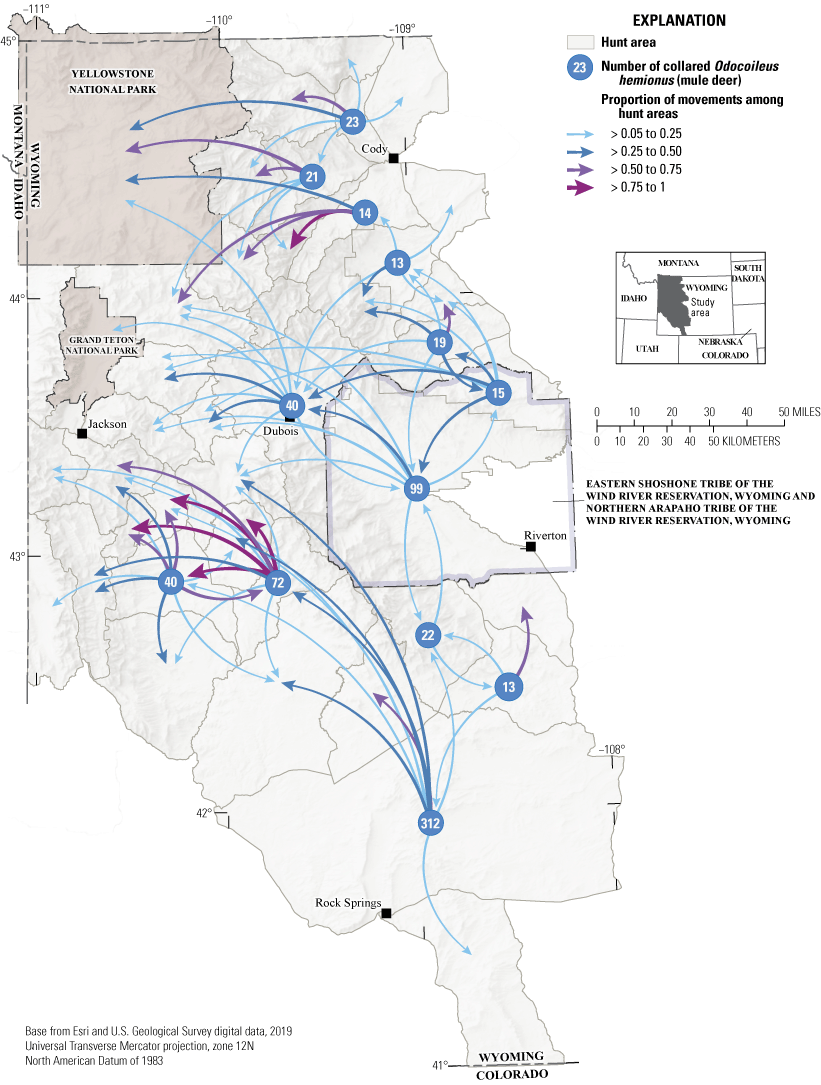
Movements of Odocoileus hemionus (mule deer) in mule deer hunt areas and national parks in northwestern Wyoming. Hunt areas with less than 10 global positioning system (GPS)-collared mule deer, and a proportion of movements from 0.05 of GPS-collared mule deer, are not shown on the figure.
Potential Effects of Renewable Energy Development to Ungulate Populations
Renewable energy has developed rapidly throughout the United States and advances towards carbon neutrality rely heavily on the expansion of wind and utility-scale solar (greater than [>]1 megawatt) development (Larson and others, 2021). The United States added more than 13 gigawatts of wind power in 2021, and much of that occurred in the Western and southwestern States (Wiser and others, 2022). Advances in turbine technology facilitated this expansion, allowing wind development in regions with lower average wind speeds (Wiser and others, 2022). Aligning with the rapid pace of wind energy development, ground-mounted photovoltaic solar energy is expected to grow from 3 to 40 percent of the U.S. energy supply by 2035 (Wiser and others, 2022). Solar energy has the lowest life-cycle greenhouse gas emissions (Hernandez and others, 2015) and most solar development now occurs on private lands; however, the Department of the Interior directed the BLM to update their Solar Programmatic Environmental Impact Statement in 2023 to accelerate solar development on Federal lands (U.S. Department of the Interior, 2022). Support for alternative energies is also common at the State level, and many Governors in the Western United States support increases in renewable energy development. Similar patterns have been observed throughout the Tribal lands of the Western United States, which have had increases in the number of solar projects from private companies and Tribal-owned utilities (J. Fort, Navajo Nation Department of Fish and Wildlife, written commun., 2023).
As the renewable energy footprint expands, so do the potential effects to ungulates, including direct and indirect habitat loss and the creation of new barriers to ungulate movement (Milligan and others, 2023; Sawyer and others, 2020, 2022). To date, research on ungulates and renewable energy development is limited, but recent studies suggest ungulates can access habitat and move through wind facilities. However, migratory behaviors like speed, fidelity, and stopover use can be altered (Milligan and others, 2023), and pronghorn in Wyoming sometimes avoid turbines during the winter (Smith and others, 2020; Milligan and others, 2021). Wind energy projects can encompass thousands of acres, but the amount of direct habitat lost to infrastructure is small (Allison and others, 2019). In contrast, the effects of utility-scale solar projects are evident in the amount of land required. Ungulates cannot access or move through utility-scale solar energy projects because current design recommendations include 6- to 8-foot (ft; 1.8- to 2.4-meter [m]) security fencing impermeable to larger mammals. Thus, when located in an ungulate’s range, solar farms result in a loss of habitat and can create barriers to movement for resident and migratory animals (Sawyer and others, 2022). Additionally, when sited adjacent to highways, solar farms can inadvertently increase the risk of wildlife-vehicle collisions (WVC; Martin, 2019).
Regardless of the energy development type, the mitigation hierarchy, whereby stakeholders seek to avoid, minimize, or mitigate potential effects on wildlife, is the default planning tool for land managers. For ungulates, avoidance and minimization measures are largely shown by spatial data that identify critical habitats, like winter range and migration corridors. Accordingly, the ungulate movement data that have been analyzed and mapped in the “Ungulate Migrations of the Western United States” report series (Kauffman and others, 2020a, 2022a, c) provide a key resource to help site renewable energy projects and design project layouts that minimize effects to critical habitat. Maps of ungulate migrations have been used for years to inform and modify leasing decisions for oil and gas development, including lease buyouts and lease sales removal (Kauffman and others, 2021b). Given the massive land requirements for carbon-neutral pathways (Larson and others, 2021), detailed maps of migrations and other seasonal movements—like those provided by the CMT’s efforts—will increasingly be needed to retain permeable landscapes for ungulates in regions targeted for renewable energy development.
Herd Summaries
The herd-specific maps and associated summary text are the core information of the “Ungulate Migrations of the Western United States” report series. We provide maps documenting the migrations of 33 mule deer, pronghorn, and elk herds in most Western States and select Tribal lands. These maps were produced in close collaboration with participating State or Tribal agencies that provided the GPS-collar data. The respective habitat areas for each herd vary based on local-level policies and may include migration routes (lines) or corridors (polygons), stopovers, winter ranges, or annual ranges. In addition to the herd maps, we provide project and analytical details, summary statistics for the underlying data, and relevant contacts and reports. The general workflow for each herd’s data analysis consisted of the following steps: (1) selecting migration dates for each animal year using the Migration Mapper application (Merkle and others, 2022), (2) using a Brownian bridge movement model to estimate a unique utilization distribution (UD) for each migration sequence (Horne and others, 2007), (3) averaging the UD for a given individual’s migration sequences for all years, and (4) stacking the averaged individual UD for a given herd and defining different levels of migration-route use based on the number of individuals using a given pixel, or defined area of space. In general, we defined “low use” as areas traversed by at least 1 collared individual during migration, “medium use” as areas used by >10 percent of collared individuals in the herd, and “high use” as areas used by >20 percent of collared individuals in the herd. However, some States and Tribes adapted these general methods to adhere to agency-specific methodologies. A complete description of the methods and herd-specific modifications is included in appendix 1. These page pairs provide an overview of the documented ungulate migrations throughout the Western United States and serve as an additional tool to help inform local and regional management and conservation decisions. The data layers for many of the herd maps in this report are also publicly available in the associated USGS data release (Kauffman and others, 2024).
California | Mule Deer
Mendocino Mule Deer
The Mendocino mule deer herd complex comprises three overlapping Odocoileus hemionus columbianus (black-tailed deer) administrative herds, including Mendocino, Clear Lake, and Alder Springs. Mendocino black-tailed deer exhibit variable movement patterns and strategies, including traditional seasonal migrants, multirange migrants, and full-time residents. Migrants move between seasonal ranges from a multitude of lower elevation areas in the northern Coast Range in winter to higher elevation summer ranges (fig. 5). With a larger dataset, local biologists predict finding high use winter ranges throughout foothill slopes and valley bottoms for this herd’s range. Female deer of the Mendocino herd complex exhibit short-term (seasonal and [or] annual) and long-term (multigenerational) fidelity to their summer ranges (Bose and others, 2017). Population density estimates based on fecal pellet deoxyribonucleic acid (DNA) collected in 2011 and 2012 indicated exceptionally high deer densities on productive summer ranges (131.44 deer per square mile [mi2]; 50.75 deer per square kilometer [km2]; Lounsberry and others, 2015). However, the herd was declining considerably during this period (2011–12) because of low adult survival, including of prime-aged females (Marescot and others, 2015); survival rates were lower than typically observed in other herds (Forrester and Wittmer, 2013). Predation from Ursus americanus (black bears) and Canis latrans (coyotes) was the primary cause of low annual survival of fawns (Forrester and Wittmer, 2019), whereas predation from Puma concolor (mountain lion) was the foremost cause of adult female mortality (Marescot and others, 2015), often in areas deemed less familiar to the individual deer (Forrester and others, 2015). Mountain lion kill rates of black-tailed deer in the study area were the highest reported for their range (Cristescu and others, 2022), probably because of high rates of kleptoparasitism from black bears (Elbroch and others, 2015; Allen and others, 2021). More recent research from California Department of Fish and Wildlife focused on collecting DNA from fecal pellets to update population density estimates (California Department of Fish and Wildlife, 2015) and to determine the herd’s response to catastrophic wildfire (California Department of Fish and Wildlife, 2019; California Department of Forestry and Fire Protection, 2021). Habitat use by black-tailed deer (Bose and others, 2018) and their predators (Cristescu and others, 2019) in the area is well understood, and most of the habitats occupied by the Mendocino herd complex are protected and not at risk of development or fragmentation. However, the threat of catastrophic wildfire and climate change-induced landscape scale changes exist.
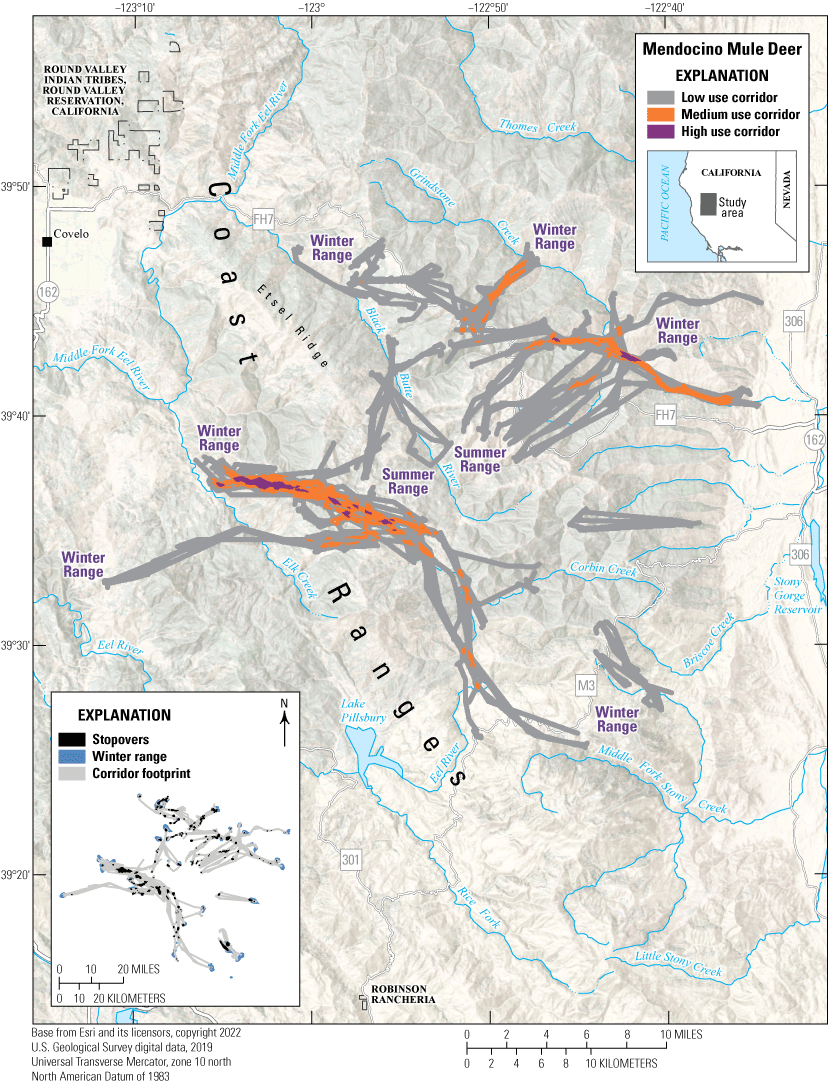
Migration corridors, stopovers, summer ranges, and winter ranges of the Mendocino mule deer herd.
Animal Capture and Data Collection
Sample size: 89 adult female mule deer
Relocation frequency: Approximately 1−13 hours
Project duration: 2004–13 and 2017–21
Data Analysis
Stopover and winter range analysis: Fixed Motion Variance; corridor analysis used the line buffer method where lines from migration sequences were buffered by 656 ft (200 m; Merkle and others, 2023; refer to app. 1 for further description).
Delineation of migration periods: Net Squared Displacement (Bunnefeld and others, 2011)
Models derived from:
Migration use classifications:Corridor and Stopover Summary
Migration start and end dates (median):
Number of days migrating (mean): Migration corridor length: Migration corridor area:Other Information
Project contacts:
-
• Heiko Wittmer (heiko.wittmer@vuw.ac.nz), Professor, Victoria University of Wellington, New Zealand
-
• Josh Bush (joshua.bush@wildlife.ca.gov), Senior Environmental Scientist, California Department of Fish and Wildlife
-
• Wittmer, H.U., Forrester, T.D., Allen, M.L., Marescot, L., and Casady, D.S., 2014, Black-tailed deer population assessment in the Mendocino National Forest, California Final Project Report—December 2014: Sacramento, Calif., California Department of Fish and Wildlife, 56 p. [Also available at https://nrm.dfg.ca.gov/FileHandler.ashx?DocumentID=153193.]
Colorado | Mule Deer
Taylor Park Mule Deer
The Taylor Park mule deer herd (Data Analysis Unit D22) inhabits the central part of southwest Colorado (fig. 6) and overlaps with the East Gunnison Basin elk herd (refer to the “East Gunnison Basin Elk” section in this report). The unit encompasses approximately 1,432 mi2 (3,709 km2) and is bound on the north by the Elk Mountains and Sawatch Range; on the east and south by the Continental Divide; and on the west by the East River, Gunnison River, and Cochetopa Creek. Elevations in the unit range from approximately 7,700 ft (2,347 m) near Gunnison, Colorado, to more than 14,000 ft (4,267 m) along the Continental Divide. The unit comprises a mix of land ownership and approximately 88 percent public lands. Most private lands are at lower elevations in the unit. Historically, the Taylor Park mule deer herd ranged from 5,000 to 10,000 mule deer, and the current estimate is 6,500 individuals.
During the winters of 2013–22, GPS collars were deployed on 71 adult female mule deer, with two main goals: (1) to measure annual survival rates, and (2) to understand long-term changes in distribution and movement patterns. Although most of the herd summers and winters in this unit, data indicated some individuals summer in the neighboring West Elk unit and some individuals winter in the adjacent Powderhorn unit to the west and southwest, respectively. During early and mild winters, mule deer are distributed throughout the winter range, which includes sagebrush and Populus spp. (aspen) woodland communities at midelevations. As winter severity increases, a commensurate proportion of mule deer move to lower elevations and concentrate along U.S. Highway 50 or the steeper south-facing slopes, such as slopes found in the Cochetopa Canyon along State Route 114 in the southwest section of the Taylor Park mule deer range. The severity of winter conditions amplifies the number of WVC along U.S. Highway 50 east of Gunnison either because mule deer migrate to the Cochetopa Canyon (5–10 mi [8–16 km] away) or because U.S. Highway 50 bisects their winter range. Wintering mule deer face harsh winter conditions with deep snow covering available food sources, causing extreme die offs approximately every 10 years. Ensuring mule deer can continue to move to critical winter range and safely cross roads are conservation priorities for this herd. Many of the same corridors and pinch points used by the Taylor Park mule deer herd overlap with the East Gunnison Basin elk herd.
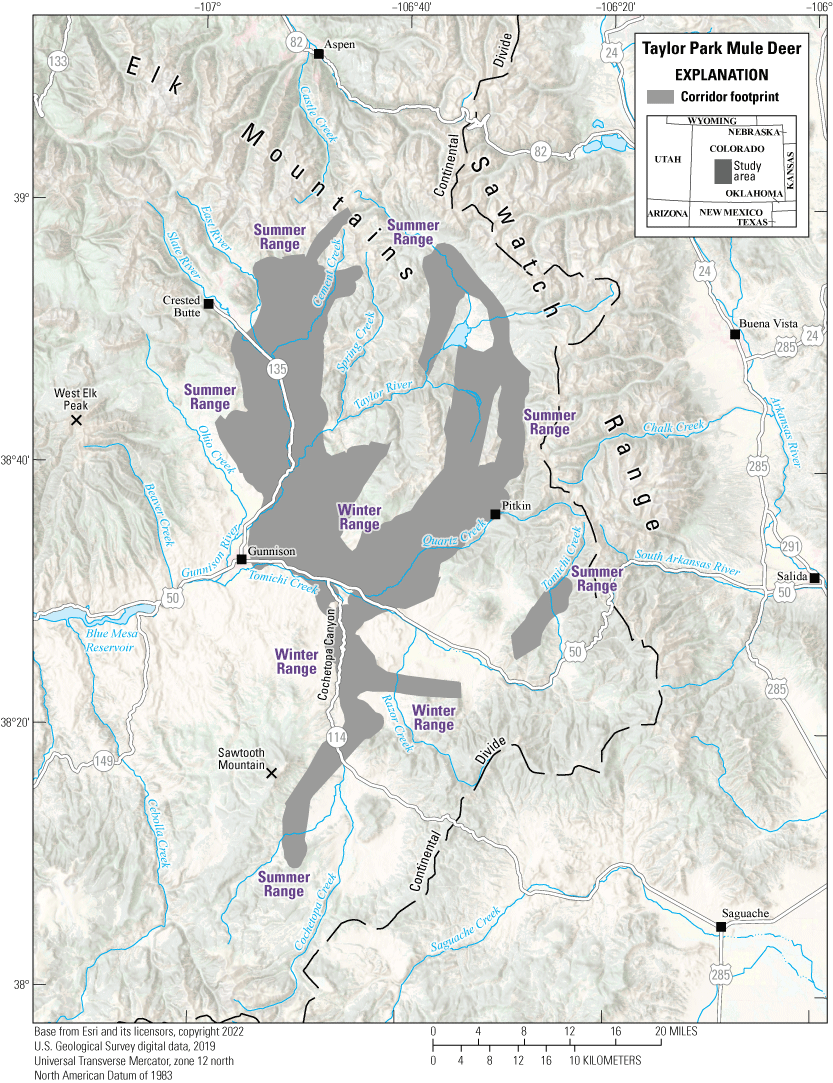
Migration footprint, summer ranges, and winter ranges of the Taylor Park mule deer herd.
Animal Capture and Data Collection
Sample size: 71 adult female mule deer
Relocation frequency: Approximately 12.5–13 hours
Project duration: 2013–present (data through November 2021 analyzed for this report)
Data Analysis
Corridor analysis: Fixed Motion Variance (refer to app. 1 for further description)
Delineation of migration periods: Net Squared Displacement (Bunnefeld and others, 2011)
Models derived from:
Migration use classifications:Corridor Summary
Migration start and end dates (median):
Number of days migrating (mean): Migration corridor length: Migration corridor area:New Mexico | Mule Deer
San Cristobal Mule Deer
The San Cristobal mule deer herd uses a patchwork of winter ranges in the western foothills of the Sangre de Cristo Mountains south of Questa, New Mexico (fig. 7). Winter ranges, bisected by State Route 522, are shared by deer that migrate east and west to summer ranges in the Sangre de Cristo and San Juan Mountains, respectively. The mule deer use multiple migration corridors; most of the herd migrates east into regional national forest and wilderness areas, using shorter, eastern corridors in the Sangre de Cristo Mountains. However, some individuals migrate west from shared winter ranges, moving across U.S. Highway 285, to summer ranges in the San Juan Mountains. Quercus spp. (oak) woodlands, Pinus ponderosa (ponderosa pine), aspen, and mixed-conifer forests characterize the eastern corridors and sagebrush steppe, grasslands, Pinus spp. (pinyon)-juniper mesas, oak woodlands, ponderosa pine, aspen, and mixed-conifer forests characterize the western corridors and stopovers. The eastern corridor is split into two main sections, one heading north and the other heading south. The northern route terminates south of the Red River and west of Columbine Creek. The southern route terminates near Taos Ski Valley northwest of Wheeler Peak, New Mexico’s highest peak (13,167 ft [4,013 m]). Challenges for this herd include potential development on winter ranges and crossing State Route 522 and U.S. Highway 285.
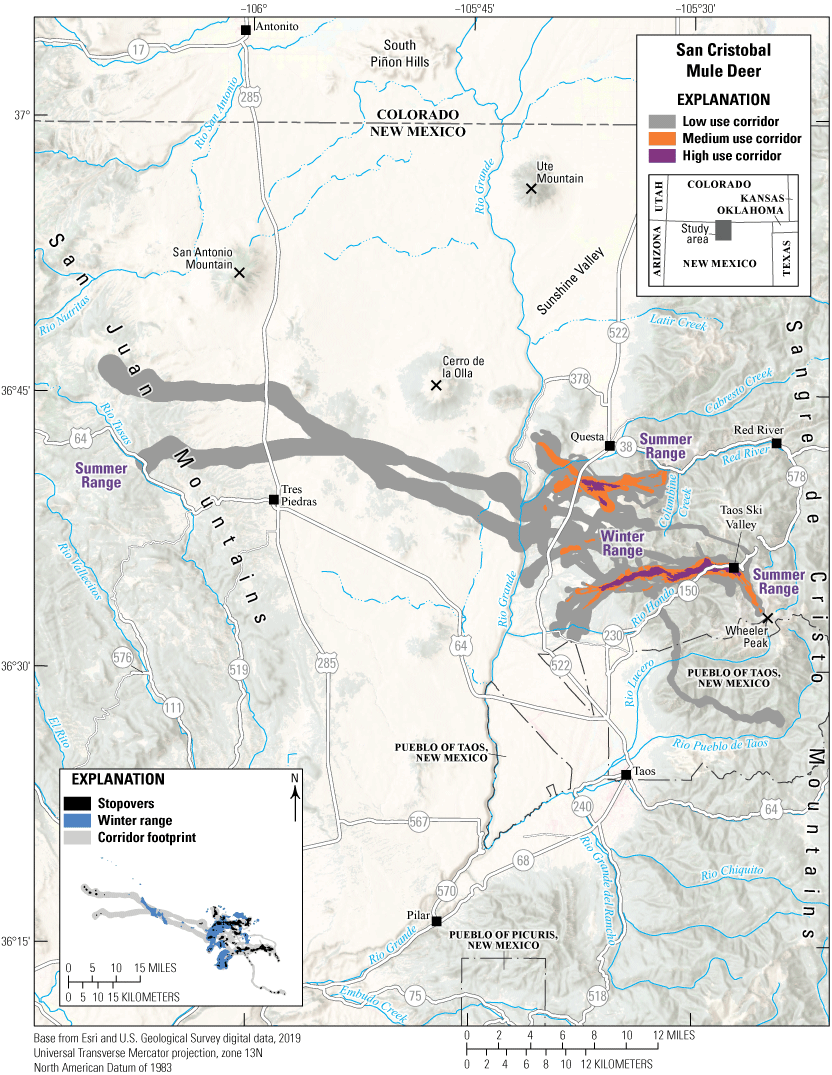
Migration corridors, stopovers, summer ranges, and winter ranges of the San Cristobal mule deer herd.
Animal Capture and Data Collection
Sample size: 26 adult female mule deer
Relocation frequency: Approximately 2 hours
Project duration: 2021–present (data through January 2023 analyzed for this report)
Data Analysis
Corridor, stopover, and winter range analysis: Brownian bridge movement models (Sawyer and others, 2009) and Fixed Motion Variance (refer to app. 1 for further description)
Delineation of migration periods: Net Squared Displacement (Bunnefeld and others, 2011)
Models derived from:
Migration use classifications:Corridor and Stopover Summary
Migration start and end dates (median):
Number of days migrating (mean): Migration corridor length: Migration corridor area:New Mexico | Mule Deer
Tesuque Pueblo Mule Deer
The Tesuque Pueblo mule deer herd is primarily nonmigratory, using the foothills of the Sangre de Cristo Mountains (fig. 8). U.S. Highways 84 and 285 are the major routes from Santa Fe, New Mexico, to areas in northern New Mexico and southern Colorado, bisecting Pueblo of Tesuque, New Mexico, and creating a physical barrier for deer movement. GPS collars were deployed on 6 mule deer (3 females and 3 males) to identify where mitigation efforts, like installing underpasses or fencing, may help mule deer cross busy highways successfully and reduce the number of WVC. The female mule deer primarily used the northeastern part of Pueblo of Tesuque, New Mexico, and the southeastern parts of the Pueblo of Nambe, New Mexico. The male mule deer primarily inhabited the urban private lands adjacent to the eastern boundary of Pueblo of Tesuque, New Mexico. Their annual range (50 percent contour) primarily consists of pinyon-juniper woodlands and pinyon-juniper savannahs. The mule deer are culturally significant to the Pueblo of Tesuque, New Mexico, Tribal members.
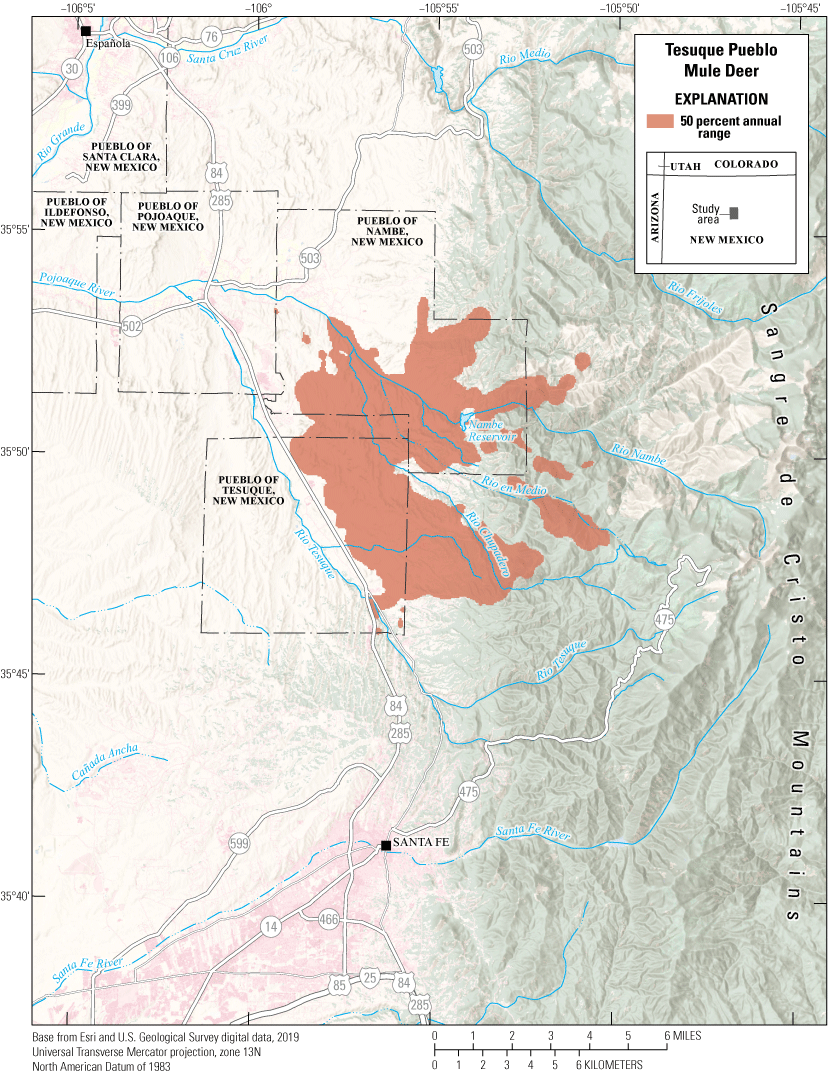
Annual range for the Tesuque Pueblo mule deer herd.
Animal Capture and Data Collection
Sample size: 6 adult mule deer (3 males, 3 females)
Relocation frequency: Approximately 4 hours
Project duration: 2018–21
Data Analysis
Annual range analysis: Brownian bridge movement models (Sawyer and others, 2009)
Models derived from:
New Mexico | Mule Deer
Urraca Mule Deer
The Urraca mule deer herd inhabits an area north of Questa in north-central New Mexico, on the eastern side of Sunshine Valley and the western base of the Sangre de Cristo Mountains (fig. 9). The winter range primarily comprises sagebrush flats east of State Route 522. The mule deer use two primary migration corridors spanning the Urraca Wildlife Management Area and a mosaic of private lands. The southern corridor follows the Urraca Canyon east and terminates at an approximate elevation of 11,000 ft (3,353 m). The northern corridor runs north of Urraca Canyon and ends southwest of the confluence of Costilla Creek and Comanche Creek in New Mexico, at 9,500 ft (2,896 m). Dense conifer and aspen forests interspersed with meadows and creeks characterize the corridors and stopovers. High-elevation summer ranges are northeast of Latir Peak (12,670 ft [3,861 m]).
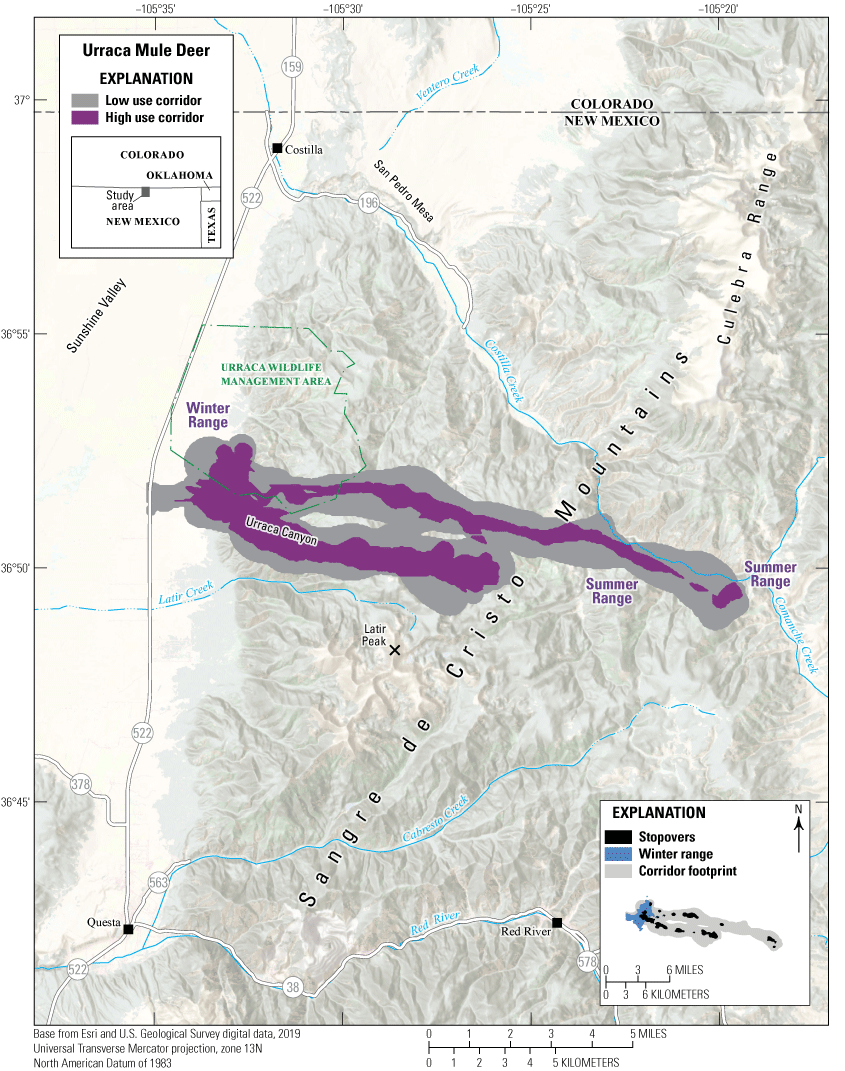
Migration corridors, stopovers, summer ranges, and winter ranges of the Urraca mule deer herd.
Animal Capture and Data Collection
Sample size: 9 adult female mule deer
Relocation frequency: Approximately 2 hours
Project duration: 2021–present (data through January 2023 analyzed for this report)
Data Analysis
Corridor, stopover, and winter range analysis: Brownian bridge movement models (Sawyer and others, 2009)
Delineation of migration periods: Net Squared Displacement (Bunnefeld and others, 2011)
Models derived from:
Migration use classifications:Corridor and Stopover Summary
Migration start and end dates (median):
Number of days migrating (mean): Migration corridor length: Migration corridor area:Nevada | Mule Deer
Area 17-Toiyabe Mule Deer
The Area 17-Toiyabe mule deer herd inhabits the Shoshone Mountains and Toiyabe Range, which run north to south in central Nevada (fig. 10). Mule deer from the Shoshone Mountains and Toiyabe Range are characterized by short distance migrations from high elevations above 7,874 ft (2,400 m), down to 5,577 ft (1,700 m). Since the 1920s, the lower elevation slopes east of Toiyabe Dome, between Wisconsin Creek and Broad Creek and locally known as Toiyabe bench, have been documented by the Nevada Department of Wildlife as crucial mule deer winter range. Because of the value of this habitat for mule deer, the BLM closed the area to domestic livestock grazing in 1983 (Nevada Department of Wildlife, Bureau of Land Management, and Toiyabe National Forest, 1985). In 2018, in collaboration with Nevada Department of Wildlife, the FS treated 2,600 acres (647 ha) of pinyon and juniper—thinning the woody vegetation wherever they encroached shrublands—on the crucial mule deer wintering habitat (Gundlach, 2022). Other pinyon and juniper treatments are ongoing in Indian Valley, which is an area of high importance for year-round mule deer habitat between the Shoshone Mountains and Toiyabe Range. Senescent browse, reduced forbs, drought, and pinyon and juniper encroachment are the greatest conservation challenges the Area 17-Toiyabe mule deer herd face.
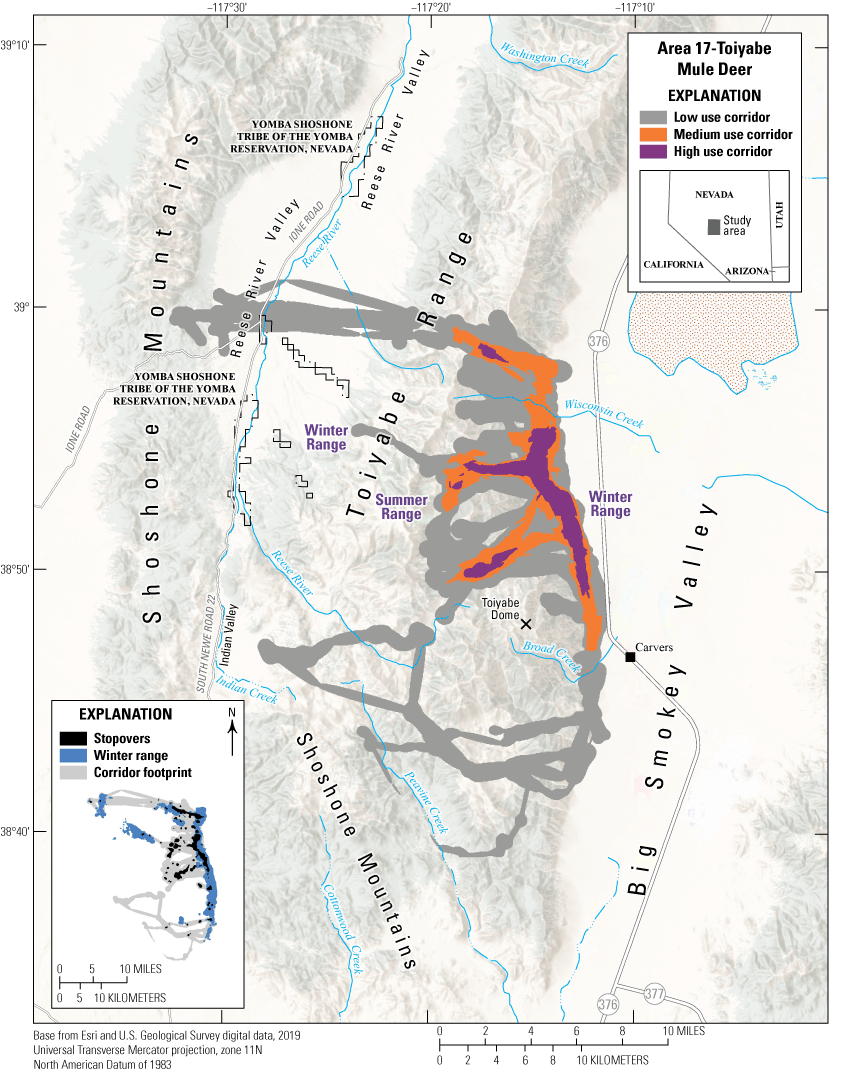
Migration corridors, stopovers, summer ranges, and winter ranges of the Area 17-Toiyabe mule deer herd.
Animal Capture and Data Collection
Sample size: 36 adult female mule deer
Relocation frequency: Approximately 2−5 hours
Project duration: 2018–21
Data Analysis
Corridor, stopover, and winter range analysis: Fixed Motion Variance (refer to app. 1 for further description)
Delineation of migration periods: Net Squared Displacement (Bunnefeld and others, 2011)
Models derived from:
Migration use classifications:Corridor and Stopover Summary
Migration start and end dates (median):
Number of days migrating (mean): Migration corridor length: Migration corridor area:Other Information
Project contacts:
-
• Cody Schroeder (cschroeder@ndow.org), Wildlife Staff Specialist, Nevada Department of Wildlife
-
• Hunter Burkett (hunter.burkett@ndow.org), Game Biologist, Nevada Department of Wildlife
-
• Jennifer McKee, Research Scientist, Wyoming Cooperative Fish and Wildlife Research Unit, Department of Zoology, University of Wyoming
-
• Gundlach, J.J., 2022, Mule deer responses to a pinyon-juniper removal: Reno, Nev., University of Nevada, M.S. thesis, p. 1–66. [Also available at https://scholarworks.unr.edu/bitstream/handle/11714/8283/Gundlach_unr_0139M_13840.pdf.]
Nevada | Mule Deer
Spring Mountains Mule Deer
The Spring Mountains are critical habitat for the Spring Mountains mule deer herd in southern Nevada. The Spring Mountains west of Las Vegas, Nevada, range in elevation from low meadows at 3,000 ft (910 m) to Charleston Peak at nearly 12,000 ft (3,632 m). Lower elevations are dominated by desert scrub and shrubland, and then transition from Yucca brevifolia (Joshua tree) and pinyon-juniper forest at midelevations to mixed montane conifer including ponderosa pine and Pinus longaeva (bristlecone pine) pine at higher elevations, and sparse alpine grasses and forbs above the tree line. The migratory behavior of the Spring Mountains mule deer herd is variable and is a mix of year-round residents and short-distance elevational migrants. Lovell Canyon serves as a well-used corridor between high-elevation summer range near Mount Charleston, Nevada, and low-elevation winter range near Mountain Springs, Nevada (fig. 11). In 2020, a wildlife underpass was completed to facilitate movement across State Route 160 and reduce WVC. Most of the land in the Spring Mountains is managed by the FS and the BLM and serves as a popular, year-round recreational destination. Encroaching development, prolonged drought conditions, wildfires, feral equids, and human recreation affect the persistence of the mule deer herd in the Spring Mountains.
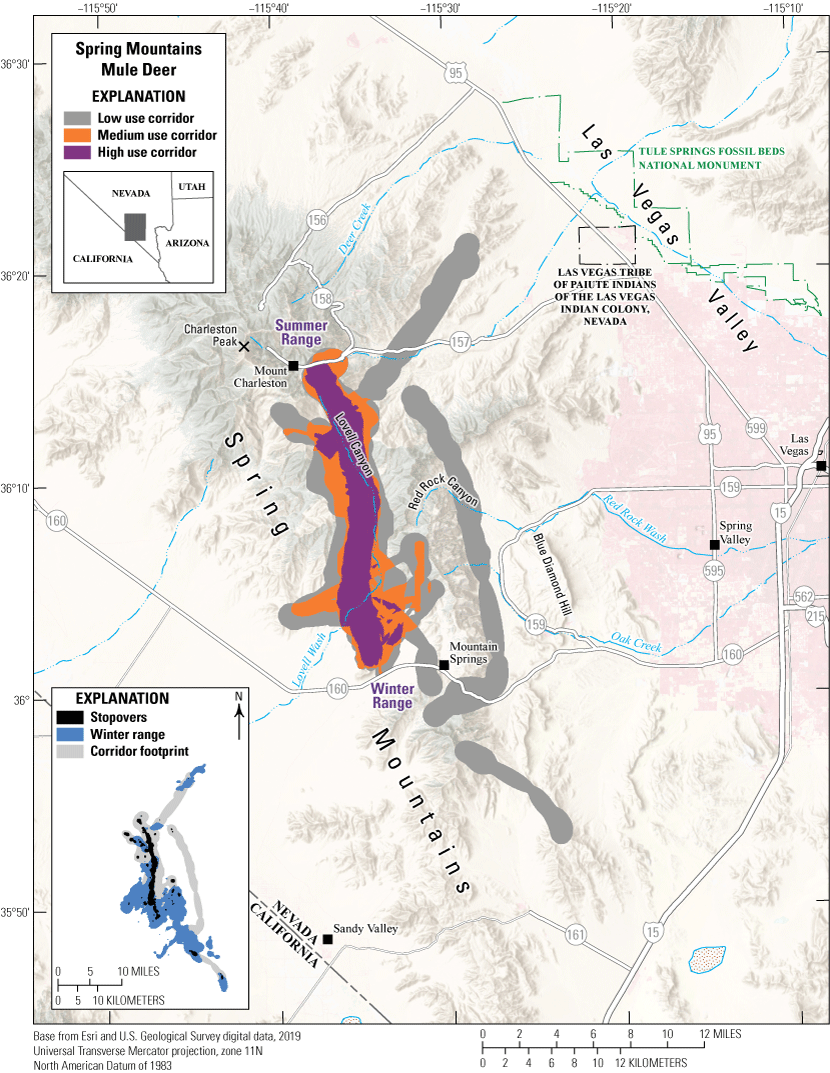
Migration corridors, stopovers, summer range, and winter range of the Spring Mountains mule deer herd.
Animal Capture and Data Collection
Sample size: 35 adult mule deer (11 males, 24 females)
Relocation frequency: Approximately 1−13 hours
Project duration: 2015–21
Data Analysis
Corridor, stopover, and winter range analysis: Fixed Motion Variance (refer to app. 1 for further description)
Delineation of migration periods: Net Squared Displacement (Bunnefeld and others, 2011)
Models derived from:
Migration use classifications:Corridor and Stopover Summary
Migration start and end dates (median):
Number of days migrating (mean): Migration corridor length: Migration corridor area:Other Information
Project contacts:
Data analyst:Oregon | Mule Deer
Beulah-Malheur Mule Deer
With 204 GPS-collared mule deer, the Beulah-Malheur herd is one of the most extensively studied mule deer herds in Oregon. Beulah-Malheur mule deer primarily winter along the Malheur River and the Stinkingwater Mountains, but some mule deer winter as far south as the Owyhee River (fig. 12). Winter ranges contain Artemisia tridentata (big sagebrush), grassland, and encroaching Juniperus occidentalis (western juniper). Although spatially dispersed, much of the Beulah-Malheur mule deer herd collectively migrates northwest to reach summer ranges in the upper elevations of the surrounding national forests to the northwest. Primary summer range vegetation includes A. t. vaseyana (mountain big sagebrush), ponderosa pine, and western juniper with mixed-conifer forests and mountain shrub communities at higher elevations. In 2014, the Buzzard Complex fire burned approximately 398,596 acres (161,306 ha) between Riverside, Oregon, and State Route 78, allowing Taeniatherum caput-medusae (medusahead) and other invasive annual grasses to proliferate in areas originally lacking perennial plant cover. Mule deer cross several major roadways during migration, including U.S. Highway 20, U.S. Highway 26, and U.S. Highway 395, but Interstate 84 is functionally a complete barrier on the eastern edge. The U.S. Highway 20 transects winter ranges for migratory and resident mule deer, and the section between mileposts 135 and 258 along the Malheur River accounted for an average of 179 mule deer-vehicle collisions each year from 2010 to 2022. The Burns Paiute Tribe is working with the Oregon Department of Fish and Wildlife (ODFW) and Oregon Department of Transportation to identify wildlife passage solutions on U.S. Highway 20.

Migration corridors, stopovers, summer ranges, and winter ranges of the Beulah-Malheur mule deer herd.
Animal Capture and Data Collection
Sample size: 204 adult female mule deer
Relocation frequency: Approximately 5−13 hours
Project duration: 2015–present (data through July 2022 analyzed for this report)
Data Analysis
Corridor, stopover, and winter range analysis: Brownian bridge movement models (Sawyer and others, 2009); corridor analysis for the 5-hour duty cycle GPS collars used Brownian Motion Variance with an 8-hour time lag; corridor analysis for the 13-hour duty cycle GPS collars used Fixed Motion Variance with a 48-hour time lag (refer to app. 1 for further description)
Delineation of migration periods: Net Squared Displacement (Bunnefeld and others, 2011)
Models derived from:
Migration use classifications:Corridor and Stopover Summary
Migration start and end dates (median):
Number of days migrating (mean): Migration corridor length: Migration corridor area:Oregon | Mule Deer
Klamath Basin Mule Deer
The Klamath Basin mule deer herd contains an estimated 10,775 mule deer and is a mix of resident and migratory animals. Most winter ranges are adjacent to the California border near Bly, Oregon, and Lost River, California, in areas with western juniper, low shrublands, and early shrub-tree habitat (fig. 13). In spring, these mule deer either migrate northwest to regional national forest lands or northeast past Oregon Route 140. Summer ranges contain ponderosa pine, mixed-conifer forests, and early shrub-tree habitat along with alfalfa and other agricultural crops. Notably, one GPS-collared mule deer migrated southeast into California near Goose Lake in May 2019 and spent a year near Dead Horse Reservoir before returning to Oregon in November 2020. Out of four mule deer GPS collared during a single capture, one migrated from Lake Abert to Lakeview, Oregon, along U.S. Highway 395 in spring. This stretch of U.S. Highway 395 had an average annual daily traffic (AADT) value of 1,002 vehicles in 2018. Several other mule deer also crossed sections of U.S. Highway 97, an even busier road with an AADT value of 5,298 vehicles in 2018. From 2010 to 2022, Oregon Department of Transportation recorded an average of 65.7 mule deer-vehicle collisions per year along a 44.8-mi (72.1-km) section of U.S. Highway 97 north of Klamath Falls, Oregon. Klamath Basin mule deer numbers are slowly declining, in part because of reduced summer forage quality (Peek and others, 2002). Forest fire suppression beginning in the 1920s increased canopy closure in the summer range, reducing preferred understory vegetation such as Purshia tridentata (antelope bitterbrush) and Ceanothus velutinus (snowbrush ceanothus). Without sufficient high-quality forage during drought years, mule deer become more reliant on agricultural fields near Klamath Falls as a dependable water source. Canopy closure also contributed to the severity of the 2021 Bootleg fire, the third largest recorded fire in Oregon, which burned 413,765 acres (167,445 ha) north of the Sprague River.
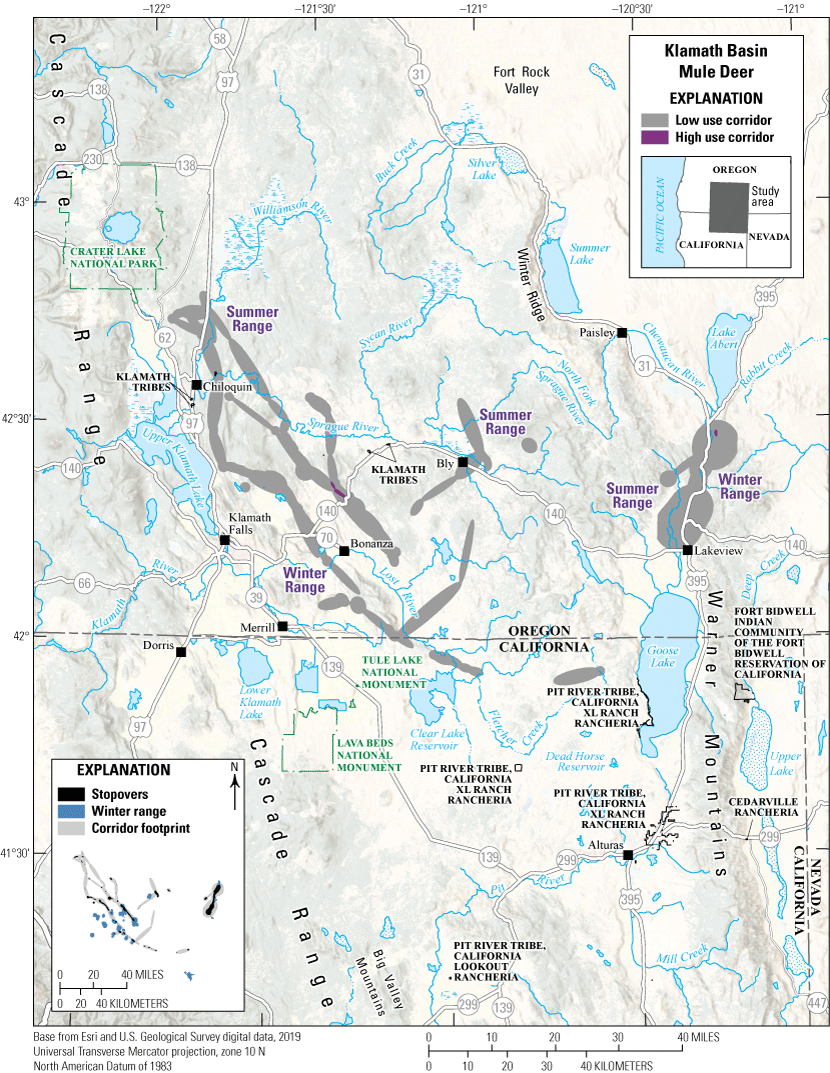
Migration corridors, stopovers, summer ranges, and winter ranges of the Klamath Basin mule deer herd.
Animal Capture and Data Collection
Sample size: 34 adult female mule deer
Relocation frequency: Approximately 5−13 hours
Project duration: 2018–present (data through July 2022 analyzed for this report)
Data Analysis
Corridor, stopover, and winter range analysis: Brownian bridge movement models (Sawyer and others, 2009); corridor analysis for the 5-hour duty cycle GPS collars used Brownian Motion Variance with an 8-hour time lag; corridor analysis for the 13-hour duty cycle GPS collars used Fixed Motion Variance with a 48-hour time lag (refer to app. 1 for further description)
Delineation of migration periods: Net Squared Displacement (Bunnefeld and others, 2011)
Models derived from:
Migration use classifications:Corridor and Stopover Summary
Migration start and end dates (median):
Number of days migrating (mean): Migration corridor length: Migration corridor area:Oregon | Mule Deer
Murderer’s Creek Mule Deer
The Murderer’s Creek mule deer herd winters south of U.S. Highway 26 in river valleys near Murderer’s Creek and the South Fork John Day River (fig. 14). The herd’s winter ranges at lower elevations are characterized by western juniper, big sagebrush, Columbia Basin grassland communities, and invasive medusahead and other nonnative grasses. In the spring, mule deer mainly migrate southeast to summer ranges distributed throughout Gilbert Ridge and the Aldrich Mountains, and some deer migrate as far south as Devine Ridge and east to Ironside Mountain. Summer ranges in these areas contain mixed-conifer forests, ponderosa pine, and low sagebrush communities. A smaller portion of this herd migrates northeast in the spring, crossing U.S. Highway 26 to summer near Long Creek, the Blue Mountains, and Elkhorn Ridge; these areas contain big sagebrush, Populus tremuloides (quaking aspen), ponderosa pine, and mixed-conifer forests.
Threats that may affect the Murderer’s Creek mule deer herd include feral horses, habitat degradation, and wildfires. In areas of low-quality browse, Murderer’s Creek mule deer that migrate or reside south of U.S. Highway 26 can compete with feral horses, particularly during drought years. The Murderer’s Creek Herd Management Area (HMA) currently contains 329 feral horses (BLM, 2023), significantly more than the maximum appropriate management level of 140 horses (FS, 2009). In 2010, the Murderer’s Creek Wildlife Management Unit (WMU), which overlaps the Murderer’s Creek HMA, was included in the “Oregon Mule Deer Initiative” to improve conditions for mule deer, primarily through habitat restoration (ODFW, 2011). Since 2010, ODFW, FS, and the Natural Resources Conservation Service have treated 17,295 acres (6,999 ha) for western juniper removal and reseeded 10,016 acres (4,053 ha) for native shrubs and grasses, in addition to temporarily closing 128 mi2 (332 km2) of road in the Flagtail Travel Management Area during mule deer hunting season (ODFW, 2015, 2020). In 2015, the Canyon Creek Complex fire burned 110,261 acres (44,621 ha) of the Aldrich Mountains, reducing canopy closure and further improving habitat in summer ranges. The Murderer’s Creek mule deer herd is now stable, and in 2021, had an estimated 5,568 mule deer (ODFW, 2021).
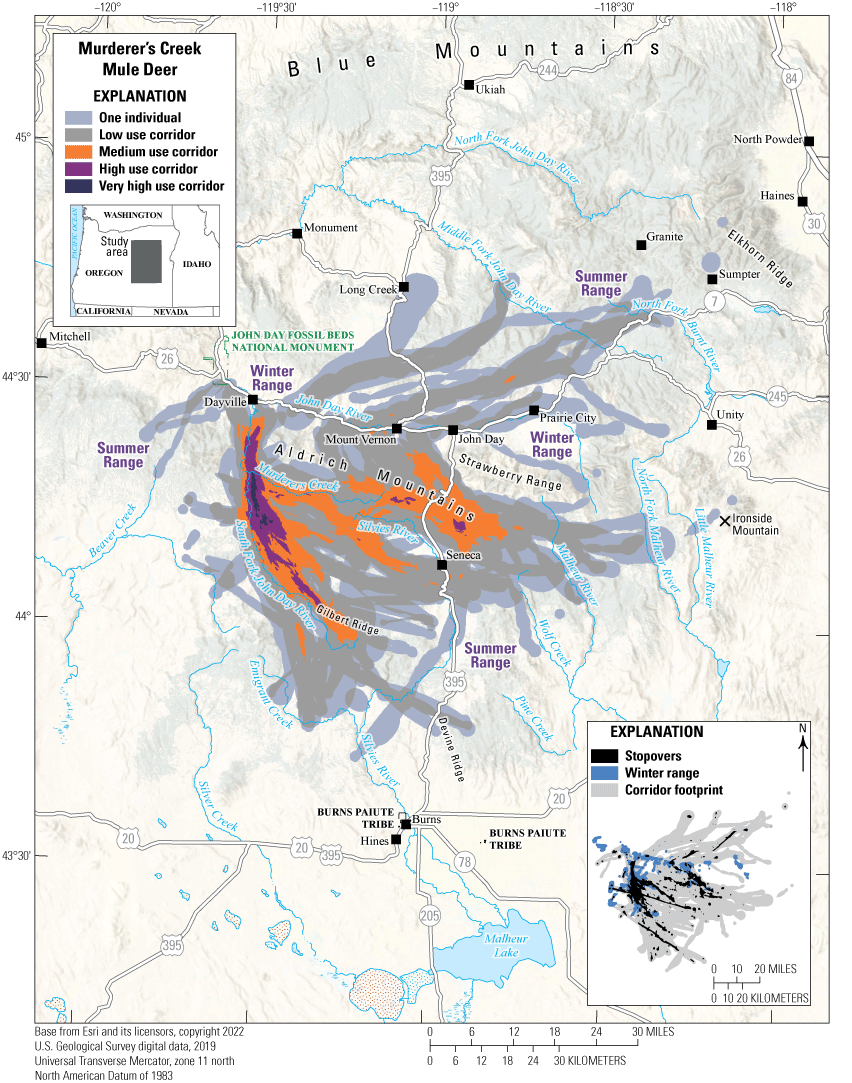
Migration corridors, stopovers, summer ranges, and winter ranges of the Murderer’s Creek mule deer herd.
Animal Capture and Data Collection
Sample size: 152 adult female mule deer
Relocation frequency: Approximately 5−13 hours
Project duration: 2015–present (data through July 2022 analyzed for this report)
Data Analysis
Corridor, stopover, and winter range analysis: Brownian bridge movement models (Sawyer and others, 2009); corridor analysis for the 5-hour duty cycle GPS collars used Brownian Motion Variance with an 8-hour time lag; corridor analysis for the 13-hour duty cycle GPS collars used Fixed Motion Variance with a 48-hour time lag (refer to app. 1 for further description)
Delineation of migration periods: Net Squared Displacement (Bunnefeld and others, 2011)
Models derived from:
Migration use classifications:Corridor and Stopover Summary
Migration start and end dates (median):
Number of days migrating (mean): Migration corridor length: Migration corridor area:Oregon | Mule Deer
Northside Mule Deer
The winter ranges of the Northside mule deer herd can be broadly separated into northern and southern subgroups. Most of the southern subgroup winters at low elevations near the John Day River in areas dominated by big sagebrush, western juniper, and Columbia Basin grassland communities. The northern subgroup is more spatially dispersed and winters by Cottonwood Creek, the North Fork John Day River, and the Middle Fork John Day River in ranges containing more conifer forest (fig. 15). Both subgroups summer in the same general area, migrating either northeast or southeast to reach areas containing mixed-conifer, Picea spp. (spruce), ponderosa pine, and western juniper forests that have scattered Columbia Basin grassland communities on the Blue Mountains and Elkhorn Ridge. Some mule deer west of the North Fork John Day River migrate north to reach summer ranges near Rock Creek. Five mule deer migrated south, crossing the section of U.S. Highway 26 dividing the Northside and Murderer’s Creek mule deer herds. Because U.S. Highway 26 also separates resident mule deer from agricultural fields with reliable water sources, mule deer-vehicle collisions are common year round, and this section experienced an average of 106 mule deer-vehicle collisions per year from 2016 to 2022. In 2010, the Heppner WMU, which is used for livestock grazing and contains multiple mule deer winter ranges, was included in the “Oregon Mule Deer Initiative” (ODFW, 2015, 2020). Since 2010, ODFW, FS, and the Natural Resources Conservation Service have removed 10,256.7 acres (4,150.7 ha) of invasive flora, reseeded 7,405.3 acres (2,996.8 ha) with native shrubs and grassland, and completed 48 water development projects to improve mule deer habitat.
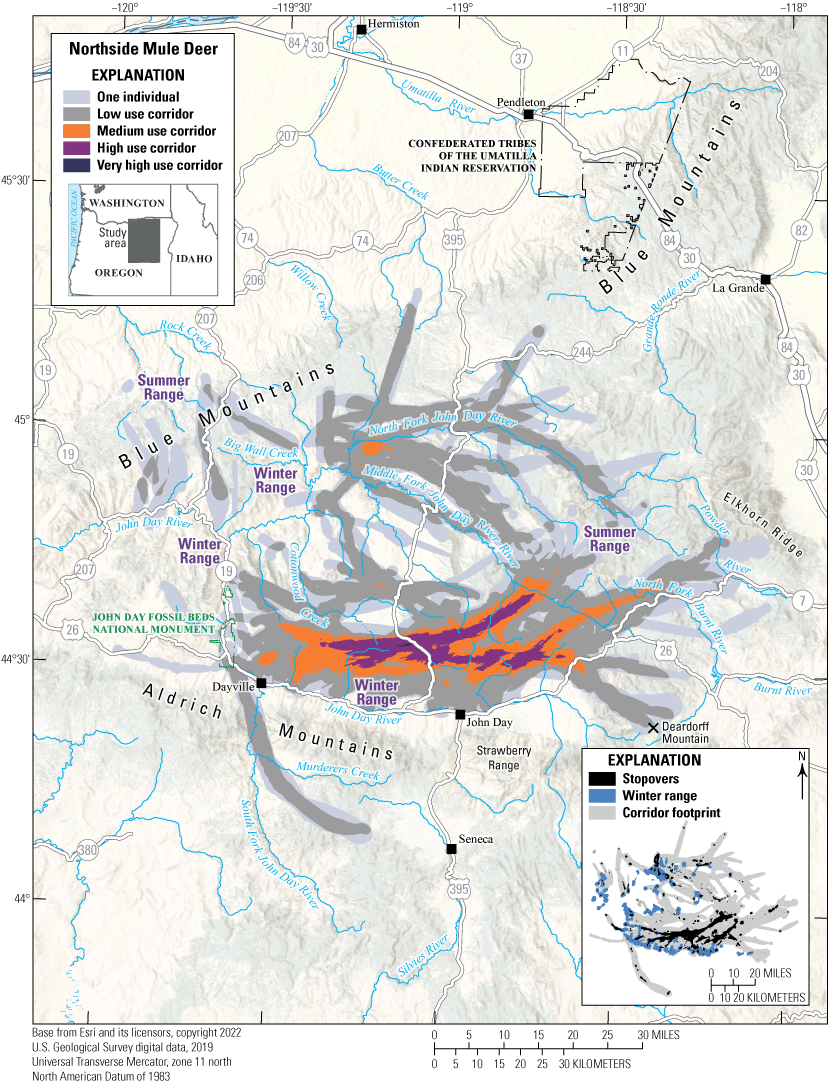
Migration corridors, stopovers, summer ranges, and winter ranges of the Northside mule deer herd.
Animal Capture and Data Collection
Sample size: 203 adult female mule deer
Relocation frequency: Approximately 5−13 hours
Project duration: 2015–present (data through July 2022 analyzed for this report)
Data Analysis
Migration and stopover analysis: Brownian bridge movement models (Sawyer and others, 2009); corridor analysis for the 5-hour duty cycle GPS collars used Brownian Motion Variance with an 8-hour time lag; corridor analysis for the 13-hour duty cycle GPS collars used Fixed Motion Variance with a 48-hour time lag (refer to app. 1 for further description)
Delineation of migration periods: Net Squared Displacement (Bunnefeld and others, 2011)
Models derived from:
Migration use classifications:Migration and Stopover Summary
Migration start and end date (median):
Number of days migrating (mean): Migration length: Migration corridor area:Oregon | Mule Deer
Southeast Mule Deer
Most of the Southeast mule deer herd winters along the Owyhee River in areas containing sagebrush communities and Columbia Basin grassland communities mixed with nonnative annual grasslands. These mule deer either migrate west to summer ranges on Road Canyon and Gravel Ridges or east to the Owyhee Mountains along the Idaho border. One mule deer migrated 38.3 mi (61.6 km) into Idaho, as far as Bald Mountain (fig. 16). Summer ranges contain shrubland, Columbia Basin grassland communities, western juniper, and evergreen forests. In 2014, the Buzzard Complex fires burned 398,596 acres (161,306 ha), including Road Canyon, allowing medusahead and other nonnative grasses to invade areas with originally low perennial plant abundance. Five mule deer wintered separately near U.S. Highway 95, in areas containing higher percentages of western juniper. In the spring, deer migrated southeast into Nevada to summer on the Santa Rosa Range and one mule deer migrated to the Tuscarora Mountains. Of the Southeast mule deer tracked for at least 100 days, 82 percent migrated seasonally. Several mule deer migrated to summer ranges in different States, which complicated population management. The Southeast mule deer herd faces several challenges, including highways and the low abundance of preferred browse. The northeastern section of U.S. Highway 95 had an AADT value of 2,007 vehicles in 2018 and intersects multiple migration corridors; mule deer commonly cross the highway near Succor Creek. In summer, Southeast mule deer spend more time in riparian zones and may compete with livestock and elk in the Owyhee Mountains for high-quality forage during drought years.
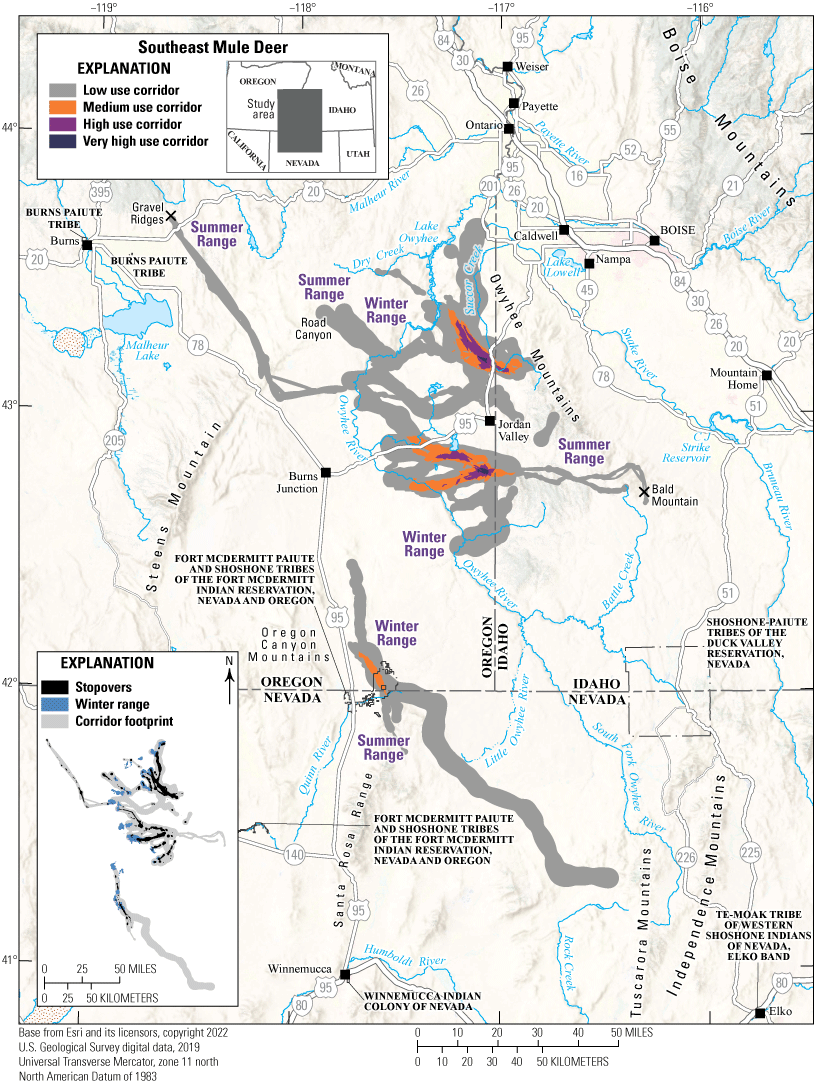
Migration corridors, stopovers, summer ranges, and winter ranges of the Southeast mule deer herd.
Animal Capture and Data Collection
Sample size: 50 adult female mule deer
Relocation frequency: Approximately 5–13 hours
Project duration: 2018–present (data through July 2022 analyzed for this report)
Data Analysis
Corridor, stopover, and winter range analysis: Brownian bridge movement models (Sawyer and others, 2009); corridor analysis for the 5-hour duty cycle GPS collars used Brownian Motion Variance with an 8-hour time lag; corridor analysis for the 13-hour duty cycle GPS collars used Fixed Motion Variance with a 48-hour time lag (refer to app. 1 for further description)
Delineation of migration periods: Net Squared Displacement (Bunnefeld and others, 2011)
Models derived from:
Migration use classifications:Migration and Stopover Summary
Migration start and end dates (median):
Number of days migrating (mean): Migration length: Migration corridor area:Oregon | Mule Deer
South Wallowas Mule Deer
The South Wallowas mule deer herd’s winter ranges are dispersed in areas of low elevation near the Oregon-Idaho border (fig. 17). During spring, mule deer wintering north of Powder River and Pyles Canyon migrate to Catherine Creek and the Wallowa Mountains in the Wallowa-Whitman National Forest. Interstate 84 is an effective barrier to southern movement for the South Wallowas herd. Mule deer wintering in areas near Interstate 84 are largely residents and only two GPS-collared mule deer migrated to Little Lookout Mountain and Thief Valley Reservoir. Other mule deer reside along the Snake River, which forms the Oregon-Idaho border. One mule deer crossed Snake River south of the Powder River headwaters, migrating 24.46 mi (39.36 km) to Weiser River north of Cambridge, Idaho. The herd’s winter range primarily consists of sagebrush communities and Columbia Basin grassland communities, and summer ranges contain big sagebrush, spruce, quaking aspen, and mixed-conifer forests. Mule deer tend to avoid the lowest elevation areas near Lower Powder Valley, Richland, and Durkee, Oregon, and instead prefer to winter at an average elevation of 3,435 ft (1,047 m) and summer at an average elevation of 5,185 ft (1,580 m). The South Wallowas herd traverses the Keating WMU, which was included in the 2015 “Oregon Mule Deer Initiative” (ODFW, 2020). Since 2015, ODFW, FS, BLM, and the Natural Resources Conservation Service have removed 159 acres (64 ha) of western juniper, reseeded 203 acres (82 ha) with native shrubs and grasses, and thinned 265 acres (107 ha) of timber stands. The effects of ODFW habitat improvements were reduced in 2017 when January snow depth exceeded 30 inches (76 centimeters) in mule deer winter ranges and average overwinter fawn survival dropped to 24 percent; however, fawn survival has since returned to 77 percent in 2018–21 (ODFW, 2021).
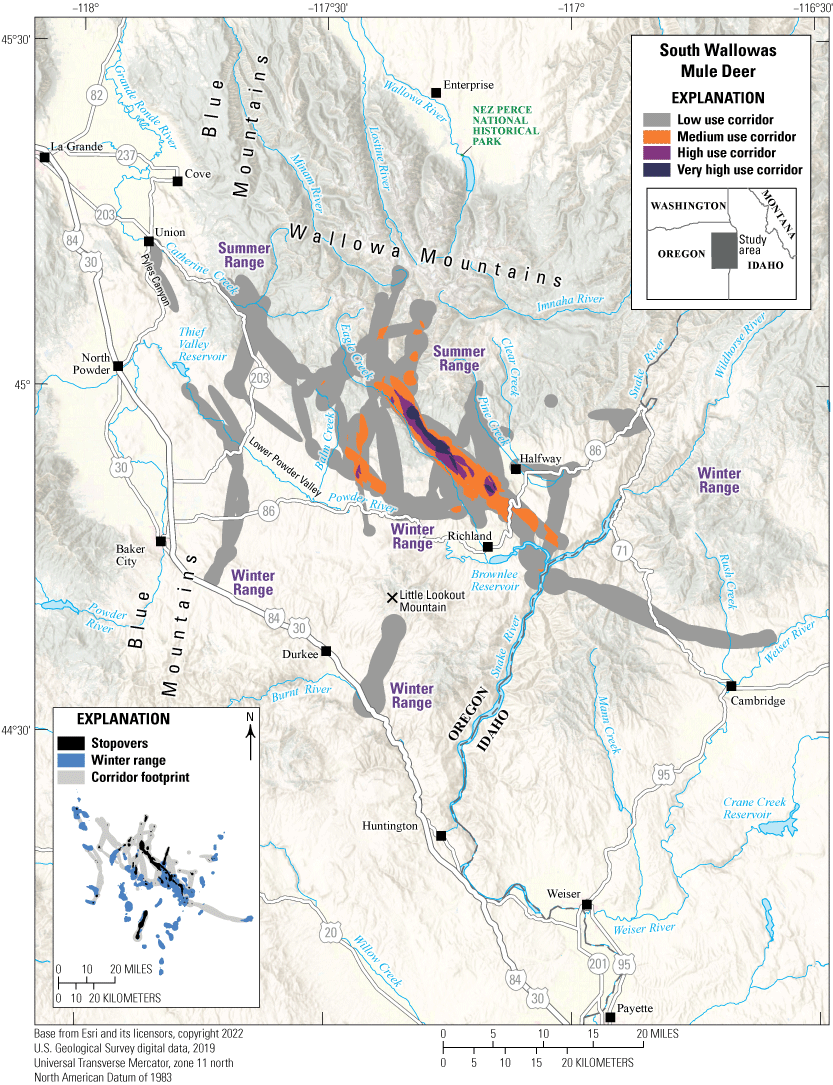
Migration corridors, stopovers, summer ranges, and winter ranges of the South Wallowas mule deer herd.
Animal Capture and Data Collection
Sample size: 73 adult female mule deer
Relocation frequency: Approximately 5−13 hours
Project duration: 2016–20
Data Analysis
Migration and stopover analysis: Brownian bridge movement models (Sawyer and others, 2009); corridor analysis for the 5-hour duty cycle GPS collars used Brownian Motion Variance with an 8-hour time lag; corridor analysis for the 13-hour duty cycle GPS collars used Fixed Motion Variance with a 48-hour time lag (refer to app. 1 for further description)
Delineation of migration periods: Net Squared Displacement (Bunnefeld and others, 2011)
Models derived from:
Migration use classifications:Migration and Stopover Summary
Migration start and end dates (median):
Number of days migrating (mean): Migration length: Migration corridor area:Oregon | Mule Deer
Trout Creek Mule Deer
The Trout Creek mule deer herd comprises residents and migrants making short-range elevational migrations. Trout Creek mule deer mainly winter at lower elevations surrounding Blue Mountain and the slopes of the Oregon Canyon Mountains (fig. 18). In spring, some of these mule deer migrate to higher elevations in the Oregon Canyon Mountains. Other individuals winter in the southwestern part of the herd’s range, inhabiting areas near Kings River Valley, the Pueblo Mountains, and the foothills of the Trout Creek Mountains. These mule deer migrate to summer ranges on the crests of Holloway Mountain and the Trout Creek Mountains. Notably, one GPS-collared mule deer formerly wintering on the Trout Creek Mountains migrated south from a summer range on the Oregon-Nevada border to the Montana Mountains during the second documented winter before returning to Oregon in spring. Habitat on winter ranges consists of A. t. wyomingensis (Wyoming big sagebrush) plant communities and nonnative annual grasslands. Summer ranges consist mainly of native grasslands, mountain big sagebrush plant communities, and mountain shrub communities.
The Trout Creek mule deer herd faces several threats including summer wildfires, highway barriers, and resource competition. In 2012, the Holloway fire burned 462,017 acres (186,972 ha) including most of the Trout Creek and Oregon Canyon Mountains and resulted in the temporary loss of shrub cover at higher elevations and conversion of native forbs and shrubland to invasive annual grasses at lower elevations. Although no migratory mule deer attempt to cross U.S. Highway 95, some resident mule deer have ranges spanning the busy highway, which had an AADT value of 2,095 vehicles in 2018. The Trout Creek mule deer herd also borders the Barren Creek Complex HMA to the north and the Beaty Butte HMA to the east (BLM, 2020, 2022). The Barren Creek Complex HMA contains approximately 2,500 feral horses and the Beaty Butte HMA contains 463 feral horses. Both feral horse populations surpass the maximum appropriate management levels of 892 and 250 horses, respectively, suggesting mule deer and horses compete for resources in the few areas where ranges overlap.
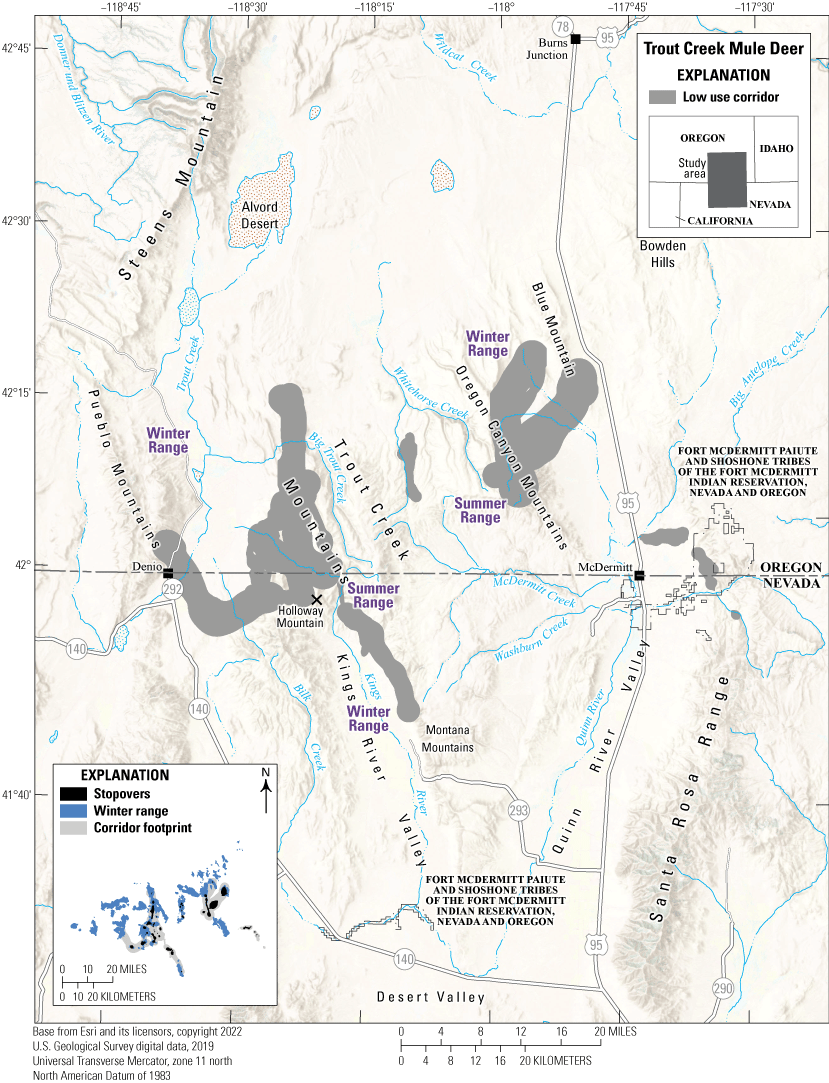
Migration corridors, stopovers, summer ranges, and winter ranges of the Trout Creek mule deer herd.
Animal Capture and Data Collection
Sample size: 34 adult female mule deer
Relocation frequency: Approximately 5 hours
Project duration: 2020–present (data through July 2022 analyzed for this report)
Data Analysis
Migration and stopover analysis: Brownian bridge movement models (Sawyer and others, 2009; refer to app. 1 for further description)
Delineation of migration periods: Net Squared Displacement (Bunnefeld and others, 2011)
Models derived from:
Migration use classifications:Migration and Stopover Summary
Migration start and end dates (median):
Number of days migrating (mean): Migration corridor length: Migration corridor area:Utah | Mule Deer
Boulder Mule Deer
The Boulder mule deer WMU is part of the high plateau complex in southern Utah. The unit encompasses 1.3 million acres (526,091 ha) including BLM, FS, and State lands and small amounts of private lands on the periphery. Approximately 7,000 mule deer inhabit the area. In 2019, 112 GPS collars were deployed on Boulder mule deer to describe migratory corridors and determine the significance of the winter ranges to the herd. GPS-collar data indicated the Boulder mule deer herd is migratory; mule deer use high-elevation habitats on FS lands in the summer and low-elevation habitats on BLM and State lands in the winter (fig. 19). Herd movements appear complex because mule deer sharing the same summer range have the option to migrate to many different winter ranges. A better understanding of the herd’s movements is critical for managing the herd and keeping corridors and winter ranges intact.
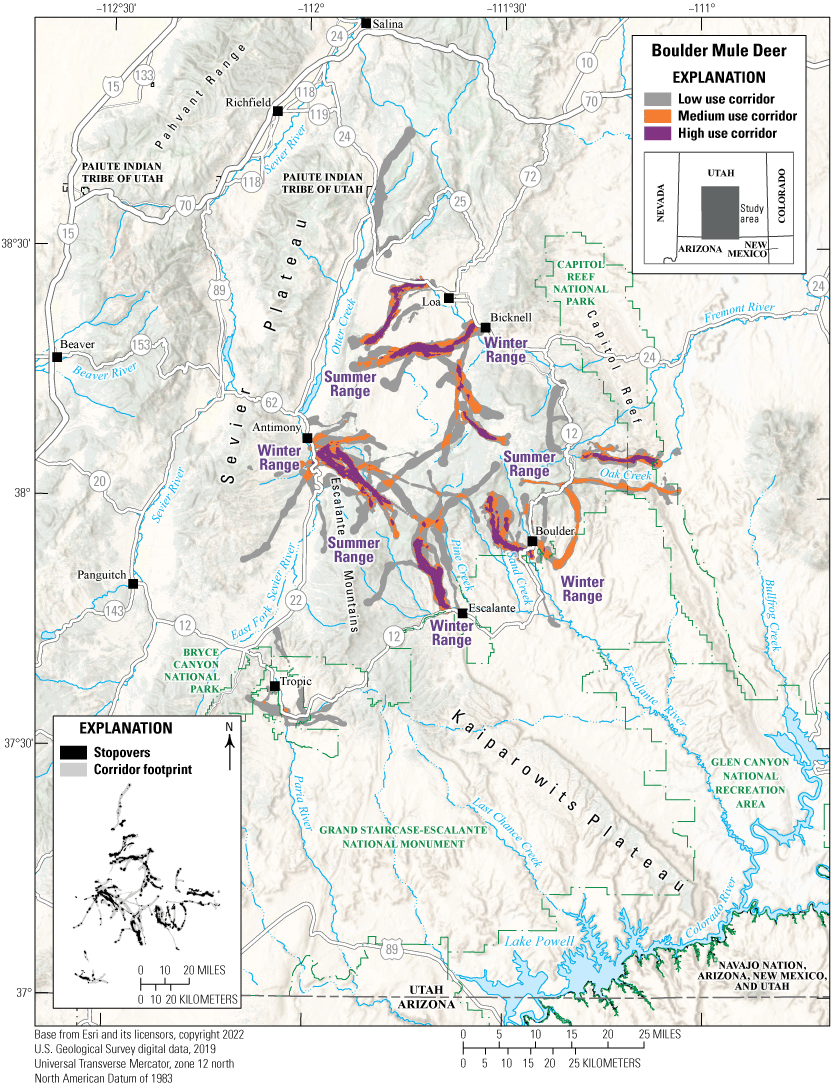
Migration corridors, stopovers, summer ranges, and winter ranges of the Boulder mule deer herd.
Animal Capture and Data Collection
Sample size: 82 adult mule deer (20 males, 61 females, 1 unknown)
Relocation frequency: Approximately 2–3 hours
Project duration: 2019–present
Data Analysis
Corridor and stopover analysis: Brownian bridge movement models (Sawyer and others, 2009) and Fixed Motion Variance (refer to app. 1 for further description)
Delineation of migration periods: Net Squared Displacement (Bunnefeld and others, 2011)
Models derived from:
Migration use classifications:Corridor and Stopover Summary
Migration start and end dates (median):
Number of days migrating (mean): Migration length: Migration corridor area:Other Information
Utah mule deer migration data are kept up to date and are viewable at the Utah Division of Wildlife Resources Wildlife Migration Initiative webpage (Utah Division of Wildlife Resources, 2023). Data used in this study may be made available upon approval by Utah Division of Wildlife Resources.
Project contact:
-
• Blair Stringham (blairstringham@utah.gov), Wildlife Migration Initiative Coordinator, Utah Division of Wildlife Resources
Data analyst:
Utah | Mule Deer
Wasatch East Mule Deer
The Wasatch East mule deer herd resides on the eastern side of the Wasatch Range in central Utah. Annually, the Wasatch East mule deer migrate an average of 23 mi (37 km) between summer ranges along Duchesne Ridge, north of Strawberry Valley, and winter ranges west of Duchesne, Utah, near Tabby Mountain and Rabbit Gulch (fig. 20). Winter range habitat consists of pinyon-juniper woodlands, sagebrush-grass, and mountain browse communities. These habitat types are used heavily by wintering big game species and browsing availability is greatly reduced in severe winters, which pushes the Wasatch East mule deer herd into agricultural areas. The herd’s winter range habitats are at high risk of habitat loss and degradation, threatened by conifer encroachment, expansion of invasive species, and increasing development. The Utah Division of Wildlife Resources is actively restoring sagebrush and other browse species to recover and enhance winter habitat for mule deer and other wildlife. Additionally, highway mortality is a significant concern for this herd because mule deer must traverse two major highways, U.S. Highway 40 and U.S. Highway 191. Bisecting this corridor, U.S. Highway 40, a major transportation corridor, has seen an upward trend of AADT and saw nearly 6,000 vehicles per day in 2020 (Utah Department of Transportation, 2023). Approximately 2,000 vehicles per day travel U.S. Highway 191 (Utah Department of Transportation, 2023), which forms the southeastern boundary of the Wasatch East mule deer herd. Cooperative efforts with the Utah Department of Transportation are underway to accurately implement mitigation measures on sections of both highways to reduce WVC.
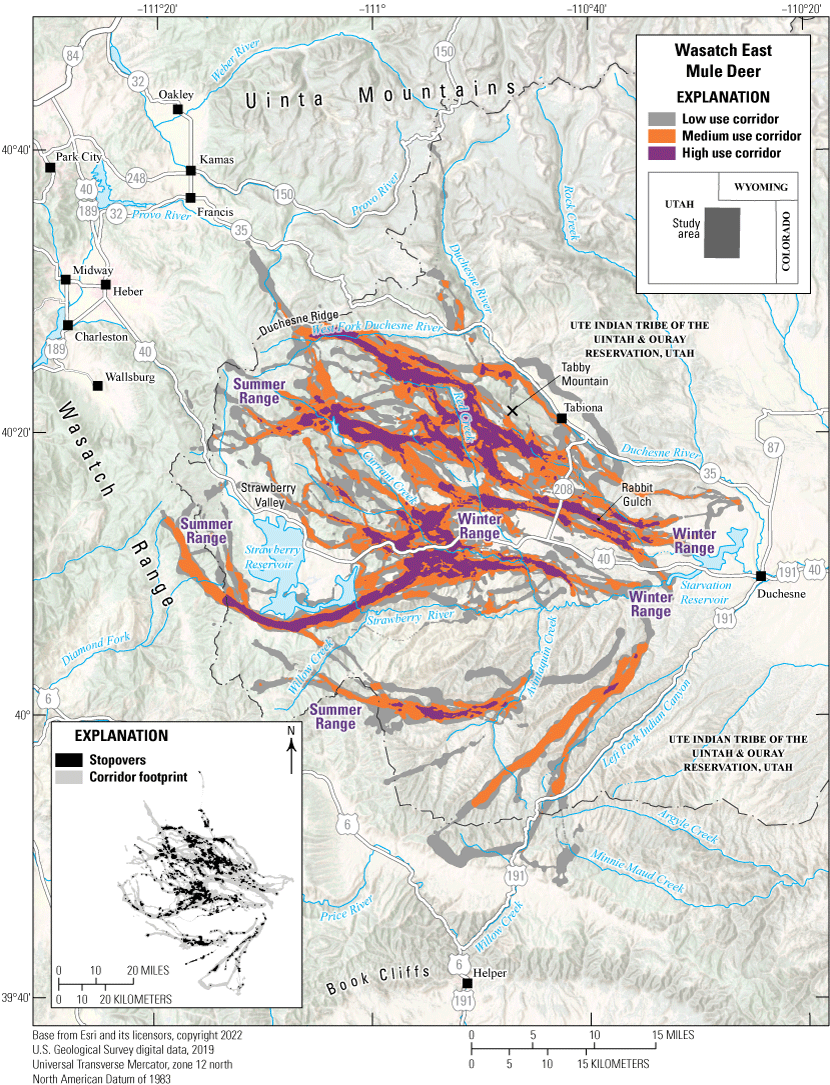
Migration corridors, stopovers, summer ranges, and winter ranges of the Wasatch East mule deer herd.
Animal Capture and Data Collection
Sample size: 89 adult mule deer (41 males, 48 females)
Relocation frequency: 2–3 hours
Project duration: 2020–present
Data Analysis
Corridor and stopover analysis: Brownian bridge movement models (Sawyer and others, 2009) and Fixed Motion Variance (refer to app. 1 for further description)
Delineation of migration periods: Net Squared Displacement (Bunnefeld and others, 2011)
Models derived from:
Migration use classifications:Corridor and Stopover Summary
Migration start and end dates (median):
Number of days migrating (mean): Migration corridor length: Migration corridor area:Other Information
Utah mule deer migration data are kept up to date and are viewable at the Utah Division of Wildlife Resources Wildlife Migration Initiative webpage (Utah Division of Wildlife Resources, 2023). Data used in this study may be made available upon approval by Utah Division of Wildlife Resources.
Project contact:
Data analyst:Utah | Mule Deer
Zion Mule Deer
The Zion mule deer herd inhabits the Zion WMU in southern Utah, is one of the larger deer herds in the State, and has approximately 18,000 animals. The Zion WMU has a unique assemblage of flora and fauna in addition to various geographical configurations such as canyons, buttes, mesas, and natural arches. Land ownership is a complex mix of BLM, NPS, FS, and private lands. A significant portion of the Zion mule deer herd’s summer and winter habitats is on private land. The BLM, FS, and Zion National Park administrate the remaining portions (fig. 21). Data from GPS-collared mule deer indicated most mule deer are migratory, traveling north and south to reach their respective seasonal ranges. Additionally, mule deer must navigate State Route 9, which connects nearby major cities to Zion National Park. As a result, urban development and vehicular collisions are the herd's predominant challenges in this migration corridor. The Utah Division of Wildlife Resources continues to work closely with landowners and land management agencies to protect and enhance existing, crucial mule deer habitat and mitigate losses because of natural and human effects.
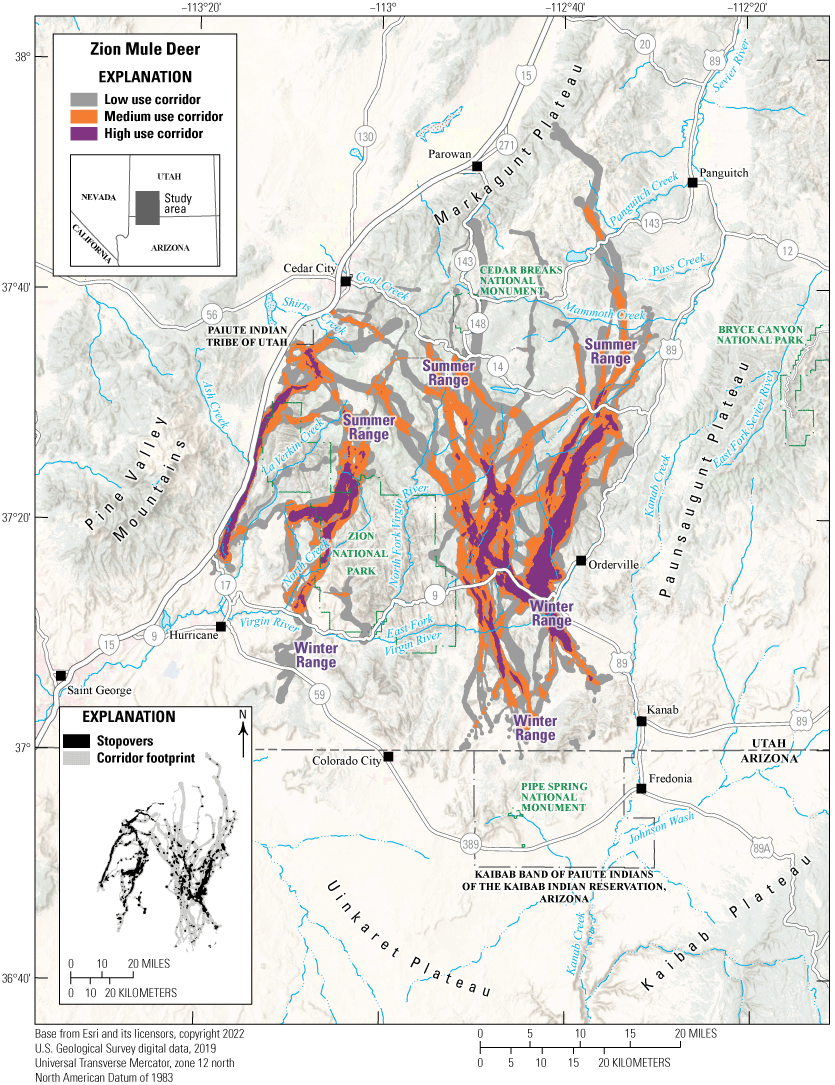
Migration corridors, stopovers, summer ranges, and winter ranges of the Zion mule deer herd.
Animal Capture and Data Collection
Sample size: 78 adult mule deer (29 males, 49 females)
Relocation frequency: Approximately 2−3 hours
Project duration: 2019–present
Data Analysis
Corridor and stopover analysis: Brownian bridge movement models (Sawyer and others, 2009) and Fixed Motion Variance (refer to app. 1 for further description)
Delineation of migration periods: Net Squared Displacement (Bunnefeld and others, 2011)
Models derived from:
Migration use classifications:Corridor and Stopover Summary
Migration start and end dates (median):
Number of days migrating (mean): Migration corridor length: Migration corridor area:Other Information
Utah mule deer migration data are kept up to date and are viewable at the Utah Division of Wildlife Resources Wildlife Migration Initiative webpage (Utah Division of Wildlife Resources, 2023). Data used in this study may be made available upon approval by Utah Division of Wildlife Resources.
Project contact:
Data analyst:Washington | Mule Deer
Klickitat Mule Deer
The Klickitat mule deer herd inhabits the Columbia Hills and surrounding terrain to the north along the Columbia River, Washington (fig. 22). Klickitat River bounds the western edge of the herd’s range and is part of a transition zone between black-tailed deer and mule deer distributions. Habitats in the western half of the herd’s range include Quercus garryana (Oregon white oak) mixed with Abies spp. (fir), pine, or grassland species. The western half of the herd’s range comprises a mix of public and private lands, including rangeland, farmland, and the Klickitat Wildlife Area, which has protected crucial winter range since the 1950s. Sagebrush steppe is more prevalent in the eastern half of the herd’s range with Oregon white oak and ponderosa pine in drainages, such as Rock Creek, which serves as a popular wintering area. Dryland wheat, rangeland, and viticulture are also common in the eastern half of the herd’s range, which is mostly privately owned.
Klickitat mule deer are partially migratory; more residents inhabit the eastern half of the herd’s range, and a higher proportion of migrants are in the western half of the herd’s range. As vegetation green up progresses during spring, migrants travel from low-elevation winter ranges to high-elevation summer ranges in the Cascade Range and Simcoe Mountains. Some individuals migrate short distances (5 mi [8 km]), especially mule deer in the eastern half of the herd’s range. Increasing residential development in the western half of the range, and renewable energy development and conversion to viticulture in the eastern half of the range, are the greatest concerns for winter ranges and migration corridors. Additionally, U.S. Highway 97 is a semipermeable barrier to migration and only has one wildlife underpass, which was built in 2012.
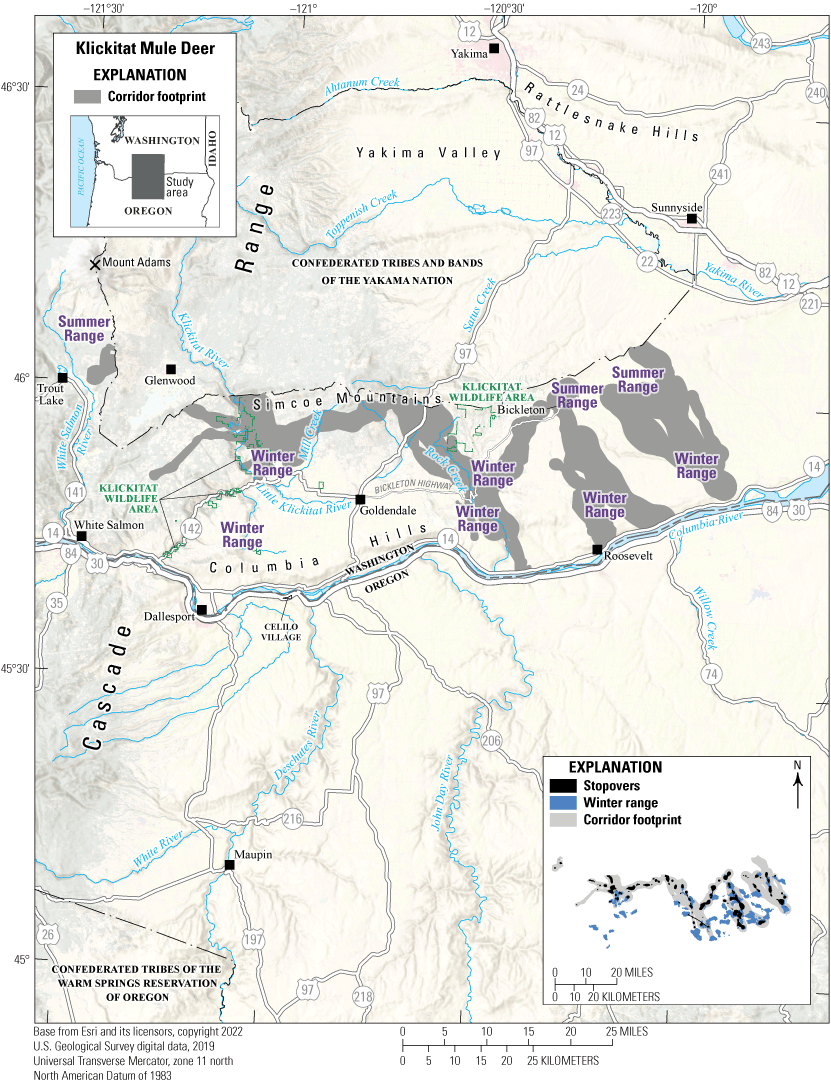
Migration corridors, stopovers, summer ranges, and winter ranges of the Klickitat mule deer herd. Parts of the corridor footprint overlapping Confederated Tribes and Bands of the Yakama Nation lands are not shown.
Animal Capture and Data Collection
Sample size: 103 adult female mule deer
Relocation frequency: Approximately 4 hours
Project duration: 2021–present (data through December 2022 analyzed for this report)
Data Analysis
Corridor, stopover, and winter range analysis: Brownian bridge movement models (Sawyer and others, 2009)
Delineation of migration periods: Net Squared Displacement (Bunnefeld and others, 2011)
Models derived from:
Migration use classifications:Corridor and Stopover Summary
Migration start and end dates (median):
Number of days migrating (mean): Migration length: Migration corridor area:Washington | Mule Deer
Wenatchee Mountains Mule Deer
The Wenatchee Mountains mule deer herd inhabits a matrix of private and public lands along the eastern slope of the Cascade Range in Washington (fig. 23). Historically, the Wenatchee Mountains mule deer herd was separated into two subherds, Chelan and Kittitas; however, recent GPS-collar data indicated the mule deer south of U.S. Highway 2 and north of Interstate 90 represent one herd. Their high use winter range extends along the foothills west and south of Wenatchee, Washington, and throughout the foothills of Kittitas Valley near Ellensburg, Washington. Their low use winter range occurs along the foothills west of the Columbia River north of Interstate 90. In the spring, migratory mule deer travel west into the Wenatchee Mountains to their summer range, which includes regional wilderness areas.
Between 2020 and 2021, collaring efforts focused on the foothills near Wenatchee, Washington, and in the surrounding foothills near Ellensburg. Collar data analysis indicated the Wenatchee Mountains mule deer herd is partially migratory. A high proportion of migratory mule deer inhabit the northern winter range of the Wenatchee Mountains, and residents more commonly inhabit the foothills of Kittitas Valley. In 2022, collaring efforts in the northern winter range foothills near Wenatchee targeted the higher proportion of the migratory herd of mule deer, to more clearly identify the movement corridors intersecting U.S. Highway 97 near Blewett Pass. The herd has several challenges, including the increasing frequency of large-scale wildfires and residential developments, which continue to degrade and reduce available winter habitat. Disturbance from human recreation on the winter range continues to be a concern. Additionally, U.S. Highway 97 and State Route 970 receive high volumes of traffic in the region and present semipermeable barriers to spring and fall migrations.
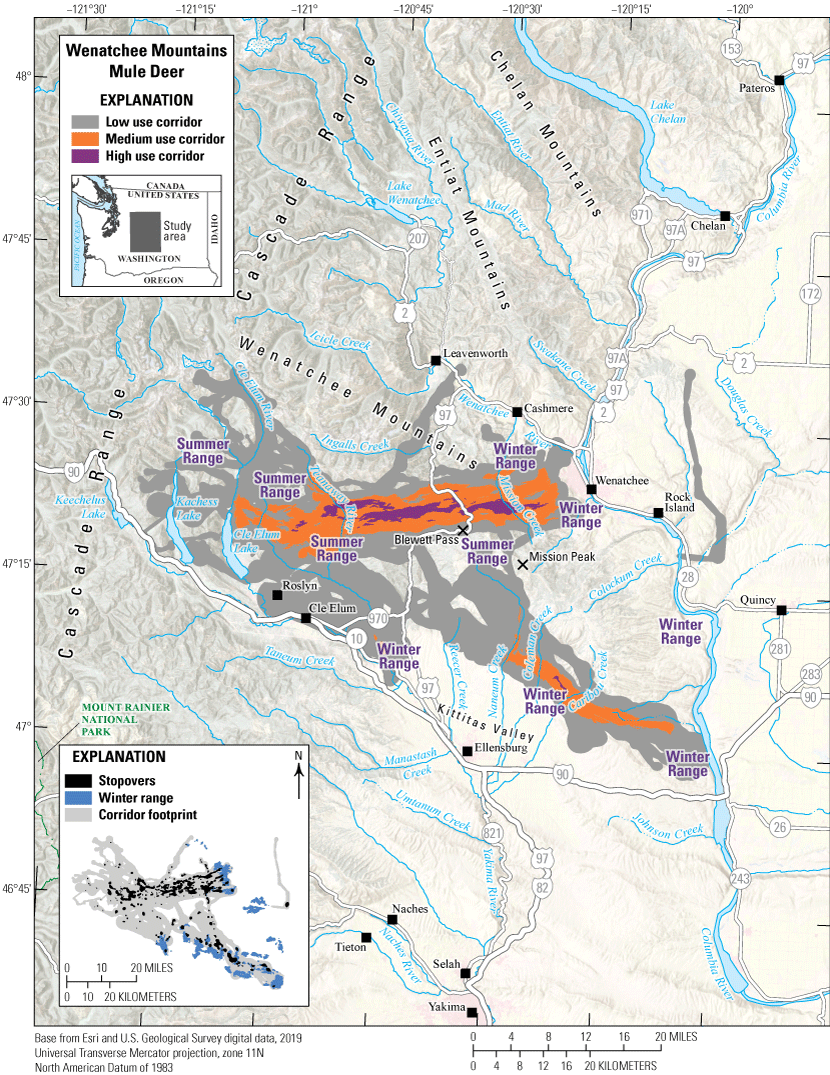
Migration corridors, stopovers, summer ranges, and winter ranges of the Wenatchee Mountains mule deer herd.
Animal Capture and Data Collection
Sample size: 121 adult female mule deer
Relocation frequency: Approximately 4 hours
Project duration: 2020–present (data through December 2022 analyzed for this report)
Data Analysis
Corridor, stopover, and winter range analysis: Brownian bridge movement models (Sawyer and others, 2009)
Delineation of migration periods: Net Squared Displacement (Bunnefeld and others, 2011)
Models derived from:
Migration use classifications:Corridor and Stopover Summary
Migration start and end dates (median):
Number of days migrating (mean): Migration corridor length: Migration corridor area:Other Information
Project contacts:
-
• Brendan Oates (brendan.oates@dfw.wa.gov), Ungulate Specialist, Washington Department of Fish and Wildlife
-
• Samantha Bundick (samantha.bundick@dfw.wa.gov), Ungulate Specialist, Washington Department of Fish and Wildlife
-
• Erin Wampole (erin.wampole@dfw.wa.gov), Assistant District Wildlife Biologist, Washington Department of Fish and Wildlife
-
• Emily Jeffreys (emily.jeffreys@dfw.wa.gov), District Wildlife Biologist, Washington Department of Fish and Wildlife
California | Pronghorn
Clear Lake Pronghorn
The Clear Lake pronghorn herd contains migrants, but this herd does not migrate between traditional summer and winter seasonal ranges. Instead, much of the herd displays a nomadic tendency and slowly migrates north, east, or south for the summer using various high use areas as they move. Therefore, annual ranges were modeled using year-round data to demarcate high use areas instead of modeling specific winter ranges. A few GPS-collared pronghorn lived west of State Route 139 year round, seemingly separated from the rest of the herd by this highway barrier (fig. 24). However, some pronghorn crossed this road near Cornell, California, and joined this subgroup. Summer ranges were dispersed, and many individuals moved southeast through protected forests or crossed the State border into Oregon. A few outliers in the herd migrated long distances south, either crossing State Route 139 to Oak Ridge, or east into areas used by Likely Tables pronghorn (refer to the “Likely Tables Pronghorn” section in this report). Many of the collared pronghorn heavily used areas adjacent to Clear Lake Reservoir during winter. The Clear Lake pronghorn herd is declining (Trausch and others, 2020) because of drought, increasing fire frequency, invasive annual grasses, and juniper encroachment. Juniper removal on public and private lands could improve habitat quality and potentially reduce predation from mountain lions (Ewanyk, 2020).
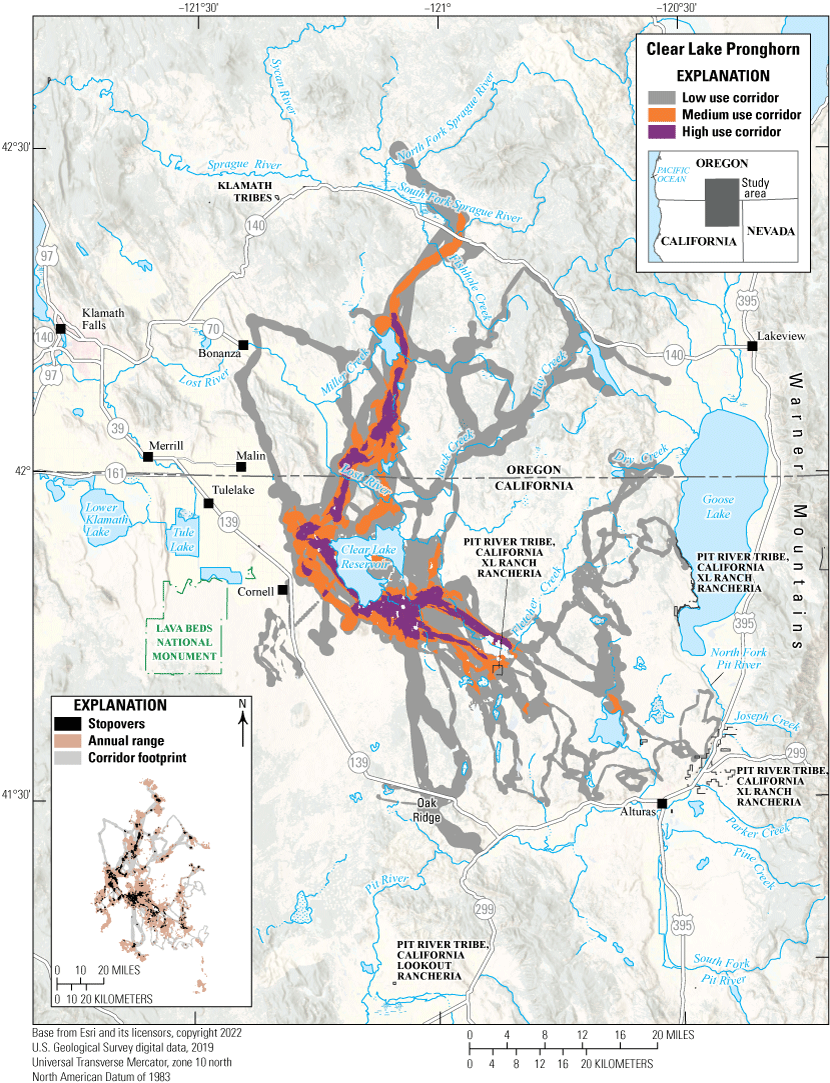
Migration corridors, stopovers, and annual ranges of the Clear Lake pronghorn herd.
Animal Capture and Data Collection
Sample size: 28 adult female pronghorn
Relocation frequency: Approximately 1–6 hours
Project duration: 2015–20
Data Analysis
Corridor, stopover, and annual range analysis: Brownian bridge movement models (Sawyer and others, 2009) and Fixed Motion Variance (refer to app. 1 for further description)
Delineation of migration periods: Net Squared Displacement (Bunnefeld and others, 2011)
Models derived from:
Migration use classifications:Other Information
Project contacts:
-
• Richard Shinn (richard.shinn@wildlife.ca.gov), Environmental Scientist, California Department of Fish and Wildlife
-
• Christine Found-Jackson (christine.found-jackson@wildlife.ca.gov), Wildlife Biologist, California Department of Fish and Wildlife
-
• Brian Hudgens (hudgens@iws.org), Research Ecologist, Institute for Wildlife Studies
California | Pronghorn
Lassen Pronghorn
The Lassen pronghorn herd winters in lower elevations in Secret Valley, Bull Flat, and wilderness areas east of Shaffer Mountain and northeast of the Skedaddle Mountains. Summer ranges are dispersed with some pronghorn migrating north to the Madeline Plains and other pronghorn heading west to Willow Creek Valley, Grasshopper Valley, and Eagle Lake (fig. 25). An unknown portion of the herd is better characterized as residents. The primary threat to the Lassen herd is the conversion of perennial shrublands to nonnative, annual grasslands following wildfires. The 2012 Rush fire burned 271,911 acres (110,038 ha) in Lassen County by the herd’s boundary and expanded nonnative annual grasslands with altered fire regimes, which increase fire frequency and promote further expansion of nonnative grasses. Overabundant feral horses and burros regularly exceed the appropriate management level, potentially reducing forage and water available for pronghorn (California Department of Fish and Wildlife, 2022). The expansion of juniper into shrub-steppe habitat reduces the forage available to pronghorn and increases the risk of mountain lion predation. Since the 1992–93 winter die off in northeastern California, the herd has been stable or slightly increasing with an average of 974 pronghorn counted during aerial winter surveys (B. Ehler, California Department of Fish and Wildlife, written commun., 2023). California Department of Fish and Wildlife plans to deploy 35 pronghorn GPS collars in winter 2024 to estimate the herd size using mark-resight surveys.
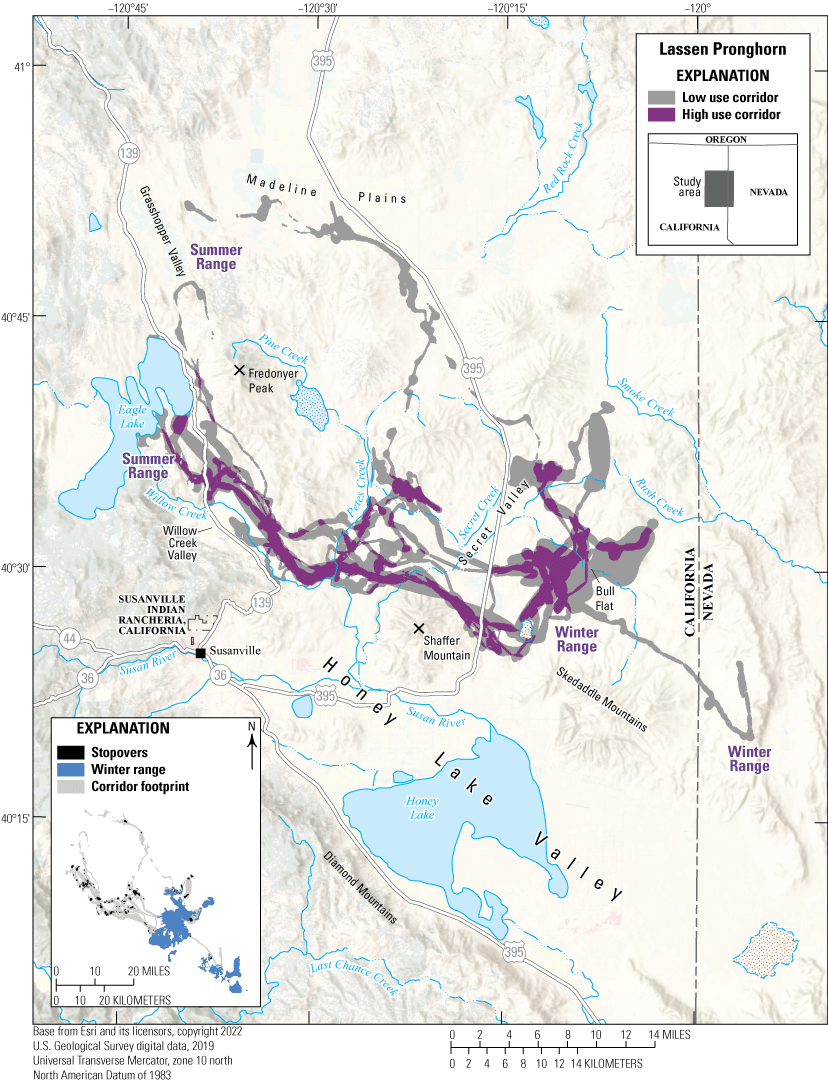
Migration corridors, stopovers, and winter ranges of the Lassen pronghorn herd.
Animal Capture and Data Collection
Sample size: 7 adult female pronghorn
Relocation frequency: Approximately 1−6 hours
Project duration: 2015–17
Data Analysis
Corridor, stopover, and winter range analysis: Brownian bridge movement models (Sawyer and others, 2009) and Fixed Motion Variance (refer to app. 1 for further description)
Delineation of migration periods: Net Squared Displacement (Bunnefeld and others, 2011)
Models derived from:
Migration use classifications:Corridor and Stopover Summary
Migration start and end dates (median):
Number of days migrating (mean): Migration corridor length: Migration corridor area:Other Information
Project contacts:
-
• Brian Ehler (brian.ehler@wildlife.ca.gov), Environmental Scientist, California Department of Fish and Wildlife
-
• Christine Found-Jackson (christine.found-jackson@wildlife.ca.gov), Wildlife Biologist, California Department of Fish and Wildlife
-
• Brian Hudgens (hudgens@iws.org), Research Ecologist, Institute for Wildlife Studies
California | Pronghorn
Likely Tables Pronghorn
The Likely Tables pronghorn herd contains migrants, but this herd does not migrate between traditional summer and winter seasonal ranges. Much of the herd displays a nomadic tendency and slowly migrates north for the summer using various high use areas as they move. Annual ranges were modeled using year-round data to demarcate high use areas instead of modeling specific winter ranges. However, during winter, many of the GPS-collared pronghorn heavily use an area west of the Warner Mountains, east of U.S. Highway 395, and north of Moon Lake (fig. 26). Some animals live year round in the agricultural fields and higher elevation prairies west of U.S. Highway 395. Little, if any, movement occurs by the herd across the highway, which is fenced on both sides of this area in the winter range. Summer ranges are dispersed with some pronghorn moving as far north as Goose Lake. A few outlier pronghorn in the herd move long distances south toward the Lassen pronghorn herd (refer to the “Lassen Pronghorn” section in this report) or east to Nevada. The Likely Tables pronghorn herd is declining because of drought, increasing fire frequency, invasive annual grasses, and juniper encroachment (Trausch and others, 2020). Juniper removal on public and private lands could improve habitat quality and potentially reduce predation from mountain lions (Ewanyk, 2020). Additionally, fences on public and private lands affect movement corridors and increase crossing or migration duration. However, recent fence modifications on BLM lands showed potential to reduce barriers to pronghorn movements (Hudgens, 2022).
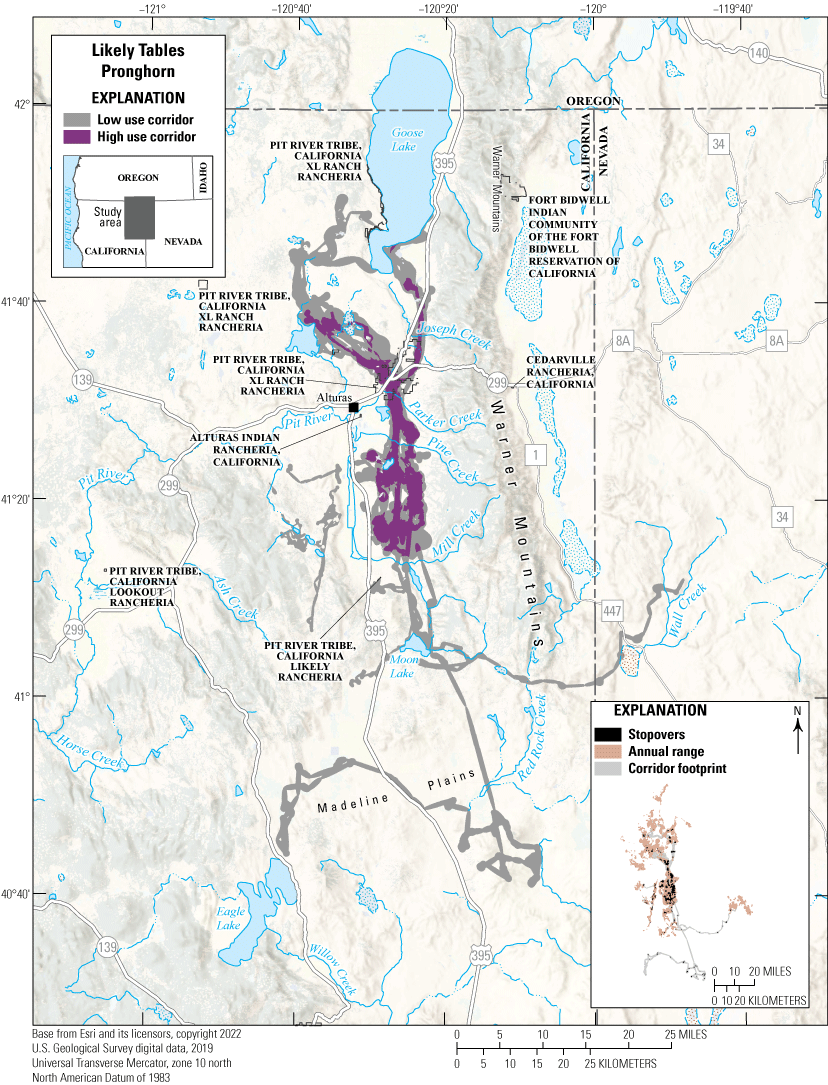
Migration corridors, stopovers, and annual ranges of the Likely Tables pronghorn herd.
Animal Capture and Data Collection
Sample size: 30 adult pronghorn (1 male, 29 females)
Relocation frequency: Approximately 1–4 hours
Project duration: 2014–20
Data Analysis
Corridor, stopover, and annual range analysis: Brownian bridge movement models (Sawyer and others, 2009) and Fixed Motion Variance (refer to app. 1 for further description)
Delineation of migration periods: Net Squared Displacement (Bunnefeld and others, 2011)
Models derived from:
Migration use classifications:Other Information
Project contacts:
-
• Richard Shinn (richard.shinn@wildlife.ca.gov), Environmental Scientist, California Department of Fish and Wildlife
-
• Christine Found-Jackson (christine.found-jackson@wildlife.ca.gov), Wildlife Biologist, California Department of Fish and Wildlife
-
• Brian Hudgens (hudgens@iws.org), Research Ecologist, Institute for Wildlife Studies
California | Pronghorn
Mount Dome Pronghorn
The Mount Dome pronghorn herd contains a mixture of residents and short-distance, elevation-based migrants, but this herd does not migrate between traditional summer and winter seasonal ranges. Instead, most of the herd displays a somewhat nomadic migratory tendency and slowly moves up or down elevational gradients. Long distance movements from this herd are rare because it is largely surrounded by geographic and human features restricting movement. Some pronghorn use higher elevation areas throughout the summer, although this pattern was not common. Therefore, annual home ranges were modeled using year-round data to demarcate high use areas (fig. 27). Mount Dome pronghorn numbers have declined significantly from historical highs but have remained relatively stable at low numbers in recent years (Trausch and others, 2020). Agricultural development in Butte Valley resulted in some loss of historical pronghorn habitat. Drought, increasing fire frequency, invasive annual grasses, and juniper encroachment negatively affect remaining, available habitat for pronghorn. Juniper removal on public and private lands has the potential to improve habitat quantity and quality (Ewanyk, 2020).
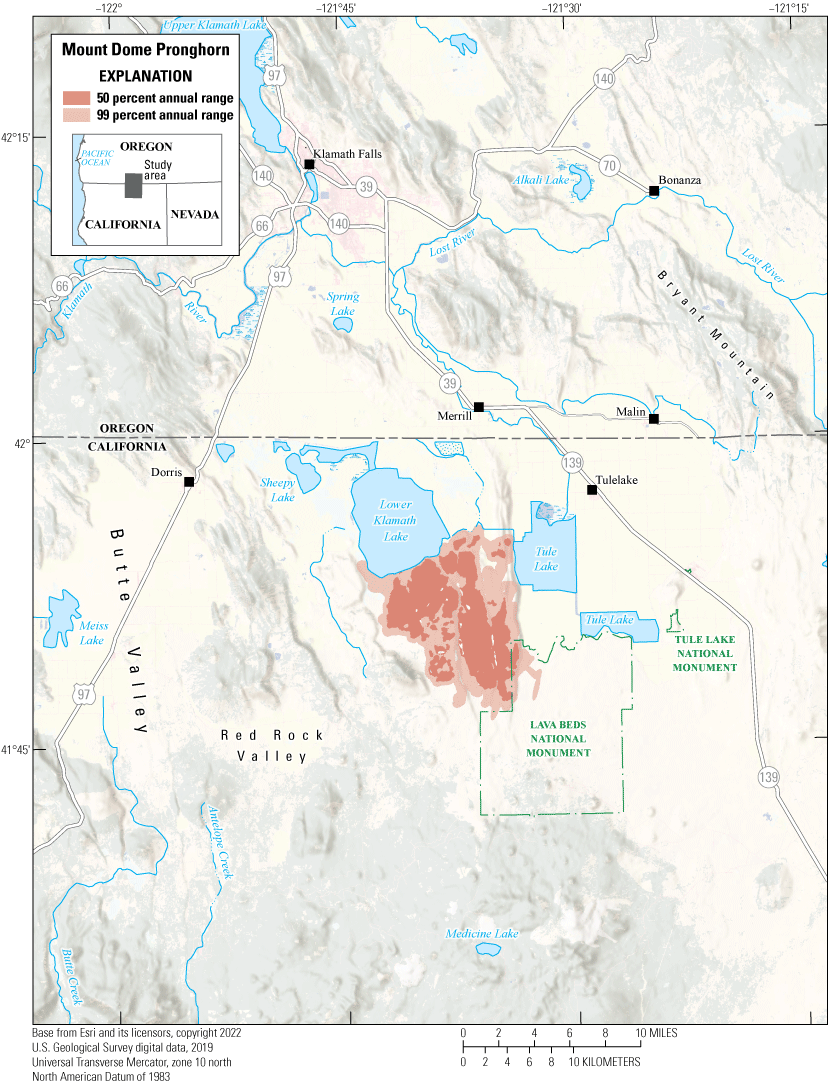
Annual ranges of the Mount Dome pronghorn herd.
Animal Capture and Data Collection
Sample size: 9 adult female pronghorn
Relocation frequency: Approximately 1−2 hours
Project duration: 2019–20
Data Analysis
Annual range analysis: Brownian bridge movement models (Sawyer and others, 2009)
Models derived from:
Other Information
Project contacts:
-
• Richard Shinn (richard.shinn@wildlife.ca.gov), Environmental Scientist, California Department of Fish and Wildlife
-
• Christine Found-Jackson (christine.found-jackson@wildlife.ca.gov), Wildlife Biologist, California Department of Fish and Wildlife
-
• Brian Hudgens (hudgens@iws.org), Research Ecologist, Institute for Wildlife Studies
Wyoming | Pronghorn
Carter Mountain Pronghorn
The Carter Mountain pronghorn herd contains approximately 7,000 pronghorn—half which migrate 10–60 mi (16–97 km) west from common winter ranges in the Bighorn Basin to summer ranges near the Absaroka Range (fig. 28). During this migration, pronghorn must cross U.S. Highway 14 and Wyoming Highway 120. Most pronghorn summer in ranges west of Wyoming Highway 120 along the Greybull River, but some pronghorn summer in the South Fork Shoshone River drainage. Some of the herd gains nearly 6,000 ft (1,829 m) in elevation to summer on the high plateaus of the Absaroka Range and upper Greybull River and at 10,000–11,000 ft (3,048–3,353 m) above sea level in alpine meadows they share with Ursus arctos (grizzly bear) and Canis lupus (wolf) populations. Challenges to this herd’s migration include multiple highway and fence crossings. Habitat loss and fragmentation from residential development are also a concern.
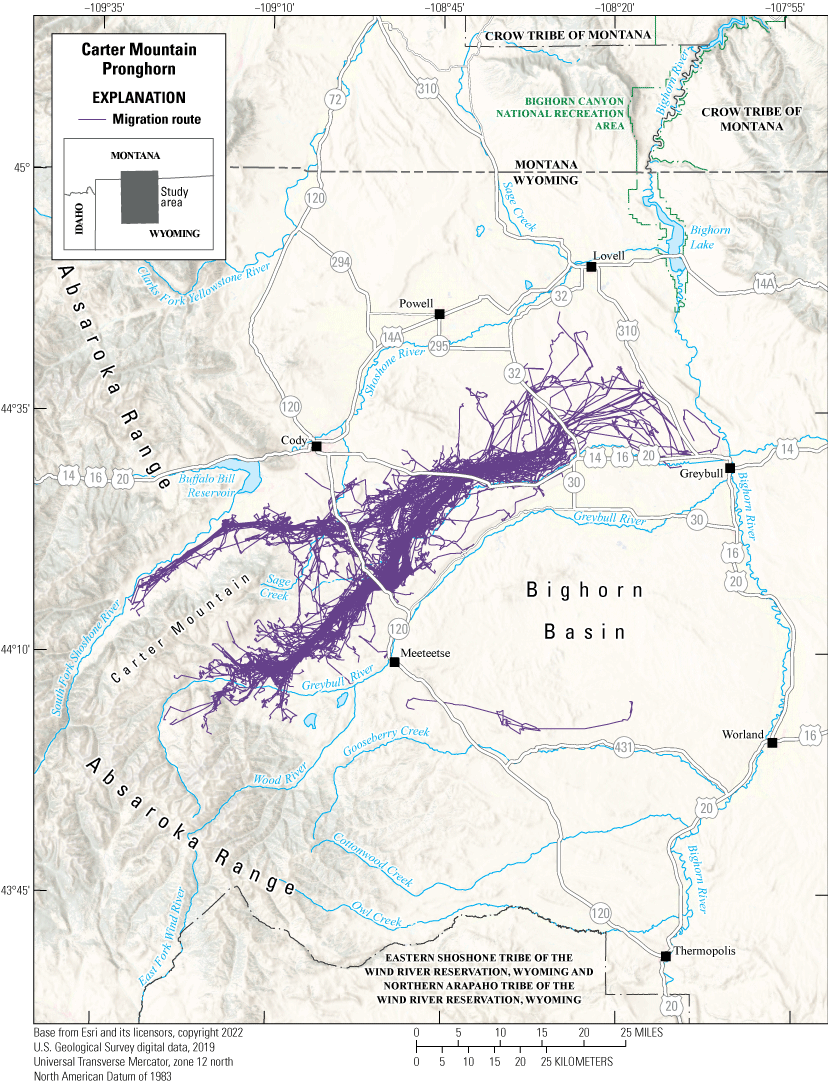
Migration routes of the Carter Mountain pronghorn herd.
Animal Capture and Data Collection
Sample size: 128 adult female pronghorn
Relocation frequency: Approximately 2 hours
Project duration: 2019–21
Data Analysis
Delineation of migration periods: Net Squared Displacement (Bunnefeld and others, 2011)
Models derived from:
Corridor and Stopover Summary
Migration start and end dates (median):
Number of days migrating (mean): Migration corridor length:Arizona | Elk
South of Interstate 40 Elk
The South of Interstate 40 elk herd primarily resides in Arizona Game Management Unit 8. Population surveys in 2021 estimated approximately 4,000 elk inhabited Game Management Unit 8. The elk herd’s summer range is primarily characterized by high-elevation ponderosa pine forests and grasslands. The elk migrate from various origin points in their summer range to their winter range, which comprises canyon rims in the area (fig. 29). This series of canyons creates an impermeable southern boundary for this herd. Their winter range along the canyon rim area is primarily characterized by pinyon-juniper, Arctostaphylos spp. (manzanita), and Quercus ilicifolia (bear oak). Interstate 40 is the primary threat to this herd’s migration corridor, which limits habitat connectivity and highway permeability between the South and North of Interstate 40 elk herds (Arizona Game and Fish Department, 2021; Kauffman and others, 2022a). Successful elk crossings of Interstate 40 are rare, and more than 65 WVC occur in this area per year (Arizona Game and Fish Department, 2021). To help mitigate this issue, an overpass is being planned, which could potentially connect these two herds across Interstate 40.
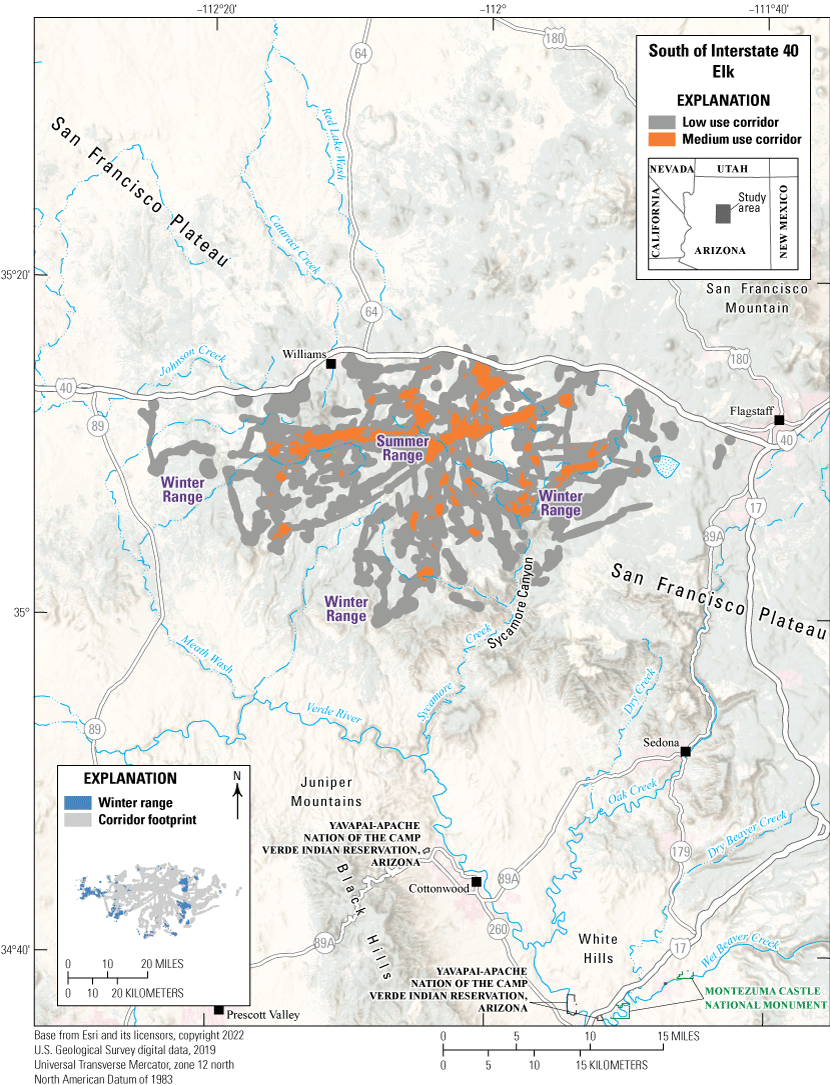
Migration corridors, summer range, and winter ranges of the South of Interstate 40 elk herd.
Animal Capture and Data Collection
Sample size: 23 adult elk (5 males, 18 females), 2 juvenile female elk
Relocation frequency: Approximately 2 hours
Project duration: 2009–11 and 2020–present (data through December 2022 analyzed for this report)
Data Analysis
Corridor, stopover, and winter range analysis: Fixed Motion Variance (refer to app. 1 for further description)
Delineation of migration periods: Net Squared Displacement (Bunnefeld and others, 2011)
Models derived from:
Migration use classifications:Corridor and Stopover Summary
Migration start and end dates (median):
Number of days migrating (mean): Migration corridor length: Migration corridor area:Other Information
Project contacts:
-
• Jeff Gagnon (jgagnon@azgfd.gov), Wildlife Specialist Regional Supervisor, Arizona Game and Fish Department
-
• Scott Sprague (ssprague@azgfd.gov), Project Manager/Road Ecologist, Arizona Game and Fish Department
-
• Arizona Game and Fish Department, 2020, Arizona State action plan: Phoenix, Ariz., Arizona Game and Fish Department, 57 p. [Also available at https://www.nfwf.org/sites/default/files/2022-09/arizona-action-plan.pdf.]
-
• Arizona Game and Fish Department, 2021, Research report on elk movements associated with Interstate 40: Phoenix, Ariz., Arizona Department of Transportation, prepared by Arizona Game and Fish Department, project no. NH 040-C(211)S 40 CN 183 H758601L, 118 p.
Colorado | Elk
East Gunnison Basin Elk
The East Gunnison Basin elk herd (Data Analysis Unit E43) inhabits the central part of southwest Colorado and overlaps with the Taylor Park mule deer herd (refer to the “Taylor Park Mule Deer” section in this report). The area encompasses approximately 1,432 mi2 (3,709 km2) and is bound on the north by the Elk Mountains and Sawatch Range; on the east and south by the Continental Divide; and on the west by the East River, Gunnison River, and Cochetopa Creek (fig. 30). Elevations in the East Gunnison Basin unit range from approximately 7,700 ft (2,347 m) near Gunnison, Colorado, to more than 14,000 ft (4,267 m) along the Continental Divide. The area comprises a mix of land ownership and approximately 88 percent public lands. Most of the private lands are at lower elevations. Historically, the East Gunnison Basin elk herd ranged from 4,000 to 8,000 animals and is currently estimated at 6,900 elk.
During the winters of 2015–22, GPS collars were deployed on 74 adult female elk with the goal of measuring long-term changes in elk distribution patterns and annual survival rates. In general, the GPS-collar data revealed elk seasonally migrate 30–40 mi (48–64 km) in midfall (November) from the highest elevations on the northern and eastern fringes of the unit to the lower elevation winter ranges (approximately 8,000–9,000 ft [2,438–2,743 m] in elevation). The data revealed 20–40 percent of the herd migrates from their typical winter range midwinter (December to February), moving southeast (10–30 mi [16–48 km]), and crossing the Continental Divide (peaking at approximately 10,000–11,000 ft [3,048–3,352 m] in elevation) to finish wintering in areas with less snowpack in the San Luis Valley on the eastern slope of the Continental Divide. The proportion of the herd making this midwinter migration appears to depend on winter conditions in their typical winter range, with approximately 50–70 percent leaving during the years with deeper snowpack. Elk survival declines substantially in these harsh winters, emphasizing the importance of maintaining their ability to move to milder conditions, such as those conditions found across the Continental Divide. The elk making the longest migrations use a network of 3–4 corridors at least 74 mi (119 km) long, which cross U.S. Highway 50, State Route 114, and the dense forests and deeper snowpack along the Continental Divide. State Route 135, which parallels the Gunnison River and East River on the northwestern border of the East Gunnison Basin unit, creates a significant barrier to neighboring elk in the West Elk Mountains unit. However, an estimated 500–750 elk (depending on the conditions) move between the two units by using historically known sites across the river and paralleling the highway. Many of the same corridors and pinch points used by the East Gunnison Basin elk herd overlap the Taylor Park mule deer herd.
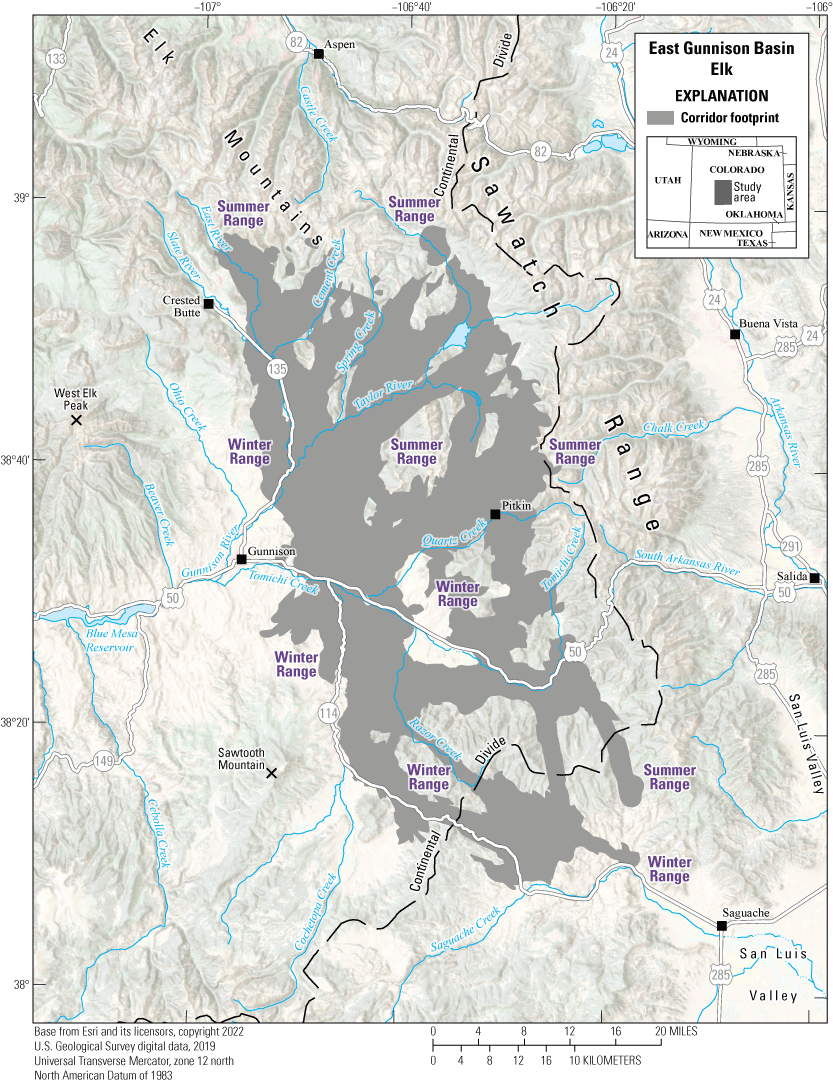
Migration footprint, summer ranges, and winter ranges of the East Gunnison Basin elk herd.
Animal Capture and Data Collection
Sample size: 74 adult female elk
Relocation frequency: 13 hours
Project duration: 2015–present (data through December 2021 analyzed for this report)
Data Analysis
Corridor analysis: Fixed Motion Variance (refer to app. 1 for further description)
Delineation of migration periods: Net Squared Displacement (Bunnefeld and others, 2011)
Models derived from:
Migration use classifications:Corridor Summary
Migration start and end dates (median):
Number of days migrating (mean): Migration corridor length: Migration corridor area:New Mexico | Elk
Jemez Elk
The Jemez elk herd primarily resides in the Jemez Mountains in the Valles Caldera National Preserve (fig. 31). The herd was originally included in Kauffman and others (2022a) but has been updated for this report because of new GPS-collar data available from 40 additional adult females. The Jemez elk are only partially migratory; some residents remain year round in the Valles Caldera National Preserve and others exhibit two distinct seasonal movement patterns. The first movement pattern occurs during midwinter (January–February) when numerous elk move to the lower elevation slopes of the Valles Caldera National Preserve, primarily southeast towards Bandelier National Monument. The second movement is more typical of a spring and fall migratory movement; elk migrate north to La Grulla Plateau for the summer and return to the Valles Caldera National Preserve for the winter. The primary challenge for migrants is crossing State Route 4 when traveling to Bandelier National Monument.
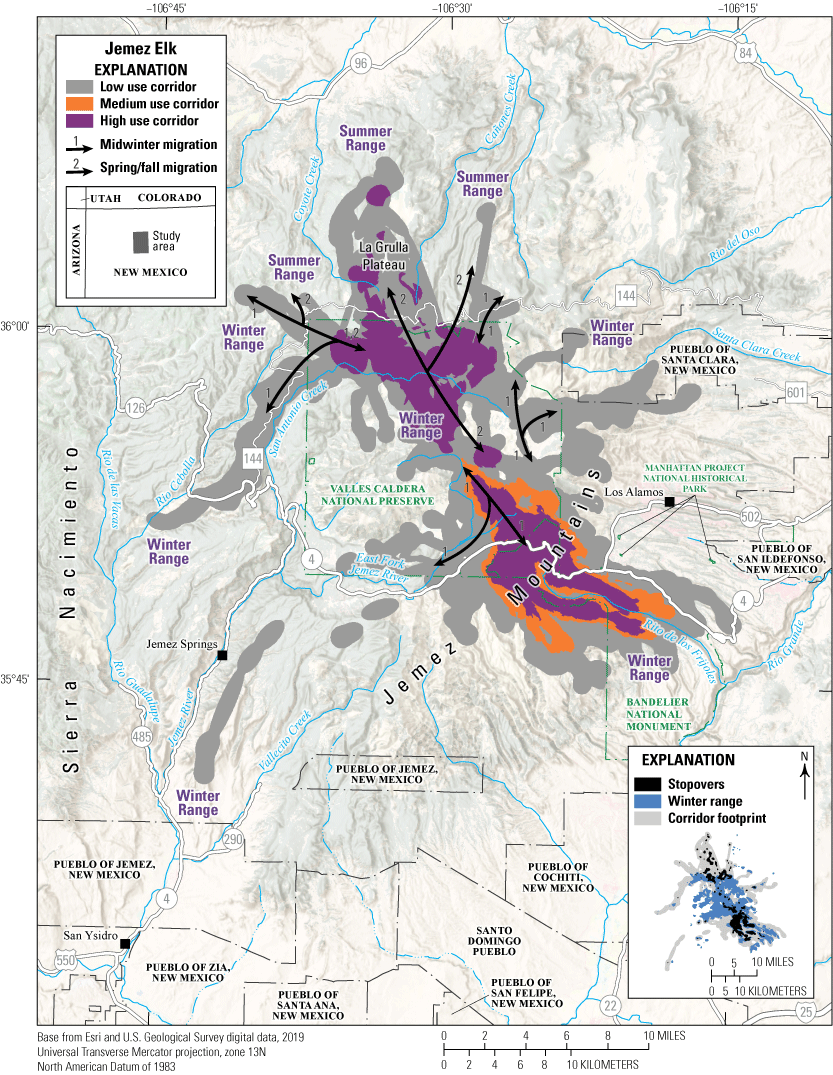
Migration corridors, stopovers, summer ranges, and winter ranges of the Jemez elk herd.
Animal Capture and Data Collection
Sample size: 122 adult female mule deer
Relocation frequency: Approximately 3−6 hours
Project duration: 2012–18 and 2021−present (data through January 2023 analyzed for this report)
Data Analysis
Corridor, stopover, and winter range analysis: Fixed Motion Variance (refer to app. 1 for further description)
Delineation of migration periods: Net Squared Displacement (Bunnefeld and others, 2011)
Models derived from:
Migration use classifications:Corridor and Stopover Summary (Midwinter)
Migration start and end dates (median):
Number of days migrating (mean): Migration corridor length: Migration corridor area:Corridor and Stopover Summary (Spring and Fall)
Migration start and end dates (median):
Number of days migrating (mean): Migration corridor length: Migration corridor area:New Mexico | Elk
Rio Chama Elk
The Rio Chama elk herd inhabits north-central New Mexico, near Tierra Amarilla (fig. 32). This herd’s winter range is predominately west of U.S. Highway 84 between the Heron and Abiquiu Reservoirs. The Rio Chama elk herd migrates through a mosaic of private, public, and Jicarilla Apache Nation, New Mexico lands, using three primary migration corridors: the northern and eastern corridors near Heron Reservoir and the northeastern corridor near Abiquiu Reservoir. Elk using the northern corridor near Heron Reservoir follow a variety of routes; some elk only migrate approximately 6 mi (9.7 km) to summer along the Rio Chama and other elk migrate more than 30 mi (48.3 km) to southern Colorado. The eastern migration corridors are approximately 10 mi (16.1 km) and cross U.S. Highways 84 and 64 south of Tierra Amarilla before settling in the western San Juan Mountains. Elk near the Abiquiu Reservoir commonly migrate northeast and cross State Route 84 into the San Juan Mountains to their summer range southeast of Canjilon, New Mexico. The herd faces several challenges, such as crossing State Route 112 and U.S. Highways 84 and 64, increasing density of housing subdivisions in some areas along their migration, and fencing, especially taller fencing that elk cannot jump.
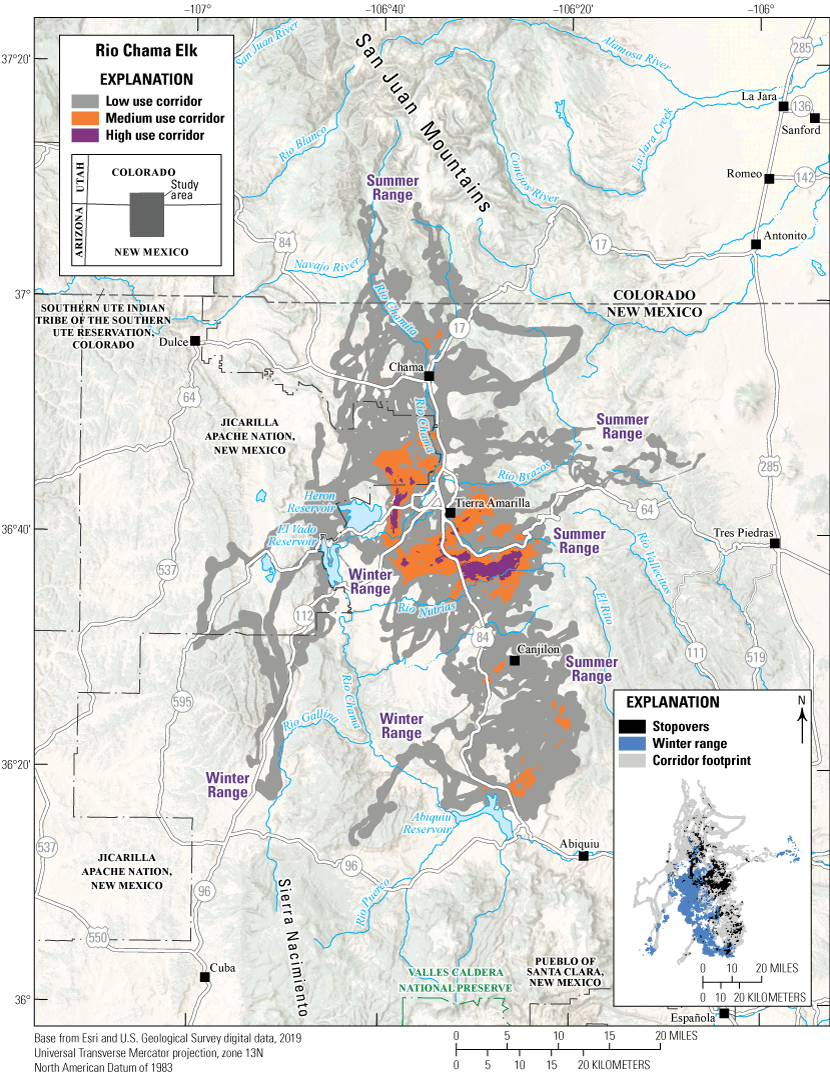
Migration corridors, stopovers, summer ranges, and winter ranges of the Rio Chama elk herd.
Animal Capture and Data Collection
Sample size: 62 adult female elk
Relocation frequency: Approximately 2 hours
Project duration: 2021–present (data through December 2022 analyzed for this report)
Data Analysis
Corridor, stopover, and winter range analysis: Brownian bridge movement models (Sawyer and others, 2009) and Fixed Motion Variance (refer to app. 1 for further description)
Delineation of migration periods: Net Squared Displacement (Bunnefeld and others, 2011)
Models derived from:
Migration use classifications:Corridor and Stopover Summary
Migration start and end dates (median):
Number of days migrating (mean): Migration corridor length: Migration corridor area:New Mexico | Elk
Tesuque Pueblo Elk
The Tesuque Pueblo elk herd is primarily nonmigratory. The elk in this herd came to the region in the late 1990s and early 2000s, likely because of displacement by large fires in the Jemez Mountains. U.S. Highways 84 and 285 bisect Pueblo of Tesuque, New Mexico, and create a physical barrier for elk movement, which contributes to potential WVC. GPS collars were deployed on two female elk to track the habitat and lands used by this herd. The elk seasonally use the western section of Pueblo of Tesuque, New Mexico (fig. 33). Similar to the Tesuque Pueblo mule deer herd (refer to the “Tesuque Pueblo Mule Deer” section of this report), the annual range (fig. 33) of the Tesuque Pueblo elk herd primarily consists of pinyon-juniper woodlands and pinyon-juniper savannah. The elk use the southwest area of Pueblo of Tesuque, New Mexico, and private lands southwest of the reservation. The herd also uses BLM and FS lands adjacent to Pueblo of Tesuque, New Mexico, in the Caja del Rio Plateau. A lower elevation and drier section of the FS lands, the Caja del Rio Plateau is a pinyon-juniper-dominated vegetation zone with areas of sage and mixed grasses. The elk are culturally significant to Pueblo of Tesuque, New Mexico, Tribal members.
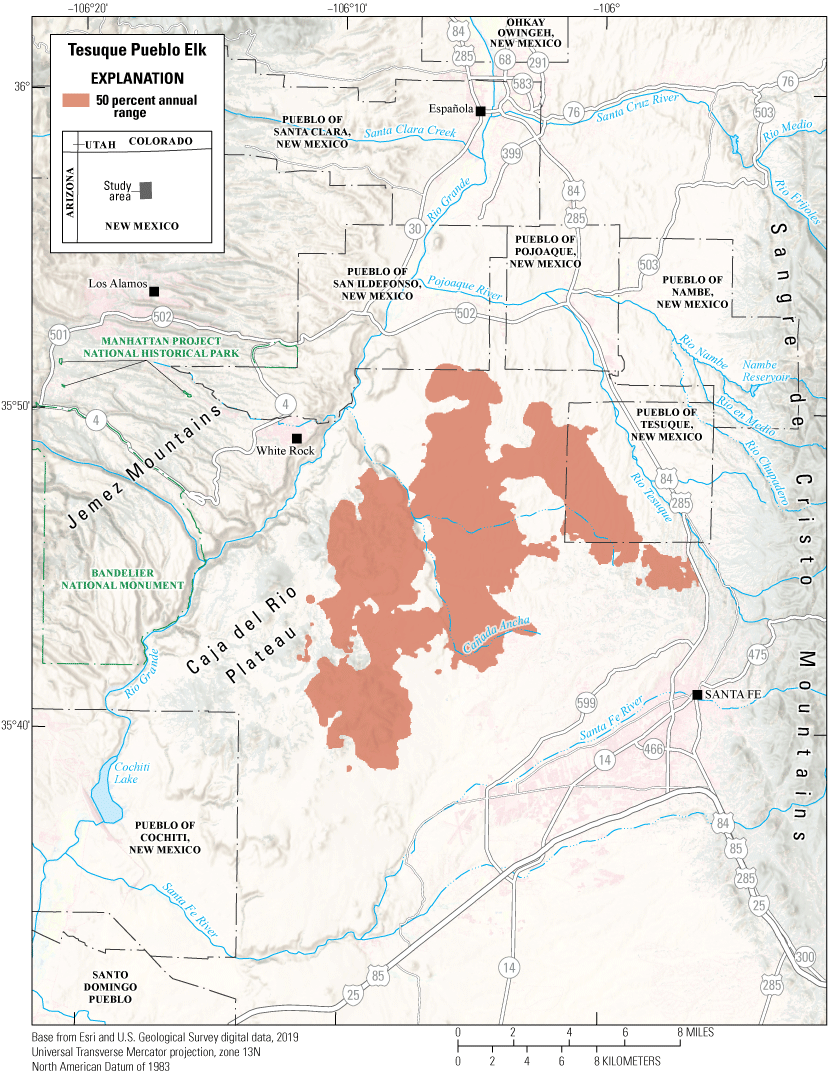
Annual range of the Tesuque Pueblo elk herd.
Animal Capture and Data Collection
Sample size: 2 adult female elk
Relocation frequency: Approximately 1–4 hours
Project duration: 2012–15
Data Analysis
Annual range analysis: Brownian bridge movement models (Sawyer and others, 2009)
Models derived from:
Washington | Elk
Colockum Elk
The Colockum elk herd inhabits a mix of public and private lands northeast of Ellensburg, Washington, between Blewett Pass of the Cascade Range and west of the Columbia River (fig. 34). The herd size ranges between 4,000 and 5,000 elk and is partially migratory; the herd includes a mix of resident (63 percent of GPS-collared elk) and migratory (34 percent of GPS-collared elk) behaviors. During winter, many elk inhabit grassland, sagebrush, antelope bitterbrush, and ponderosa pine habitats in the Whiskey Dick, Quilomene, and Colockum Wildlife Areas and the eastern reaches of the Naneum Ridge State Forest. As spring green up of vegetation nears, migratory elk travel northwest toward summer ranges in the Wenatchee Mountains, north of Ellensburg, Washington. Resident elk inhabit the same areas as wintering migratory elk. Agricultural producers in the eastern Kittitas Valley often experience conflicts with elk consuming hay in fields. Additional concerns for the herd include semipermeable barriers along Interstate 90 and U.S. Highway 97 and disturbance from human recreation on the winter range.
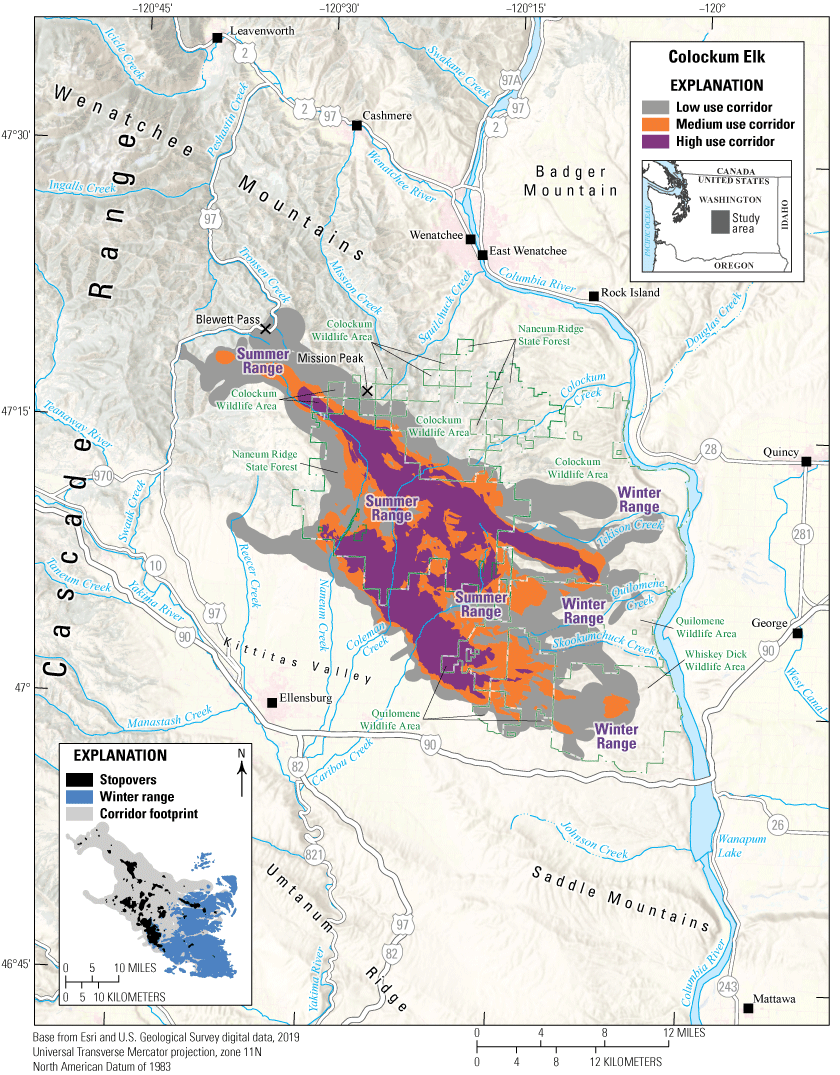
Migration corridors, stopovers, summer ranges, and winter ranges of the Colockum elk herd.
Animal Capture and Data Collection
Sample size: 99 adult female elk
Relocation frequency: Approximately 3 hours
Project duration: 2009–12
Data Analysis
Corridor, stopover, and winter range analysis: Brownian bridge movement models (Sawyer and others, 2009)
Delineation of migration periods: Net Squared Displacement (Bunnefeld and others, 2011)
Models derived from:
Migration use classifications:Corridor and Stopover Summary
Migration start and end dates (median):
Number of days migrating (mean): Migration corridor length: Migration corridor area:Other Information
Project contacts:
-
• Brendan Oates (brendan.oates@dfw.wa.gov), Ungulate Specialist, Washington Department of Fish and Wildlife
-
• William Moore (william.moore@dfw.wa.gov), Ungulate Specialist, Washington Department of Fish and Wildlife
-
• Erin Wampole (erin.wampole@dfw.wa.gov), Assistant District Wildlife Biologist, Washington Department of Fish and Wildlife
Wind River Reservation | Elk
Owl Creek Elk
The Owl Creek elk herd—between 7,500 and 8,500 wintering elk—inhabits the northwest corner of the Wind River Reservation, traversing habitats along the Absaroka Range and the Owl Creek Mountains (fig. 35). The herd contains resident and migratory elk; migrants travel an average 10.7 mi (17.2 km) one way. Elevations range from 6,000 ft (1,829 m) at the Wind River near Crowheart, Wyoming, to 12,200 ft (3,700 m) in the Absaroka Range, and summits in the Owl Creek Mountains, which reach 8,000–9,800 ft (2,438–2,987 m). Habitats range from sage and desert scrub in the lowlands to upland meadows, aspen groves, Pinus contorta (lodgepole pine) forests, and alpine tundra. When on the Wind River Reservation, the elk are under the sovereignty of the Eastern Shoshone Tribe of the Wind River Reservation, Wyoming, and Northern Arapaho Tribe of the Wind River Reservation, Wyoming. During spring migration, some elk cross the East Fork Wind River to FS lands. Other migrations are entirely within the reservation, including the upper tributaries near Washakie Needles or the Owl Creek Mountains. Residents in the herd also use the Owl Creek Mountains, particularly the part east of Blondy Pass. Many areas contain significant evidence of past hunting and ceremonial activity, and according to Shoshone ethnography, elk were significant game acquisition in the prereservation era of the 1800s (Shimkin, 1947). This elk herd remains culturally and economically valuable to Tribal members who sustainably harvest elk under a game code established in 1984 (Nickerson, 2019; Wind River Tribal Court, 2004). Habitats are virtually free of human disturbance and development aside from Tribal member livestock grazing and a few Tribal-owned and operated oilfields in the desert winter range. Threats to habitat include drought and climate change or biological invasions of nonnative cheatgrass and feral horses contributing to poor range conditions. In 2022, Tribes started working in partnership with the Bureau of Indian Affairs Wind River Agency, U.S. Fish and Wildlife Service, Wyoming Game and Fish Department, Wyoming Legislature, Wyoming Livestock Board, and the Wild Sheep Foundation to reduce the feral horse population and design projects to restore habitats to greater productivity (Nikonow, 2023).
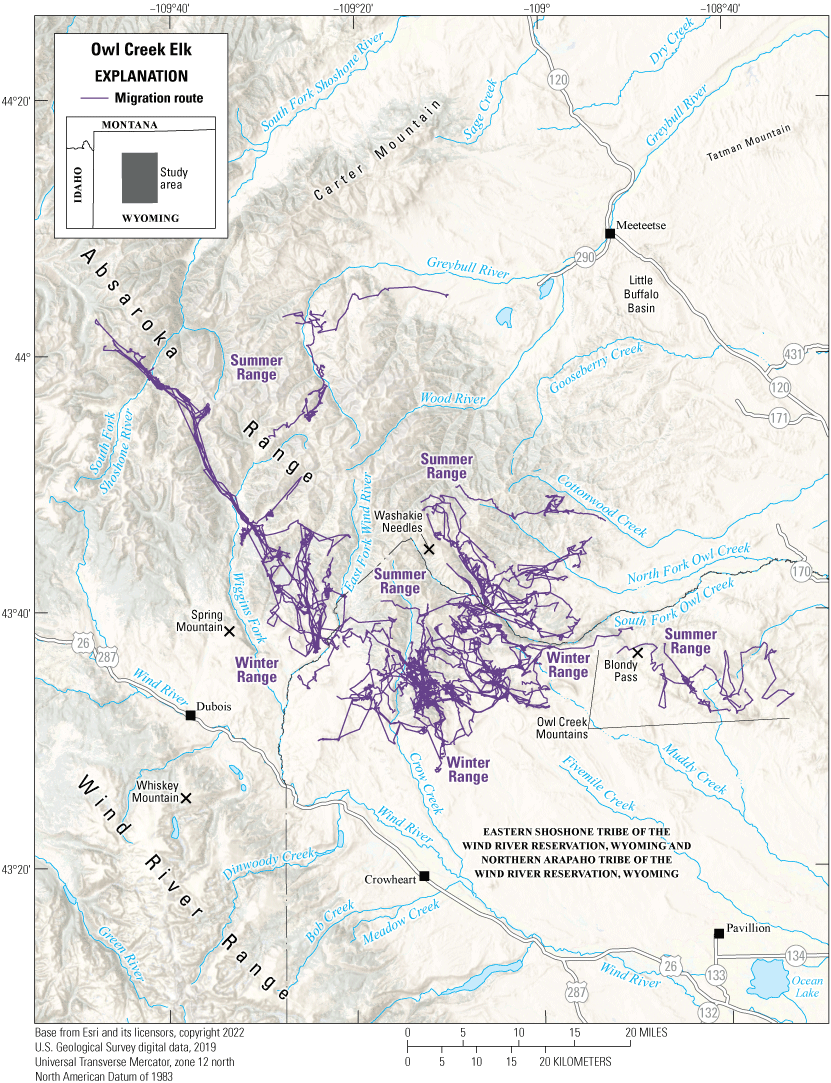
Migration routes, summer ranges, and winter ranges of the Owl Creek elk herd.
Animal Capture and Data Collection
Sample size: 32 adult female elk
Relocation frequency: Approximately 1 hour
Project duration: 2018–22
Data Analysis
Delineation of migration periods: Net Squared Displacement (Bunnefeld and others, 2011)
Models derived from:
Corridor and Stopover Summary
Migration start and end date (median):
Number of days migrating (mean): Migration length:Other Information
Project contacts:
-
• Art Lawson (Lawson@windriverfishandgame.com), Director, Shoshone & Arapaho Fish & Game Department
-
• Pat Hnilicka (pat_hnilicka@fws.gov), Project Leader, U.S. Fish and Wildlife Service, Lander Conservation Office
-
• Matthew Kauffman (mkauffm1@uwyo.edu), U.S. Geological Survey, Wyoming Cooperative Fish and Wildlife Research Unit, University of Wyoming
Wind River Reservation | Elk
Wind River Elk
The eastern slope of the Wind River Range provides habitat to approximately 4,000–5,000 migratory elk. The Wind River Elk herd winters on the Wind River Reservation, which is managed under the sovereignty of the Eastern Shoshone Tribe of the Wind River Reservation, Wyoming, and the Northern Arapaho Tribe of the Wind River Reservation, Wyoming (fig. 36). In spring, the herd migrates up in elevation to a roadless area established by the Tribes in the late 1930s—decades before The Wilderness Act of 1964 (Public Law 88–577, 16 U.S.C. 1131–1136)—or to adjacent FS lands. Many of the migration routes are along waterways that have significant cultural heritage, including petroglyphs in the Dinwoody-style and areas connected to stories of sacred figures and occurrences (Wind River Visitors Council, 2022). Elk are a prominent part of ongoing Tribal cultural and language revitalization efforts. Collared elk migrate through historical hunting pits and drive lines used by Native peoples thousands of years ago. The herd is actively hunted by Tribal members per a harvest regulation code (Nickerson, 2019; Wind River Tribal Court, 2004). The terrain ranges from 6,000 ft (1,829 m) to 12,000 ft (3,658 m), but most elk summer at elevations below 11,000 ft (3,353 m). Foothill habitats contain grass and sage, whereas the rocky Wind River Range contains alpine, lodgepole pine forests, mixed grass-conifer basins and ridges, and Salix spp. (willow)-lined creeks. The foothills have minimal development, except for irrigation infrastructure at Bull Lake and Washakie Reservoir and fenced ranches near Crowheart, Wyoming. Elk routinely winter in the remote foothills of the Wind River Range and near the more developed areas of Boulder Flats, Fort Washakie, and Lander, Wyoming. However, near Crowheart Butte and Bighorn Flat, groups of elk sometimes cross U.S. Highways 26 and 287 to the north or east, putting them at risk for elk-vehicle mortality.
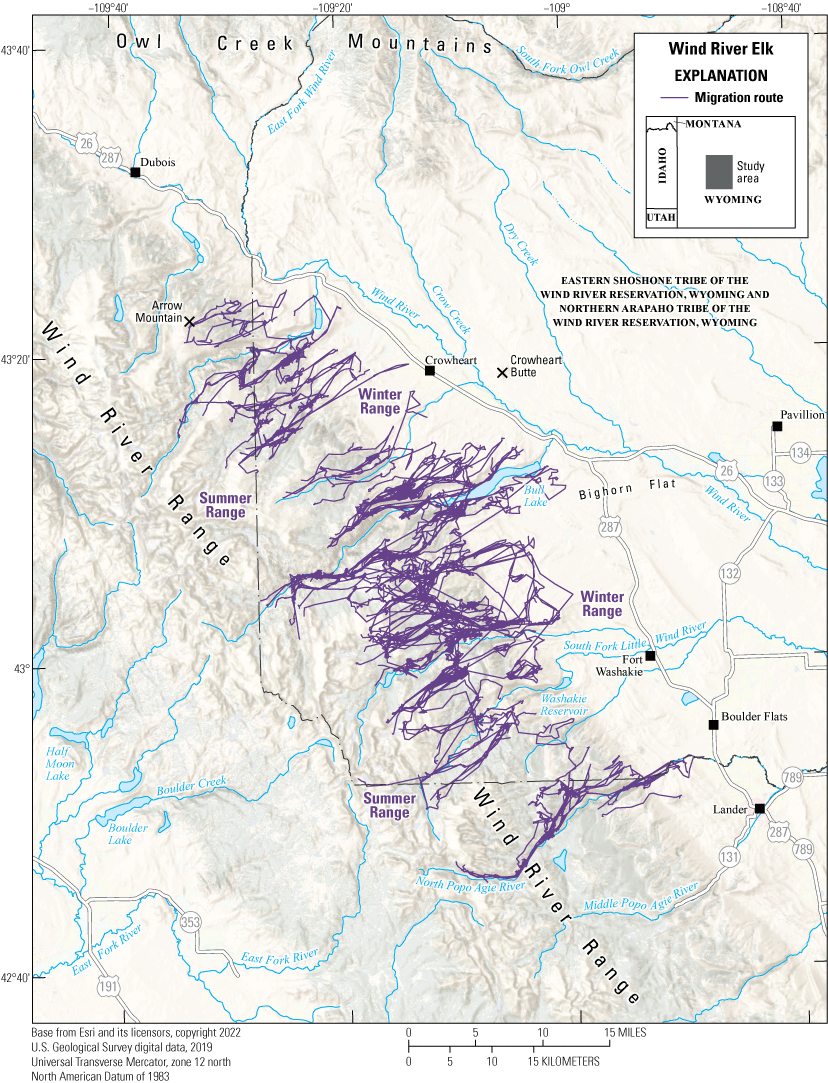
Migration routes, summer ranges, and winter ranges of the Wind River elk herd.
Animal Capture and Data Collection
Sample size: 34 adult female elk
Relocation frequency: Approximately 1 hour
Project duration: 2018–22
Data Analysis
Delineation of migration periods: Net Squared Displacement (Bunnefeld and others, 2011)
Models derived from:
Corridor and Stopover Summary
Migration start and end dates (median):
Number of days migrating (mean): Migration corridor length:Other Information
Project contacts:
-
• Art Lawson (Lawson@windriverfishandgame.com), Director, Shoshone & Arapaho Fish & Game Department
-
• Pat Hnilicka (pat_hnilicka@fws.gov), Project Leader, U.S. Fish and Wildlife Service, Lander Conservation Office
-
• Matthew Kauffman (mkauffm1@uwyo.edu), U.S. Geological Survey, Wyoming Cooperative Fish and Wildlife Research Unit, University of Wyoming
Wyoming | Moose
Jackson Moose
The Jackson moose herd inhabits an area 2,023 mi2 (5,239 km2) northwest of Jackson, Wyoming, in the lowlands of the Snake River. The Jackson moose herd was historically abundant and had a peak of 3,000–5,000 moose in the early 1990s. However, the herd declined significantly following the large counts in the early 1990s and continues to decline with an average count of 280 moose between 2016 and 2020 (Wyoming Game and Fish Department, 2022b). The migrations of the northern portion of the herd were published in Kauffman and others (2020a). The southern portion of the herd, presented here, resides near Wilson, Wyoming, and is partially migratory. Many of the migratory moose move from low-elevation winter ranges along the Snake River to high-elevation summer ranges in the surrounding national forests and Grand Teton National Park (fig. 37). Winter ranges are characterized by riparian, mountain shrub, and aspen communities, and summer ranges include montane meadows and forested habitats. The Snake River corridor serves as a movement pathway between the southern and northern areas and provides an important riparian food resource. Migration distances range from <1 mi (<1 km) to roughly 13 mi (21 km). Despite hunting season closures and a reduction in licenses, this herd has not responded to management changes and continues to be closely monitored by regional wildlife management agencies.
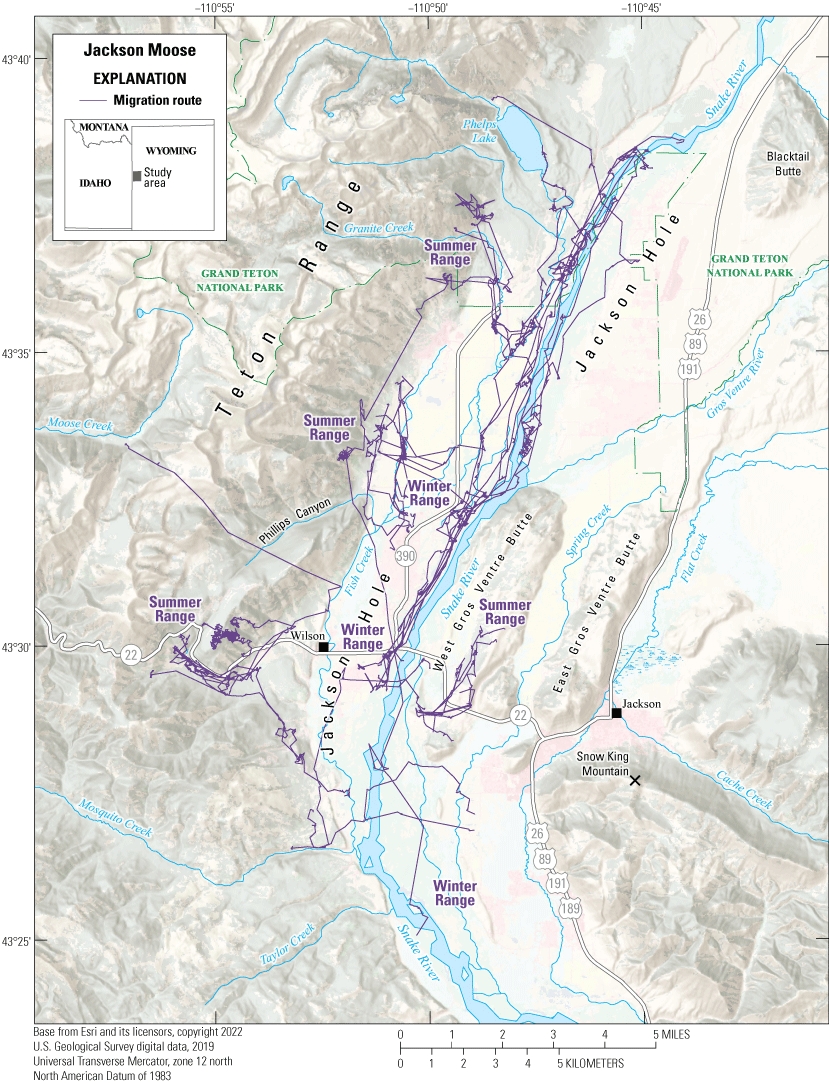
Migration routes, summer ranges, and winter ranges of the Jackson Moose herd.
Animal Capture and Data Collection
Sample size: 29 adult female moose
Relocation frequency: Approximately 0.5 hours
Project duration: 2019–22
Data Analysis
Delineation of migration periods: Net Squared Displacement (Bunnefeld and others, 2011)
Models derived from:
Corridor and Stopover Summary
Migration start and end dates (median):
Number of days migrating (mean): Migration corridor length:Other Information
Project contacts:
Data analysts:References Cited
Allen, M.L., Elbroch, L.M., and Wittmer, H.U., 2021, Can’t bear the competition—Energetic losses from kleptoparasitism by a dominant scavenger may alter foraging behaviors of an apex predator: Basic and Applied Ecology, v. 51, p. 1–10. [Also available at https://doi.org/10.1016/j.baae.2021.01.011.]
Allison, T.D., Diffendorfer, J.E., Baerwald, E.F., Beston, J.A., Drake, D., Hale, A.M., Hein, C.D., Huso, M.M., Loss, S.R., Lovich, J.E., Strickland, M.D., Williams, K.A., and Winder, V.L., 2019, Impacts to wildlife of wind energy siting and operation in the United States: Issues in Ecology, v. 21, no. 1, 24. p. [Also available at https://www.esa.org/wp-content/uploads/2019/09/Issues-in-Ecology_Fall-2019.pdf.]
Altizer, S., Bartel, R., and Han, B.A., 2011, Animal migration and infectious disease risk: Science, v. 331, p. 296–302. [Also available at https://doi.org/10.1126/science.1194694.]
Bunnefeld, N., Börger, L., van Moorter, B., Rolandsen, C.M., Dettki, H., Solberg, E.J., and Ericsson, G., 2011, A model‐driven approach to quantify migration patterns—Individual, regional and yearly differences: Journal of Animal Ecology, v. 80, no. 2, p. 466–476. [Also available at https://doi.org/10.1111/j.1365-2656.2010.01776.x.]
Bureau of Land Management [BLM], 2020, Final environmental assessment—Barren Valley Complex wild horse population management plan: Vale, Oreg., Bureau of Land Management, 148 p. [Also available at https://eplanning.blm.gov/public_projects/1504535/200363769/20019656/250025860/DOI-BLM-ORWA-V000-2019-0040_EA_BarrenValleyComplex_FINAL.pdf.]
Bureau of Land Management [BLM], 2022, BLM to conduct Beaty Butte wild horse gather: Bureau of Land Management web page, accessed February 15, 2023, at https://www.blm.gov/press-release/blm-conduct-beaty-butte-wild-horse-gather-2022.
Bureau of Land Management [BLM], 2023, Herd area and herd management area statistics: Bureau of Land Management, 24 p. [Also available at https://www.blm.gov/sites/default/files/docs/2023-04/2023_HMA-HA_PopStats_4-3-2023_Final.pdf.]
Bose, S., Forrester, T.D., Brazeal, J.L., Sacks, B.N., Casady, D.S., and Wittmer, H.U., 2017, Implications of fidelity and philopatry for the population structure of female black-tailed deer: Behavioral Ecology, v. 28, no. 4, p. 983–990. [Also available at https://doi.org/10.1093/beheco/arx047.]
Bose, S., Forrester, T.D., Casady, D.S., and Wittmer, H.U., 2018, Effect of activity states on habitat selection by black-tailed deer: The Journal of Wildlife Management, v. 82, no. 8, p. 1711–1724. [Also available at https://doi.org/10.1002/jwmg.21529.]
Caillaud, D., Craft, M.E., and Meyers, L.A., 2013, Epidemiological effects of group size variation in social species: Journal of the Royal Society Interface, v. 10, no. 83, art. 20130206, 9 p. [Also available at https://doi.org/10.1098/rsif.2013.0206.]
California Department of Fish and Wildlife, 2015, In estimation of abundance of multiple deer herds using fecal DNA North Central Region: Rancho Cordova, Calif., California Department of Fish and Wildlife Region Two, 25 p. [Also available at https://nrm.dfg.ca.gov/FileHandler.ashx?DocumentID=153177.]
California Department of Fish and Wildlife, 2022, Pronghorn seasons winding down, elk seasons opening up amid habitat, population changes impacting hunting opportunities: California Department of Fish and Wildlife news release, September 6, 2022, accessed February 1, 2023, at https://wildlife.ca.gov/News/Archive/pronghorn-seasons-winding-down-elk-seasons-opening-up-amid-habitat-population-changes-impacting-hunting-opportuni ties.
California Department of Forestry and Fire Protection, 2021, Top 20 largest California wildfires: Sacramento, Calif., California Department of Forestry and Fire Protection, 1 p. [Also available at https://34c031f8-c9fd-4018-8c5a-4159cdff6b0d-cdn-endpoint.azureedge.net/-/media/calfire-website/our-impact/fire-statistics/featured-items/top20_acres. pdf?rev=be2a6ff85932475e99d70fa9458dca79&hash=A355A978818640DFACE7993C432ABF81.]
Cotterill, G.G., Cross, P.C., Cole, E.K., Fuda, R.K., Rogerson, J.D., Scurlock, B.M., and du Toit, J.T., 2018, Winter feeding of elk in the Greater Yellowstone Ecosystem and its effects on disease dynamics: Philosophical Transactions of the Royal Society B, Biological Sciences, v. 373, no. 1745, art. 20170093, 9 p. [Also available at https://doi.org/10.1098/rstb.2017.0093.]
Cristescu, B., Bose, S., Elbroch, L.M., Allen, M.L., and Wittmer, H.U., 2019, Habitat selection when killing primary versus alternative prey species supports prey specialization in an apex predator: Journal of Zoology, v. 309, no. 4, p. 259–268. [Also available at https://doi.org/10.1111/jzo.12718.]
Cristescu, B., Elbroch, L.M., Dellinger, J.A., Binder, W., Wilmers, C.C., and Wittmer, H.U., 2022, Kill rates and associated ecological factors for an apex predator: Mammalian Biology, v. 102, no. 2, p. 291–305. [Also available at https://doi.org/10.1007/s42991-022-00240-8.]
DeVivo, M.T., Edmunds, D.R., Kauffman, M.J., Schumaker, B.A., Binfet, J., Kreeger, T.J., Richards, B.J., Schätzl, H.M., and Cornish, T.E., 2017, Endemic chronic wasting disease causes mule deer population decline in Wyoming: PLoS One, v. 12, no. 10, art. e0186512, 17 p. [Also available at https://doi.org/10.1371/journal.pone.0186512.]
Dougherty, E.R., Seidel, D.P., Carlson, C.J., Spiegel, O., and Getz, W.M., 2018, Going through the motions—Incorporating movement analyses into disease research: Ecology Letters, v. 21, no. 4, p. 588–604. [Also available at https://doi.org/10.1111/ele.12917.]
Duffield, J., and Holliman, J., 1988, The net economic value of elk hunting in Montana: Helena, Mont., Montana Department of Fish, Wildlife and Parks, 92 p. [Also available at https://archive.org/details/B55D9C76-4A8A-4A30-8711-38EDB312FA55/page/n91/mode/2up.]
Elbroch, L.M., Lendrum, P.E., Allen, M.L., and Wittmer, H.U., 2015, Nowhere to hide—Pumas, black bears, and competition refuges: Behavioral Ecology, v. 26, no. 1, p. 247–254. [Also available at https://doi.org/10.1093/beheco/aru189.]
Ewanyk, J., 2020, Habitat use and prey selection by mountain lions in an altered sagebrush steppe environment: Arcata, Calif., California State Polytechnic University, Humboldt, M.S. thesis, 86 p. [Also available at https://digitalcommons.humboldt.edu/etd/368.]
Farine, D.R., and Whitehead, H., 2015, Constructing, conducting and interpreting animal social network analysis: Journal of Animal Ecology, v. 84, no. 5, p. 1144–1163. [Also available at https://doi.org/10.1111/1365-2656.12418.]
Forrester, T.D., Casady, D.S., and Wittmer, H.U., 2015, Home sweet home—Fitness consequences of site familiarity in female black-tailed deer: Behavioral Ecology and Sociobiology, v. 69, no. 4, p. 603–612. [Also available at https://doi.org/10.1007/s00265-014-1871-z.]
Forrester, T.D., and Wittmer, H.U., 2013, A review of the population dynamics of mule deer and black‐tailed deer Odocoileus hemionus in North America: Mammal Review, v. 43, no. 4, p. 292–308. [Also available at https://doi.org/10.1111/mam.12002.]
Forrester, T.D., and Wittmer, H.U., 2019, Predator identity and forage availability affect predation risk of juvenile black-tailed deer: Wildlife Biology, v. 2019, no. 1, p. 1–12. [Also available at https://doi.org/10.2981/wlb.00510.]
Frank, D.A., and Evans, R.D., 1997, Effects of native grazers on grassland N cycling in Yellowstone National Park: Ecology, v. 78, no. 7, p. 2238–2248. [Also available at https://doi.org/10.1890/0012-9658(1997)078[2238:EONGOG]2.0.CO;2.]
Gigliotti, L.C., Xu, W., Zuckerman, G.R., Atwood, M.P., Cole, E.K., Courtemanch, A., Dewey, S., Gude, J.A., Hnilicka, P., Hurley, M., Kauffman, M., Kroetz, K., Lawson, A., Leonard, B., MacNulty, D., Maichak, E., McWhirter, D., Mong, T.W., Proffitt, K., Scurlock, B., Stahler, D., and Middleton, A.D., 2022, Wildlife migrations highlight importance of both private lands and protected areas in the Greater Yellowstone Ecosystem: Biological Conservation, v. 275, 9 p. [Also available at https://doi.org/10.1016/j.biocon.2022.109752.]
Gundlach, J.J., 2022, Mule deer responses to a pinyon-juniper removal: Reno, Nev., University of Nevada, M.S. thesis, p. 1–66. [Also available at https://scholarworks.unr.edu/bitstream/handle/11714/8283/Gundlach_unr_0139M_13840.pdf.]
Hernandez, R.R., Hoffacker, M.K., Murphy-Mariscal, M.L., Wu, G.C., and Allen, M.F., 2015, Solar energy development impacts on land cover change and protected areas: Proceedings of the National Academy of Sciences, v. 112, no. 44, p. 13579–13584. [Also available at https://doi.org/10.1073/pnas.1517656112.]
Hobbs, N.T., 1996, Modification of ecosystems by ungulates: The Journal of Wildlife Management, v. 60, no. 4, p. 695–713. [Also available at https://doi.org/10.2307/3802368.]
Horne, J.S., Garton, E.O., Krone, S.M., and Lewis, J.S., 2007, Analyzing animal movements using Brownian bridges: Ecology, v. 88, no. 9, p. 2354–2363. [Also available at https://doi.org/10.1890/06-0957.1.]
Jakes, A.F., Jones, P.F., Paige, L.C., Seidler, R.G., and Huijser, M.P., 2018, A fence runs through it—A call for greater attention to the influence of fences on wildlife and ecosystems: Biological Conservation, v. 227, p. 310–318. [Also available at https://doi.org/10.1016/j.biocon.2018.09.026.]
Kauffman, M.J., Copeland, H.E., Berg, J., Bergen, S., Cole, E., Cuzzocreo, M., Dewey, S., Fattebert, J., Gagnon, J., Gelzer, E., Geremia, C., Graves, T., Hersey, K., Hurley, M., Kaiser, J., Meacham, J., Merkle, J., Middleton, A., Nuñez, T., Oates, B., Olson, D., Olson, L., Sawyer, H., Schroeder, C., Sprague, S., Steingisser, A., and Thonhoff, M., 2020a, Ungulate migrations of the western United States, volume 1 (ver. 1.1, December 2023): U.S. Geological Survey Scientific Investigations Report 2020–5101, 119 p. [Also available at https://doi.org/10.3133/sir20205101.]
Kauffman, M.J., Copeland, H.E., Cole, E., Cuzzocreo, M., Dewey, S., Fattebert, J., Gagnon, J., Gelzer, E., Graves, T., Hersey, K., Kaiser, R., Meacham, J., Merkle, J., Middleton, A., Nuñez, T., Oates, B., Olson, D., Olson, L., Sawyer, H., Schroeder, C., Sprague, S., Steingisser, A., and Thonhoff, M., 2020b, Ungulate migrations of the western United States, volume 1: U.S. Geological Survey data release, https://doi.org/10.5066/P9O2YM6I.
Kauffman, M.J., Aikens, E.O., Esmaeili, S., Kaczensky, P., Middleton, A., Monteith, K.L., Morrison, T.A., Mueller, T., Sawyer, H., and Goheen, J.R., 2021a, Causes, consequences, and conservation of ungulate migration: Annual Review of Ecology, Evolution, and Systematics, v. 52, p. 453–478. [Also available at https://doi.org/10.1146/annurev-ecolsys-012021-011516.]
Kauffman, M.J., Cagnacci, F., Chamaillé-Jammes, S., Hebblewhite, M., Hopcraft, J.G.C., Merkle, J.A., Mueller, T., Mysterud, A., Peters, W., Roettger, C., Steingisser, A., Meacham, J.E., Abera, K., Adamczewski, J., Aikens, E.O., Bartlam-Brooks, H., Bennitt, E., Berger, J., Boyd, C., Côté, S.D., Debeffe, L., Dekrout, A.S., Dejid, N., Donadio, E., Dziba, L., Fagan, W.F., Fischer, C., Focardi, S., Fryxell, J.M., Fynn, R.W.S., Geremia, C., González, B.A., Gunn, A., Gurarie, E., Heurich, M., Hilty, J., Hurley, M., Johnson, A., Joly, K., Kaczensky, P., Kendall, C.J., Kochkarev, P., Kolpaschikov, L., Kowalczyk, R., van Langevelde, F., Li, B.V., Lobora, A.L., Loison, A., Madiri, T.H., Mallon, D., Marchand, P., Medellin, R.A., Meisingset, E., Merrill, E., Middleton, A.D., Monteith, K.L., Morjan, M., Morrison, T.A., Mumme, S., Naidoo, R., Novaro, A., Ogutu, J.O., Olson, K.A., Oteng-Yeboah, A., Ovejero, R.J.A., Owen-Smith, N., Paasivaara, A., Packer, C., Panchenko, D., Pedrotti, L., Plumptre, A.J., Rolandsen, C.M., Said, S., Salemgareyev, A., Savchenko, A., Savchenko, P., Sawyer, H., Selebatso, M., Skroch, M., Solberg, E., Stabach, J.A., Strand, O., Suitor, M.J., Tachiki, Y., Trainor, A., Tshipa, A., Virani, M.Z., Vynne, C., Ward, S., Wittemyer, G., Xu, W., and Zuther, S., 2021b, Mapping out a future for ungulate migrations: Science, v. 372, no. 6542, p. 566–569. [Also available at https://doi.org/10.1126/science.abf0998.]
Kauffman, M.J., Lowrey, B., Beck, J., Berg, J., Bergen, S., Berger, S., Cain, J., Dewey, S., Diamond, J., Duvuvuei, O., Fattebert, J., Gagnon, J., Garcia, J., Greenspan, E., Hall, E., Harper, G., Harter, S., Hersey, K., Hnilicka, P., Hurley, M., Knox, L., Lawson, A., Maichak, E., Meacham, J., Merkle, J., Middleton, A., Olson, D., Olson, L., Reddell, C., Robb, B., Rozman, G., Sawyer, H., Schroeder, C., Scurlock, B., Short, J., Sprague, S., Steingisser, A., and Tatman, N., 2022a, Ungulate migrations of the western United States, volume 2: U.S. Geological Survey Scientific Investigations Report 2022–5008, 291 p. [Also available at https://doi.org/10.3133/sir20225008.]
Kauffman, M.J., Lowrey, B., Beck, J., Berg, J., Bergen, S., Berger, J., Cain, J., Dewey, S., Diamond, J., Duvuvuei, O., Fattebert, J., Gagnon, J., Garcia, J., Greenspan, E., Hall, E., Harper, G., Harter, S., Hersey, K., Hnilicka, P., Hurley, M., Knox, L., Lawson, A., Maichak, E., Meacham, J., Merkle, J., Middleton, A., Olson, D., Olson, L., Reddell, C., Robb, B., Rozman, G., Sawyer, H., Schroeder, C., Scurlock, B., Short, J., Sprague, S., Steingisser, A., and Tatman, N., 2022b, Ungulate migrations of the western United States, volume 2: U.S. Geological Survey data release, https://doi.org/10.5066/P9TKA3L8.
Kauffman, M.J., Lowrey, B., Berg, J., Bergen, S., Brimeyer, D., Burke, P., Cufaude, T., Cain, J.W., III, Cole, J., Courtemanch, A., Cowardin, M., Cunningham, J., DeVivo, M., Diamond, J., Duvuvuei, O., Fattebert, J., Ennis, J.R., Finley, D., Fort, J., Fralick, G., Freeman, E., Gagnon, J., Garcia, J., Gelzer, E., Graham, M., Gray, J., Greenspan, E., Hall, L.E., Hendricks, C., Holland, A., Holms, B., Huggler, K., Hurley, M., Jeffreys, E., Johnson, A., Knox, L., Krasnow, K., Lockyer, Z., Manninen, H., McDonald, M., McKee, J.L., Meacham, J., Merkle, J., Moore, B., Mong, T.W., Nielsen, C., Oates, B., Olson, K., Olson, D., Olson, L., Pieron, M., Powell, J., Prince, A., Profitt, K., Reddell, C., Riginos, C., Ritson, R., Robatcek, S., Roberts, S., Sawyer, H., Schroeder, C., Shapiro, J., Simpson, N., Sprague, S., Steingisser, A., Tatman, N., Turnock, B., Wallace, C., and Wolf, L., 2022c, Ungulate migrations of the western United States, volume 3: U. S. Geological Survey Scientific Investigations Report 2022–5088, 114 p. [Also available at https://doi.org/10.3133/sir20225088.]
Kauffman, M.J., Lowrey, B., Berg, J., Bergen, S., Brimeyer, D., Burke, P., Cufaude, T., Cain, J.W., Cole, J., Courtemanch, A., Cowardin, M., Cunningham, J., DeVivo, M., Diamond, J., Duvuvuei, O., Fattebert, J., Ennis, J., Finley, D., Fort, J., Fralick, G., Freeman, I., Gagnon, J., Garcia, J., Gelzer, E., Graham, M., Gray, J., Greenspan, E., Hall, E., Hendricks, C., Holland, A., Holms, B., Huggler, K., Hurley, M., Jeffreys, E., Johnson, A., Knox, L., Krasnow, K., Lockyer, Z., Manninen, H., McDonald, M., McKee, J.L., Meacham, J., Merkle, J., Moore, B., Mong, T.W., Nielsen, C., Oates, B., Olson, K., Olson, D., Olson, L., Pieron, M., Powell, J., Prince, A., Profitt, K., Reddell, C., Riginos, C., Ritson, R., Robatcek, S., Roberts, S., Sawyer, H., Schroeder, C., Shapiro, J., Simpson, N., Sprague, S., Steingisser, A., Tatman, N., Turnock, B., Wallace, C., and Wolf, L., 2022d, Ungulate migrations of the western United States, volume 3: U.S. Geological Survey data release, https://doi.org/10.5066/P9LSKEZQ.
Kauffman, M.J., Lowrey, B., Beaupre, C., Bergen, S., Bergh, S., Blecha, K., Cain, J.W., Carl, P., Casady, D., Class, C., Courtemanch, A., Cowardin, M., Diamond, J., Dugger, K., Duvuvuei, O., Fattebert, J., Ennis, J., Flenner, M., Fort, J., Fralick, G., Freeman, I., Gagnon, J., Garcelon, D., Garrison, K., Gelzer, E., Greenspan, E., Hinojoza-Rood, V., Hnilicka, P., Holland, A., Hudgens, B., Kroger, B., Lawson, A., McKee, C., McKee, J.L., Merkle, J., Mong, T.W., Nelson, H., Oates, B., Poulin, M.-P., Reddell, C., Riginos, C., Ritson, R., Sawyer, H., Schroeder, C., Shapiro, J., Sprague, S., Steingisser, A., Stephens, S., Stringham, B., Swazo-Hinds, P.R., Tatman, N., Turnock, B., Wallace, C.F., Whittaker, D., Wise, B., Wittmer, H.U., and Wood, E., 2024, Ungulate migrations of the western United States, volume 4: U.S. Geological Survey data release, https://doi.org/10.5066/P9SS9GD9.
Lambert, M.S., Sawyer, H., and Merkle, J.A., 2022, Response to natural gas development differ by season for two migratory ungulates: Ecological Applications, v. 32, no. 7, art. e2652, 13. p. [Also available at https://doi.org/10.1002/eap.2652.]
Larson, E., Greig, C., Jenkins, J., Mayfield, E., Pascale, A., Zhang, C., Drossman, J., Williams, R., Pacala, S., Socolow, B.H.R., Baik, E.J., Birdsey, R., Duke, R., Jones, R., Leslie, E., Paustian, K., and Swan, A., 2021, Net-zero America—Potential pathways, infrastructure, and impacts—Final report: Princeton, N.J., Princeton University, 348 p.
Lounsberry, Z.T., Forrester, T.D., Olegario, M.T., Brazeal,J.L., Wittmer, H.U., and Sacks, B.N., 2015, Estimating sex-specific abundance in fawning areas of a high-density Columbian black-tailed deer population using fecal DNA: Journal of Wildlife Management, v. 79, no. 1, p. 39–49. [Also available at https://doi.org/10.1002/jwmg.817.]
Lubeck, M., 2020, Chronic wasting disease—Can science save our dear deer?: U.S. Geological Survey [featured story], December 28, 2020, accessed February 28, 2023, at https://www.usgs.gov/news/featured-story/chronic-wasting-disease-can-science-save-our-dear-deer.
Marescot, L., Forrester, T.D., Casady, D.S., and Wittmer, H.U., 2015, Using multistate capture-mark-recapture models to quantify effects of predation on age-specific survival and population growth in black-tailed deer: Population Ecology, v. 57, no. 1, p. 185–197. [Also available at https://doi.org/10.1007/s10144-014-0456-z.]
Martin, D., 2019, Antelope hindered by solar farm: Green River Star, December 4, 2019, accessed February 2, 2023, at https://www.greenriverstar.com/story/2019/12/04/county/antelope-hindered-by-solar-farm/6818.html.
Merkle, J.A., Cross, P.C., Scurlock, B.M., Cole, E.K., Courtemanch, A.B., Dewey, S.R., and Kauffman, M.J., 2018, Linking spring phenology with mechanistic models of host movement to predict disease transmission risk: Journal of Applied Ecology, v. 55, no. 2, p. 810–819. [Also available at https://doi.org/10.1111/1365-2664.13022.]
Merkle, J.A., Gage, J., Sawyer, H., Lowrey, B., and Kauffman, M.J., 2022, Migration mapper—Identifying movement corridors and seasonal ranges for large mammal conservation: Methods in Ecology and Evolution, v. 13, no. 11, p. 2397–2403. [Also available at https://doi.org/10.1111/2041-210X.13976.]
Merkle, J.A., Lowrey, B., Wallace, C., Hall, L.E., Wilde, L., Kauffman, M.J., and Sawyer, H., 2023, Conserving habitat for migratory ungulates—How wide is a migration corridor?: Journal of Applied Ecology, v. 60, no. 9, p. 1763–1770. [Also available at https://doi.org/10.1111/1365-2664.14473.]
Middleton, A.D., Sawyer, H., Merkle, J.A., Kauffman, M.J., Cole, E.K., Dewey, S.R., Gude, J.A., Gustine, D.D., McWhirter, D.E., Proffitt, K.M., and White, P.J., 2020, Conserving transboundary wildlife migrations—Recent insights from the Greater Yellowstone Ecosystem: Frontiers in Ecology and the Environment, v. 18, no. 2, p. 83–91. [Also available at https://doi.org/10.1002/fee.2145.]
Milligan, M.C., Johnston, A.N., Beck, J.L., Smith, K.T., Taylor, K.L., Hall, E., Knox, L., Cufaude, T., Wallace, C., Chong, G., and Kauffman, M.J., 2021, Variable effects of wind‐energy development on seasonal habitat selection of pronghorn: Ecosphere, v. 12, no. 12, art. e03850, 19 p. [Also available at https://doi.org/10.1002/ecs2.3850.]
Milligan, M.C., Johnston, A.N., Beck, J.L., Taylor, K.L., Hall, E., Knox, L., Cufaude, T., Wallace, C., Chong, G., and Kauffman, M.J., 2023, Wind‐energy development alters pronghorn migration at multiple scales: Ecology and Evolution, v. 13, no. 1, art. e9687, 12 p. [Also available at https://doi.org/10.1002/ece3.9687.]
Milner-Gulland, E.J., Fryxell, J.M. and Sinclair, A.R., eds., 2011, Animal migration—A synthesis: Oxford, United Kingdom, Oxford University Press, 304 p. [Also available at https://doi.org/10.1093/acprof:oso/9780199568994.001.0001.]
Monello, R.J., Powers, J.G., Hobbs, N.T., Spraker, T.R., Watry, M.K., and Wild, M.A., 2014, Survival and population growth of a free‐ranging elk population with a long history of exposure to chronic wasting disease: The Journal of Wildlife Management, v. 78, no. 2, p.214–223. [Also available at https://doi.org/10.1002/jwmg.665.]
Morano, S., Stewart, K.M., Dilts, T., Ellsworth, A., and Bleich, V.C., 2019, Resource selection of mule deer in a shrub-steppe ecosystem—Influence of woodland distribution and animal behavior: Ecosphere, v. 10, no. 11, art. e02811, 23 p. [Also available at https://doi.org/10.1002/ecs2.2811.]
Nickerson, G., 2019, Managing game on the Wind River Reservation: WyoHistory.org, January 22, 2019, accessed February 9, 2023, at https://www.wyohistory.org/encyclopedia/managing-game-wind-river-reservation.
Nikonow, H., 2023, Wind River restoration—Cooperative effort puts funding to work against cheatgrass: Partnering to Conserve Sagebrush Rangelands, February 16, 2023, accessed August 31, 2023, at https://www.partnersinthesage.com/blog/2023/wind-river-cooperative-work-against-cheatgrass.
Nunn, C.L., Jordán, F., McCabe, C.M., Verdolin, J.L. and Fewell, J.H., 2015, Infectious disease and group size—More than just a numbers game: Philosophical Transactions of the Royal Society B, Biological Sciences, v. 370, no. 1669, art. 20140111, 11 p. [Also available at https://doi.org/10.1098/rstb.2014.0111.]
Oregon Department of Fish and Wildlife [ODFW], 2011, Oregon mule deer initiative: Salem, Oreg., Oregon Department of Fish and Wildlife, 128 p. [Also available at https://www.dfw.state.or.us/resources/hunting/big_game/mule_deer/docs/Mule_Deer_Mgmt_Plan_Final.pdf.]
Oregon Department of Fish and Wildlife [ODFW], 2015, Oregon mule deer initiative—5 year summary 2010–2014: Salem, Oreg., Oregon Department of Fish and Wildlife, 87 p. [Also available at https://www.dfw.state.or.us/resources/hunting/big_game/mule_deer/docs/Oregon%20Mule%20Deer%20Initiative%205%20Year%20Summary%202010%20-%202014%2026Jan 15.pdf.]
Oregon Department of Fish and Wildlife [ODFW], 2020, Oregon mule deer initiative—Five year summary 2015–2019: Salem, Oreg., Oregon Department of Fish and Wildlife, 40 p. [Also available at https://www.dfw.state.or.us/resources/hunting/big_game/mule_deer/docs/Oregon%20Mule%20Deer%20Initiative%2015-19%20July%202021.pdf.]
Oregon Department of Fish and Wildlife [ODFW], 2021, Mule deer population estimates, herd composition, and over-winter fawn survival in Oregon 2017–2021: Salem, Oreg., Oregon Department of Fish and Wildlife, 2 p. [Also available at https://www.dfw.state.or.us/resources/hunting/big_game/controlled_hunts/docs/hunt_statistics/21/Mule%20Deer%20Population%20Estimates,%20Composition,%2 0and%20Over-Winter%20Fawn%20Survival%202017%20-%202021.pdf.]
Peek, J.M., Dennis, B., and Hershey, T., 2002, Predicting population trends of mule deer: The Journal of Wildlife Management, v. 66, no. 3, p. 729–736. [Also available at https://doi.org/10.2307/3803138.]
Robb, B.S., Merkle, J.A., Sawyer, H., Beck, J.L., and Kauffman, M.J., 2022, Nowhere to run—Semi-permeable barriers affect pronghorn space use: The Journal of Wildlife Management, v. 86, no. 4, art. e22212, 20 p. [Also available at https://doi.org/10.1002/jwmg.22212.]
Sawyer, H., Kauffman, M.J., Nielson, R.M., and Horne, J.S., 2009, Identifying and prioritizing ungulate migration routes for landscape-level conservation: Ecological Applications, v. 19, no. 8, p. 2016–2025. [Also available at https://doi.org/10.1890/08-2034.1.]
Sawyer, H., Kauffman, M.J., Middleton, A.D., Morrison, T.A., Nielson, R.M., and Wyckoff, T.B., 2013, A framework for understanding semi-permeable barrier effects on migratory ungulates: Journal of Applied Ecology, v. 50, no. 1, p. 68–78. [Also available at https://doi.org/10.1111/1365-2664.12013.]
Sawyer, H., Sandoval Lambert, M., Merkle, J.A., 2020, Migratory disturbance thresholds with mule deer and energy development: The Journal of Wildlife Management, v. 84, no. 5, p. 930–937. [Also available at https://doi.org/10.1002/jwmg.21847.]
Sawyer, H., Korfanta, N.M., Kauffman, M.J., Robb, B.S., Telander, A.C., and Mattson, T., 2022, Trade‐offs between utility‐scale solar development and ungulates on western rangelands: Frontiers in Ecology and the Environment, v. 20, no. 6, p. 345–351. [Also available at https://doi.org/10.1002/fee.2498.]
Semple, S., Cowlishaw, G., and Bennett, P.M., 2002, Immune system evolution among anthropoid primates—Parasites, injuries and predators: Proceedings of the Royal Society B, Biological Sciences, v. 269, no. 1495, p. 1031–1037. [Also available at https://doi.org/10.1098/rspb.2001.1950.]
Smith, K.T., Taylor, K.L., Albeke, S.E., and Beck, J.L., 2020, Pronghorn winter resource selection before and after wind energy development in south-central Wyoming: Rangeland Ecology & Management, v. 73, no. 2, p. 227–233. [Also available at https://doi.org/10.1016/j.rama.2019.12.004.]
Uehlinger, F.D., Johnston, A.C., Bollinger, T.K., and Waldner, C.L., 2016, Systematic review of management strategies to control chronic wasting disease in wild deer populations in North America: BMC veterinary research, v. 12, no. 173, 16 p. [Also available at https://doi.org/10.1186/s12917-016-0804-7.]
Utah Department of Transportation, 2023, Traffic statistics—available reports—AADT history: Utah Department of Transportation website, accessed February 17, 2023, at https://udot.utah.gov/connect/business/traffic-data/traffic-statistics/.
Utah Division of Wildlife Resources, 2023, Migration corridors—Mapping migration corridors: Utah Wildlife Migration Initiative web page, accessed February 15, 2023, at https://wildlifemigration.utah.gov/land-animals/corridors/.
U.S. Department of Agriculture Forest Service [FS], 2009, Murderers Creek wild horse territory/herd management area management plan: U.S. Department of Agriculture Forest Service, 36 p. [Also available at https://www.fs.usda.gov/Internet/FSE_DOCUMENTS/fsbdev3_033478.pdf.]
U.S. Department of the Interior, 2018, Improving habitat quality in western big game winter range and migration corridors: U.S. Department of the Interior, Secretarial Order No. 3362, accessed January 9, 2014, at https://www.doi.gov/sites/doi.gov/files/uploads/so_3362_migration.pdf.
U.S. Department of the Interior, 2022, Secretary Haaland announces new steps to accelerate solar energy development on public lands in the west: U.S. Department of the Interior press release, December 12, 2022, accessed February 22, 2023, at https://www.doi.gov/pressreleases/secretary-haaland-announces-new-steps-accelerate-solar-energy-development-public-lands.
Wilson, K., Knell, R., Boots, M., and Koch-Osborne, J., 2003, Group living and investment in immune defence—An interspecific analysis: Journal of Animal Ecology, v. 72, no. 1. p. 133–143. [Also available at https://doi.org/10.1046/j.1365-2656.2003.00680.x.]
Wind River Tribal Court, 2004, Title XVI fish and game code, 32 p., accessed August 31, 2023, at https://www.wrtribalcourt.com/wp-content/uploads/2022/02/Title-16-Fish-and-Game-Code.pdf.
Wind River Visitors Council, 2022, Wind River country petroglyphs: Wind River Visitors Council, June 20, 2022, accessed August 31, 2023, at https://windriver.org/wind-river-country-petroglyphs/.
Wiser, R., Bolinger, M., Hoen, B., Millstein, D., Rand, J., Barbose, G., Darghouth, N., Gorman, W., Jeong, S., Paulos, B., 2022, Land-based wind market report—2022 edition: Oak Ridge, Tenn., U.S. Department of Energy, Office of Energy Efficiency & Renewable Energy, Wind Energy Technologies Office, prepared by Lawrence Berkeley National Laboratory, 74 p. [Also available at https://doi.org/10.2172/1893263.]
Wyckoff, T.B., Sawyer, H., Albeke, S.E., Garman, S.L., and Kauffman, M.J., 2018, Evaluating the influence of energy and residential development on the migratory behavior of mule deer: Ecosphere, v. 9, no. 2, art. e02113, 13 p. [Also available at https://doi.org/10.1002/ecs2.2113.]
Wyoming Game and Fish Department, 2022a, 2021 chronic wasting disease surveillance report: Cheyenne, Wyo., Wyoming Game and Fish Department, 8 p. [Also available at https://wgfd.wyo.gov/WGFD/media/content/PDF/Vet%20Services/2021-CWD-Surveillance-Report-final-updated-041822_1.pdf.]
Wyoming Game and Fish Department, 2022b, Jackson moose job completion report evaluation form: Wyoming Game and Fish Department web page, accessed February 9, 2023, at https://wgfd.wyo.gov/WGFD/media/content/Hunting/Jackson_JCR_2021_Final.pdf.
Appendix 1. Methods
Corridors and Stopovers
Extracting and Mapping Migration Sequences
To identify spring and fall migration start and end dates for each individual in a given year, we visually inspected the Net Squared Displacement (NSD) curve (Bunnefeld and others, 2011; Bastille-Rousseau and others, 2016) alongside digital maps of the individual’s movement trajectory in the Migration Mapper application (Merkle and others, 2022). The NSD curve represents the square of the straight-line distance between any global positioning system (GPS) location of an animal’s movement trajectory and a location in the animal’s winter or summer range. Users defined this point separately for each herd based on the start of a biological year, which ranged between January 1 and March 31.
When an animal stays in a defined home range, the NSD varies little during the course of a year. However, when an animal migrates away from its winter range, the NSD of each successive location increases until the animal settles in its summer range (fig. 1.1A, B, C). The days with clear breakpoints in the NSD curves represent the start and end dates for migration and were used to identify the sequential GPS locations for spring and fall migration (in other words, the migration sequences). Migration routes were mapped by joining successive GPS locations with a straight line in each migration sequence.
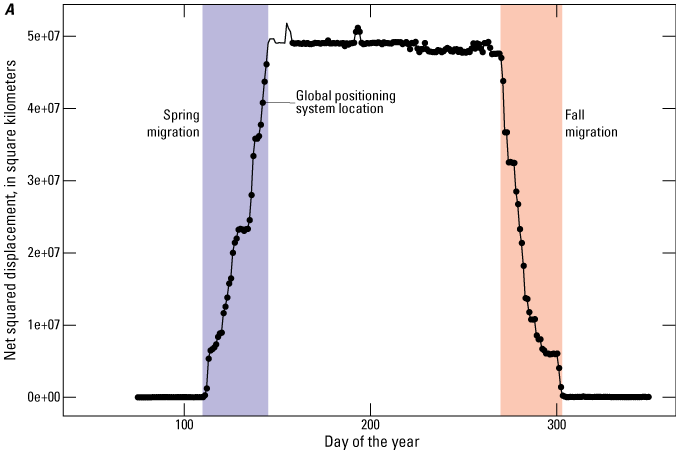
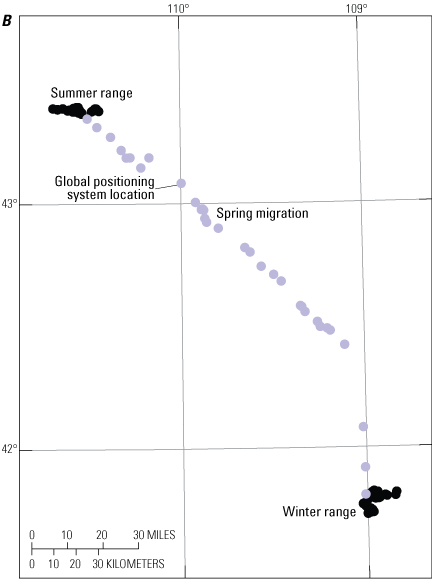

Example of Net Squared Displacement (NSD) analysis to identify migration sequences A, breakpoints in the NSD curve provide the start and end dates for the spring migration when an animal migrates from the winter range to the summer range; the fall migration is shown when an animal leaves its summer range to return to the winter range; B, the corresponding global positioning system (GPS) locations are highlighted on the map insets for the spring migration; C, the GPS locations are highlighted on the map insets for the fall migration. For ease of readability, only one GPS location per day is shown. [e+, e-notation]
Calculating Probability of Use with Brownian Bridge Movement Models
Once migration sequences were extracted for each individual in a given year, we used a Brownian bridge movement model (BBMM; Horne and others, 2007) to estimate a utilization distribution (UD) representing the probability of use during migration. The UD produced from the BBMM provides a probability surface, or heat map, of the area used in each migration sequence. Additionally, the outer bounds of the UD provide estimated widths of the movement path around the straight line between an animal’s two successive locations. Together, the heat map and boundary of the UD can be used to identify migration corridors (Sawyer and others, 2009) and the stopover sites where animals spend extended time foraging along their migration route (Sawyer and Kauffman, 2011).
To generate the heat map for each migration sequence, we used the BBMM to estimate a UD with a grid resolution of 164 feet (50 meters). When GPS collars failed to record a location at a given time and breaks in the sequential data exceeded an 8–14-hour time lag, we did not build a bridge between the two locations encompassing the break. A key parameter of the BBMM is the Brownian motion variance (BMV), which provides an index of the mobility, or speed of movement, of the animal under observation (Horne and others, 2007). An empirical estimate of the BMV was obtained for each migration sequence following the methods of Horne and others (2007). We did not include migration sequences with a BMV greater than or equal to 1.98 acres (8,000 square meters [m2]) because large BMV values poorly represented the observed migration trajectory.
Variations of the BBMM Method—Sparse Data and Fixed Motion Variance
When location data are sparse (in other words, when there is a long time interval between GPS locations), the BBMM performs poorly because of the increased uncertainty in the movement path between two successive GPS locations. Such uncertainty tends to overestimate the corridor width and area (Horne and others, 2007; Benhamou, 2011). To facilitate corridor analyses of migration sequences collected with low relocations rates (in other words, fix rates), we sometimes used the alternative Fixed Motion Variance method, in which we set the BMV at specific levels when estimating the UDs for each migration sequence (Kauffman and others, 2020; Julien Fattebert, Ecotec Environment, unpub. data, 2023). For herds with sparse sampling data, we set the BMV between 0.15 and 0.40 acres (600 and 1,600 m2, respectively) for Cervus canadensis (elk) and Antilocapra americana (pronghorn) and between 0.10 and 0.30 acres (400 and 1,200 m2, respectively) for Odocoileus hemionus (mule deer; Julien Fattebert, Ecotec Environment, unpub. data, 2023).
In most cases, traditional BBMM methods were used to estimate corridors and stopovers. However, when there were significant amounts of missing data in the migration sequences, corridors were calculated using Fixed Motion Variance techniques if they improved delineation as observed through a visual comparison of maps from the two methods. When fix rates were highly variable among individuals in a herd, BBMM and Fixed Motion Variance methods were used to construct individual UDs. In general, by bridging gaps in the probability surface created by missing GPS locations, Fixed Motion Variance provided a modeled corridor that more closely matched data with frequent relocations (for example, a 2-hour fix rate; Julien Fattebert, Ecotec Environment, unpub. data, 2023). In most of these cases, a 14-hour time lag was allowed; a 27-hour or 48-hour time lag was allowed only when it provided more complete migration corridors compared to using a 14-hour time lag.
Calculating Population-Level Corridors and Stopovers
We applied a three-step process to calculate population-level corridors and to identify stopovers; the process generally followed the methods developed by Sawyer and others (2009). First, we averaged the UDs for a given individual’s spring and fall migration sequences across all years to produce a single, individual-level migration UD. We rescaled this mean UD to sum to one. Second, we defined a migration footprint for each individual as the 99-percent isopleth of its UD. We then stacked all the individual footprints for a given population, which provided a raster representing the number of animals that used each grid cell during migration. Next, we defined different levels of corridor use based on the proportion of the collared migrants in the population for a given grid cell. For most herds, we then defined low use corridors as areas traversed by at least one collared individual during migration, medium use corridors as areas used by 10–20 percent of the collared individuals, and high use corridors as areas used by more than 20 percent of the collared individuals in the population. These corridors were converted from a grid-based format to a polygon format and then isolated-use polygons of less than 4.94 acres (20,000 m2) were removed. Finally, to calculate stopover use, we averaged all the individual-level UDs to produce a single population-level UD, rescaled to sum to one. Stopovers were defined as the areas representing the highest 10 percent of use from the mean population-level UD. As with the corridors, we then converted stopovers from a grid-based format to a polygon format and removed isolated-use polygons of less than 4.94 acres (20,000 m2). The resulting population-level corridors are referred to as “corridors” or “footprints,” depending on the preference of individual States and Tribes.
Variations of the Method to Calculate Population-Level Corridors
The simplest method for delineating migratory corridors was the line buffer approach (Merkle and others, 2023). For this method, we simply buffered the migration lines (lines connecting sequential GPS locations) by a specified distance (for example, 820 feet [250 meters]) and then used the general methods in the “Calculating Population-Level Corridors and Stopovers” section to determine low, medium, and high use areas. The line buffer method serves as a useful alternative to the BBMM methods because it (1) ensures individual routes are the same width and do not vary extensively, (2) ensures population-level routes have full connectivity between seasonal ranges (in other words, no broken segments or large blobs are produced), (3) easily accommodates variable GPS fix rates, and (4) requires little computing power.
Most maps in this report display low, medium, and high use corridors or routes. However, some individual State and Tribal contributors adapted methods to best suit their management purposes or accommodate the limitations posed by varying sample sizes among herds. The “Data Analysis” section of the page-pair text accompanying each herd provides additional, herd-specific details when analysts deviated from the general methods presented herein, for example, when different definitions were used to define the migration corridor or route use levels.
Estimating a Population’s Winter Range
To estimate a population’s winter range, we generally followed the same methods used to calculate migration stopover sites but had some exceptions. First, instead of migration sequences, we isolated winter sequences of GPS locations. For each year, we calculated a standard date for the start and end of winter, and based on the preference of individual States and Tribes, we applied one of three options to calculate winter range dates: (1) for each year, we calculated the start of winter as the 95th percent quantile of the end dates of all fall migrations and the end of winter as the 5th percent quantile of the start dates of all spring migrations, (2) we defined winter as the dates between the end of fall migration and the start of spring migration for each individual, or (3) we defined a fixed date range using local expert knowledge for a given herd (for example, December 15–March 15). We discarded winter sequences that spanned fewer than 30 days. Following the methods for migration stopovers, we calculated a population-level UD of winter use and identified the core winter range using the 50-percent isopleth. The “Data Analysis” section for the corresponding herd summaries in this report provided additional herd-specific details regarding winter ranges.
Estimating a Population’s Annual Range
To estimate a population’s annual range, we generally followed the same methods used to calculate migration stopover sites or winter range but had some exceptions. First, we isolated annual movement sequences for each individual. These movement sequences were defined as movements longer than 275 days (200 days for California) in a calendar year, beginning at the time of GPS collar deployment. Start dates were similar because GPS collars were deployed in batches around the same dates. End dates varied depending on individual mortalities. Following the methods for migration corridors, we calculated a population-level UD of annual use and identified the core annual range using isopleth values (for example, 50 and 90 percent contours) selected based on local expert knowledge for a given herd. The “Data Analysis” section for the corresponding herd summaries in this report provided additional herd-specific details regarding annual ranges.
Herd Summary Statistics
In addition to the map for each herd, a number of summary statistics described the project and associated data. In the “Animal Capture and Data Collection” section for the corresponding herd summaries in this report, sample size was defined as the number of collared individuals, inclusive of residents and migrants, relocation frequency was determined by local researchers and varied in and among herds, and the project duration was defined using the year of the first and last GPS location included in the analyses. In the “Data Analysis” section for the corresponding herd summaries in this report, we provided the number of migration sequences and individuals used in the respective analysis. These numbers accounted for sequences that failed to fit a BBMM and were not included in the delineation of the migration corridor or seasonal range. In the “Corridor and Stopover Summary” section for the corresponding herd summaries in this report, we included the median start and end dates for the spring and fall migrations and the average duration of each migration period in days. Additionally, we defined the migration length as the maximum distance between any two points in a spring or fall migration sequence. These methods helped to avoid overestimating migration distances, which can be inflated when calculated as the sum of all step lengths in a sequence because of including distances traveled when foraging at a stopover. The “Corridor and Stopover Summary” section for the corresponding herd summaries in this report also included the areas of migration corridors and stopovers.
References Cited
Bastille-Rousseau, G., Potts, J.R., Yackulic, C.B., Frair, J.L., Ellington, E.H., and Blake, S., 2016, Flexible characterization of animal movement pattern using net squared displacement and a latent state model: Movement Ecology, v. 4, no. 1, 12 p. [Also available at https://doi.org/10.1186/s40462-016-0080-y.]
Benhamou, S., 2011, Dynamic approach to space and habitat use based on biased random bridges: PLoS One, v. 6, no. 1, art. e14592, 8 p. [Also available at https://doi.org/10.1371/journal.pone.0014592.]
Bunnefeld, N., Börger, L., van Moorter, B., Rolandsen, C.M., Dettki, H., Solberg, E.J., and Ericsson, G., 2011, A model‐driven approach to quantify migration patterns—Individual, regional and yearly differences: Journal of Animal Ecology, v. 80, no. 2, p. 466–476. [Also available at https://doi.org/10.1111/j.1365-2656.2010.01776.x.]
Horne, J.S., Garton, E.O., Krone, S.M., and Lewis, J.S., 2007, Analyzing animal movements using Brownian bridges: Ecology, v. 88, no. 9, p. 2354–2363. [Also available at https://doi.org/10.1890/06-0957.1.]
Kauffman, M.J., Copeland, H.E., Berg, J., Bergen, S., Cole, E., Cuzzocreo, M., Dewey, S., Fattebert, J., Gagnon, J., Gelzer, E., Geremia, C., Graves, T., Hersey, K., Hurley, M., Kaiser, J., Meacham, J., Merkle, J., Middleton, A., Nuñez, T., Oates, B., Olson, D., Olson, L., Sawyer, H., Schroeder, C., Sprague, S., Steingisser, A., and Thonhoff, M., 2020, Ungulate migrations of the western United States, volume 1 (ver. 1.1, December 2023): U.S. Geological Survey Scientific Investigations Report 2020–5101, 119 p. [Also available at https://doi.org/10.3133/sir20205101.]
Merkle, J.A., Gage, J., Sawyer, H., Lowrey, B., and Kauffman, M.J., 2022, Migration mapper—Identifying movement corridors and seasonal ranges for large mammal conservation: Methods in Ecology and Evolution, v. 13, no. 11, p. 2397–2403. [Also available at https://doi.org/10.1111/2041-210X.13976.]
Merkle, J., Lowrey, B., Wallace, C.F., Hall, L.E., Wilde, L., Kauffman, M.J., and Sawyer, H., 2023, Conserving habitat for migratory ungulates—How wide is a migration corridor?: Journal of Applied Ecology, v. 60, no. 9, p. 1763–1770. [Also available at https://doi.org/10.1111/1365-2664.14473.]
Sawyer, H., Kauffman, M.J., Nielson, R.M., and Horne, J.S., 2009, Identifying and prioritizing ungulate migration routes for landscape-level conservation: Ecological Applications, v. 19, no. 8, p. 2016–2025. [Also available at https://doi.org/10.1890/08-2034.1.]
Sawyer, H., and Kauffman, M.J., 2011, Stopover ecology of a migratory ungulate: Journal of Animal Ecology, v. 80, no. 5, p. 1078–1087. [Also available at https://doi.org/10.1111/j.1365-2656.2011.01845.x.]
Conversion Factors
U.S. customary units to International System of Units
Datum
Vertical coordinate information is referenced to the North American Vertical Datum of 1988 (NAVD 88).
Horizontal coordinate information is referenced to North American Datum of 1983 (NAD 83).
Abbreviations
<
less than
>
greater than
AADT
average annual daily traffic
BBMM
Brownian bridge movement model
BLM
Bureau of Land Management
BMV
Brownian motion variance
CMT
Corridor Mapping Team
CWD
chronic wasting disease
DNA
deoxyribonucleic acid
FS
U.S. Department of Agriculture Forest Service
GPS
global positioning system
GYE
Greater Yellowstone Ecosystem
HMA
Herd Management Area
NSD
Net Squared Displacement
ODFW
Oregon Department of Fish and Wildlife
UD
utilization distribution
USGS
U.S. Geological Survey
WMU
Wildlife Management Unit
WVC
wildlife-vehicle collisions
Publishing support provided by the Science Publishing Network, Denver Publishing Service Center
For more information concerning the research in this report, contact the Associate Director Ecosystems Mission Area
U.S. Geological Survey
Mail Stop 300
12201 Sunrise Valley Drive
Reston, VA 20192
Disclaimers
Any use of trade, firm, or product names is for descriptive purposes only and does not imply endorsement by the U.S. Government.
Although this information product, for the most part, is in the public domain, it also may contain copyrighted materials as noted in the text. Permission to reproduce copyrighted items must be secured from the copyright owner.
Suggested Citation
Kauffman, M., Lowrey, B., Beaupre, C., Bergen, S., Bergh, S., Blecha, K., Bundick, S., Burkett, H., Cain, J.W., III, Carl, P., Casady, D., Class, C., Courtemanch, A., Cowardin, M., Diamond, J., Dugger, K., Duvuvuei, O., Ennis, J.R., Flenner, M., Fort, J., Fralick, G., Freeman, I., Gagnon, J., Garcelon, D., Garrison, K., Gelzer, E., Greenspan, E., Hinojoza-Rood, V., Hnilicka, P., Holland, A., Hudgens, B., Kroger, B., Lawson, A., McKee, C., McKee, J.L., Merkle, J.R., Mong, T.W., Nelson, H., Oates, B., Poulin, M.-P., Reddell, C., Ritson, R., Sawyer, H., Schroeder, C., Shapiro, J., Sprague, S., Steiner, E., Steingisser, A., Stephens, S., Stringham, B., Swazo-Hinds, P.R., Tatman, N., Wallace, C.F., Whittaker, D., Wise, B., Wittmer, H.U., and Wood, E., 2024, Ungulate migrations of the Western United States, volume 4: U.S. Geological Survey Scientific Investigations Report 2024–5006, 86 p., 1 pl., https://doi.org/10.3133/sir20245006.
ISSN: 2328-0328 (online)
ISSN: 2328-031X (print)
Study Area
| Publication type | Report |
|---|---|
| Publication Subtype | USGS Numbered Series |
| Title | Ungulate migrations of the Western United States, volume 4 |
| Series title | Scientific Investigations Report |
| Series number | 2024-5006 |
| ISBN | 978-1-4113-4545-4 |
| DOI | 10.3133/sir20245006 |
| Publication Date | April 11, 2024 |
| Year Published | 2024 |
| Language | English |
| Publisher | U.S. Geological Survey |
| Publisher location | Reston VA |
| Contributing office(s) | Coop Res Unit Seattle, Northern Rocky Mountain Science Center |
| Description | Report: xv, 86 p.; 1 Plate: 39.95 x 42.46 inches; Data Release |
| Country | United States |
| State | Arizona, California, Colorado, New Mexico, Nevada, Oregon, Utah, Washington, Wyoming |
| Other Geospatial | western United States |
| Online Only (Y/N) | N |