

Assessment of Nutrient Load Estimation Approaches for Small Urban Streams in Durham, North Carolina
Links
- Document: Report (4.15 MB pdf) , HTML , XML
- Data Releases:
- USGS Data Release - Datasets for assessment of nutrient load estimation approaches for small urban streams in Durham, North Carolina, 2009–2020
- USGS water data for the Nation - USGS NWIS database
- Database: Water quality data web portal - City of Durham: City of Durham database
- NGMDB Index Page: National Geologic Map Database Index Page (html)
- Download citation as: RIS | Dublin Core
Acknowledgments
The authors thank Michelle Woolfolk and Susan Gale of the City of Durham Public Works Department, Stormwater Division, for their support and assistance with this project.
The authors also would like to express sincere gratitude to Ryan Rasmussen, Jessica Diaz, and William Hamilton at the U.S. Geological Survey for their invaluable assistance in water-quality sample collections and data processing support.
Abstract
This cooperative study between the City of Durham Public Works Department, Stormwater Division and U.S. Geological Survey evaluated whether alternate monitoring strategies that incorporated samples collected across an increased range of streamflows would improve nutrient load estimates for Ellerbe and Sandy Creeks, two small, highly urbanized streams in the City of Durham, North Carolina. Water-quality and streamflow data collected between January 2009 and December 2020 were used to develop instream nutrient-load models using the U.S. Geological Survey R-LOADEST program. This study compared model results from two sampling scenarios: routine monthly (fixed frequency) sampling combined with targeted high-streamflow sampling (scenario A), and fixed frequency sampling only (scenario B).
Calibration diagnostic results were used to select the final, or most optimal, models. Most final models included seasonality terms to compensate for intra-annual variability in the data. Storm-runoff samples provided better definition at higher streamflows and improved the overall concentration versus flow relations for all constituents, except nitrate + nitrite. Uncertainties in the nutrient load estimates were lower and less variable for the scenario A tests compared to the scenario B tests.
Five time steps representing 12-, 9-, 7-, 6-, and 5-year subsets of the overall dataset were used to examine the effect of prediction period length on the computed loads and uncertainties. In focusing on the scenario A results, nutrient loads tended to be higher for the shorter time steps. These shorter time steps also produced higher errors, or uncertainty, in the load estimates compared to longer time steps. Evaluations of annual nutrient loads during 2016–20 indicated that the most consistent load estimates and tightest confidence intervals were obtained for longer 12- and 9-year time steps. Estimated loads were more variable and uncertain when based on the shorter 6- and 5-year time steps. The degree of uncertainty (standard error of prediction) in the nutrient load estimation results was influenced by sampling approach, calibration time step, and hydrologic characteristics during the model period of interest.
Introduction
The City of Durham is part of the Triangle area of North Carolina that also includes the cities of Raleigh, Cary, and Chapel Hill; Research Triangle Park; and the surrounding communities. Ongoing growth in the Triangle area continues to increase the demand for local water supplies. The population of Durham grew by 19.5 percent to nearly 283,500 people between 2010 and 2020 (U.S. Census Bureau, 2020). Increased urbanization associated with population growth brings landscape changes that are likely to alter area hydrology and inputs of nutrients, sediment, and other water-quality constituents to lakes and rivers used as sources of drinking water.
The City of Durham lies within the watersheds of Falls Lake and Jordan Lake, which are located in the upper Neuse and upper Cape Fear River Basins, respectively, and in the Piedmont physiographic province (fig. 1). Both lakes serve as public water supplies and are classified as “impaired” because of high levels of chlorophyll-a, indicative of nutrient overenrichment (North Carolina Department of Environmental Quality, 2020). Nutrient sensitive water management strategies have been implemented for the Falls Lake watershed (North Carolina Department of Environmental Quality, 2011) and Jordan Lake watershed (North Carolina Department of Environmental Quality, 2009), which are designed to reduce nitrogen (N) and phosphorus (P) contributions from point sources (such as municipal and industrial wastewater discharges) and nonpoint sources (such as urban runoff and agriculture).
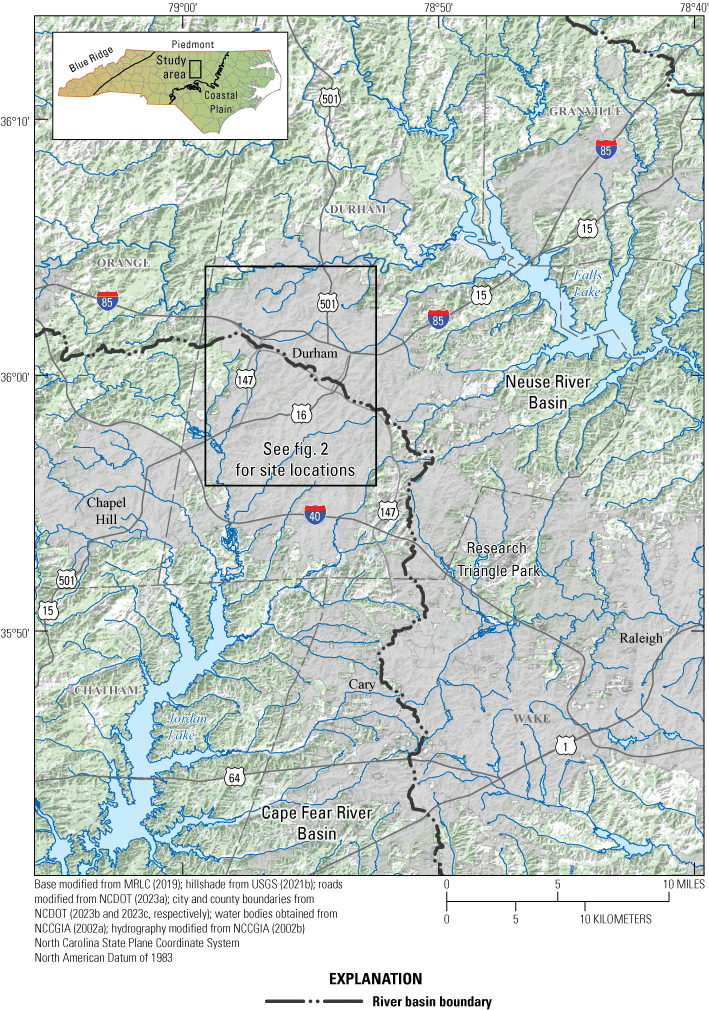
Durham study area and associated physiographic provinces in the upper Neuse and upper Cape Fear River Basins, North Carolina.
As part of the City of Durham Public Works Department, the Stormwater Division (hereafter abbreviated “DSS” for Durham Stormwater Services) is responsible for operating the city’s water-quality monitoring program as part of their National Pollutant Discharge Elimination System (NPDES) permit requirements (City of Durham Public Works Department, 2019) and long-term stormwater management plan (City of Durham Public Works Department, 2023). One main goal of the monitoring program is to help detect and eliminate the illicit discharge, or disposal, of any substances other than stormwater into the stormwater system that ultimately are conveyed to nearby streams. Another goal is to evaluate the effectiveness of best management practices (BMPs) implemented by the city to reduce nutrient inputs from stormwater runoff in the Falls Lake and Jordan Lake watersheds. To track progress toward reducing nutrient inputs, DSS has collected routine monthly grab samples for nutrient analyses at urban stream sites throughout Durham since 2004. Resulting data are used to compute annual loads of ammonia plus (+) organic nitrogen (also referred to as “total Kjeldahl nitrogen” [TKN]), nitrate + nitrite, total N, and total P. Fixed-interval sampling is used in many monitoring programs to document the concentrations of water-quality constituents in streams, but, over shorter time periods, these data may not represent the full range of environmental conditions necessary for determining reliable constituent loads (Robertson and Roerish, 1999; Guo and others, 2002; Robertson, 2003; Ullrich and Volk, 2010; Stenback and others, 2011).
The current water-quality monitoring and load computation approaches used by DSS produce large ranges in upper and lower 95-percent confidence levels for the estimated N and P loads, resulting in high levels of uncertainty and making it difficult to assess potential changes in annual nutrient loads for monitored streams in Durham (City of Durham Public Works Department, 2019). Computation of more accurate nutrient loads is a critical need for DSS, as well as other water-resource agencies, for assessing the effectiveness of BMPs used to reduce nutrient loads and improve water-quality conditions in the Falls Lake and Jordan Lake watersheds. Therefore, an evaluation of potential changes in current water-quality monitoring strategies and load computation model selection methods to reduce uncertainty of the computed nutrient loads could help support the DSS assessment needs. In 2016, DSS and the U.S. Geological Survey (USGS) initiated a collaborative study to evaluate whether alternate monitoring strategies that incorporate samples collected across an increased range of environmental conditions will allow DSS to compute nutrient loads and track progress toward nutrient-management goals with greater confidence than previously possible.
Purpose and Scope
This report presents a summary and analysis of rating curve model estimation approaches to determine instream nutrient loads in Ellerbe and Sandy Creeks, two small urban streams in Durham, North Carolina. The scope of work included a compilation and characterization of existing DSS nutrient concentration data and USGS streamflow data for the period of January 2009–December 2020 for the two streams. From October 2016 to January 2018, the USGS also collected 24 samples at each site that targeted stormwater runoff events to supplement the DSS water-quality dataset. After characterizing temporal and streamflow-related patterns in nutrient conditions, nutrient and streamflow data were used to develop models to estimate annual nutrient loads for the period 2009 through 2020. Two sampling scenarios and several different time steps using subsets of the available water-quality and streamflow data were evaluated to determine which approach(es) minimized bias and uncertainty associated with the computed nutrient loads at each study location. Results presented in this report improve current understanding on how different sampling strategies and load-estimation approaches may best be utilized to improve nutrient load estimates in small urban-dominated streams.
Study Sites
Ellerbe Creek and Sandy Creek are urban streams located in the City of Durham, in Durham County, North Carolina (fig. 2). Ellerbe Creek drains into Falls Lake in the Neuse River Basin, and Sandy Creek drains into Jordan Lake in the Cape Fear River Basin (figs. 1 and 2). Watershed boundaries and contributing drainage areas for the study sites were determined with the USGS StreamStats application developed for North Carolina (https://streamstats.usgs.gov/ss/; Weaver and others, 2012). These features were calculated by using a 30- by 30-foot (ft) light detection and ranging (lidar)-derived digital elevation model. The lidar-derived watershed drainage areas for the Ellerbe and Sandy Creek water-quality study sites are 5.05 and 4.76 square miles (mi2), respectively (table 1). In January 2018, the City of Durham switched from sampling Ellerbe Creek at upstream site EL7.9EC (USGS station number 0208675010) to sampling at downstream site EL7.1EC (USGS station number 0208675010) to collocate DSS water-quality data with the USGS streamgage location (table 1). The new Ellerbe Creek location includes the former station’s watershed drainage area plus an additional 0.7 mi2; both have similar land uses. Therefore, for the 12-year study period (2009–20) for Ellerbe Creek, the water-quality data collected at station EL7.9EC during 2009–17 and station EL7.1EC during 2018–20 were combined.
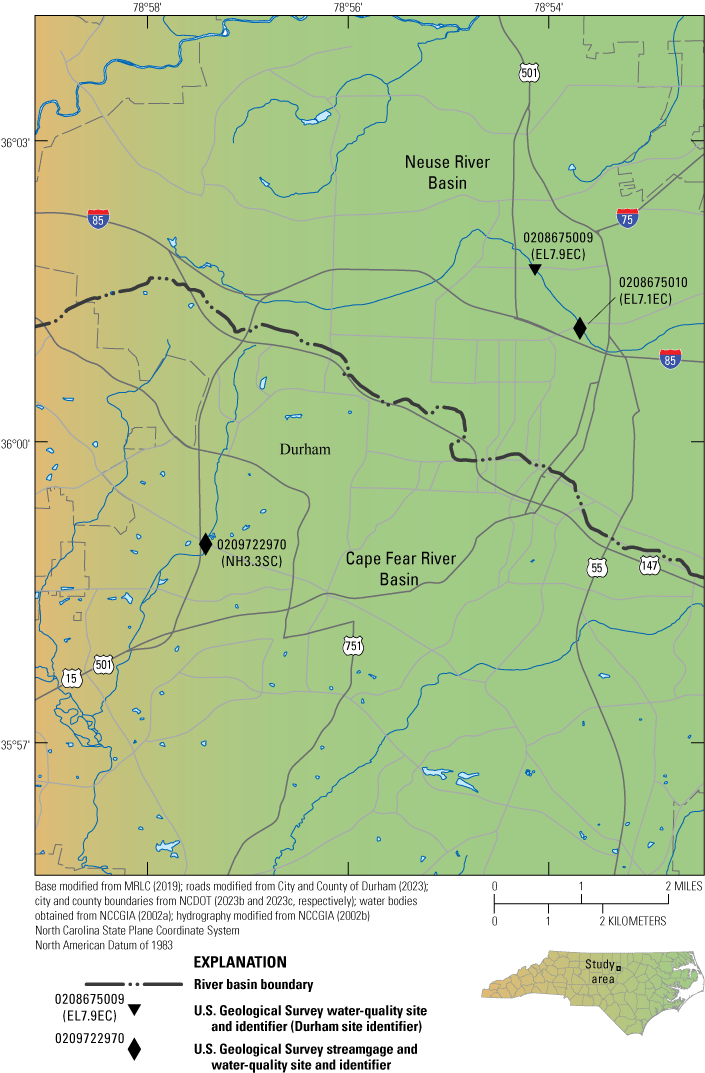
Locations of the Ellerbe Creek and Sandy Creek study sites in Durham, North Carolina.
Table 1.
Water quality and streamflow monitoring stations and associated watershed characteristics for the Ellerbe Creek and Sandy Creek study sites in Durham, North Carolina.[Latitude and longitude referenced to the North American Datum of 1983. USGS, U.S. Geological Survey; DSS, City of Durham Public Works Department, Stormwater Division; mi2, square mile; NC, North Carolina; NLCD, National Land Cover Database]
2011 NLCD classes were aggregated as follows: developed = classes 21, 22, 23, and 24; forested = classes 41, 42, and 43; agricultural/other = classes 11, 31, 52, 71, 81, 82, 90, and 95. NLCD class definitions are from Homer and others (2015).
Land-cover data for the site watersheds were compiled by using the StreamStats application. Land-cover information was derived from the 2011 National Land Cover Database, which in turn was based primarily on circa 2011 Landsat satellite data and included a 16-class land-cover classification scheme (Homer and others, 2015). For this report, detailed land-cover classes were aggregated into three generalized categories—developed, forested, and agricultural/other, which included water and wetlands (table 1). The Ellerbe Creek and Sandy Creek watersheds are highly urbanized, having 85.7 and 80.0 percent developed land, respectively. Forested land accounts for most of the remaining land cover. Of the developed land coverage, impervious area composed 23.1 and 24 percent at Ellerbe and Sandy Creeks, respectively.
Methods
For each stream, nutrient concentration data and streamflow data were used as input to compute instream loads of TKN, nitrate, total N, and total P for each calendar year from 2009 through 2020. This section presents the approach and methods used to compile the nutrient and streamflow data needed to compute stream nutrient loads with the USGS Load Estimator (LOADEST; Runkel and others, 2004; Runkel, 2013) statistical software program. Methods used by the USGS for collecting water samples for laboratory analysis as part of this study also are presented. The supporting data for this report are available in Harden and others (2024).
Water-Quality Data
The water-quality datasets compiled for Ellerbe and Sandy Creeks were based on stream samples collected from January 2009 through December 2020. Available data for physical properties (dissolved oxygen, pH, specific conductance, temperature, and turbidity) and nutrients (ammonia + organic N, nitrate + nitrite, total N, and total P) were compiled from the City of Durham and USGS databases.
Most of the nutrient concentration data were obtained from DSS monitoring stations collocated with USGS monitoring stations. For Ellerbe Creek, as mentioned previously, water-quality data were available for two locations and combined for this study: DSS station EL7.9EC, collocated with USGS station 0208675009; and DSS station EL7.1EC, collocated with USGS station 0208675010 (fig. 2 and table 1). For Sandy Creek, water-quality data were obtained from DSS station NH3.3SC, collocated with USGS station 0209722970. Characteristics of the water-quality data from the City of Durham and USGS are described in the following sections.
City of Durham
Water-quality data for the DSS monitoring stations on Ellerbe Creek and Sandy Creek were obtained through the City of Durham’s Water Quality Data Web Portal (City of Durham, 2024). Only results for samples collected by DSS during January 2009–December 2020 as part of their ambient monitoring program and analyzed by the South Durham Water Reclamation Facility (SDWRF) laboratory were considered for use in this study (City of Durham Public Works Department, 2019). The SDWRF is listed as laboratory number 176 under the North Carolina Department of Environmental Quality-certified municipal and industrial laboratories (North Carolina Department of Environmental Quality, 2023) certified to run analytical methods to meet NPDES permit requirements (U.S. Environmental Protection Agency [EPA], 2021). DSS manually collects samples on a fixed monthly basis and occasionally rotates monitoring sites. Ellerbe Creek was not sampled during 2014; therefore, no water-quality data were available for that year. Water-quality data were available for Sandy Creek for the entire period.
DSS water-quality data included remark codes (RCs) associated with analytical results, such as “less than” (<) for values censored at the laboratory reporting level (LRL) and “estimated” (E) for values that fall between the LRL and method detection level. Constituents with estimated concentrations were used as reported for the load analyses in this study. Laboratory analyses were performed on unfiltered samples and included concentrations for unfiltered phosphorus by EPA method 365.1, unfiltered ammonia + organic N by EPA method 351.2, and unfiltered nitrate + nitrite by EPA method 353.2 (table 2; EPA, 1993a, b, c, respectively). Hereafter, filtered constituents will be referred to as “dissolved,” and unfiltered constituents will be referred to as “total.” Total ammonia + organic N also will be referred to as “TKN.”
Table 2.
Description of laboratory analytical methods used to measure nutrient concentrations in surface-water samples from Ellerbe and Sandy Creeks in North Carolina by the City of Durham Public Works Department, Stormwater Division (DSS) and U.S. Geological Survey (USGS), January 2009–December 2020.[CAS, Chemical Abstract Services registry; NWIS, USGS National Water Information System; mg/L, milligram per liter; NEMI, National Environmental Method Index; N, nitrogen; NA, not applicable; EPA, U.S. Environmental Protection Agency; P, phosphorus; ASF, automated segmented flow; DA, (automated) discrete analyzer]
| Chemical constituent (unit) |
Analyzing entity | CAS number | NWIS parameter code | Analytical method | Laboratory reporting level (mg/L) |
NEMI method | Method reference |
|---|---|---|---|---|---|---|---|
| Ammonia + organic nitrogen, unfiltered, (mg/L as N) | DSS | 7727-37-9 | NA | Colorimetry, semi-automated, digestion, acidified | 0.12, 0.17, 0.19, 0.3, 0.7, 0.9 | EPA 351.2 | EPA (1993a) |
| Nitrate + nitrite, unfiltered, (mg/L as N) | DSS | 14797-65-0; 14797-55-8 | NA | Colorimetry, automated, enzymatic reduction-diazotization | 0.008, 0.02, 0.04, 0.1 | EPA 353.2 | EPA (1993b) |
| Phosphorus, unfiltered, (mg/L as P) | DSS | 7723-14-0 | NA | Colorimetry, automated, alkaline-persulfate digestion | 0.02, 0.03, 0.08, 0.09, 0.1 | EPA 365.1 | EPA (1993c) |
| Ammonia + organic nitrogen, unfiltered, (mg/L as N) | USGS | 7727-37-9 | 00625 | Colorimetry, ASF, micro-Kjeldahl digestion, acidified | 0.07 | USGS I-4515-91 | Patton and Truitt (2000) |
| Nitrate + nitrite, filtered, (mg/L as N) | USGS | 14797-65-0; 14797-55-8 | 00631 | Colorimetry, DA, enzymatic reduction-diazotization, low level | 0.01 | USGS I-2548-11 | Patton and Kryskalla (2011) |
| Phosphorus, unfiltered, (mg/L as P) | USGS | 7723-14-0 | 00665 | Colorimetry, ASF, alkaline-persulfate digestion, low level | 0.004 | EPA 365.1 | EPA (1993c) |
USGS
Water-quality data for the USGS monitoring stations on Ellerbe Creek and Sandy Creek included historical data and new data collected during this study. At Sandy Creek, nutrient concentration data for dissolved nitrate + nitrite, total N, and total P were available for 10 surface-water samples collected weekly from April 8 to June 12, 2014, as part of a regional USGS study (Van Metre and Journey, 2014; Journey and others, 2015). Results for only 3 of these 10 USGS samples collected at higher streamflows (April 8 and 30, 2014; and May 28, 2014) than the DSS monthly samples during that time period were included in the calibration files for the load estimation analyses. Water-quality datasets also included the nutrient results for surface-water samples collected during 2018–20 by the USGS for this study to supplement the fixed-interval data collected through the DSS ambient monitoring program. The EPA-updated approved laboratory methods for NPDES monitoring include the USGS and DSS methods for nutrients used in this study (table 2), indicating a degree of compatibility in the results from these methods (EPA, 2021).
The objective of the USGS sampling effort was to collect nutrient data across a wider range of streamflow conditions than previously attempted and at times of the diel cycle that previously had been underrepresented by the DSS’s monitoring program. At the beginning of the study, the USGS installed ISCO automated samplers to collect surface-water samples at the Ellerbe Creek and Sandy Creek study sites. The USGS has existing continuous streamgages at the selected sites that provide streamflow data from August 1, 2008, to the present day. Streamflow at these small, urban stream sites was described as being highly flashy, having a rapid, short-lived response to stormwater runoff events. Peak streamflows from heavy rainfall, especially late-day convective thunderstorms, commonly occurred at times outside of a normal work week, such as during nights and weekends. The automated samplers were equipped with two-way cellular telemetry, which allowed them to be queried and controlled remotely and provided flexibility in water-quality sample collection during periods of high streamflows, regardless of the time of day or day of the week.
A total of 24 high-flow samples were collected at each site by the USGS, mainly during stormwater runoff events by using automated samplers, from October 2016 to January 2018 for laboratory analysis of nutrients (table 2). During stormflow, the USGS high-flow sample collections targeted different parts of the stormflow hydrograph to evaluate water chemistry changes during rising limb, peak, and falling limb. The samplers were programmed following manufacturer’s instructions to automatically collect an individual sample once a predetermined stream stage condition was met during a stormwater runoff event. The stream sample was collected for about 1 minute and deposited into a 1-liter collection bottle stored within the automated sampler. Samples were retrieved as soon as possible following collection for subsequent processing at the USGS office laboratory in Raleigh, North Carolina, typically within 12–16 hours of collection, which met the 28-hour hold time for unprocessed nutrient samples (EPA, 2009). The samples were collected and processed using techniques described in the USGS “National Field Manual for the Collection of Water-Quality Data” (U.S. Geological Survey, variously dated). Specific conductance and turbidity were measured in the office laboratory. Processed samples were shipped on ice overnight within 1–2 days of collection and were received by USGS National Water Quality Laboratory (NWQL) in Denver, Colorado, for TKN, dissolved nitrate + nitrite, and total P analyses. The NWQL analytical methods for nutrients remained consistent for all USGS samples analyzed during the study (table 2). All USGS data compiled in the water-quality datasets were retrieved from the USGS National Water Information System (NWIS) database (U.S. Geological Survey, 2021a).
Quality Assurance and Quality Control
The City of Durham data were quality-assured by DSS prior to being downloaded from their Water Quality Data Web Portal. The USGS also worked in consultation with DSS staff to further review the City of Durham nutrient data to identify any potential issues or questionable results prior to finalizing the dataset for use in computing nutrient loads. Results for quality assurance samples were retrieved and used to evaluate the environmental sample results. During the review, it was noted that the City of Durham nutrient data from the SDWRF had fluctuating LRLs, producing multiple censoring levels (table 2). Beginning around October 2012, the SDWRF started reporting TKN and nitrate + nitrite concentration values with a higher precision than before, to two decimal places rather than one. The LRLs for the City of Durham nutrient data ranged from 0.12 to 0.9 mg/L for TKN, from 0.008 to 0.1 mg/L for nitrate + nitrite, and from 0.02 to 0.1 mg/L for total P concentrations. Sixteen of 17 samples collected during a limited span from January 2009 to May 2010 at Sandy Creek had total P concentrations reported below the LRL of 0.03 mg/L. The total P detection rate of 5.9 percent during that period was considerably lower than the 88-percent detection rate observed over the entire study period at this site. Conversely, only 3 of 17 samples collected during the same period at Ellerbe Creek had total P concentrations <0.03 mg/L. Because there was no basis to determine whether the lack of detectable total P concentrations at Sandy Creek during January 2009–May 2010 was reflective of true site conditions or some type of laboratory issue that may have occurred during sample analysis, these data were retained in the final dataset used for the January 2009–December 2020 period.
The USGS collected quality-control samples, including field blanks and replicate samples, in association with the surface-water samples to document potential bias and variability in data that may result during the collection, processing, shipping, and handling of environmental samples (U.S. Geological Survey, variously dated). Field blanks were collected and processed using inorganic-free blank water with the same equipment used for the environmental samples, including the automated sampler, bottles, filters, and preservatives. Field blanks help identify potential contamination resulting from improperly cleaned equipment, field sampling activities and exposure, and laboratory practices. Replicate samples help document the variability in data results associated with sample collection, processing, and laboratory analysis. Analytical results of the quality-assurance samples collected by USGS during this study are summarized in table 3.
Table 3.
Summary of physical properties and constituent concentrations for quality-assurance samples collected by U.S. Geological Survey at the Ellerbe Creek and Sandy Creek study sites, Durham, North Carolina, 2017–18.[Dates shown as month, day, year. Times shown in 24-hour format. µS/cm, microsiemens per centimeter; °C, degree Celsius; NTRU, nephelometric turbidity ratio units; TKN, total Kjeldahl nitrogen; N, nitrogen; P, phosphorus; mg/L, milligram per liter; enviro-rep, environmental and replicate; <, less than; --, no data]
Four field equipment blanks were collected and analyzed for specific conductance, TKN, dissolved nitrate + nitrite, and total P (table 3). None of the nutrient constituents were detected above LRLs in the field blanks; thus, there was no indication of systematic positive bias that would affect the environmental data.
Eight paired environmental and replicate sample sets were collected during the study (table 3). The two environmental replicate sample sets collected on June 26, 2017, were used to test for potential temperature effects on surface-water samples following collection and storage in the automated samplers. The “temperature hold test” helped to evaluate whether nutrient constituents in samples experienced any degradation effects during the time they were held in the automated samplers, under ambient conditions, and subsequently retrieved for processing and submittal to the NWQL. For this test, streamwater was collected through the automated sampler into a churn. The composited water was split into two sample collection bottles, one for the regular environmental sample and one for the replicate sample. The environmental sample was processed soon after collection, whereas the replicate sample was placed back in the automated sampler for overnight storage; air temperatures were in the 70- to 80-degree Fahrenheit range during the test. The replicate sample was retrieved for processing the next day, about 18 hours following collection, which was above the average retrieval and processing time for the environmental samples. Overall, the temperature hold test results indicated very good agreement, with minimal to no differences between the nutrient constituent concentrations for the paired replicate samples (table 3). These results indicate nutrient concentrations in collected surface-water samples were not negatively affected when held for periods of up to 18 hours before retrieval from the automated samplers and subsequent processing. Each of the other six paired environmental-replicate sample sets were split from a single collection bottle and processed as soon as possible following collection and retrieval from the automated samplers.
The overall variability of sampling and analysis was assessed by examining the relative percent differences (RPDs)—calculated as the absolute difference multiplied by 100 and divided by the average—between the constituent concentrations in all eight replicate sample sets. A statistical summary of the RPDs determined for each analyte for all paired environmental and replicate samples is provided in table 4. The RPDs in constituent concentrations exceeded 10 percent in only one instance. The mean and median RPDs were less than 5 percent between the environmental and replicate samples, which indicated very good reproducibility for the measured water-quality constituents. No quality-assurance problems were identified for the USGS environmental dataset on the basis of the replicate samples.
Table 4.
Summary of relative percent differences in constituent results for the surface-water environmental and replicate sample sets collected at the Ellerbe Creek and Sandy Creek study sites, Durham, North Carolina, 2017–18.[RPD, relative percent difference; %, percent]
Water-Quality Datasets for Load Estimation
The following discussion describes the differences in the nutrient concentration data obtained from both data sources (City of Durham and USGS) and the steps taken to prepare the final water-quality datasets for subsequent use in developing the nutrient data calibration files for the R-LOADEST program. Both agencies reported concentrations of the various nitrogen fractions in milligrams per liter as N and concentrations of total P in milligrams per liter as P.
The nutrient data retrieved from the City of Durham included concentrations for TKN, total nitrate + nitrite, and total P. Because of nitrate’s and nitrite’s high solubility in water, concentrations reported by City of Durham for total nitrate + nitrite were assumed to be equivalent to concentrations of dissolved nitrate + nitrite reported by USGS. Values of total N for the City of Durham data were computed by summing the reported concentrations for TKN and total nitrate + nitrite. The USGS data for this study included laboratory results for TKN, dissolved nitrate + nitrite, and total P; results for 2014 USGS regional study data included laboratory results of total N but not TKN (Journey and others, 2015). Values of total N for USGS samples collected during this study were computed using the measured concentrations for TKN and dissolved nitrate + nitrite. The approach used in this study for calculating total N concentrations when a constituent concentration was below the LRL is discussed in Harden and others (2020).
The handling of estimated concentrations reported for TKN and (or) nitrate + nitrite when computing values of total N concentrations is described as follows. If both TKN and nitrate + nitrite had estimated concentrations, then an “E” RC also was assigned to the total N concentration. If only one of the underlying constituents was estimated and that concentration represented 25 percent or more of the computed total N value, then an “E” RC was assigned to the total N concentration; an “E” was not assigned if the concentration was less than 25 percent.
For each study site, the sampling frequency of compiled data was reviewed. On five occasions, analytical results for samples collected by both the City of Durham and USGS were available on the same date. In these cases, only the sample associated with the highest instantaneous streamflow at the time of collection was retained for use in this study. The final water-quality datasets compiled for the Ellerbe Creek and Sandy Creek study sites are presented in Harden and others (2024).
Streamflow Data
Continuous streamflow record (computed as unit values for a fixed time interval) was determined using methods described in Rantz and others (1982). Unit-value streamflow was computed at the study sites using a continuous record of water stage at predetermined intervals calibrated to periodic streamflow measurements. Streamflow at the time of sample collection (instantaneous) was obtained from the computed continuous unit-value streamflow records from the USGS streamflow gaging stations.
Required streamflow data for computing nutrient loads included daily mean (the mean of all unit-value streamflows for a given day) and instantaneous streamflow (unit-value streamflow at the time of sampling) during the 2009–20 study period when water-quality samples were collected (table 1). Unit-value (instantaneous) and daily-value (daily mean of all unit values) streamflow data computed at the continuous streamflow gaging stations at each site were obtained from the USGS NWIS database (U.S. Geological Survey, 2021a). For the Ellerbe Creek study site (table 1), the collocated USGS and DSS water-quality monitoring stations (0208675009 and EL7.9EC, respectively) are located upstream from the USGS streamflow monitoring station (0208675010). For the DSS and USGS samples collected prior to January 2018, streamflow values for the upstream water-quality stations were determined by adjusting the streamflow data from the downstream USGS streamgage by the drainage area ratio of the two sites (5.05 mi2/5.75 mi2 = 0.878). This same adjustment was applied for the USGS sample collected on January 12, 2018. Water-quality and streamflow data were collected at the same location for Sandy Creek (table 1), so no flow adjustment was needed.
Daily mean streamflows for Ellerbe Creek were missing for January 8–10, 2017. Therefore, daily mean flows for these three days were interpolated from data for January 7 and 11, 2017. There were no missing daily mean streamflows for the 2009–20 study period at Sandy Creek. In compiling the instantaneous streamflow values for use with the water-quality data, there was one sample for Ellerbe Creek and seven samples for Sandy Creek when instantaneous streamflows were not available for the dates and (or) times that the samples were collected. In these cases, instantaneous streamflow values assigned to these samples were either estimated from available data or set equivalent to the daily mean value; these values were qualified with an “E” RC.
Load Estimation
Many methods are available for estimating stream constituent loads, and the most suitable approach for a particular study can depend on various factors, such as the constituents of interest, length of record for available data, frequency of data collection, sampled range of conditions, and watershed size (Appling and others, 2015; Aulenbach and others, 2016; Lee and others, 2016; Lee and others, 2019). Initially for this study, the USGS explored the loadflex package (Appling and others, 2015) for potential use in computing nutrient loads at the Ellerbe Creek and Sandy Creek study sites. The loadflex package allows users to apply and compare four common load estimation approaches, including the interpolation model (Robertson and Roerish, 1999), the period-weighted interpolation approach (Aulenbach and others, 2016), the custom regression model (rating curve) through interfacing with USGS R-LOADEST program (Runkel, 2013), and composite methods (Aulenbach, 2013). Based on preliminary testing, the custom regression method that employed the R-LOADEST program (version 0.4.5; Lorenz and others, 2017) was deemed best suited for providing the least amount of bias and uncertainty in estimated loads given study scope and the nutrient and streamflow data compiled for this study. Additionally, the R-LOADEST program was better equipped to handle censored nutrient data.
R-LOADEST Models for Estimating Constituent Loads
The R-LOADEST program (Runkel and others, 2004; Runkel, 2013; Lorenz and others, 2017) was used for estimating annual stream loads of TKN, nitrate + nitrite, total N, and total P at Ellerbe Creek and Sandy Creek. The selected R version of the LOADEST program (Lorenz and others, 2017) used for this study also was consistent with the Microsoft Windows based version of the LOADEST software package (Runkel and others, 2004; Runkel, 2013) used by DSS for computing nutrient loads as part of their stream ambient water-quality monitoring program. Instantaneous streamflow values, in cubic feet per second, were used with the sample nutrient concentrations in the calibration input files. The nitrate concentrations in the calibration files actually represented the reported concentrations of nitrate + nitrite, but because nitrite typically represented a small fraction of the total concentration, the concentrations and subsequent loads computed with the R-LOADEST program will be presented and discussed as nitrate. Daily mean streamflow values, in cubic feet per second, were used in the streamflow prediction files that were combined with the calibrated models in R-LOADEST for estimating nutrient loads.
R-LOADEST runs nine predefined regression models that use up to seven explanatory variables to estimate stream loads of each constituent (table 5; Runkel and others, 2004). Within R-LOADEST, streamflow and constituent concentrations were transformed to natural logarithms prior to regression analysis to improve the fit of the regression model. The simplest predefined models include only streamflow variables (models 1 and 2). These simple models often work well with estimation of particulate-dominant constituents like suspended sediment (Crawford, 1991). Models 3 and 5 account for streamflow variability and long-term temporal changes in streamflow or concentrations (Helsel and others, 2020). The models that account for streamflow and seasonality only (4 and 6) or streamflow, time trends, and seasonality (7, 8, and 9) often perform well for nutrient load estimation (Helsel and others, 2020). The R-LOADEST package allows the user to manually select any of the nine regression models on the basis of multiple diagnostic measures of bias or to use an automated option that selects the best model on the basis of one diagnostic measure.
Table 5.
Predefined regression models in the computer program R-LOADEST for estimating loads in rivers and streams (adapted from Runkel and others, 2004).[ln, natural logarithm function; L, estimated load; βn, estimated coefficients of the regression model; Q, centered streamflow; T, fraction of the year in decimal years; T*, centered time in decimal years; sin, sine; cos, cosine; π, pi; e, model error term]
Initially, the automated option was used to select the best regression model for each constituent at each site (Runkel, 2013). The calibration and estimation procedures used with the selected regression models within R-LOADEST were based on the adjusted maximum likelihood estimation (AMLE) statistical estimation method (Cohn and others, 1989; Cohn, 2005). The AMLE method is appropriate when the model calibration errors are normally distributed and is the method of choice when the calibration datasets contain censored data; most calibration data compiled for the study sites typically contain censored data at multiple levels (between 8.5 and 15.7 percent of values censored). The ESTIMATOR routine within LOADEST assigns a “censoring threshold” for a constituent, even where there are multiple censoring levels prior to the AMLE routine. Runkel (2013) reported that the AMLE method is relatively insensitive to the precise value of the censoring threshold, even when the associated observation is uncensored. When LOADEST is executed, the first censored observation is used to assign an initial value to compute the censoring threshold until another censored observation is encountered.
Model evaluation criteria presented with the automated option include statistical values for both the Akaike information criterion (AIC) and the Schwarz posterior probability criterion (SPPC) that are computed and ranked for each of the calibrated models (Judge and others, 1988; Runkel and others, 2004). The best-fit model is selected on the basis of its lowest ranking of the AIC statistic, indicating relative goodness of fit between observations and predictions. The SPPC, which is also known as the Bayesian information criterion, is not used directly as part of the automated model selection process; however, it is included with the model output for comparative purposes. The SPPC has a higher penalty than does AIC for additional parameters in the model and will generally favor a simpler model with fewer terms (Runkel, 2013).
Subsequent to using the automated option to select the best-fit model, additional predefined models that are standard in the LOADEST package were considered to develop 1–3 candidate models on the basis of a review of their rankings for the AIC and SPPC statistics. As candidate models were developed for each scenario and time step, other diagnostics, including regression statistics, load bias statistics, and residuals analysis plots published in the R-LOADEST update (Runkel, 2013; Lorenz and others, 2017), were utilized to select the final model for that scenario and time step to be included in the analysis of nutrient loads at the study sites.
The probability plot correlation coefficient (PPCC) values included with the regression statistics and the residual analysis plots provided a check on the assumption that the model residuals were normally distributed. A PPCC value of 1.00 represents a perfect linear relationship. If the reported p-value for the PPCC test was <0.05, then the assumption that the data were normally distributed can be rejected; thus, p-values greater than (>) 0.05 were preferred.
The load bias statistics, including the load bias in percent (Bp) and the Nash-Sutcliffe Efficiency Index (NSE), were based on a comparison of observed and estimated loads for the dates and times in the model calibration data (Runkel, 2013). Values of Bp are equal to the sum of estimated loads minus the sum of observed loads, divided by the sum of observed loads, and expressed as a percentage (Runkel, 2013); positive values indicate overestimation of loads, and negative values indicate underestimation of loads. Values of NSE can theoretically range from negative infinity to 1.0, with a value of 1.0 indicating a perfect fit between observed and estimated loads, and a value of 0.0 indicating that the load estimates are only as accurate as the mean (Runkel, 2013). Runkel (2013) indicates that calibrated models having an absolute value of Bp exceeding 25 percent or a negative NSE value should not be used for load estimation.
The R-LOADEST program output generated for each constituent and year were compiled in Harden and others (2024). Results included the regression model used, the number of days in the year, the annual mean daily load (in kilograms per day), the standard error of prediction (SEP) of the load, and the lower and upper 95-percent confidence intervals (L95s and U95s) of the load (Runkel and others, 2004). Although not discussed in this report, the cumulative constituent load for a given year, in kilograms per year, can be determined by multiplying the mean daily load by the number of days in the year. The SEP represented the uncertainty associated with each estimate of daily load (Gilroy and others, 1990; Cohn and others, 1992) and incorporated both variability attributed to the model calibration (parameter uncertainty) and unexplained variability about the model (random error). The SEP indicated how closely estimated loads correspond to actual loads and was used within R-LOADEST to develop the 95-percent confidence intervals for each daily load estimate.
Load Testing Scenarios
Lee and others (2016) evaluated the relative performance of different methods for estimating constituent loads across a broad range of water-quality constituents, stream types, and sampling regimes. The tested sampling strategies included the “scenario B” monitoring approach in this study; that is, the collection of fixed monthly samples. One of the main findings in Lee and others (2016) and Robertson and Roerish (1999) was that sampling strategies that incorporate high-flow samples produced more accurate estimates of constituent loads with lower error levels than those that did not include high flow samples, regardless of the load estimation method.
For this study, subsets of the water-quality data compiled for Ellerbe and Sandy Creeks were used to test different load-estimation scenarios with R-LOADEST. The test scenarios included different combinations of the DSS and USGS nutrient data for the study period of January 2009–December 2020 for calibrating models and predicting annual nutrient loads for five select time periods during 2009–20 (table 6). Tests 1, 2, 3, 4, and 5 represented decreasing time steps of 12, 9, 7, 6, and 5 years, respectively. Additionally, two scenarios for each time-step test were run, where “scenario A” represented load estimations based on both DSS (fixed-monthly sampling) and USGS (targeted high-flow sampling) calibration data, and “scenario B” represented load estimations based on the DSS data only (table 6). The tests were designed to examine how uncertainties associated with the load predictions may be influenced by the length of record analyzed and the inclusion or exclusion of high-flow samples. The individual nutrient calibration files and streamflow prediction files used for the different test scenarios are provided in Harden and others (2024).
Table 6.
Summary of load test scenarios used for evaluating annual nutrient loads at the Ellerbe Creek and Sandy Creek study sites, Durham, North Carolina, 2009–20.[EC, Ellerbe Creek; SC, Sandy Creek; DSS, City of Durham Public Works Department, Stormwater Division; USGS, U.S. Geological Survey; --, not available or not used for test]
Characterization of Hydrologic and Water-Quality Conditions
General hydrologic conditions at Ellerbe and Sandy Creeks from 2009 through 2020 are summarized below on the basis of streamflow records from the two USGS continuous streamgages. Relations between nutrient concentrations and streamflow conditions also are summarized.
Hydrologic Conditions During Sampling
The overall mass of nutrients transported by the stream study sites is largely dependent on streamflow amounts within each watershed. Streamflow is influenced by many physical and anthropogenic variables, including basin size and slope, geology, evapotranspiration, groundwater interactions, land cover, and water-supply uses, withdrawals, and discharges. Streamflow amounts are primarily determined by the amount of precipitation that occurs throughout each watershed and reaches the stream through several pathways, including direct runoff and delayed base flow (Konrad, 2022).
Ideally, samples collected for estimating instream constituent loads would be uniformly distributed throughout the period of interest and balanced across the range of streamflow percentiles for the sites. This can be difficult to achieve when there are multiple goals for ambient water-quality monitoring programs. A primary goal of the City of Durham’s monitoring program is to detect and eliminate illicit discharges of hazardous substances (such as wastewater, paint, fuel, oil, and grease) into the stormwater system and local streams (City of Durham Public Works Department, 2019, 2023). To meet this objective, it is important to sample during periods of low streamflow when pollutant concentrations are less diluted than during stormflows, thereby making unpermitted discharges easier to detect.
The water-quality monitoring data also are used to evaluate the effectiveness of BMPs for reducing stream nutrient loadings to the Jordan and Falls Lake water-supply reservoirs. This objective necessitates collecting samples throughout the full range of streamflow conditions (low, intermediate, and high) to provide the robust water-quality datasets needed to estimate and evaluate instream nutrient loads. Sampling strategies developed for this purpose can be logistically challenging because of rapid and short-lived stream stage response in small urban streams, like Ellerbe and Sandy Creeks, to rainfall-runoff events, allowing little lead time for sampling.
Annual streamflows at Ellerbe and Sandy Creeks during 2009–20 are shown in figure 3. Mean annual daily mean streamflows (fig. 3) were similar at both sites, ranging from 3.39 to 14.74 cubic feet per second (ft3/s) at Ellerbe Creek and from 3.63 to 14.67 ft3/s at Sandy Creek. Total annual mean daily streamflows (fig. 3) ranged from 1,241 to 5,381 ft3/s at Ellerbe Creek and 1,325 to 5,370 ft3/s at Sandy Creek. Streamflows reflecting drier climatic conditions were lowest in 2011 and 2012. By comparison, streamflows reflecting wetter climatic conditions were around three to four times higher during 2018–20 at the end of the study period.
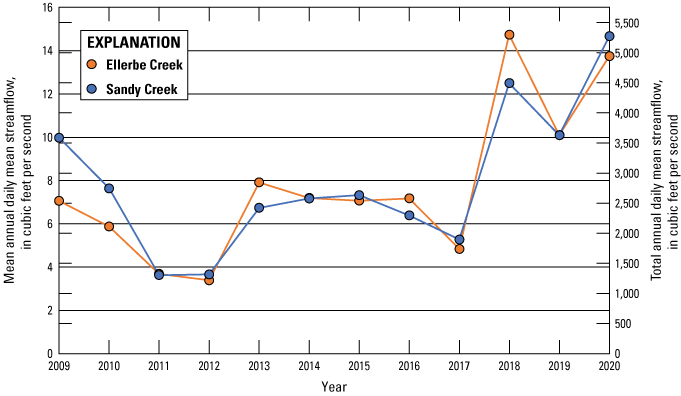
Mean annual daily mean streamflows and total annual daily mean streamflows for the 2009–20 study period at Ellerbe and Sandy Creeks, Durham, North Carolina.
Daily mean streamflows at sample collection dates were examined in combination with the daily mean streamflows for the entire study period to compare how the water-quality datasets used for computing stream nutrient loads related to the overall range in streamflow conditions observed at the sites. Cumulative daily mean streamflow percentiles for the study period along with the individual daily mean and instantaneous streamflows for each sample collection date and time, respectively, are illustrated in figure 4 for Ellerbe Creek and figure 5 for Sandy Creek.
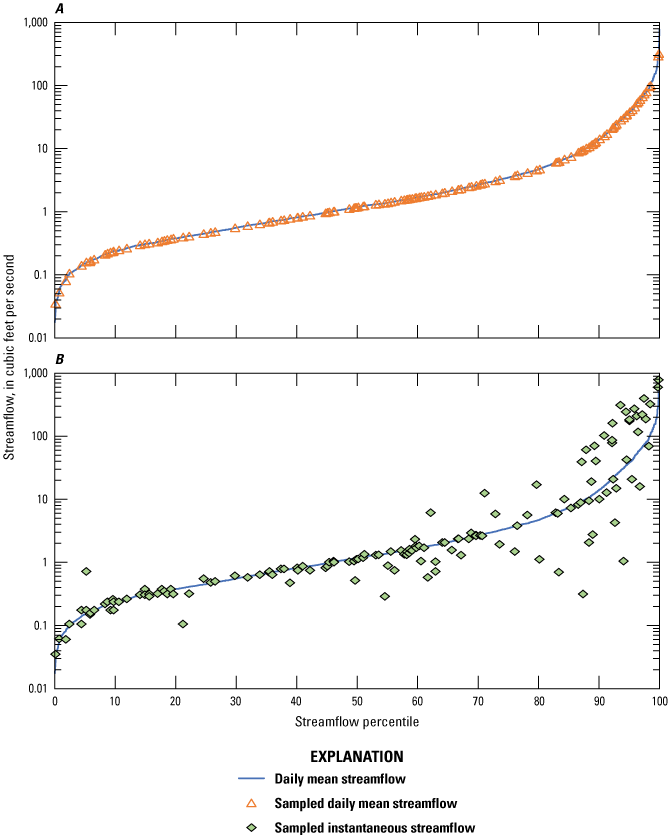
Cumulative percentiles of daily mean streamflows for the study period and the distribution of A, daily mean streamflows, and B, instantaneous streamflows during water-quality sample collections at Ellerbe Creek, Durham, North Carolina.
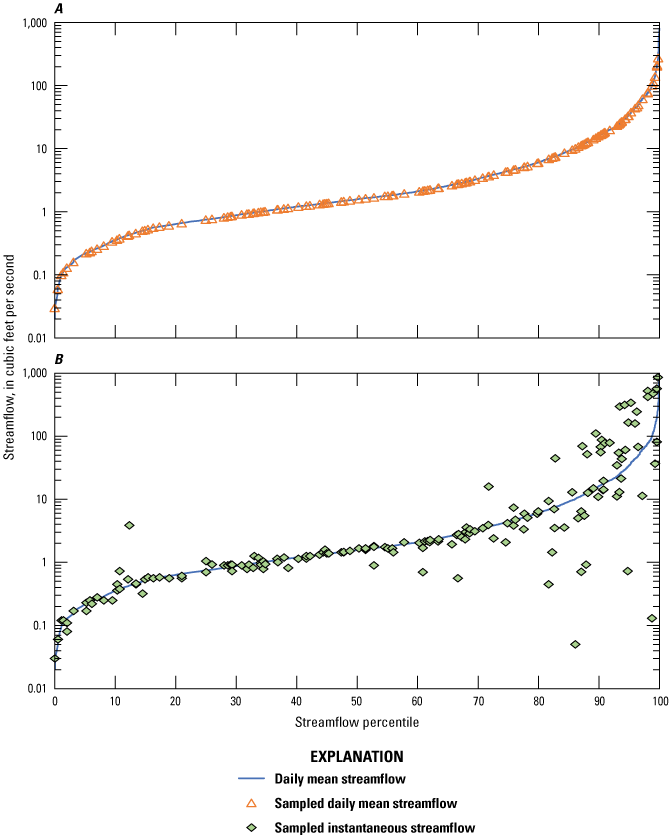
Cumulative percentiles of daily mean streamflows for the study period and the distribution of A, daily mean streamflows and B, instantaneous streamflows during water-quality sample collections at Sandy Creek, Durham, North Carolina.
Streamflow at the time of sampling appeared to be relatively representative of the overall distribution of streamflow conditions observed at Ellerbe Creek (fig. 4A) and Sandy Creek (fig. 5A). Daily mean streamflows ranged from less than 0.1 ft3/s at both sites to a maximum of about 781 ft3/s at Ellerbe Creek and 809 ft3/s at Sandy Creek during the study period. For a given sample at a stream site, instantaneous streamflow (streamflow when the sample was collected) may be similar to or quite different than the daily mean streamflow (mean streamflow for the entire day) (figs. 4B and 5B) for that particular day depending on whether the streamflow was stable throughout a day with little or no rainfall or runoff or fluctuated considerably because of a rainfall-runoff event. In some cases, the instantaneous streamflow may have been an order of magnitude lower (pre-event) or higher (during or after an event) than the daily mean values depending on the rainfall (before, during, or after) and stream-stage (stable, rising, peaking, or falling) conditions when samples were collected.
For computed stream nutrient loads to be accurate, water-quality samples need to be collected across the range of flow conditions (Lee and others, 2016). The number of days sampled by DSS and USGS for given ranges in the streamflow percentiles and daily mean streamflows at each site are summarized in table 7. Samples were collected during a total of 153 days for Ellerbe Creek and 167 days for Sandy Creek out of the 4,383 total days composing the 2009–20 study period. With the exception of the uppermost 10 percent of flows (90–100th percentiles), the percentage of total days sampled was relatively well distributed across the streamflow percentile ranges, ranging from 4.6 to 13.7 percent for Ellerbe Creek and from 6.6 to 12.0 percent for Sandy Creek (table 7).
Table 7.
Summary of streamflow percentiles, daily mean streamflows, and the number of sample collection days at Ellerbe Creek and Sandy Creek, Durham, North Carolina, by the City of Durham Public Works Department, Stormwater Division (DSS) and U.S. Geological Survey (USGS) from 2009 to 2020.[ft3/s, cubic foot per second; POR, period of record; no., number]
Inclusion of targeted higher streamflow sampling with fixed frequency sampling improved representation of the streamflow conditions during the study period in each stream. All sampled daily mean streamflows lower than the normal streamflow range (represented by streamflows in the 0–30th percentiles for this study) accounted for 1.2 and 1.8 percent of the total study period streamflows for Ellerbe and Sandy Creeks, respectively. However, a much higher percentage of days (27.5 for Ellerbe Creek and 24.6 for Sandy Creek) was sampled during below-normal streamflow conditions, with all days sampled as fixed frequency by DSS (table 7). Conversely, above normal daily mean streamflows (represented by the 70–100th percentile flows for this study) accounted for 92.1 and 89.5 percent of the total study period flows for Ellerbe and Sandy Creeks, respectively. Yet only 34.6 and 39.6 percent of the days sampled at Ellerbe and Sandy Creeks were during above-normal streamflow conditions, with DSS samples that incorporated fixed-frequency sampling representing only 20.3 and 25.1 percent of those samples (table 7), respectively. Therefore, inclusion of the USGS targeted high flow samples with the DSS fixed frequency sampling appeared to improve representation of the above-normal flow conditions by about 14 percent of sampled days.
Improvement was also observed in the highest flow conditions for the study period. Most of the total flow during the study period—77.2 percent for Ellerbe Creek and 71.4 percent for Sandy Creek—was contributed solely from the uppermost 10 percent (90–100th percentiles) of daily mean streamflows. The higher percentage of days sampled, 17.6 and 19.2 for Ellerbe and Sandy Creeks, respectively, was skewed for the highest 10 percent of streamflows because of the USGS targeted high-flow sampling. Without the USGS samples, the percentage of days sampled for the highest 10 percent of flows would be 7.8 for Ellerbe Creek and 9.0 for Sandy Creek.
The higher-than-normal sampled daily mean streamflows, mostly during 2017, also were reflected by the instantaneous streamflows at the time of sample collection at Ellerbe and Sandy Creeks (fig. 6). The distribution of instantaneous streamflows for the DSS and USGS samples was comparable between Ellerbe Creek and Sandy Creek, with the exception of the 2014 gap year for Ellerbe Creek when no samples were collected. At Ellerbe Creek, instantaneous streamflows ranged from 0.04 to 188 ft3/s for DSS samples and 1.05 to 786 ft3/s for USGS samples (fig. 6A). At Sandy Creek, instantaneous streamflows ranged from 0.03 to 480 ft3/s for DSS samples and 1.2 to 865 ft3/s for USGS samples (fig. 6B). The average streamflow values for DSS samples collected as part of the fixed monthly monitoring program were 6.0 and 7.8 ft3/s for Ellerbe Creek and Sandy Creek, respectively. The USGS samples collected mostly during stormwater runoff conditions had higher average values of 181 and 175 ft3/s for Ellerbe Creek and Sandy Creek, respectively.
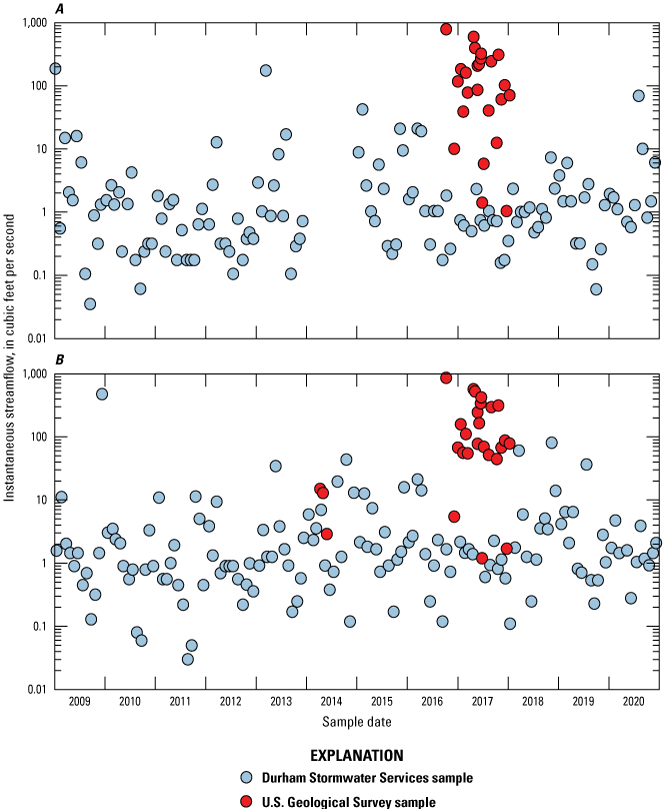
Instantaneous streamflows for the sample collection dates and times during 2009–20 for A, Ellerbe Creek, and B, Sandy Creek, Durham, North Carolina.
Relation Between Water Quality and Streamflow
Nutrient loads reflect variations in both the nutrient concentrations and streamflows used to compute the loads. Nutrient concentrations in North Carolina streams vary in response to changes in many integrated environmental factors, such as wastewater discharges, watershed land cover and use, streamflow, and geochemical processes (Harden and others, 2013; Harden, 2015). The variability in nutrient concentrations also can reflect changes in analytical precision and reporting levels during laboratory analysis.
Variations in measurements of physical properties (specific conductance and turbidity) and nutrient concentrations (TKN, nitrate + nitrite, total N, and total P) across the study period were examined for Ellerbe Creek (fig. 7) and Sandy Creek (fig. 8). The USGS samples collected at Ellerbe and Sandy Creeks, mostly in 2017, tend to have lower specific conductance and higher turbidity, TKN, total N, and total P relative to the DSS samples (figs. 7 and 8), which reflects the influence of overall higher flows sampled by the USGS (fig. 6). Nitrate + nitrite concentrations for the USGS samples were within the range observed for the DSS samples (figs. 7D and 8D).
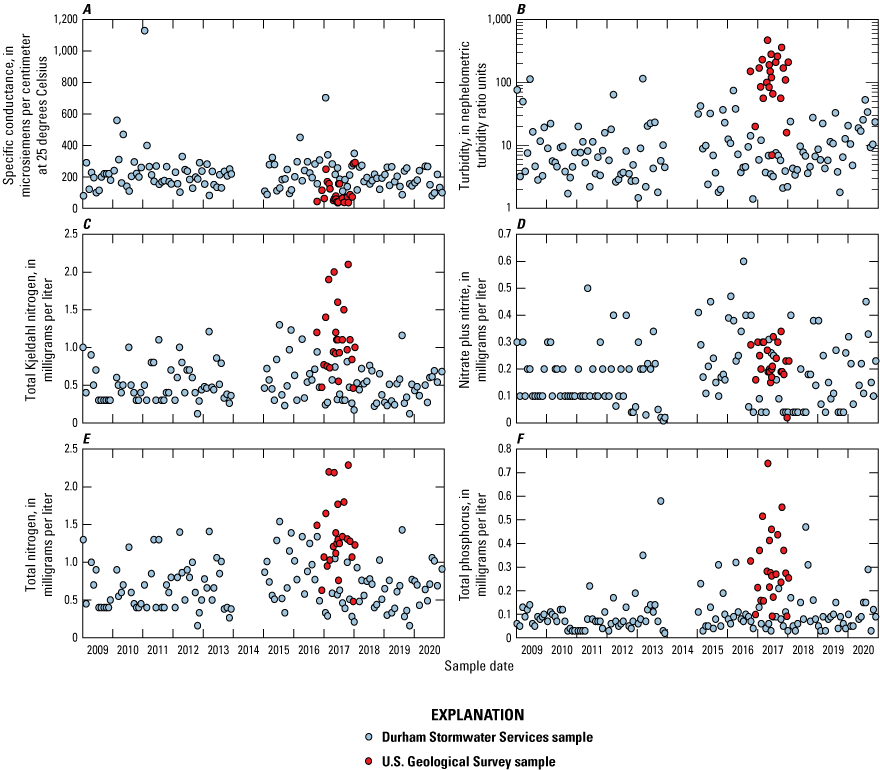
A, Specific conductance, B, turbidity, C, total Kjeldahl nitrogen, D, nitrate + nitrite, E, total nitrogen, and F, total phosphorus during 2009–20 at Ellerbe Creek, North Carolina.
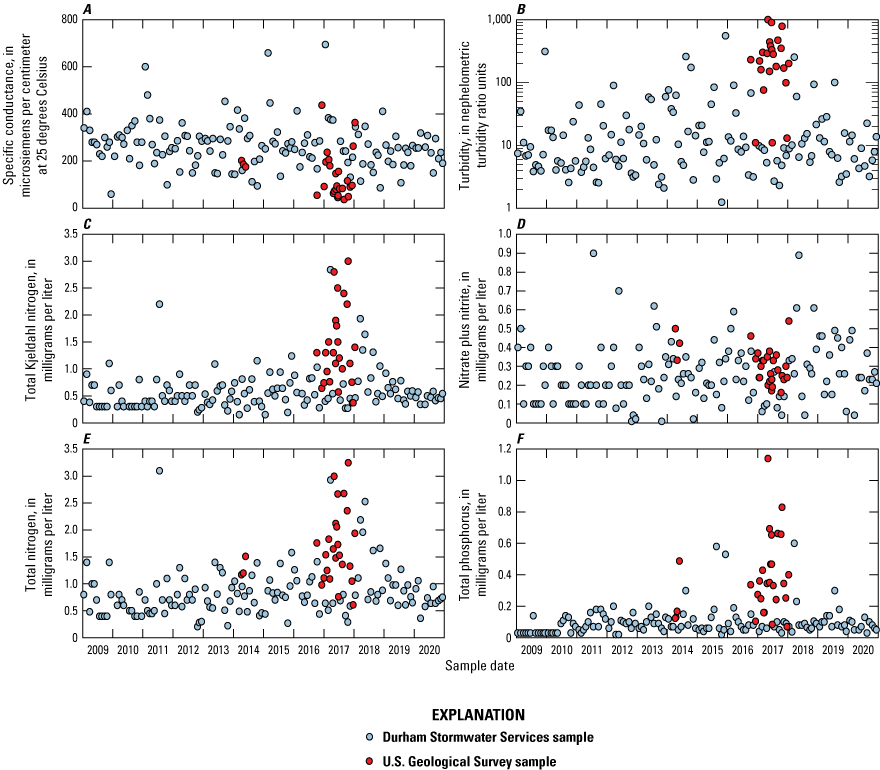
A, Specific conductance, B, turbidity, C, total Kjeldahl nitrogen, D, nitrate + nitrite, E, total nitrogen, and F, total phosphorus during 2009–20 at Sandy Creek, North Carolina.
For DSS samples, variations in specific conductance and turbidity values tended to be uniformly distributed for the period of record at both sites. Some temporal differences were observed in the DSS nutrient concentration data during the early part of the study period (figs. 7C–F and 8C–F). In late 2012, concentrations for TKN (figs. 7C and 8C) and nitrate + nitrite (figs. 7D and 8D) started to be reported with better precision, from one to two decimal places, and with lower LRLs; this is also reflected in the total N concentrations (figs. 7E and 8E). As previously discussed, Sandy Creek samples in 2009 and 2010 had an unusually high incidence of total P concentrations less than the LRL of 0.03 mg/L (fig. 8F). Similarly, multiple samples at Ellerbe Creek from late 2010 to early 2011 also had total P concentrations less than the LRL (fig. 7F).
Stream water-quality properties and constituent concentrations are typically related to streamflow. In this study, the strength of relations between streamflow and specific conductance, turbidity, and nutrient concentrations (TKN, nitrate + nitrite, total N, and total P) varied depending on which datasets were used. Constituents with less-than “<” values were used as reported for this examination. Best-fit power trendlines for the DSS sample results and the combined DSS and USGS sample results for Ellerbe Creek (fig. 9A–F) and Sandy Creek (fig. 10A–F) illustrate general relations between constituents and streamflows and the influence of higher flow samples on these relations.
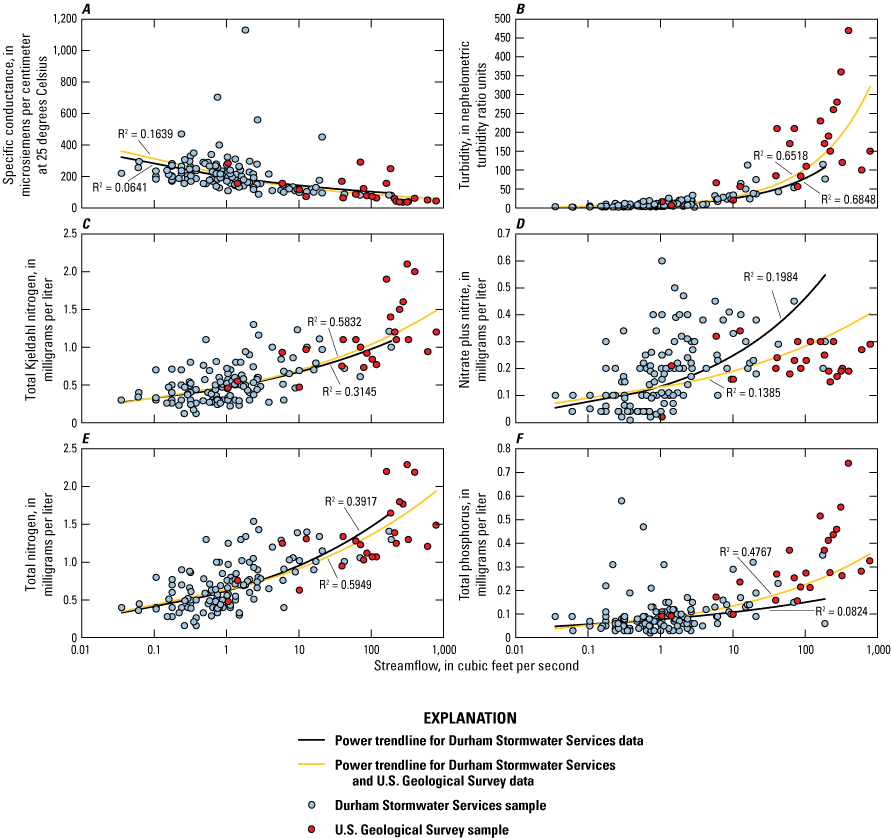
A, Specific conductance, B, turbidity, C, total Kjeldahl nitrogen, D, nitrate + nitrite, E, total nitrogen, and F, total phosphorus versus instantaneous streamflow during 2009–20 at Ellerbe Creek, North Carolina.
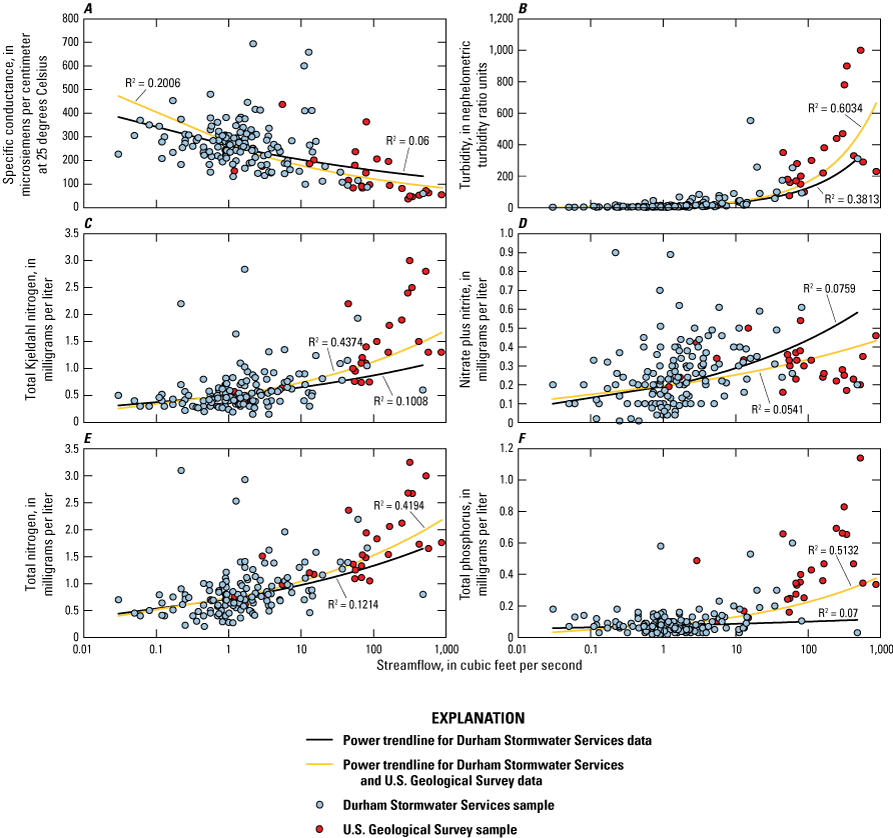
A, Specific conductance, B, turbidity, C, total Kjeldahl nitrogen, D, nitrate + nitrite, E, total nitrogen, and F, total phosphorus versus instantaneous streamflow during 2009–20 at Sandy Creek, North Carolina.
Overall, a negative power relation was noted at the sites for specific conductance, where increases in streamflow corresponded to decreases in specific conductance, likely because of dilution (figs. 9A and 10A). In contrast, positive power relations were noted for turbidity, TKN, total N, and total P. Relative to lower streamflows, higher streamflows generally carry more particulate material, such as suspended sediment and organic matter, which tends to increase the turbidity of water. Turbidity had the strongest positive relation to streamflow of all the constituents (figs. 9B and 10B). Among the nutrient fractions, TKN (figs. 9C and 10C), total N (figs. 9E and 10E), and total P (figs. 9F and 10F) had the strongest relations. Concentrations of total N at both study sites were composed predominantly of the TKN fraction relative to the nitrate + nitrite fraction, which was reflected by the similar concentration versus flow relations for total N and TKN. Although slightly positive, poor relations were noted between nitrate + nitrite and streamflow (figs. 9D and 10D). Aulenbach and others (2016) also observed weak nitrate concentration-discharge relations in another study of similarly sized watersheds.
Comparisons between the DSS-only data and the combined DSS and USGS data at both sites (figs. 9 and 10) illustrate that targeted storm-runoff sampling improved the overall concentration versus flow relations for all nutrient constituents except nitrate + nitrite. These data illustrate the importance of collecting samples during higher streamflows to characterize flow-related water-quality differences. Inclusion of the higher flow samples had no substantial influence on the concentration versus flow relation for nitrate + nitrite. Nitrate concentrations typically do not correlate well with streamflow because of hysteresis effects (Sharifi and others, 2017). Concentrations are usually higher during the first flush on the rising limb of a storm hydrograph but are lower through dilution on the falling side of the hydrograph. Although nutrient concentrations may vary with streamflow, the overall mass of nutrients transported tends to be higher during periods of higher flows, because substantially larger volumes of water are being flushed through the watershed than during other periods. Another reason for the poor relation may be explained by Ledford and others (2017), whose study indicated that seasonal biotic uptake and transformation of nitrate was equally important as streamflow in influencing nitrate concentrations in urban streams. Specifically, biotic uptake and transformations in urban headwater streams, like the ones in this study, produced low nitrate concentrations from spring through fall, especially if the stream had limited canopy cover and high algal mat density.
Optimization of Nutrient Load Estimation Approaches
Model output data were evaluated to optimize R-LOADEST model options for estimating stream nutrient loads in Ellerbe and Sandy Creeks for the City of Durham. Several model options were run, and the resulting model calibration diagnostics were used to select the most optimized R-LOADEST models to predict nutrient loads at the Ellerbe Creek and Sandy Creek study sites. Relations in nutrient load uncertainties between the two test scenarios (including both DSS and USGS data and DSS data only) with varying time steps also were examined.
Evaluation of Model Calibration Performance
Two to four models were developed and diagnostics analyzed for a given nutrient constituent and data test scenario. Specifically, calibration diagnostic results from those models, including model “goodness of fit” evaluation criteria (AIC and SPPC), normality test of residuals (PPCC), and bias diagnostics (Bp and NSE), for all examined LOADEST regression models were used to select the final, or most optimized, model for each constituent, sampling regime, and load prediction period at Ellerbe and Sandy Creeks (table 6). An iterative process was used during the model selection process, whereby the automated option was first used to identify the best-fit model, on the basis of its AIC ranking, for each nutrient and data test scenario. After reviewing the calibration criteria for the best-fit model automatically selected by LOADEST, additional candidate models were manually chosen (on the basis of multiple diagnostics along with AIC or SPPC output) to improve the overall fit and reduce bias.
Ideally, calibration models having normally distributed residuals (PPCC, p-values >0.05) and low bias (Bp <25 percent and E values closer to 1) are preferred for use in load estimation. The models had to be run individually to obtain the PPCC, Bp, and NSE statistics. In all, 68 potential models (32 automated best fit and 36 manually chosen) for Ellerbe Creek and 99 potential models (40 automated best fit and 59 manually chosen) for Sandy Creek were examined further to select the final models used for nutrient load estimation and analysis. All of the regression models and associated calibration diagnostic results examined for each nutrient constituent (TKN, nitrate, total N, and total P) and data test scenario at Ellerbe and Sandy Creeks are provided in Harden and others (2024).
The load bias diagnostic results (Bp and NSE) provide an overall indication of how the modeled data compare to the observed data in the calibration dataset. Calibration models having high absolute values of Bp (>25 percent) or negative values for NSE are indicative of high bias and poor model fit and should not be used (Runkel, 2013). When based solely on the automated model selection option, 25 percent (8 of 32) of the best-fit models for Ellerbe Creek and about 32 percent (13 of 40) of the best-fit models for Sandy Creek had Bp values greater than the 25-percent threshold.
An example of the iterative process for selecting a final model is described next, and the model diagnostics are listed in table 8. Three regression models for total N for test scenario 2B that comprise DSS samples only for the 2012–20 time step at Ellerbe Creek were compared. LOADEST automatically selected regression model number 7 because it had the lowest AIC ranking; however, it had an unacceptable Bp value greater than 25 percent. Model 4, with the lowest SPPC, was then manually selected for consideration. Although some diagnostic results for model 4 were slightly better than those for model 7, model 4 also had a Bp value greater than 25 percent. Model 8 was also manually selected, having an AIC rank of 2, an SPPC rank of 4, and acceptable Bp (13.47) and NSE (0.96). All three models had normally distributed residuals (with PPCC p-values >0.05). Therefore, model 8 was chosen as the final model for total N load predictions for test 2B at Ellerbe Creek on the basis of its better calibration criteria results relative to those of the other models.
Table 8.
Example summary of calibration diagnostics from load test scenario 2B regression models evaluated for total nitrogen in Ellerbe Creek, Durham, North Carolina, for the load prediction period of 2012–20.[AIC, Akaike information criterion; SPPC, Schwarz posterior probability criterion; PPCC, probability plot correlation coefficient; Bp, load bias in percent; NSE, Nash-Sutcliffe Efficiency Index; N, nitrogen]
For more information on regression models, see table 5.
In general, models selected for load estimation had the lowest percent load bias; displayed reasonably normal distributed residuals relative to time, streamflow, and observed values; and had a NSE closest to 1. When candidate models for a given calibrated dataset had comparable regression statistics, residual plots, and load bias diagnostics, then the model with the fewest terms was typically selected. The final calibrated models selected for evaluation with the load test scenarios for Ellerbe and Sandy Creeks are summarized in table 9.
Table 9.
Summary of the selected load estimation models and associated diagnostics for nutrients in Ellerbe and Sandy Creeks, Durham, North Carolina, 2009–20.[TKN, total Kjeldahl nitrogen; N, nitrogen; P, phosphorus; PPCC, probability plot correlation coefficient; Bp, bias percent; NSE, Nash-Sutcliffe Efficiency Index; na, not applicable because no final model selected because of unacceptable calibration diagnostics; nd, not determined because no samples were collected at Ellerbe Creek during 2014 for the start of the prediction period]
Table 9.
Summary of the selected load estimation models and associated diagnostics for nutrients in Ellerbe and Sandy Creeks, Durham, North Carolina, 2009–20. [continued][TKN, total Kjeldahl nitrogen; N, nitrogen; P, phosphorus; PPCC, probability plot correlation coefficient; Bp, bias percent; NSE, Nash-Sutcliffe Efficiency Index; na, not applicable because no final model selected because of unacceptable calibration diagnostics; nd, not determined because no samples were collected at Ellerbe Creek during 2014 for the start of the prediction period]
In some cases, none of the analyzed models (neither automated best fit nor manually selected) for a given constituent and test scenario were deemed appropriate for estimating loads because of poor fits with unacceptable diagnostic results (Runkel, 2013). This was most pronounced for Sandy Creek, where no final models were selected for three of the nitrate tests (1A, 1B, and 2B) and six of the total P tests (1A, 1B, 2A, 3A, 4A, and 5A).
With one exception, all selected final models had Bp values less than 25 percent. In the case of nitrate test 1B at Ellerbe Creek, final model number 6 had a high E value of 0.88 and a Bp value slightly above 25 percent. Most of the final models have the potential for overestimating loads because of positive Bp values. Sandy Creek had several models for TKN, total N, and total P with negative Bp values, indicating the potential for underestimating loads (table 9).
The PPCC tests for normality of the model residuals indicated that Ellerbe Creek had better overall model residuals than Sandy Creek (table 9). About 65 percent (20 of 31) of the final models for Ellerbe Creek and 22 percent (7 of 31) of the final models for Sandy Creek had model residuals normally distributed (PPCC p-value >0.05). Runkel and others (2004) indicated that the AMLE method for censored data may not yield optimal load estimates for model residuals that fail the normality assumption and that the least absolute deviation (LAD) method within LOADEST could be considered for load estimation because it does not require a normality assumption. As part of a water-quality study for Gwinnett County, Georgia, Aulenbach and others (2017) utilized the AMLE approach in LOADEST to estimate stream loads for multiple constituents, including nutrients, for 13 watersheds. They noted that the regression models developed for the constituent loads often did not have normally distributed residuals, as was also observed for this study. Furthermore, Aulenbach and others (2017) indicated that the LAD approach in LOADEST does not allow for the use of censored data. They were unable to consider this alternate estimation method, because the model with non-normally distributed residuals typically contained censored data. Similarly for this study, 89 percent of the calibration datasets (55 of 62) for the final models and test scenarios for Ellerbe and Sandy Creeks contained censored data; therefore, the LAD estimation method was not considered further. The final models yielding residuals that did not follow a normal distribution (PPCC p-value <0.05) (table 9) were assumed to be valid for the data evaluations in this study; however, their estimated loads may be less accurate than otherwise reflected by their confidence intervals (Hirsch, 2014; Lee and others, 2016, 2019; Aulenbach and others, 2017).
With the exception of the repeatedly selected model 4 for total P at Ellerbe Creek, the optimal models generally varied by time step and scenario for both sites (table 9). A few patterns were observed. Most of the selected models had explanatory seasonality terms, indicating the need to compensate for intra-annual variability in the data. However, selected models for nitrate and total P at Sandy Creek did not, suggesting that flow alone explained the model variability. Selected nitrate and total N models for scenario A and B at Ellerbe Creek tended to add an explanatory time variable when decreasing the time step from 9 or 12 years to just 5 or 6 years. Selected models for scenario A for TKN and total N at Sandy Creek tended to lose a time variable when decreasing the time step from 9 or 12 years to just 5 or 6 years.
Results of the model selection process indicate that no single model was optimal for changing time steps, sampling scenarios (fixed frequency versus inclusion of targeted high-flow samples), and stream sites. Because nitrate concentrations in streams can be controlled by biological uptake, microbial processes including denitrification, and preferential flow routing (soil and groundwater discharge versus runoff contributions), these natural processes can introduce seasonality and poor fit of the concentration and flow relation into the model (Alexander and others, 2007; Ullrich and Volk, 2010; Sudduth and others, 2013; Aulenbach and others, 2016; Lee and others, 2016). In fact, nitrate sources in Ellerbe Creek were assessed previously and determined to be from both direct runoff (related to impervious surfaces) of atmospherically derived rainwater and soil water discharge (McSwain and others, 2014). Better fit of models existed for the often particulate-dominated total N and TKN than for the other nutrients, probably explained by stronger concentration relations to streamflow. The inclusion or absence of explanatory time variables for constituents with decreasing time step may be attributed to the incorporation or omission of certain hydrologic flow conditions. For example, load tests 1 (2009–20) and 2 (2012–20) included high and low flow periods more representative of climatic variability, whereas load tests 4 (2015–20) and 5 (2016–20) started with semi-lowest flow periods and ended with highest flow period (fig. 3 and table 6), possibly producing a greater high-flow influence and short-term increasing trend in flow over time. Also as mentioned earlier, instantaneous flow at the time of sampling (fig. 4B) could be as much as an order of magnitude different than mean daily flow, increasing variability between constituent and flow relations.
Although nutrient sources were not determined as part of this investigation, groundwater and unregulated point-source discharges of nutrients are factors that could possibly influence the concentration and flow relation. These discharges would have greatest influence in streamwater nutrient concentrations during lower flow conditions compared to runoff during high flow conditions (Robertson and Roerish, 1999; Harden and others, 2013). Some possible influence by these sources could be implied by nitrate + nitrite data displaying more pronounced heteroscedasticity than observed for other nitrogen species in Ellerbe and Sandy Creeks at low- to mid-range streamflows of 0.1–1.0 ft3/s (figs. 9C–E and figs. 10C–E, respectively). Total P data also displayed similar heteroscedasticity at low- to mid-range streamflows in Ellerbe Creek (figs. 9F), but not at Sandy Creek (figs. 10F). Longer-term sample coverage of the higher streamflows that would provide a better representation of the true variance at higher flows may aid in reducing this heteroscedasticity.
Evaluation of Nutrient Load Uncertainties
The SEPs of the mean daily loads estimated with the final regression models were used to evaluate uncertainties in the annual loads for nitrate, TKN, total N, and total P. Results of the load testing scenarios were used to evaluate the influence of monitoring approach and prediction time step on the computed nutrient loads and uncertainties, and for determining which approach(es) were best suited for reducing overall uncertainty in load predictions at each site.
The load tests covered different time steps during the 2009–20 period of study. Each time step had a different beginning year but the same ending year of 2020 (table 6). Test 1 estimated annual loads for the full 12-year period of 2009–20, including the period from 2009 to 2011 with questionable total P results, as previously discussed. Test 2 estimated loads for the 9-year period from 2012 to 2020. Tests 3, 4, and 5 predicted loads for shorter 7-year (2014–20), 6-year (2015–20), and 5-year (2016–20) time steps, respectively. Test 3 was only run for Sandy Creek because no data were available during 2014 for Ellerbe Creek.
For comparison purposes, nonparametric Wilcoxon-Mann-Whitney two-sample tests were applied to ranked mean annual load and SEP data (tables 10 and 11; Harden and others, 2024). The comparison tests were used to determine if differences existed between scenarios A (USGS high-flow and DSS samples) and B (DSS samples only) for all time steps (5–12 years) at each site by nutrient constituent (Helsel and others, 2020). Additionally, a comparison was made of ranked mean annual load and SEP data to determine if differences existed between sites for each scenario by nutrient constituents (table 11).
Table 10.
Summary of mean annual load and standard error of prediction for total Kjeldahl nitrogen, nitrate, total nitrogen, and total phosphorus by load test scenario at Ellerbe and Sandy Creeks, Durham, North Carolina, 2009–20.[TKN, total Kjeldahl nitrogen; kg/d, kilogram per day; SEP, standard error of prediction; N, nitrogen; P, phosphorus, na, not applicable because no final model selected because of unacceptable calibration diagnostics; nd, not determined because no samples were collected at Ellerbe Creek during 2014 for the start of the prediction period]
For more information on load test scenarios, see table 6.
Table 11.
Summary results of the nonparametric Wilcoxon-Mann-Whitney two-sample tests that compared ranked load and standard error of prediction (SEP) data between scenario A (U.S. Geological Survey high-flow and City of Durham Public Works Department, Stormwater Division [DSS] samples) and scenario B (DSS samples only) at each site for all nutrient constituents and time steps; and ranked load and SEP data for each scenario between sites for all nutrient constituents and time steps.[TKN, total Kjeldahl nitrogen; nitrate, nitrate + nitrite; N, nitrogen; P, phosphorus; --, no significant difference at α = 0.05; <, less than; >, greater than; na, not applicable (see footnote)]
Influence of High-Streamflow Samples
Comparison of the test scenario results illustrated the influence of high-flow samples on the load estimates and uncertainties. For all tests having paired scenario A and scenario B results, A tests produced lower mean annual SEPs relative to their paired B tests at Ellerbe and Sandy Creeks (table 10). In other words, the inclusion of high-flow samples with fixed frequency samples decreased the load uncertainties for all nutrient fractions at both Ellerbe Creek (fig. 11) and Sandy Creek (fig. 12). Overall, SEPs increased with higher nutrient loads among the time steps for scenario A at Ellerbe Creek and but were slightly more uniform at Sandy Creek. Additionally, ranges in SEPs for scenario A at Ellerbe Creek and Sandy Creek were more consistent among time steps compared to the SEPs for scenario B. Even when the mean annual load for a constituent at a given time step in scenario A was similar to or higher than that for scenario B (with exception of estimated nitrate loads at Sandy Creek), the corresponding SEPs for scenario B were higher, with some constituents up to 2.0 to 2.8 times higher than scenario A at Ellerbe Creek (total N; table 10 and fig. 11C) and up to 2.5 to 3.2 times higher than scenario A at Sandy Creek (nitrate; table 10 and fig. 12B).
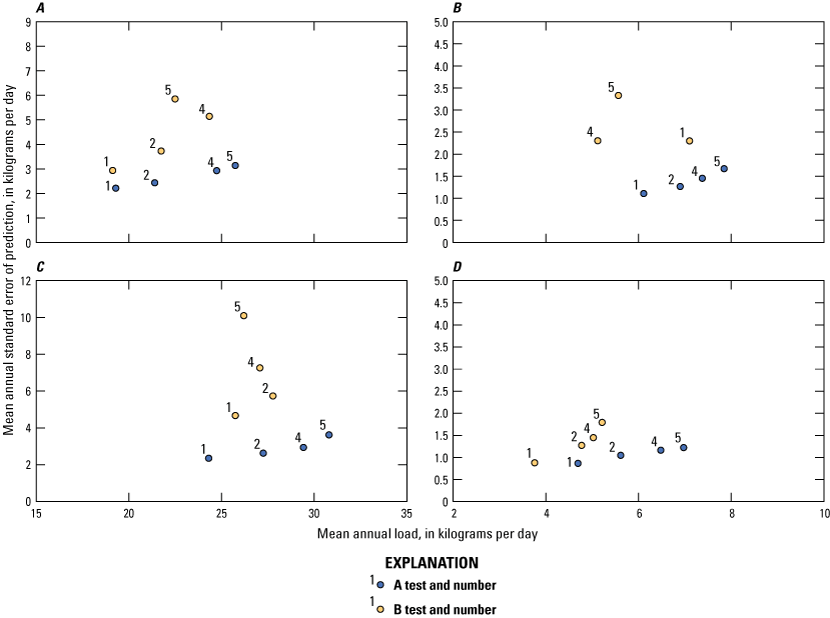
Mean annual load against the mean annual standard error of prediction for A, total Kjeldahl nitrogen, B, nitrate, C, total nitrogen, and D, total phosphorus at Ellerbe Creek in Durham, North Carolina, 2009–20.
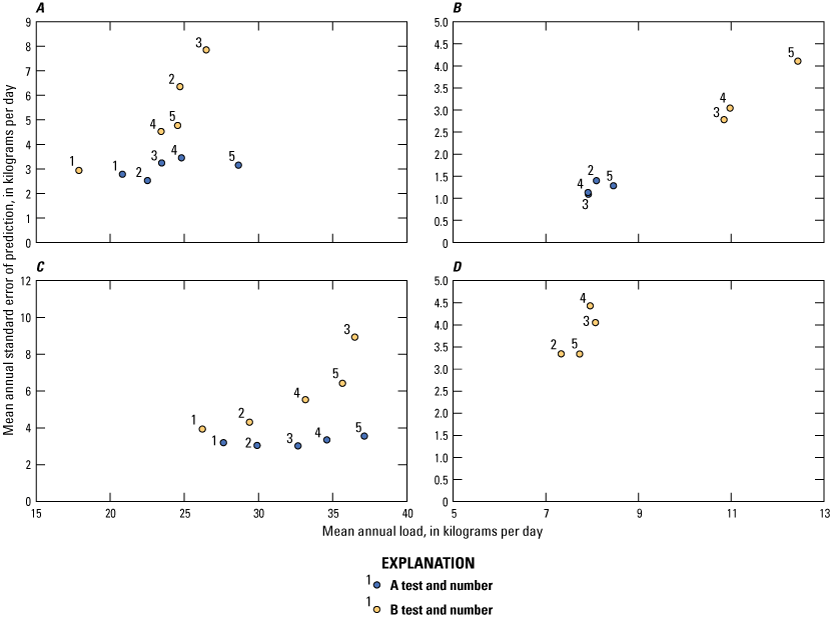
Mean annual load against the mean annual standard error of prediction for A, total Kjeldahl nitrogen, B, nitrate, C, total nitrogen, and D, total phosphorus at Sandy Creek in Durham, North Carolina, 2009–20.
At Ellerbe Creek and Sandy Creek, the mean annual constituent loads were not significantly different among time steps between scenarios A and B, except for nitrate at Sandy Creek, which was statistically lower for the A tests relative to the B tests (table 11). The corresponding SEPs for TKN, nitrate, and total N at both sites were all statistically lower for scenario A compared to scenario B (figs. 11 and 12).
A comparison of scenario A results between Ellerbe and Sandy Creeks indicated that mean annual loads and SEPs were not significantly different for TKN, nitrate, or total N (table 11). However, comparison of scenario B results between the two study sites indicated that the mean annual load for nitrate and both the mean annual load and SEP for total P were statistically higher for Sandy Creek compared to Ellerbe Creek.
The influence of the USGS high-flow samples on the model calibration datasets was reflected by the mean instantaneous streamflows for samples included for each test scenario (table 12). The mean sample streamflow for Ellerbe Creek was about 5.6 times higher for test 1A than for test 1B and increased to about 16.6 times higher for test 5A relative to test 5B. The mean sample streamflow for Sandy Creek was about 4.4 times higher for test 1A than for test 1B and increased to about 10.9 times higher for test 5A relative to test 5B.
Table 12.
Summary of mean instantaneous and annual daily streamflows by load test scenario and time step for Ellerbe and Sandy Creeks in Durham, North Carolina, 2009–20.[ft3/s, cubic foot per second; nd, no data available; na, not applicable]
As previously indicated, 77.2 percent and 71.4 percent of the study period streamflows for Ellerbe Creek and Sandy Creek, respectively, were contributed from the uppermost 10 percent (90–100th percentiles) of daily mean streamflows (table 7). The percentage of days sampled by both DSS and USGS during the highest 10 percent of flows was 17.6 percent for Ellerbe Creek and 19.2 percent for Sandy Creek. These percentages were reduced by more than half when the USGS high-flow samples were not included.
Exclusion of the USGS high-flow samples from the model calibration datasets typically resulted in significantly higher uncertainties in the load estimates. Although individual nutrient loads were relatively similar between calibration files (with or without higher flow samples), the calibration data with higher flow samples were more representative of the observed flows in prediction files, which resulted in lower uncertainties in predicted loads. The calibrated regression models based primarily on lower flow sample data had a higher degree of uncertainty in the estimated loads when extrapolated to the higher flow days in the streamflow prediction files.
Because most instream nutrient transport occurs during periods of higher streamflows, it is important that water-quality samples collected for computing stream nutrient loads are representative of all streamflow conditions at a site, especially for the upper flow regime (Lee and others, 2016; Aulenbach and others, 2017; Lee and others, 2019). The load testing scenario evaluations in this study are in agreement with Lee and others (2016) in that sampling programs that incorporated high-flow samples yielded better estimates of constituent loads having lower uncertainties than sampling programs that did not include high-flow samples.
Influence of Load Prediction Time Step
The test scenario results also were used to examine the influence of prediction time step on the load uncertainties by evaluating changes in mean annual loads and SEPs or 95-percent confidence intervals (developed from SEPs; Runkel, 2013) across time steps. The five prediction time steps reflected different subsets of the overall dataset and included test 1 (all 12 years), test 2 (9 years), test 3 (7 years), test 4 (6 years), and test 5 (5 years).
Thus far, the test evaluations have been based on mean annual loads and SEPs, which represented all the years in the prediction period for an individual test scenario or time step (table 6). Each test scenario represented a different snapshot of the study where, for example, test 1 covered the entire study period of 2009–20 and test 5 covered the last 5 years of the study, 2016–20. The mean annual load and SEP results between the five tests were not expected to be the same because scenarios having smaller time steps contained less record with fewer calibration data points than those with longer time steps and did not adequately represent the annual variability in streamflows throughout the study period. Therefore, smaller time steps can produce increased uncertainty in the load estimation compared to larger, more data-rich time steps.
The following discussion focuses on the year-to-year results for each test scenario (based on different time steps) that were computed for the same 5-year period (2016–20) when all five test scenarios were available (table 6). To better understand the influence of time step used for model calibration and prediction, load estimates and uncertainties for the different time steps were compared for the same year(s). The annual mean loads and their lower and upper 95-percent confidence intervals (L95s and U95s) for each nutrient from 2016 through 2020 are shown by test scenario and time step in figure 13A–D for Ellerbe Creek and figure 14A–D for Sandy Creek. There were no test 3 constituent results for Ellerbe Creek and no scenario A results for total P at Sandy Creek.
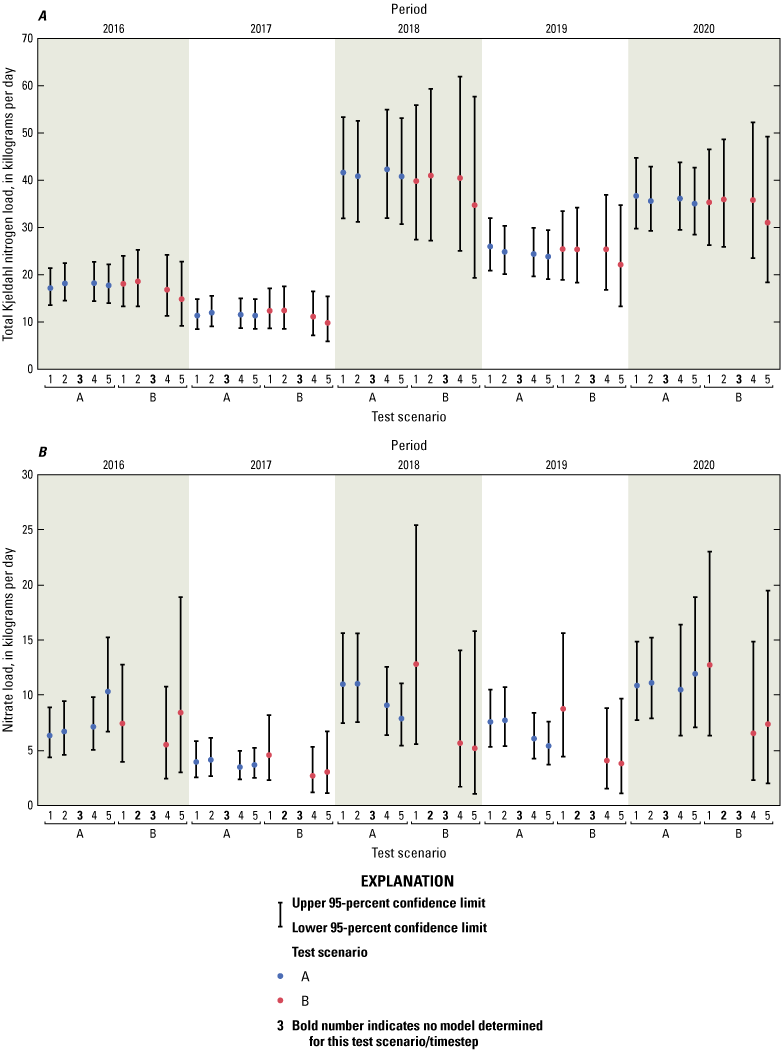
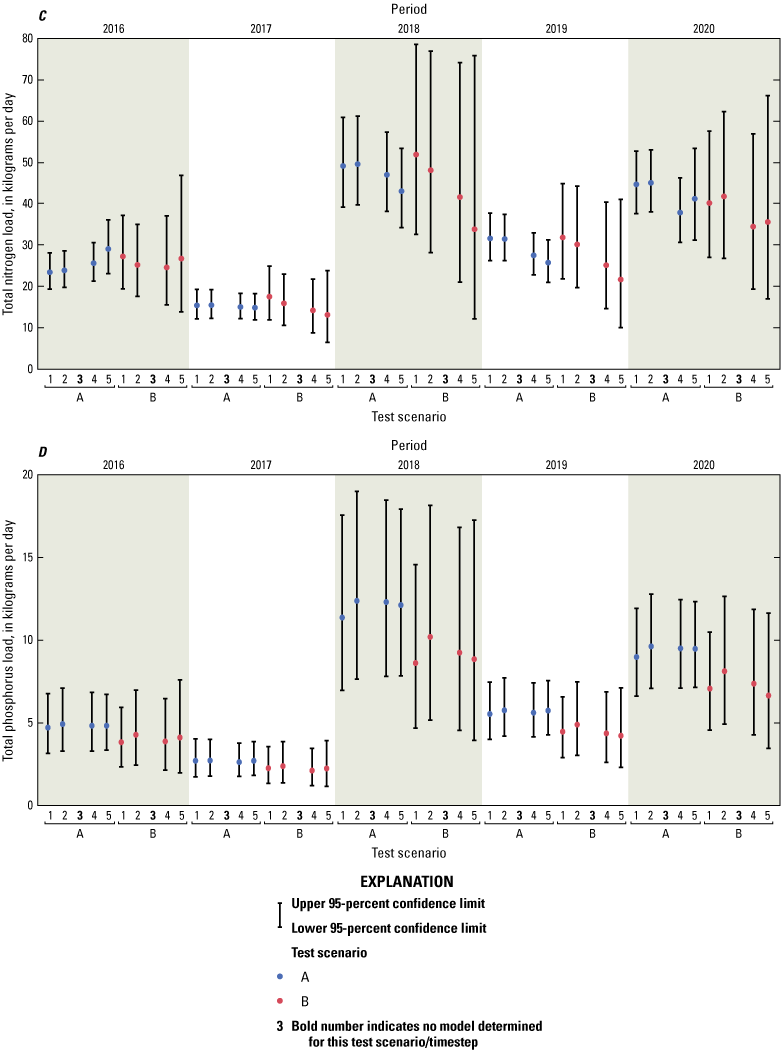
Estimated annual mean load with associated lower and upper 95-percent confidence intervals grouped by year for A, total Kjeldahl nitrogen, B, nitrate, C, total nitrogen, and D, total phosphorus plotted by scenario (A, B) and test (1–5 representing decreasing time step from 12 years to 5 years, respectively) at Ellerbe Creek in Durham, North Carolina, 2016–20.
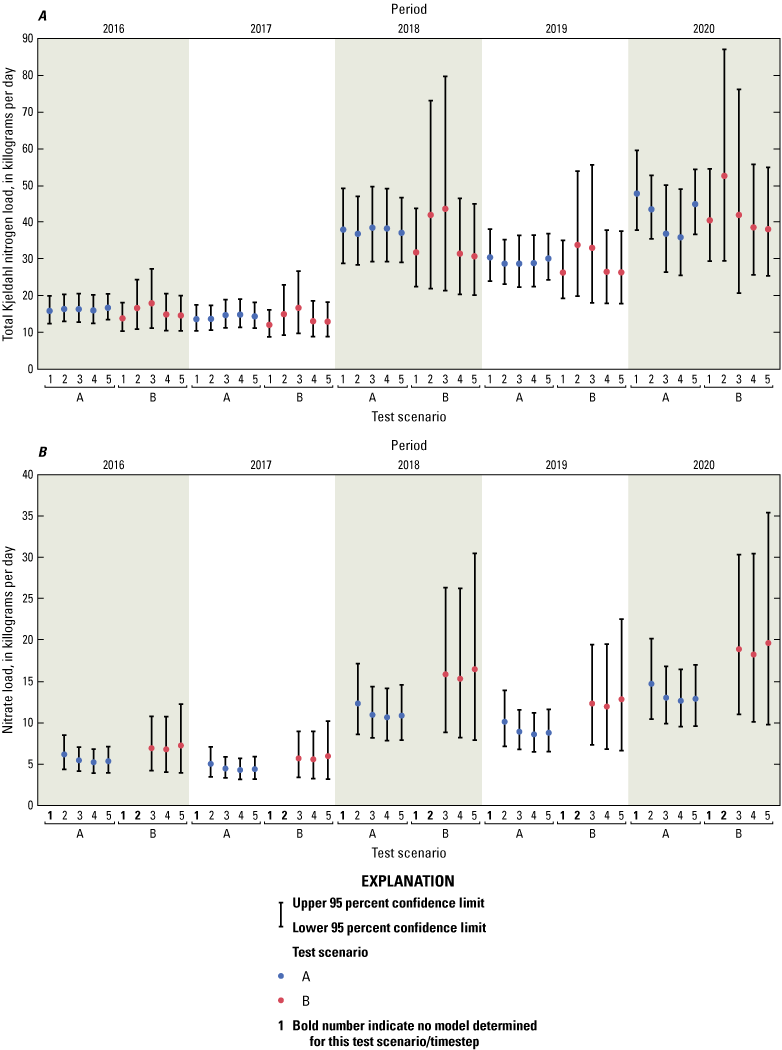
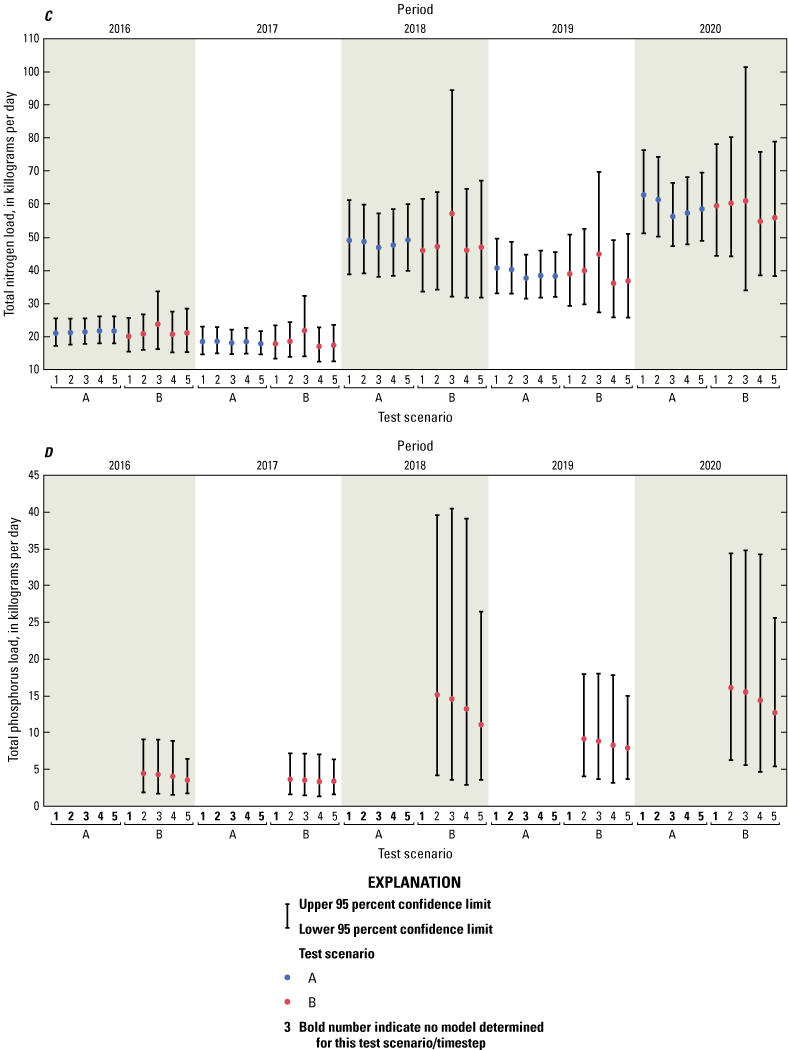
Estimated annual mean load with associated lower and upper 95-percent confidence intervals grouped by year for A, total Kjeldahl nitrogen, B, nitrate, C, total nitrogen, and D, total phosphorus plotted by scenario (A, B) and test (1–5 representing decreasing time step from 12 years to 5 years, respectively) at Sandy Creek in Durham, North Carolina, 2016–20.
Examination of the test results for each site indicates that the confidence intervals of the annual mean nutrient loads overlapped across scenarios A and B for a given year. There was notably higher variability among the loads and wider confidence intervals within a given year for the B tests relative to the A tests at both sites (figs. 13 and 14). For example, at Ellerbe Creek, TKN test 2A for 2018 (fig. 13A) had a mean load of 40.84 kg/d, with an L95 of 31.18 kg/d and U95 of 52.55 kg/d (spread = 21.37). The TKN result for test 2B for 2018 had a mean load of 40.98 kg/d, with an L95 of 27.20 kg/d and U95 of 59.34 kg/d (spread = 32.14). In other cases, large differences were noted for both the mean daily load and confidence intervals between the paired test scenarios. At Sandy Creek for example, nitrate test 3A for 2020 (fig. 14B) had a mean load of 13.02 kg/d, with an L95 of 9.90 kg/d and U95 of 16.83 kg/d (spread = 6.93). The nitrate result for test 3B for 2020 had a mean load of 18.90 kg/d with an L95 of 11.01 kg/d and U95 of 30.35 kg/d (spread = 19.34).
Annual nutrient loads also reflected the variability in mean annual daily mean streamflow (fig. 3, table 13). For the 5-year period of 2016–20, annual daily mean streamflows at Ellerbe and Sandy Creeks were lowest in 2016 and 2017, intermediate in 2019, and highest in 2018 and 2020. Correspondingly, loads of all nutrient fractions were lowest during 2016 and 2017, intermediate in 2019, and highest during 2018 and 2020. Similarly, the confidence intervals were smaller during lower flow years and larger during higher flow years.
Table 13.
Summary of annual daily mean streamflows for Ellerbe and Sandy Creeks, Durham, North Carolina, 2009–20.[ft3/s, cubic foot per second]
Given the higher variability and uncertainties for the scenario B results relative to the scenario A results, only the scenario A results were used to explore potential relations among year-to-year loads for individual nutrients and the length of record, or time step, analyzed. The TKN loads and confidence intervals for both Ellerbe Creek (fig. 13A) and Sandy Creek (fig. 14A) are mostly consistent among the time steps for each year with the exception of 2020 for Sandy Creek.
At Ellerbe Creek, nitrate load and confidence intervals generally increased with decreasing time steps during 2016 and 2020 and decreased with decreasing time steps during 2018 and 2019 (fig. 13B). Although there are no nitrate load results for test 1A at Sandy Creek (fig. 14B), there is a consistent pattern of greater nitrate loads and confidence intervals at the 9-year time step (test 2A) relative to the 7-, 6-, and 5-year time steps (tests 3A to 5A), which could be influenced by the changed LRLs in 2012 (fig. 7D).
The year-to-year total N loads for Ellerbe Creek (fig. 13C) had a similar distribution as described above for nitrate, where for each year the total N loads and confidence intervals tended to be more similar between the 12- and 9-year time steps relative to the 6- and 5-year time steps. For Sandy Creek, the yearly total N loads (fig. 14C) generally followed the consistent pattern noted for TKN (fig. 14A), being relatively uniform among the time steps for years 2016–19 and more variable in 2020. Scenario A data for total P are only available for Ellerbe Creek (fig. 13D), which shows that the annual loads and confidence intervals are mostly consistent across time steps for each year. The total P load confidence intervals are substantially largest during 2018, which had the highest mean annual streamflow (table 13).
The evaluations of the year-to-year test scenario results during 2016–20 indicated how the nutrient load estimates and confidence intervals at Ellerbe and Sandy Creeks varied depending on the time step used for the load model calibrations and predictions. In general, prediction errors for most nutrient fractions tended to be higher for shorter time steps, especially when targeted high-flow samples were not included. Although not a definitive pattern, the longer 12-year and 9-year time steps tended to provide more consistent annual load estimates and lower confidence intervals than the shorter 6- and 5-year time steps. This finding emphasizes the importance of analyzing a study period that adequately represents longer-term variations in streamflow to better understand the temporal variability among annual nutrient loads and uncertainties at the study sites.
Summary and Conclusions
In 2016, the City of Durham Public Works Department, Stormwater Division (DSS) in North Carolina and U.S. Geological Survey (USGS) initiated a collaborative study to evaluate whether alternate monitoring strategies that incorporated samples collected across a broader range of hydrologic conditions will allow DSS to compute more accurate nutrient loads and track progress toward nutrient-management goals with less uncertainty. To achieve those goals, this study evaluated optimal instream nutrient load models for the period of January 2009 to December 2020, computed using the DSS-adopted rating curve estimation approach for Ellerbe and Sandy Creeks, two small, highly urbanized streams in Durham, North Carolina. Nutrient fractions modeled included total Kjeldahl nitrogen (TKN), nitrate, total nitrogen (N), and total phosphorus (P). The study compared two sampling scenarios: DSS routine monthly (fixed frequency) data combined with USGS targeted high-streamflow data (scenario A); and DSS fixed frequency data only (scenario B). Inclusion of targeted higher streamflow in scenario A improved representation of the above normal flow conditions by about 14 percent as compared to scenario B. Additionally, instream load models were evaluated across decreasing time steps (12-, 9-, 7-, 6-, and 5-year ranges) for each scenario to identify changes in uncertainty of the load estimates.
The load estimation process used the R-LOADEST program. Optimal models were selected on the basis of model diagnostics that minimized bias and uncertainty associated with the estimated nutrient loads at each study location. This study expanded model evaluation criteria beyond the automated option in R-LOADEST (best-fit option) that used ranked statistical values for both the Akaike information criterion and the Schwarz posterior probability criterion, to include further evaluation of regression statistics, load bias statistics, and residual analysis plots. Specifically, the calibration diagnostic results, including model “goodness of fit” evaluation criteria (Akaike information criterion, Schwarz posterior probability criterion), normality test of residuals (probability plot correlation coefficient), and bias diagnostics (load bias in percent and the Nash-Sutcliffe Efficiency Index), for all assessed LOADEST regression models were used to select the final, or most optimal, models included in the analysis of nutrient loads for the data test scenarios. Also, the standard error of prediction (SEP) and its associated lower 95-percent and upper 95-percent confidence intervals of the estimated nutrient load from each model were used to assess variability attributed to the model calibration (parameter uncertainty) and unexplained variability about the model (random error).
In some cases, none of the analyzed models (neither automated best fit nor manually selected) for a given constituent and test scenario were deemed appropriate for estimating loads because of poor fits with unacceptable diagnostic results. This was most pronounced for Sandy Creek, where no final models were selected for three of the nitrate tests and six of the total P tests. Most of the final models had positive load bias in percent values, because sums of estimated loads were greater than observed loads, indicating a potential for overestimating loads.
Most of the selected models had explanatory seasonality terms, indicating the need to compensate for intra-annual variability in the data. However, selected models for nitrate and total P at Sandy Creek did not, suggesting that flow alone explained the model variability. Models for the often particulate-dominated total N and TKN exhibited a good fit that can be explained by stronger concentration relations to streamflow. The model selection process revealed that no single model was optimal for changing time steps, scenarios (fixed frequency versus inclusion of targeted high-flow samples), and streams.
At Ellerbe and Sandy Creeks, inclusion of the USGS targeted storm-runoff samples with the DSS fixed frequency samples provided nutrient data for higher flows. These data strengthened concentration versus flow relations for all constituents except nitrate + nitrite. Overall, the uncertainty associated with the nutrient load estimates was lower and less variable for the scenario A tests on the basis of model calibration data that included the high-streamflow samples as compared to scenario B tests, even though estimated nutrient loads generally were similar between scenarios A and B.
The five analyzed time steps reflected different subsets of the overall dataset and included test 1 (all 12 years), test 2 (9 years), test 3 (7 years), test 4 (6 years), and test 5 (5 years). At Ellerbe Creek, both the mean annual loads and SEPs for TKN, nitrate, total N, and total P tended to increase with decreasing time-step length for scenario A tests. Similarly at Sandy Creek, the mean annual loads for TKN and total N also increased with decreasing time-step length for the scenario A tests. Concerning the scenario A results, the estimated nutrient loads tended to be higher for the shorter time steps, suggesting overestimation caused by the greater influence of relatively higher streamflows of the three wettest years (2018–20), and tended to have higher errors, or uncertainties. Therefore, smaller time steps appeared to produce increased uncertainty in the load estimation compared to larger, more data-rich time steps.
Evaluations of the year-to-year estimated nutrient loads for each scenario during 2016–20 indicated the longer 12- and 9-year time steps tended to provide the most consistent annual load estimates and lowest confidence intervals. Conversely, variability in the estimated loads and their associated confidence intervals increased when based on the shorter 6- and 5-year time steps. Inter-annual hydrologic conditions also influenced the load confidence intervals. Confidence intervals were narrower for low streamflow years (2016 and 2017) and larger for high streamflow years (2018 and 2020). Overall, the degree of uncertainty in annual nutrient load estimates improved when targeted high-flow samples were incorporated and longer time steps were used in the loading models. Furthermore, uncertainty tended to be greatest during years with higher streamflows, regardless of the model selected.
References Cited
Appling, A.P., Leon, M.C., and McDowell, W.H., 2015, Reducing bias and quantifying uncertainty in watershed flux estimate—The R package loadflex: Ecosphere, v. 6, no. 12, article 269, p. 1–25, accessed December 21, 2019, at https://doi.org/10.1890/ES14-00517.1.
Aulenbach, B.T., 2013, Improving regression-model-based streamwater constituent load estimates derived from serially correlated data: Journal of Hydrology, v. 503, p. 55–66, accessed December 17, 2023, at https://doi.org/10.1016/j.jhydrol.2013.09.001.
Aulenbach, B.T., Burns, D.A., Shanley, J.B., Yanai, R.D., Bae, K., Wild, A.D., Yang, Y., and Yi, D., 2016, Approaches to stream solute load estimation for solutes with varying dynamics from five diverse small watersheds: Ecosphere, v. 7, no. 6, article e01298, p. 1–22, accessed November 4, 2023, at https://doi.org/10.1002/ecs2.1298.
Aulenbach, B.T., Joiner, J.K., and Painter, J.A., 2017, Hydrology and water quality in 13 watersheds in Gwinnett County, Georgia, 2001–15: U.S. Geological Survey Scientific Investigations Report 2017–5012, 82 p., accessed March 2, 2023, at https://doi.org/10.3133/sir20175012.
City and County of Durham, 2023, Roads—Open data: Durham Open Data Program website, accessed June 11, 2024, at https://live-durhamnc.opendata.arcgis.com/datasets/DurhamNC::roads/about/.
City of Durham Public Works Department, 2019, Annual report—City of Durham NPDES municipal stormwater permit: Durham, N.C., City of Durham, Public Works Department, Stormwater and GIS Services Division, accessed August 2, 2023, at https://www.durhamnc.gov/DocumentCenter/View/33414/FY2019-Durham-NPDES-Annual-Report-small.
City of Durham Public Works Department, 2023, City of Durham Stormwater Management Plan permit number NCS000249: Durham, N.C., City of Durham, Public Works Department, Stormwater Division, accessed August 2, 2023, at https://www.durhamnc.gov/DocumentCenter/View/49864/Stormwater-Management-Plan-2023-PDF?bidId=.
City of Durham, 2024, Water quality data web portal—City of Durham: City of Durham database, accessed March 01, 2021, at http://www.durhamwaterquality.org/.
Cohn, T.A., 2005, Estimating contaminant loads in rivers—An application of adjusted maximum likelihood to type 1 censored data: Water Resources Research, v. 41, no. 7, article W07003, 13 p., accessed February 7, 2022, at https://doi.org/10.1029/2004WR003833.
Guo, Y., Markus, M., and Demissie, M., 2002, Uncertainty of nitrate-N load computations for agricultural watersheds: Water Resources Research, v. 38, no. 10, article 1185, 12 p., accessed June 29, 2023, at https://doi.org/10.1029/2001WR001149.
Harden, S.L., 2015, Surface-water quality in agricultural watersheds of the North Carolina Coastal Plain associated with concentrated animal feeding operation: U.S. Geological Survey Scientific Investigations Report 2015–5080, 55 p., 7 app., accessed January 12, 2022, at https://doi.org/10.3133/sir20155080.
Harden, S.L., Cuffney, T.F., Terziotti, S., and Kolb, K.R., 2013, Relation of watershed setting and stream nutrient yields at selected sites in central and eastern North Carolina, 1997–2008: U.S. Geological Survey Scientific Investigations Report 2013–5007, 47 p., accessed January 12, 2022, at https://pubs.usgs.gov/sir/2013/5007/.
Harden, S.L., Diaz, J.C., and Hamilton, W.B., 2024, Datasets for assessment of nutrient load estimation approaches for small urban streams in Durham, North Carolina, 2009–2020: U.S. Geological Survey data release, https://doi.org/10.5066/P9F0Q501.
Harden, S.L., Fitzgerald, S.A., Wagner, C.R., Bristow, E.L., Loftin, K.A., and Rosen, B.H., 2020, Characterization of water-quality and bed-sediment conditions in Currituck Sound, North Carolina, prior to the Mid-Currituck Bridge construction, 2011–18: U.S. Geological Survey Open-File Report 2020–1031, 67 p., accessed June 29, 2023, at https://doi.org/10.3133/ofr20201031. [Supersedes USGS Open-File Report 2015–1208.]
Helsel, D.R., Hirsch, R.M., Ryberg, K.R., Archfield, S.A., and Gilroy, E.J., 2020, Statistical methods in water resources: U.S. Geological Survey Techniques and Methods, book 4, chap. A3, 458 p., accessed August 8, 2023, at https://doi.org/10.3133/tm4a3.
Hirsch, R.M., 2014, Large biases in regression-based constituent flux estimates—Causes and diagnostic tools: Journal of the American Water Resources Association [JAWRA], v. 50, no. 6, p. 1401–1424, accessed September 18, 2023, at https://doi.org/10.1111/jawr.12195.
Homer, C.G., Dewitz, J.A., Yang, L., Jin, S., Danielson, P., Xian, G., Coulston, J., Herold, N.D., Wickham, J.D., and Megown, K., 2015, Completion of the 2011 National Land Cover Database for the conterminous United States—Representing a decade of land cover change information: Photogrammetric Engineering and Remote Sensing, v. 81, no. 5, p. 345–354, accessed February 4, 2020, at https://www.mrlc.gov/publications.
Journey, C.A., Van Metre, P.C., Bell, A.H., Garrett, J.D., Button, D.T., Nakagaki, N., Qi, S.L., and Bradley, P.M., 2015, Design and methods of the Southeast Stream Quality Assessment (SESQA), 2014: U.S. Geological Survey Open-File Report 2015–1095, 46 p., accessed February 6, 2020, at https://doi.org/10.3133/ofr20151095.
Konrad, C.P., 2022, BFS—A non-linear, state-space model for baseflow separation and prediction: U.S. Geological Survey Scientific Investigations Report 2022–5114, 24 p., accessed August 8, 2023, at https://doi.org/10.3133/sir20225114.
Ledford, S.H., Lautz, L.K., Vidon, P.G., and Stella, J.C., 2017, Impact of seasonal changes in stream metabolism on nitrate concentrations in an urban stream: Biogeochemistry, v. 133, p. 317–331, accessed June 27, 2023, at https://doi.org/10.007/s10533-017-0336-7.
Lee, C.J., Hirsch, R.M., and Crawford, C.G., 2019, An evaluation of methods for computing annual water-quality loads: U.S. Geological Survey Scientific Investigations Report 2019–5084, 59 p., accessed March 7, 2023, at https://doi.org/10.3133/sir20195084.
Lee, C.J., Hirsch, R.M., Schwarz, G.E., Holtschlag, D.J., Preston, S.D., Crawford, C.G., and Vecchia, A.V., 2016, An evaluation of models for estimating decadal stream loads: Journal of Hydrology, v. 542, p. 185–203, accessed February 20, 2023, at https://doi.org/10.1016/j.hydrol.2016.08.059.
Lorenz, D., Runkel, R., De Cicco, L., Watkins, D., and Stachelek, J., 2017, rloadest—USGS water science R functions for LOAD ESTimation of constituents in rivers and streams: U.S. Geological Survey software release, accessed February 20, 2020, at https://github.com/USGS-R/rloadest.
McSwain, K.B., Young, M.B., and Giorgino, M.L., 2014, Using stable isotopes of nitrogen and oxygen to identify sources of nitrate in three creeks, Durham County, North Carolina, 2011–12: U.S. Geological Survey Scientific Investigations Report 2014–5171, 22 p., accessed March 6, 2023, at https://doi.org/10.3133/sir20145171.
Multi-Resolution Land Characteristics Consortium [MRLC], 2019, NLCD 2016 land cover (CONUS): Multi-Resolution Land Characteristics Consortium database, accessed June 11, 2024, at https://www.mrlc.gov/data/.
NC Center for Geographic Information and Analysis [NCCGIA], 2002a, Major hydrography—Waterbodies: NC OneMap website, accessed June 11, 2024, at https://www.nconemap.gov/datasets/nconemap::major-hydrography-waterbodies/about/.
NC Center for Geographic Information and Analysis [NCCGIA], 2002b, Major hydrography—Streams/rivers: NC OneMap website, accessed June 11, 2024, at https://www.nconemap.gov/datasets/nconemap::major-hydrography-streams-rivers/about/.
North Carolina Department of Environmental Quality, 2009, Jordan Lake nutrient strategy—Rules and implementation: North Carolina Department of Environmental Quality web page, accessed January 12, 2022, at https://www.deq.nc.gov/about/divisions/water-resources/water-planning/nonpoint-source-planning/jordan-lake-nutrient-strategy.
North Carolina Department of Environmental Quality, 2011, Falls Lake nutrient strategy—Rules and implementation: North Carolina Department of Environmental Quality web page, accessed January 12, 2022, at https://deq.nc.gov/about/divisions/water-resources/water-planning/nonpoint-source-planning/falls-lake-nutrient-strategy#rules-and-implementation.
North Carolina Department of Environmental Quality, 2020, North Carolina 2020 integrated report [final report]: North Carolina Department of Environmental Quality web page, 1,334 p., accessed January 12, 2022, at https://www.deq.nc.gov/about/divisions/water-resources/water-planning/modeling-assessment/water-quality-data-assessment/integrated-report-files.
North Carolina Department of Environmental Quality, 2023, Certified laboratory listings—Municipal and industrial laboratory types: North Carolina Department of Environmental Quality web page, accessed August 3, 2023, at https://www.deq.nc.gov/about/divisions/water-resources/water-sciences/chemistry-laboratory/laboratory-certification-branch/certified-laboratory-listin gs.
North Carolina Department of Transportation [NCDOT], 2023a, North Carolina Department of Transportation State maintained roads: NC OneMap web page, accessed on June 11, 2024, at https://www.nconemap.gov/maps/NCDOT::ncdot-state-maintained-roads/about/.
North Carolina Department of Transportation [NCDOT], 2023b, North Carolina Department of Transportation city boundaries: NC OneMap web page, accessed on June 11, 2024, at https://www.nconemap.gov/maps/ee098aeaf28d44138d63446fbdaac1ee/about/.
North Carolina Department of Transportation [NCDOT], 2023c, North Carolina Department of Transportation county boundaries: NC OneMap web page, accessed on June 11, 2024, at https://www.nconemap.gov/maps/d192da4d0ac249fa9584109b1d626286/about/.
Patton, C.J., and Kryskalla, J.R., 2011, Colorimetric determination of nitrate plus nitrite in water by enzymatic reduction, automated discrete analyzer methods: U.S. Geological Survey Techniques and Methods, book 5, chap. B8, accessed February 7, 2020, at https://pubs.er.usgs.gov/publication/tm5B8.
Patton, C.J., and Truitt, E.P., 2000, Methods of analysis by the U.S. Geological Survey National Water Quality Laboratory—Determination of ammonium plus organic nitrogen by a Kjeldahl digestion method and an automated photometric finish that includes digest cleanup by gas diffusion: U.S. Geological Survey Open-File Report 00–170, 31 p., accessed February 7, 2020, at https://nwql.usgs.gov/Public/rpt.shtml?OFR-00-170.
Robertson, D.M., 2003, Influence of different temporal sampling strategies on estimating total phosphorus and suspended sediment concentration and transport in small streams: Journal of the American Water Resources Association, v. 39, p. 1281–1308, accessed March 2, 2023, at https://doi.org/10.1111/j.1752-1688.2003.tb03709.x.
Robertson, D.M., and Roerish, E.D., 1999, Influence of various water quality sampling strategies on load estimates for small streams: Water Resources Research, v. 35, no. 12, p. 3747–3759, accessed March 2, 2023, at https://doi.org/10.1029/1999WR900277.
Runkel, R.L., 2013, Revisions to LOADEST, April 2013 [LOADEST update]: U.S. Geological Survey web page, 6 p., accessed February 20, 2020, at http://water.usgs.gov/software/loadest/doc/loadest_update.pdf.
Runkel, R.L., Crawford, C.G., and Cohn, T.A., 2004, Load estimator (LOADEST)—A FORTRAN program for estimating constituent loads in streams and rivers: U.S. Geological Survey Techniques and Methods, book 4, chap. A5, 69 p. [Also available at https://pubs.er.usgs.gov/publication/tm4A5.]
Sharifi, A., Yen, H., Wallace, C.W., McCarty, G., Crow, W., Momen, B., Lang, M.W., Sadeghi, A., Lee, S., Denver, J., and Rabenhorst, M.C., 2017, Effect of water quality sampling approaches on nitrate load predictions of a prominent regression-based model: Water (Basel), v. 9, no. 11, article 895, 15 p., accessed March 2, 2023, at https://doi.org/10.3390/w9110895.
Stenback, G.A., Crumpton, W.G., Schilling, K.E., and Helmers, M.J., 2011, Rating curve estimation of nutrient loads in Iowa rivers: Journal of Hydrology, v. 396, p. 158–169, accessed March 2, 2023, at https://doi.org/10.1016/j.jhydrol.2010.11.006.
Sudduth, E.B., Perakis, S.S., and Bernhardt, E.S., 2013, Nitrate in watersheds—Straight from soils to streams?: Journal of Geophysical Research, Biosciences, v. 118, no. 1, p. 291–302, accessed March 2, 2023, at https://doi.org/10.1002/jgrg.20030.
Ullrich, A., and Volk, M., 2010, Influence of different nitrate—N monitoring strategies on load estimation as a base for model calibration and evaluation: Environmental Monitoring and Assessment, v. 171, p. 513–527, accessed March 2, 2023, at https://doi.org/10.1007/s10661-009-1296-8.
U.S. Census Bureau, 2020, QuickFacts—Durham city, North Carolina; United States: U.S. Census Bureau accessed January 12, 2022, at https://www.census.gov/quickfacts/fact/table/durhamcitynorthcarolina,US/PST045221.
U.S. Environmental Protection Agency [EPA], 1993a, Method 351.2—Determination of total Kjeldahl nitrogen by semi-automated colorimetry (rev. 2.0): Cincinnati, Ohio, U.S. Environmental Protection Agency, Environmental Systems Monitoring Laboratory, Office of Research and Development, 17 p., accessed August 8, 2023, at https://www.epa.gov/sites/default/files/2015-08/documents/method_351-2_1993.pdf.
U.S. Environmental Protection Agency [EPA], 1993b, Method 353.2—Determination of nitrate-nitrite nitrogen by automated colorimetry (rev. 2.0): Cincinnati, Ohio, U.S. Environmental Protection Agency, Environmental Systems Monitoring Laboratory, Office of Research and Development, 17 p., accessed August 8, 2023, at https://www.epa.gov/sites/default/files/2015-08/documents/method_353_2_1993.pdf.
U.S. Environmental Protection Agency [EPA], 1993c, Method 365.1—Determination of phosphorus by semi-automated colorimetry (rev. 2.0): Cincinnati, Ohio, U.S. Environmental Protection Agency, Environmental Systems Monitoring Laboratory, Office of Research and Development, 17 p., accessed February 7, 2020, at https://www.epa.gov/sites/production/files/2015-08/documents/method_365-1_1993.pdf.
U.S. Environmental Protection Agency [EPA], 2009, Industrial stormwater monitoring and sampling—Final draft: U.S. Environmental Protection Agency report EPA 832–B–09–003, 46 p., accessed August 14, 2023, at https://www3.epa.gov/npdes/pubs/msgp_monitoring_guide.pdf.
U.S. Environmental Protection Agency [EPA], 2021, Clean Water Act methods update rule for the analysis of effluent [final rule]: Federal Register, v. 86, no. 95, p. 27226–22760, accessed August 8, 2023, at https://www.federalregister.gov/documents/2021/05/19/2021-09596/clean-water-act-methods-update-rule-for-the-analysis-of-effluent.
U.S. Geological Survey, 2021a, USGS water data for the Nation: U.S. Geological Survey National Water Information System database, accessed January 31, 2021, at https://doi.org/10.5066/F7P55KJN.
U.S. Geological Survey, 2021b, 1/3 arc-second DEM, 3DEP National Elevation Dataset: U.S. Geological Survey database, accessed June 11, 2024, at https://apps.nationalmap.gov/viewer/.
U.S. Geological Survey, [variously dated], National field manual for the collection of water-quality data: U.S. Geological Survey Techniques of Water-Resources Investigations, book 9, 9 chap. (A1–A9), accessed February 20, 2020, at https://pubs.water.usgs.gov/twri9A.
Van Metre, P.C., and Journey, C.A., 2014, The Southeast Stream Quality Assessment: U.S. Geological Survey Fact Sheet 2014–3023, 2 p., accessed February 6, 2020, at https://doi.org/10.3133/fs20143023.
Weaver, J.C., Terziotti, S., Kolb, K.R., and Wagner, C.R., 2012, StreamStats in North Carolina—A water-resources web application: U.S. Geological Survey Fact Sheet 2012–3137, 4 p., accessed February 4, 2020, at https://pubs.usgs.gov/fs/2012/3137/.
Conversion Factors
U.S. customary units to International System of Units
International System of Units to U.S. customary units
Temperature in degrees Celsius (°C) may be converted to degrees Fahrenheit (°F) as follows: °F = (1.8 × °C) + 32.
Temperature in degrees Fahrenheit (°F) may be converted to degrees Celsius (°C) as follows: °C = (°F – 32) / 1.8.
Supplemental Information
Specific conductance is given in microsiemens per centimeter at 25 degrees Celsius (µS/cm at 25 °C).
Concentrations of chemical constituents in water are given in milligrams per liter (mg/L).
Abbreviations
AIC
Akaike information criterion
AMLE
adjusted maximum likelihood estimation
BMP
best management practice
Bp
load bias in percent
DSS
City of Durham Public Works Department, Stormwater Division
E
estimated
EPA
U.S. Environmental Protection Agency
L95
lower 95-percent confidence interval
LAD
least absolute deviation
LRL
laboratory reporting level
N
nitrogen
NPDES
National Pollutant Discharge Elimination System
NSE
Nash-Sutcliffe Efficiency Index
NWIS
National Water Information System
NWQL
National Water Quality Laboratory
P
phosphorus
PPCC
probability plot correlation coefficient
RC
remark code
RPD
relative percent difference
SDWRF
South Durham Water Reclamation Facility
SEP
standard error of prediction
SPPC
Schwarz posterior probability criterion
TKN
total Kjeldahl nitrogen (ammonia plus organic nitrogen, unfiltered)
U95
upper 95-percent confidence interval
USGS
U.S. Geological Survey
For more information about this publication, contact
Director, South Atlantic Water Science Center
U.S. Geological Survey
1770 Corporate Drive, suite 500
Norcross, GA 30093
For additional information, visit
https://www.usgs.gov/centers/sawsc
Publishing support provided by
Lafayette Publishing Service Center
Disclaimers
Any use of trade, firm, or product names is for descriptive purposes only and does not imply endorsement by the U.S. Government.
Although this information product, for the most part, is in the public domain, it also may contain copyrighted materials as noted in the text. Permission to reproduce copyrighted items must be secured from the copyright owner.
Suggested Citation
Harden, S.L., Journey, C.A., and Etheridge, A.B., 2024, Assessment of nutrient load estimation approaches for small urban streams in Durham, North Carolina: U.S. Geological Survey Scientific Investigations Report 2024–5053, 43 p., https://doi.org/10.3133/sir20245053.
ISSN: 2328-0328 (online)
Study Area
| Publication type | Report |
|---|---|
| Publication Subtype | USGS Numbered Series |
| Title | Assessment of nutrient load estimation approaches for small urban streams in Durham, North Carolina |
| Series title | Scientific Investigations Report |
| Series number | 2024-5053 |
| DOI | 10.3133/sir20245053 |
| Publication Date | July 08, 2024 |
| Year Published | 2024 |
| Language | English |
| Publisher | U.S. Geological Survey |
| Publisher location | Reston, VA |
| Contributing office(s) | South Atlantic Water Science Center |
| Description | Report: ix, 43 p.; 2 Data Releases; Database |
| Country | United States |
| State | North Carolina |
| City | Durham |
| Online Only (Y/N) | Y |