Assessment of Fresh Groundwater Discharge and Saline Surface-Water Intrusion at Operable Unit 2, North Chevalier Field Disposal Area (Site 11), Naval Air Station Pensacola, Florida, 2018–22
Links
- Document: Report (11.4 MB pdf) , HTML , XML
- Data Release: USGS Data Release - Specific conductance and fiber-optic distributed temperature sensing data collected at Operable Unit 2, North Chevalier Field Disposal Area (Site 11), Naval Air Station Pensacola, Florida, 2018–2022
- NGMDB Index Page: National Geologic Map Database Index Page (html)
- Download citation as: RIS | Dublin Core
Acknowledgments
The authors thank the following individuals for contributing to the study: Anna Evans, Naval Air Station Pensacola; and Sam Naik, Tetra Tech, Inc.
The first author thanks Scott Prinos (retired), Alan M. Cressler (retired), and Daniel L. Calhoun, U.S. Geological Survey.
Abstract
Site 11 is a former landfill at North Chevalier Field Disposal Area in Operable Unit 2 at Naval Air Station Pensacola, in northwest Florida. Site 11 is adjacent to Bayou Grande, a shallow, tidally influenced, saline estuary of the Pensacola Bay watershed. Federal and Florida regulators have expressed concern that contaminants detected in groundwater beneath the inland parts of Site 11 may discharge to Bayou Grande. In 2017, the Department of Defense, U.S. Navy, Naval Facilities Engineering Systems Command Southeast asked the U.S. Geological Survey to assess the occurrence of fresh groundwater discharge to Bayou Grande at Site 11 and to delineate to the extent practicable the location of groundwater discharge. Between 2018 and 2022, the U.S. Geological Survey used a multiple-lines-of-evidence approach that included a visual method and three physical methods based on the temperature difference between groundwater and surface water to assess groundwater discharge. One of the physically based methods also used the difference in specific conductance between fresh groundwater and brackish to saline surface water. Combined, the data indicate that fresh groundwater from across Site 11 discharges primarily along the shoreline of the northern and northeastern part of Site 11. The data also indicate that saline surface water from Bayou Grande intrudes tens of feet into the shallow aquifer beneath Site 11. The combined data indicate that the interface between fresh groundwater and saline surface water changes over space and time. Any new monitoring wells proposed for installation near the shoreline of Site 11 should include approaches to monitor the changes in the location of the freshwater/saltwater interface. Care would need to be taken to collect any groundwater samples at the correct season and tidal period to provide the highest probability of collecting a representative sample of Site 11 groundwater unaffected by saltwater.
Introduction
Naval Air Station (NAS) Pensacola is an active U.S. Navy (hereafter referred to as “Navy”) installation in coastal Escambia County, Florida. Operations started in 1825 as the Pensacola Navy Yard, and in 1914, NAS Pensacola became the first permanent naval air station in the United States. Past operations generated wastes that resulted in soil and groundwater contamination. In 1989, NAS Pensacola was placed on the U.S. Environmental Protection Agency’s (EPA’s) National Priorities List of contaminated sites. One of these sites is located in Operable Unit 2 and is a former landfill called Site 11, or the North Chevalier Field Disposal Area. Site 11 is located adjacent to Bayou Grande (fig. 1), a shallow, brackish to saline, tidally affected estuary of the Pensacola Bay watershed.
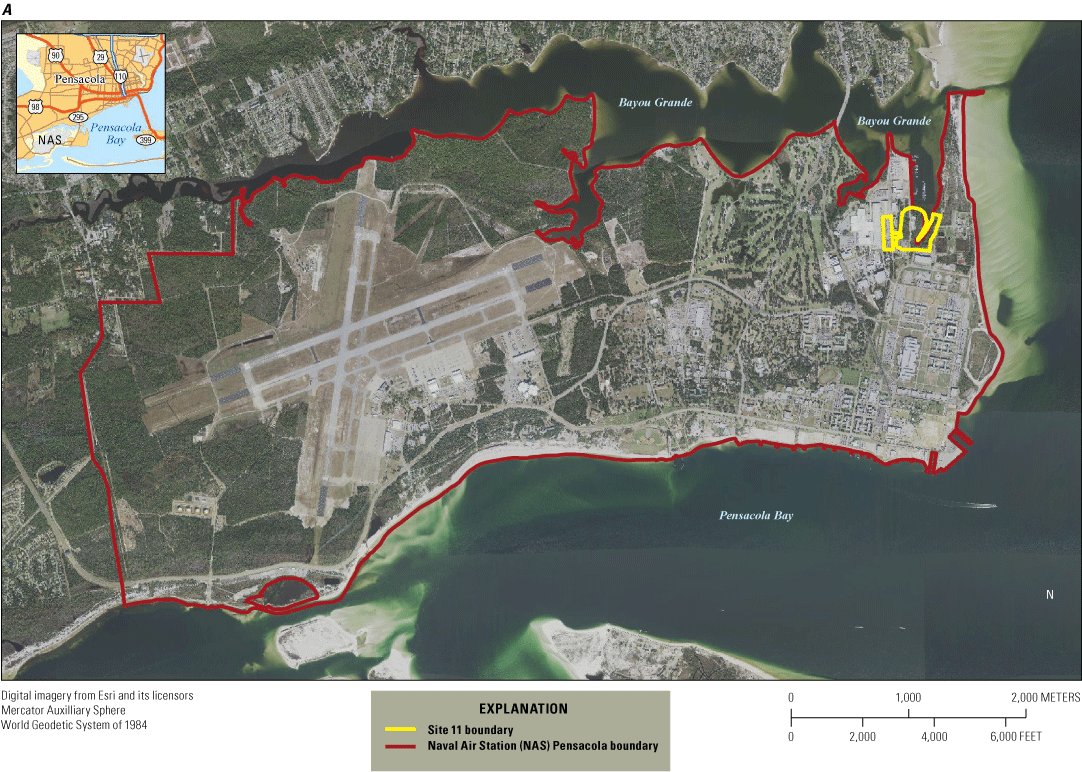
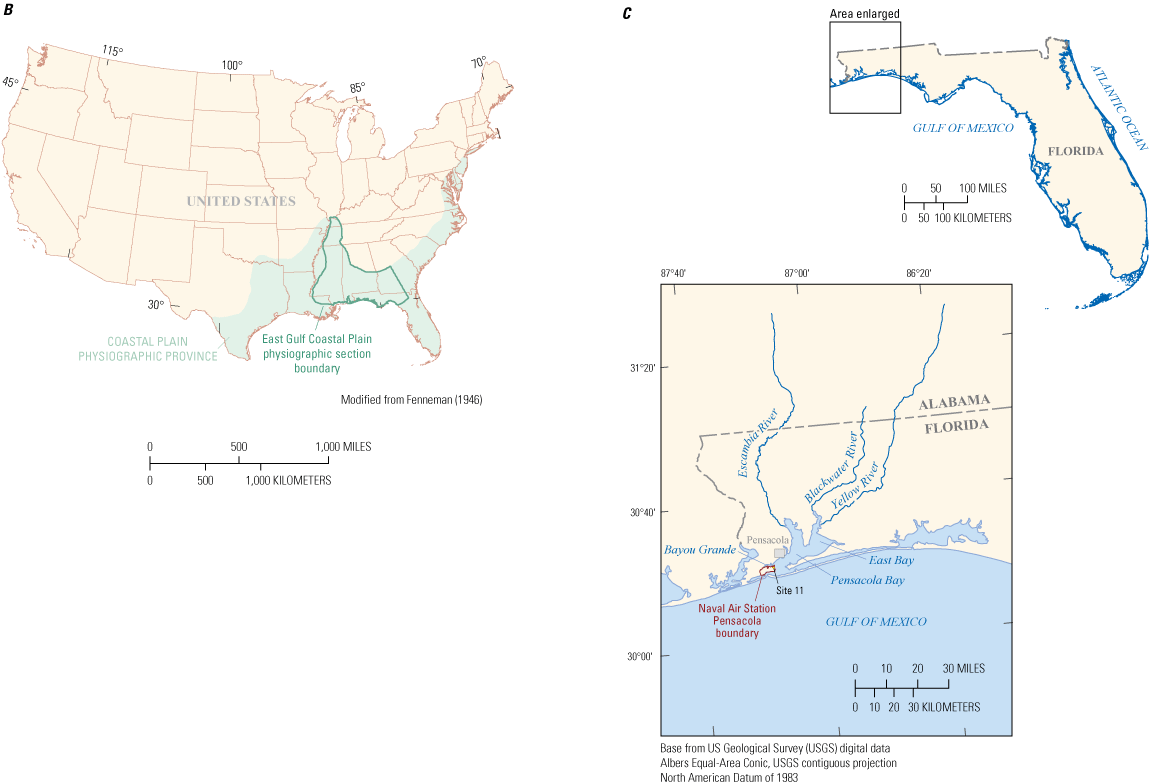
A, Extent of Naval Air Station Pensacola, Site 11, Bayou Grande, and Pensacola Bay (modified from Tetra Tech, 2016), B, the East Gulf Coastal Plain physiographic section and Coastal Plain physiographic province, and C, Escambia County and streams mentioned in this report.
The former landfill operated from the late 1930s to the mid-1940s and accepted industrial and municipal wastes, including fuels, solvents, and waste aircraft engine oil. These wastes, along with construction debris, were added along the shoreline with Bayou Grande and may, in some places, have extended the landfill into Bayou Grande. Wastes were also burned onsite. The Navy’s Installation Restoration Program has conducted multiple investigations of soil and groundwater at Site 11 since 1991 to determine any environmental impacts. Briefly, groundwater contains detectable concentrations of benzene, 1,1-dichloroethene (1,1-DCE), 1,2-dichloroethane, cis-1,2-DCE, dieldrin, 1,1,2,2-tetrachloroethane, tetrachloroethylene, trichlorethylene, vinyl chloride, naphthalene, aldrin, aluminum, barium, beryllium, cadmium, chromium, manganese, and vanadium at levels that exceeded the Florida Department of Environmental Protection (FDEP) maximum contaminant levels (Florida Department of State, 2004; Tetra Tech, 2008; U.S. Navy, 2015; Tetra Tech, 2016).
Because of the contamination detection and proximity of Site 11 to Bayou Grande (fig. 1), the FDEP and EPA Region 4 suggested the Navy take additional steps to locate groundwater discharge areas, called seeps, as part of the Navy’s overall long-term groundwater monitoring program and to support the selected cleanup remedy of monitored natural attenuation for Site 11 (Tetra Tech, 2008, 2016). Once identified, the locations of seeps could help guide the locations of potential monitoring well installation that would provide groundwater samples representative of Site 11 groundwater. In 2017, the Department of Defense, Naval Facilities Engineering Command Southeast, asked the U.S. Geological Survey (USGS) to assess the location of seeps, as well as diffuse discharge areas, at the boundary between Site 11 and Bayou Grande.
Purpose and Scope
The purpose of this report is to document the field methods and results of an assessment of fresh groundwater discharge and saline surface-water intrusion at Site 11, NAS Pensacola, Florida. The field assessment took place from 2018 to 2022 and multiple field methods were used to locate where fresh groundwater from Site 11 discharges to the saline Bayou Grande. This information can be used to provide guidance for determination of locations for potential monitoring wells at the boundary between Site 11 and Bayou Grande.
The scope of the field methods comprised (1) a survey of visible groundwater seepage, (2) handheld thermal imaging camera surveys, (3) a 4-day fiber-optic distributed temperature sensing (FO-DTS) survey, and (4) temporary installation of temperature-specific conductance sensors with data loggers in the shallow aquifer along transects at six locations leading from Site 11 to the shoreline boundary with Bayou Grande. During the field activities, visual observations were made of the relation between existing natural vegetation and surface and groundwater salinity.
Previous Investigations
Since 1991, multiple remedial investigations and feasibility studies have been conducted by the Navy at Site 11 to meet the requirements of State and Federal regulations. The investigations revealed that soils at Site 11 were characterized by detections of metals, total recoverable petroleum hydrocarbons, volatile organic compounds, polycyclic aromatic hydrocarbons (PAHs), and phenol (Tetra Tech, 2016). Subsequent investigations confirmed that contaminants were present in the surficial aquifer. Samples of groundwater collected in 2003 indicated the following compounds were detected at levels that exceeded the FDEP maximum contaminant levels: benzene, 1,1-DCE, 1,2-DCA, cis-1,2-DCE, dieldrin, 1,1,2,2-tetrachloroethane, tetrachloroethylene, trichlorethylene, vinyl chloride, naphthalene, aldrin, aluminum, barium, beryllium, cadmium, chromium, manganese, and vanadium. Groundwater samples collected from monitoring wells installed in wetlands closer to the shoreline of Bayou Grande contained organic and inorganic compounds (Tetra Tech, 2016).
An initial investigation of the potential for groundwater from Site 11 to discharge to Bayou Grande was conducted in November 2008 by the Navy’s Space and Naval Warfare Systems Command (SPAWAR) Systems Center Pacific (SPAWAR, 2010). In brief, the investigators used the Trident and UltraSeep methods (Chadwick and others, 2003) to evaluate the presence or absence of groundwater discharge at various locations along the shoreline of Site 11 and Bayou Grande as well as some distance from the shoreline in the middle of the basin. The Trident method comprised a probe that contained specific conductance and temperature sensors that was pushed 3 feet (ft) into the sediments at the bottom of Bayou Grande at various locations. Because Bayou Grande is saline, any measurement of low specific conductance was used to indicate areas of fresh porewater and, therefore, groundwater discharge. The SPAWAR (2010) study indicated that groundwater discharge was restricted to nearshore areas only on the eastern side of Site 11, as indicated by specific conductances of 0 to less than (<) 5,000 microsiemens per centimeter at 25 degrees Celsius (μS/cm at 25 °C) in figure 2. The presence of saline water (10,000 to <30,000 µmS/cm, fig. 2) at the locations on the northern shoreline near the seawall represented the landward intrusion of saline surface water in this topographically lower area at the time of the study. The UltraSeep method was used to measure the seepage rate at the few locations where groundwater discharge was discovered (0 to <5,000 μS/cm, fig. 2). The average rate of seepage measured at one shoreline location was <1 centimeter per day, and the highest rates were observed during low tide when groundwater levels in the shallow aquifer of Site 11 were higher than surface-water levels (SPAWAR, 2010).
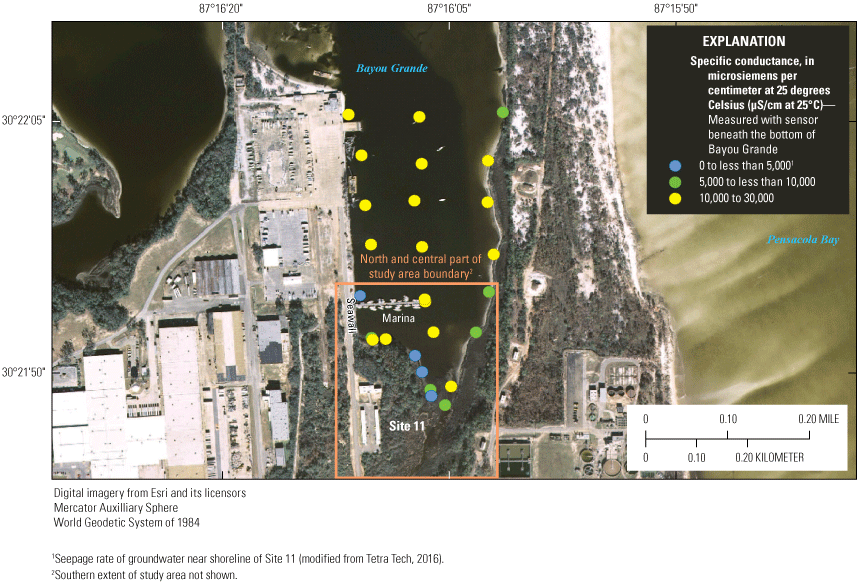
Locations of specific conductance measured 3 feet below the bottom of Bayou Grande, Naval Air Station Pensacola, November 2008, using the Trident method (modified from Tetra Tech, 2016).
Feasibility studies performed to identify and implement corrective actions at Site 11 included methods to restore soil and groundwater. Contaminated soil at Site 11 was removed in some areas and replaced with clean fill (Tetra Tech, 2016) and land use controls developed and implemented. Existing groundwater contamination is being addressed using long-term monitoring to support the selected cleanup remedy of monitored natural attenuation (Tetra Tech, 2008, 2016).
Description of the Study Area
Site 11 encompasses about 20 acres and was a former landfill that operated from the late 1930s to the mid-1940s and accepted industrial and municipal wastes that included fuels, solvents, and waste aircraft engine oil. Wastes were disposed along the western shoreline of Bayou Grande and, in some places, waste disposal extended into Bayou Grande. Wastes were also reportedly burned onsite. Figure 3 shows the part of Site 11 adjacent to Bayou Grande that is the focus of this study.
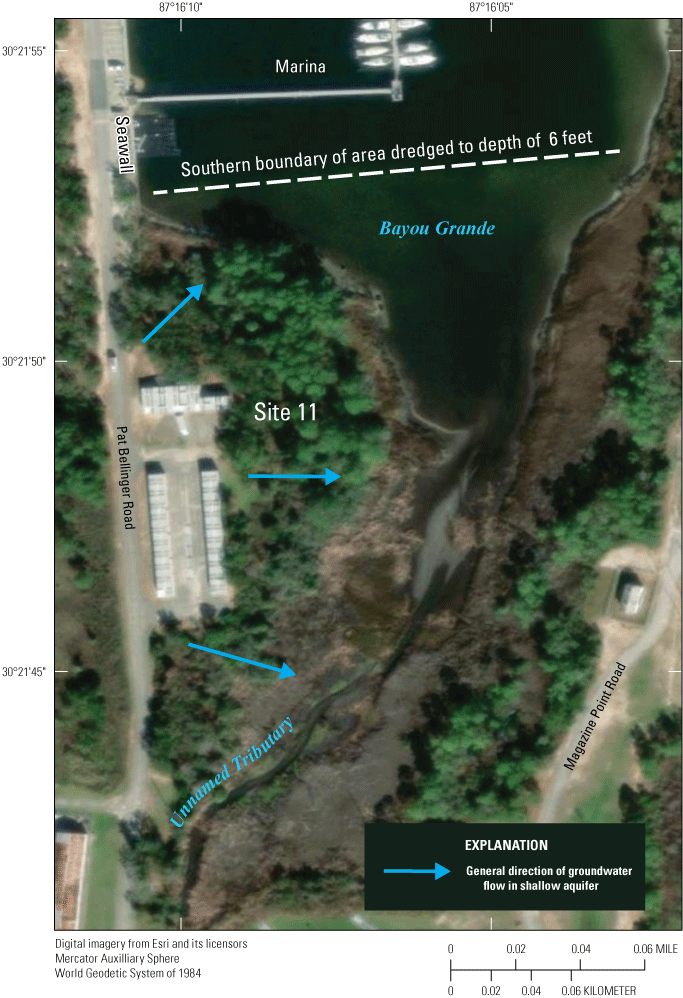
Study area of Site 11 described in this report and Bayou Grande, Naval Air Station Pensacola, and generalized direction of groundwater flow in the shallow aquifer. The greater depth of surface water north of the dredging boundary line is indicated by the darker color of surface water.
Climate
The study area has a climate that is generally humid and subtropical, with warm summers and mild winters, owing to the subtropical latitude of the area and its proximity to the Gulf of Mexico. For the period 1981–2010, the mean maximum temperature at the National Weather Service Forecast Office, Mobile/Pensacola Station, was 89.9 degrees Fahrenheit (°F) (in July), and the mean minimum temperature was 41.6 °F (in January) (the station is located about 63 miles to the northwest of the study area; Northwest Florida Water Management District [NWFWMD], 2016). The average annual precipitation is approximately 65 inches (in.) (NWFWMD, 2016, 2017). The wet season occurs in the summer and fall (June–November) and the dry season occurs in the winter and spring (December–May). During the fall, hurricanes can cross the study area and produce copious precipitation amounts, in some cases up to 20 in. within a single day.
Physiography
NAS Pensacola is located in the East Gulf Coastal Plain physiographic province and the northwestern panhandle of Florida (fig. 1B). The area is characterized by some of the highest elevations in Florida, with gently rolling hills, plateaus, and deeply incised valleys uncharacteristic of most of Florida (Bryan and others, 2008).
Geology and Hydrogeology
Altitude across Site 11 ranges from mean sea level (msl) at the shoreline with Bayou Grande (fig. 3) to between 5 and 8 ft above msl across inland parts of the former landfill (Tetra Tech, 2016). The surficial geology of Site 11, prior to its use as a landfill, comprised fluvial to marine terrace deposits of predominantly very fine- to very coarse-grained sands of the Pliocene Citronelle Formation and Holocene to Pleistocene age undifferentiated alluvium and terrace sediments (Hayes and Barr, 1982) (fig. 4). These deposits extend to a depth of about 40 ft below ground surface across Site 11 and beneath Bayou Grande and, where saturated, compose the surficial zone of the Sand and Gravel aquifer, referred to in this report as the shallow water-table aquifer. These sediments are underlain by Miocene age lower-permeability sandy clay of marine origin (Pensacola Clay) that acts as a regionally extensive confining bed.
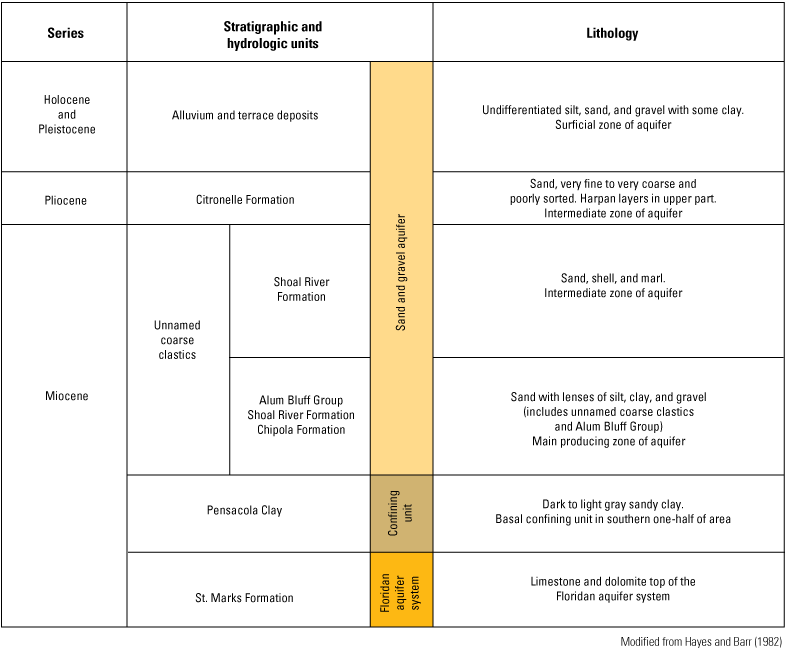
Generalized stratigraphic column for the natural conditions at Site 11, Naval Air Station Pensacola, and beneath Bayou Grande. Modified from Hayes and Barr (1982).
Hydrology
Site 11 is adjacent to Bayou Grande (fig. 3), a small part of the much larger Pensacola Bay system that receives drainage from the Escambia, Blackwater, East Bay, and Yellow Rivers (fig. 1C) (EPA, 2004; NWFWMD, 2016). The estuarine waters of Pensacola Bay have only one tidal cycle per day, a very low tidal range (often less than 2 ft), and an average flushing time of 18 days (NWFWMD, 2016).
The average depth of Bayou Grande is about 9 ft. The bottom sediment of Bayou Grande includes the surficial alluvial and terrace sediments also found beneath Site 11 (fig. 4). In some areas of Bayou Grande (fig. 3), the bottom sediments are dredged to a maintained depth of 6 ft below msl, such as at the Navy’s Bayou Grande marina (sailing facility) (figs. 2 and 3), to accommodate the fixed keels of sailboats, or deeper, such as in the channel leading into Bayou Grande from Pensacola Bay. All navigational dredging activities in Florida must be approved by the FDEP Environmental Resource Permit Program, NWFWMD, and the U.S. Army Corps of Engineers, through a submerged lands/Federal dredge and fill permit. The dredging is of relevance to this current (2024) report, because no adverse environmental impact or water-quality degradation was expected to result from maintenance dredging of the channel on a 10-year interval (refer to NWFWMD permit no. 17-0283173-001-DE, March 6, 2009), or has been observed during dredging.
Bayou Grande is the local base level for groundwater at Site 11, because groundwater levels measured in monitoring wells screened in the shallow water-table aquifer across the landfill are higher than the water level of Bayou Grande, even during high tide (fig. 3; Tetra Tech, 2016). Bayou Grande also is the regional discharge area for the shallow water-table aquifer at NAS Pensacola (EPA, 2004). This scenario between recharge and discharge based on water altitude differences will occur if the surface-water feature comprises fresh or saline water. An additional consideration is warranted, however, where the surface-water body is saline, because the denser surface water can move inland against the prevailing seaward hydrologic gradient. For example, under conditions of steady state such as during slack tide, for every 1 ft of groundwater altitude above msl, the depth to saline water below msl is approximately 40 ft, as theorized by Gyhben (1889) and Herzberg (1901), called the Gyhben-Herzberg principle. As a result, denser saline water can intrude landward into an aquifer; the fresh groundwater will actually float on the heavier saline water beneath. In theory, no groundwater can discharge from the aquifer under such static conditions; the coastline, in effect, becomes an impermeable no-flow boundary, much like where aquifers contact impermeable clay or crystalline rock. In reality, however, there is a zone of diffusion and mechanical mixing, rather than a sharp interface, the width of which is a function of the aquifer properties, recharge rate, and the tidal height and frequency (Barlow, 2003). Assessment of the approximate vertical and horizontal locations of fresh groundwater discharge and saline surface-water intrusion at Site 11 is the focus of the methods described in the next section.
Methods
Multiple methods were used to assess fresh groundwater discharge and saline surface-water intrusion at Site 11 during 2018–22. The methods comprised (1) a survey of visible groundwater seepage, (2) handheld thermal imaging camera surveys, (3) a 4-day FO-DTS survey, and (4) temporary installation of temperature and specific conductance sensors with data loggers along six transects perpendicular to the shoreline of Bayou Grande.
Visible Groundwater Seepage Survey
Evidence of visible groundwater seepage was obtained during walking surveys along the shoreline of Site 11 and Bayou Grande (fig. 5) during low tide each morning of March 13–16, 2018. The surveys were done during low tide because the lower surface-water level would expose previously submerged shoreline sediment and present any groundwater seepage. A single low tide was recorded each day between 07:00 and 08:00 a.m. central daylight time. No precipitation occurred during the surveys. Locations of visible (focused) groundwater seepage were flagged and georeferenced with a hand-held Global Positioning System (GPS) unit. Where seepage was observed, a 1-ft-long, 1-in.-diameter stainless-steel-screened drivepoint was pushed into the seep a few inches and the temperature and specific conductance were measured using a calibrated temperature and specific conductance sensor. The sensor was then removed and rinsed with distilled water and placed in Bayou Grande and measurements were recorded for comparison. The presence or absence of any chemical odor, sheen, or iron flocculation also was noted. Diffuse groundwater discharge was noted as uniformly wet sediments located above the surface-water level not attributed to wave action.
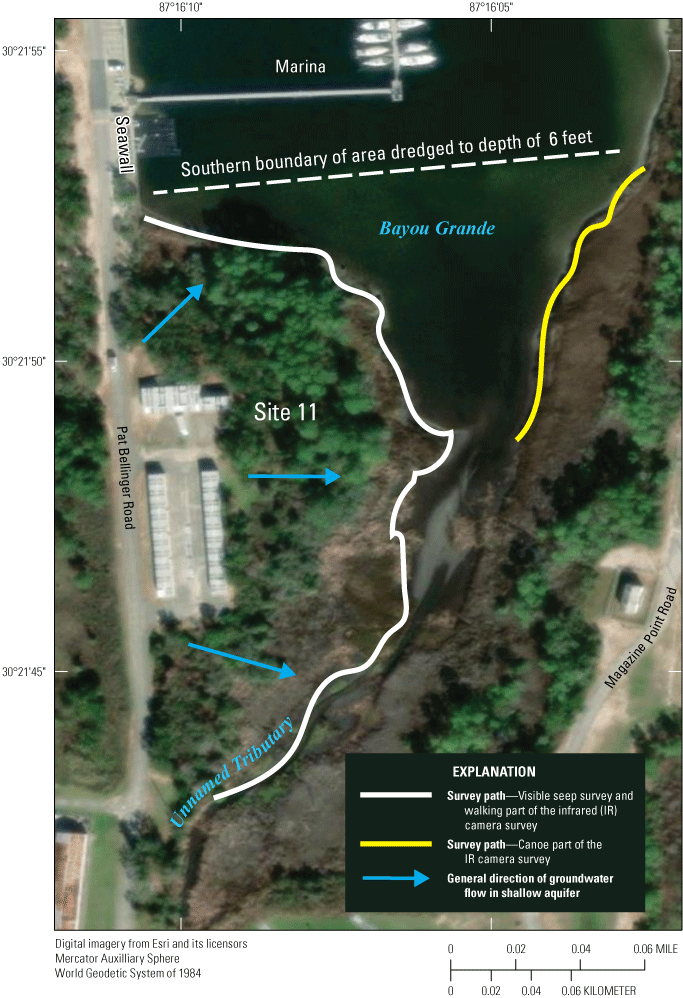
Study area of Site 11 described in this report and Bayou Grande, Naval Air Station Pensacola, including paths of visible seep surveys and infrared (IR) camera survey.
Handheld Thermal Imaging Camera Surveys
Following the visible seep survey, two temperature-based surveys were conducted on March 13–14, 2018, using a FLIR i5 compact infrared (IR) camera. The FLIR i5 camera is a high-resolution, handheld thermal imaging device. According to the manufacturer’s specifications, the camera is able to resolve differences in surface temperatures of objects with a precision of 0.1 degree Celsius (°C). Although not developed to resolve differences in the surface temperature of water, the IR camera is used by hydrologists to characterize thermal anomalies in streams and lakes, including the discharge of groundwater to surface-water bodies (Stonestrom and Constantz, 2003). In essence, temperature can be used as a visible tracer of groundwater input, especially where colder groundwater discharges to warmer surface water, or warmer groundwater rises through colder surface water. Temperature-based methods are useful to investigate interactions between groundwater and surface water because groundwater tends to have a more constant temperature than surface water. The temperature data are displayed in real time as a high-color image on a liquid crystal display (LCD) screen of the camera, such that warmer water can be represented by warmer (red) colors and cooler water can be represented by cooler (blue) colors. Snapshots of significant temperature anomalies related to the flagged seeps were taken with the same camera.
The first IR camera survey was done on March 13, 2018, by walking along the same pathway used for the visible seep survey (fig. 5). The second survey was done on March 14, 2018, by canoe to access the eastern part of Bayou Grande that was not walkable or wadable (shoreline parallel to Magazine Point Road, fig. 5). Both surveys used the IR camera to measure and record the surface temperature of water in Bayou Grande or the seeps at the exposed shoreline. Multiple, longer distance scans of the surface water across the marina and Bayou Grande were done during both surveys in an attempt to detect large anomalies in surface temperature that might indicate upwelling of warmer groundwater farther offshore.
Fiber-Optic Distributed Temperature Sensing Survey
Whereas the other two methods were useful to locate visible seeps at one particular location and time, the FO-DTS method was used to measure temperatures over a much larger space and time period. The FO-DTS method is performed using a cable, energy source (batteries), and data logger. The method, in brief, is based on the physics of light and spectroscopy. A light source is connected to a cable that contains two parallel strands of fiber-optic cable (fig. 6). The light source contains a laser that emits a 10-nanosecond, 1-meter (m) long pulse of light (or photon). The photon travels down one fiber-optic strand and returns on the other strand. As the light travels back to its source, some light gets scattered because of differences in the temperature of the cable. The data logger (Oryx) is also attached to the cable and records the light scatter. The data are used to determine the temperature at each meter along the cable, and the amount of time it takes the photon to travel indicates where each temperature reading is made. Additional information on FO-DTS and its application to groundwater/surface-water investigations can be found in Henderson and others (2009), Slater and others (2010), Hare and others (2015), Briggs and others (2016), Irvine and others (2016), Rosenberry and others (2016), Antolino (2019), Leaf (2020), and Moridnejad and others (2020).
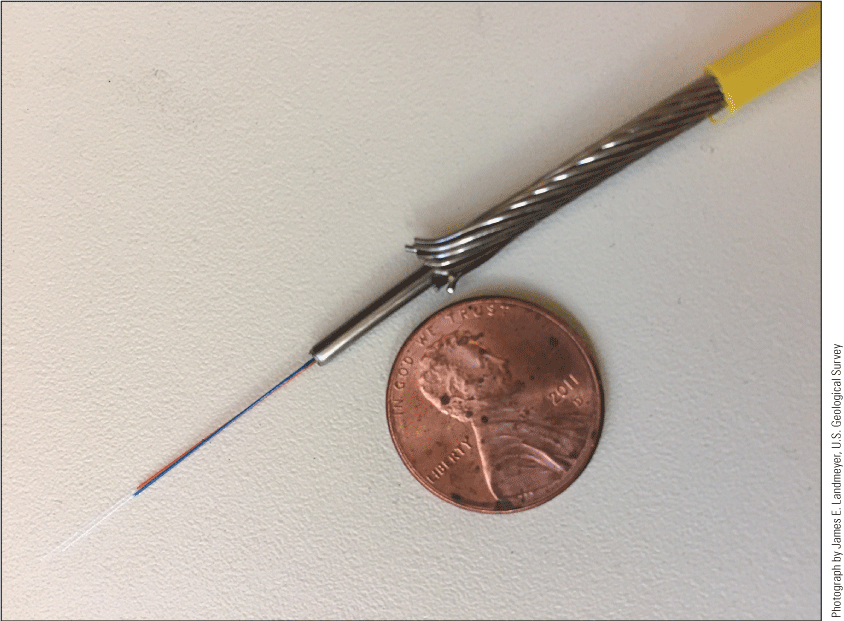
Two strands of white fiber-optic cable housed within a larger armored cable covered with a protective layer of yellow plastic.
The FO-DTS survey was performed during March 13–16, 2018, by a five-person USGS team. The time of deployment was chosen to capitalize on the maximum temperature difference between groundwater (warmer) and surface water (cooler) that would be expected to occur during the relatively cold month of March. The fiber-optic cable was contained on a spool that was placed on an inflatable raft (fig. 7) and the cable unrolled during a rising tide. The cable was laid parallel to the exposed shoreline (referred to as the “nearshore cable” portion) then doubled back about 5 to 8 ft offshore under water (referred to as the “offshore cable” portion) (fig. 8). The cable was placed over visible seeps where possible (fig. 9). The cable was laid across the shoreline, exiting Bayou Grande (fig. 8), and run over land, through an ice-filled cooler, and then attached to the Oryx data logger (fig. 10). Having the last part of the cable in ice provided quality assurance/quality control data to calibrate the environmental temperature readings from the cable. Notes were collected after the cable was deployed to record important locations (waypoints), such as the previously flagged visible seeps, locations where the cable was exposed during low tide, and where the cable was looped back (fig. 11). At each waypoint, the depth of the cable beneath the water surface was recorded by means of a temporary handheld staff gage and the latitude and longitude was recorded. The inflatable raft was used at the end of the survey to retrieve the cable back onto the spool. The temperature data collected along the cable were processed for visualization, summary statistics, and interpretation using the USGS post-processing code DTSGUI (Domanski and others, 2019).
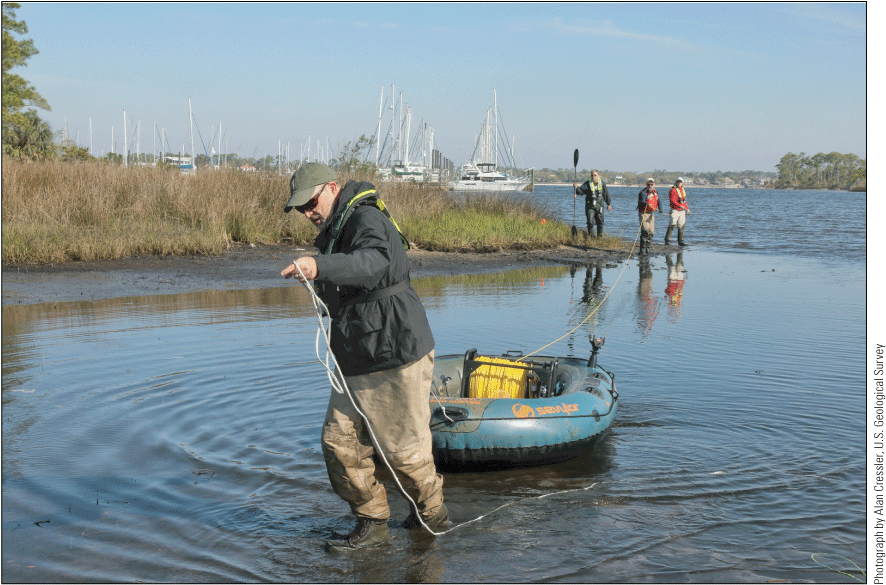
The unspooling of the fiber-optic cable from the raft in Bayou Grande.
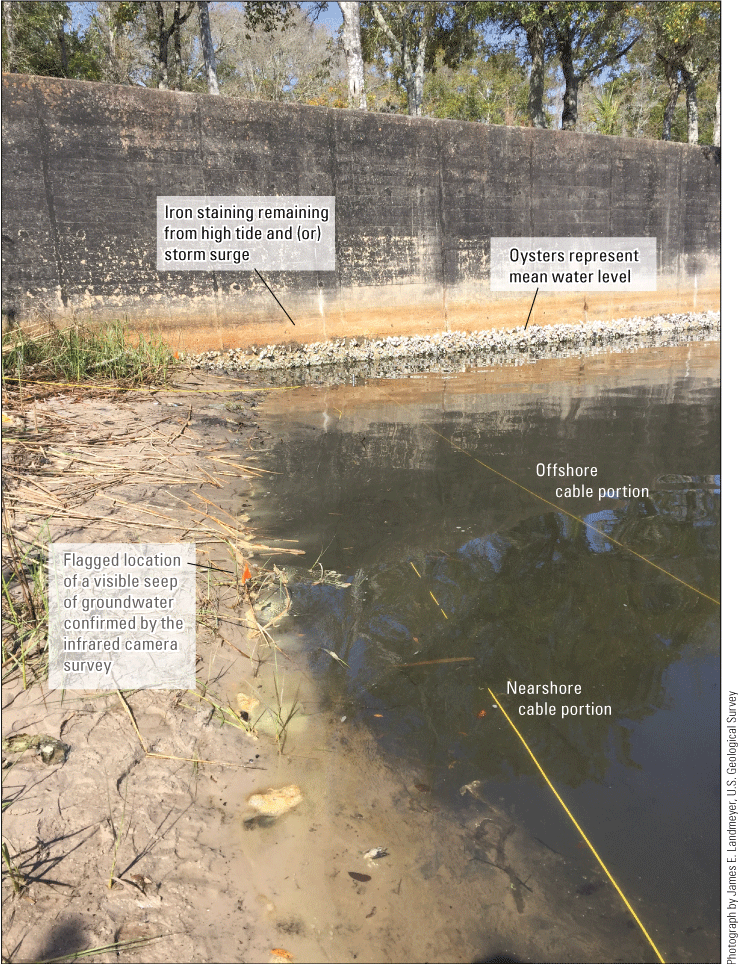
The inner (nearshore) and outer (offshore) portions of the yellow fiber-optic cable during low tide in Bayou Grande. The photograph also shows the beginning (nearshore cable portion) and end (offshore cable portion) locations of the fiber-optic distributed temperature sensing survey; the latter is shown where the cable exits Bayou Grande near the seawall along Pat Bellinger Road (fig. 3). The cable extends over land to the data logger (not shown). The height of high tide is shown as iron staining on the seawall.
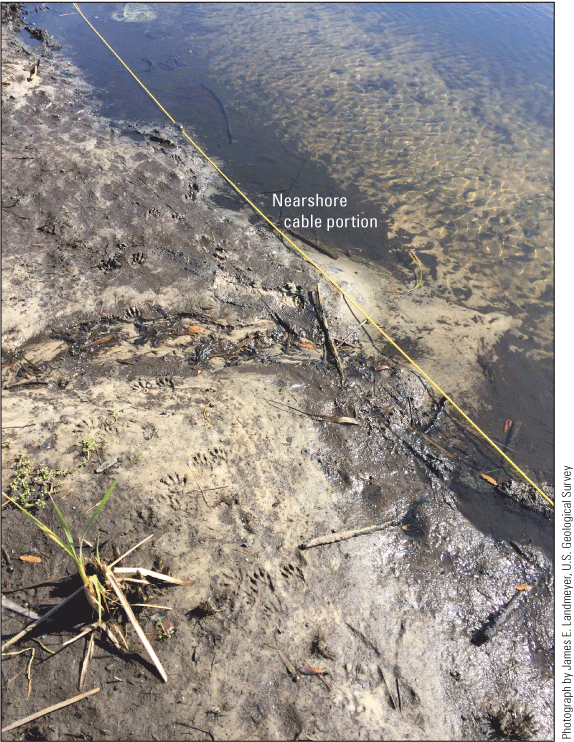
Location of inner (nearshore) portion of the fiber-optic cable and flow entering surface water from a seep located inland during low tide at Bayou Grande.
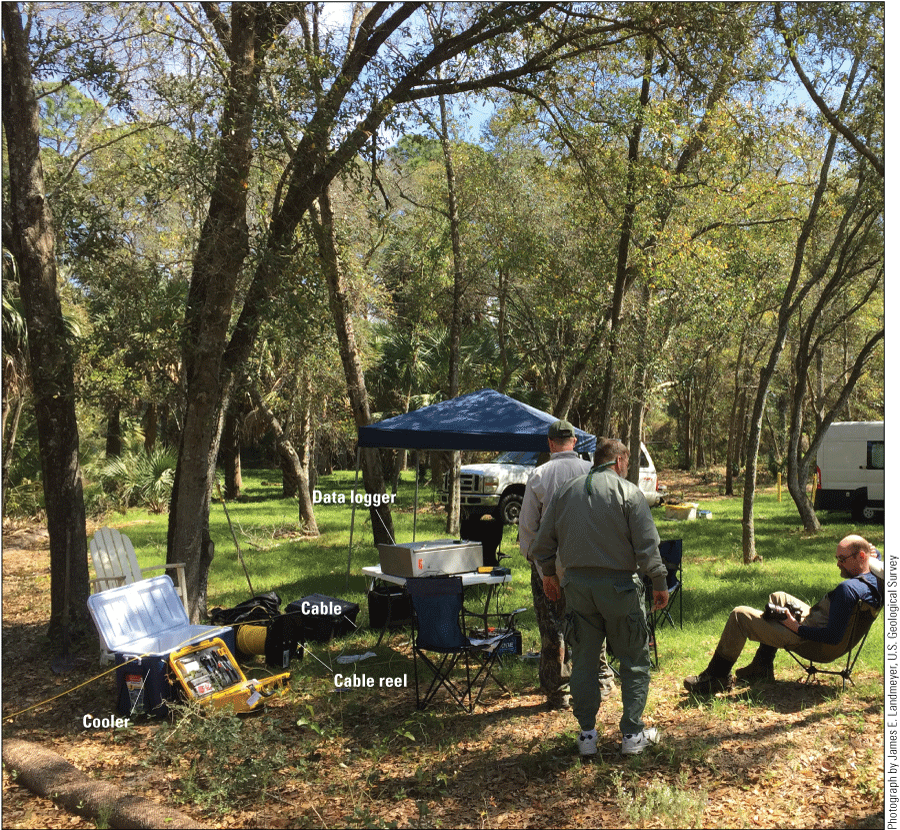
The offshore cable path near the end running through a cooler filled with ice (left) to the data logger on the table (center). The area shown is a densely vegetated upland part of Site 11.
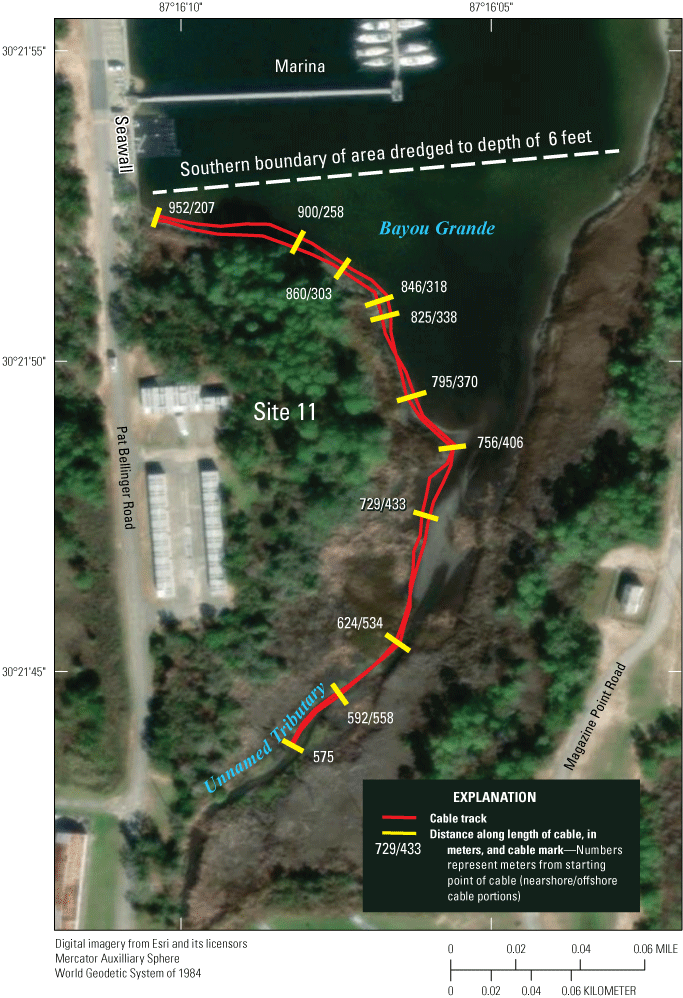
Location of the fiber-optic cable, as deployed March 13–16, 2018, at Site 11 and Bayou Grande, Naval Air Station Pensacola. The cable was looped back at 575 meters from the starting point.
Temporary Installation of Temperature and Specific Conductance Sensors with Data Loggers
The surveys of visible seeps and the FO-DTS were done primarily to map the approximate horizontal, near-surface expression of fresh groundwater discharge, respectively, along the shoreline of Site 11 and Bayou Grande. To map the approximate vertical location of the interface in the shallow aquifer belowground, and to record the daily effect of tides and seasonal changes in tides, precipitation, and temperature on the horizontal and vertical location of the interface, temperature and specific conductance sensors with data loggers (HOBO U24, Onset) were fitted to a 1.5-in.-diameter polyvinyl-chloride (PVC) drivepoint and were temporarily installed belowground in six transects oriented perpendicular to the shoreline and along the general direction of groundwater flow at Site 11 (fig. 12). Each sensor was calibrated by the manufacturer. Each drivepoint had one sensor located at the bottom, and some drivepoints had two sensors, with one located 1–2 ft above the bottom sensor. The total depth of individual drivepoints ranged from 3.6 to 7.8 ft below ground surface and into the shallow water-table aquifer to the extent practicable, because they were driven in using manual methods. Manual installation was facilitated by the quicksand-like conditions encountered that characterize groundwater discharge in sandy aquifer formation material. Data were recorded by the sensor data logger every 15 minutes and downloaded using a HOBO shuttle (Onset) during site inspections that occurred at 3- to 6-month intervals. Transects 1–3 were installed on September 12, 2018, and transects 4–6 were installed on June 26, 2019. In total, 24 sensors were deployed. Any sensor with a data logger that failed to communicate during subsequent site inspections was replaced and the failed sensor with data logger was sent to the manufacturer in an attempt to recover the data; if the recovery was not successful, the data were deemed missing. Table 1 lists the locations and approximate depths of the temporarily installed temperature and specific conductance sensors with data loggers, the serial numbers of the original loggers, and any replacements. The sensors with data loggers were removed in September 2023.
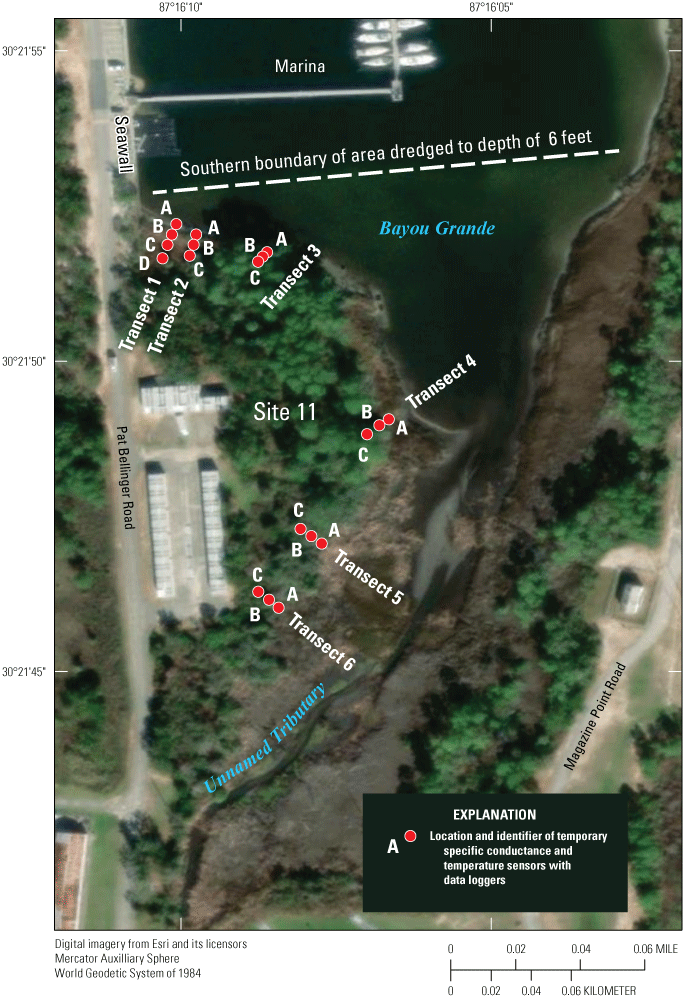
Location of transects 1–6 and associated sensors with data loggers at Site 11 and Bayou Grande, Naval Air Station Pensacola.
Table 1.
Identification, depth, and location of temporarily installed temperature and specific conductance sensors with data loggers, and dates when data loggers were replaced, Site 11, Naval Air Station Pensacola, Florida.[Dates shown as month, day, year; Latitude and longitude shown in degrees decimal minutes, referenced to the North American Datum of 1983; ID, identifier; NR, not replaced; LSD, land surface datum; ft, foot; --, not applicable]
The temperature and specific conductance sensors with data loggers may be exposed to specific conductance values in the subsurface that range between those of fresh groundwater (shown as Site 11 groundwater on fig. 13) to saline surface water from Bayou Grande (fig. 13). For the purposes of this report, a specific conductance reading of 1,000 µS/cm or less represents “fresh” groundwater beneath Site 11, a specific conductance reading of 1,001–17,500 µS/cm represents fresh groundwater interaction with saline surface water from Bayou Grande (EPA, 2004), and a specific conductance reading of 17,501 µS/cm or more represents saline surface water from Bayou Grande (EPA, 2004).
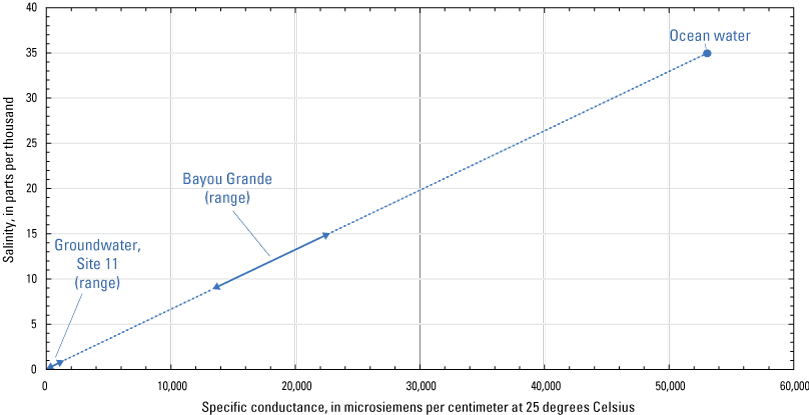
The range of specific conductance of fresh groundwater from Site 11 (this study), the range of specific conductance of Bayou Grande surface water (this study and U.S. Environmental Protection Agency [EPA, 2004]), and the specific conductance of ocean water, for comparison (EPA, 2004).
Results and Discussion
The results of the survey of visible seeps, the handheld IR camera surveys, the 4-day-long FO-DTS survey, and the data collected from the temporary installation of the temperature and specific conductance sensors with data loggers at NAS Pensacola, Site 11, are presented here. The results are discussed following a multiple-lines-of-evidence approach to best assess the location of discharge of fresh groundwater from Site 11 to Bayou Grande and, conversely, the landward intrusion of saline surface water into the shallow water-table aquifer. Data for the temperature and specific conductance sensors and the FO-DTS survey are provided as downloadable files in a companion data release report (McBride and Landmeyer, 2024).
Visible Groundwater Seepage Survey
Seventeen visible seeps were observed along the shoreline of Bayou Grande during low tide during March 14–16, 2018. During the surveys, low tide ranged from −0.3 to −0.1 ft. Water temperature and specific conductance measurements made on a representative seep indicated that the temperature and specific conductance of the seep water were 59.9 °F and 930 µS/cm, respectively. In contrast, Bayou Grande was cooler, at 52.1 °F, and much more saline, at 13,130 µS/cm. One example of a visible seep along the northern shoreline of Site 11 is shown in figure 14A, B. The flow of groundwater was enough to initiate erosion at the seepage location. More seeps were observed along the shoreline in the northern part of Site 11, just east of Pat Bellinger Road, than along other parts of the shoreline. The seeps located on the eastern part of the Site 11 shoreline bordering Bayou Grande confirm the relatively low specific conductances measured at these locations (fig. 2) during a previous investigation (Tetra Tech, 2016). The locations of all visible seeps observed during the surveys are shown on figure 15.
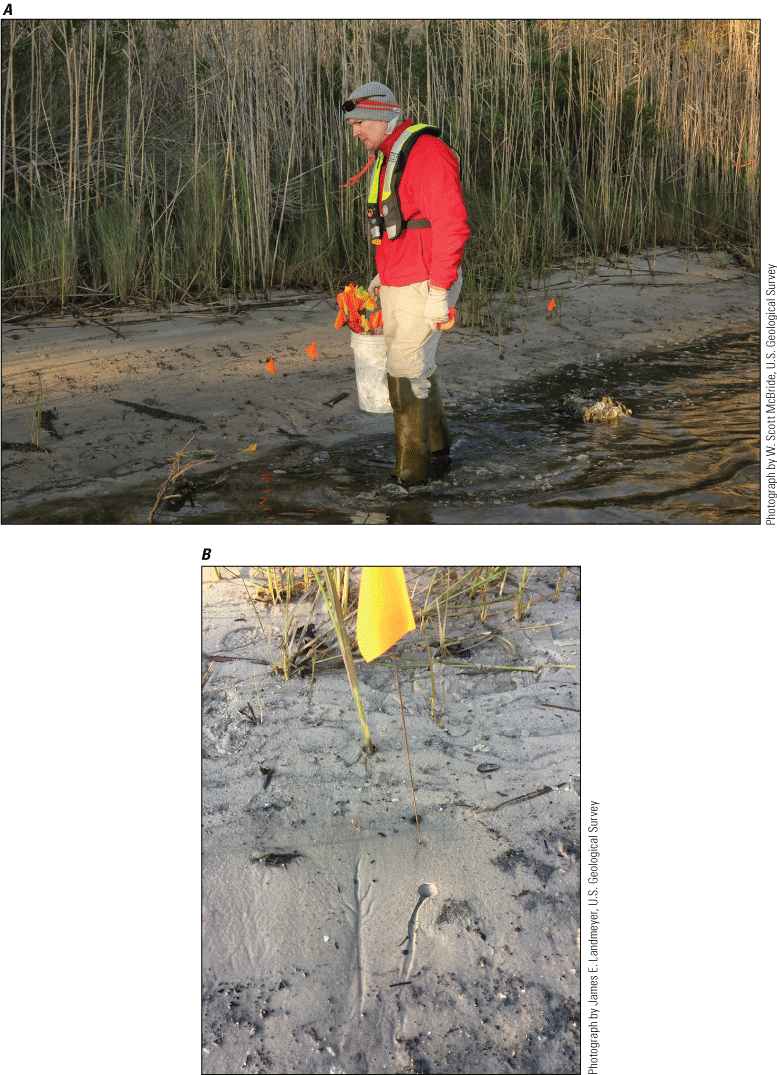
A, Orange-flagged locations of visible groundwater seeps, and B, exposed shoreline at a location where focused groundwater seepage with erosion was observed and flagged (waypoint 24, fig. 15), Site 11 and Bayou Grande, Naval Air Station Pensacola.
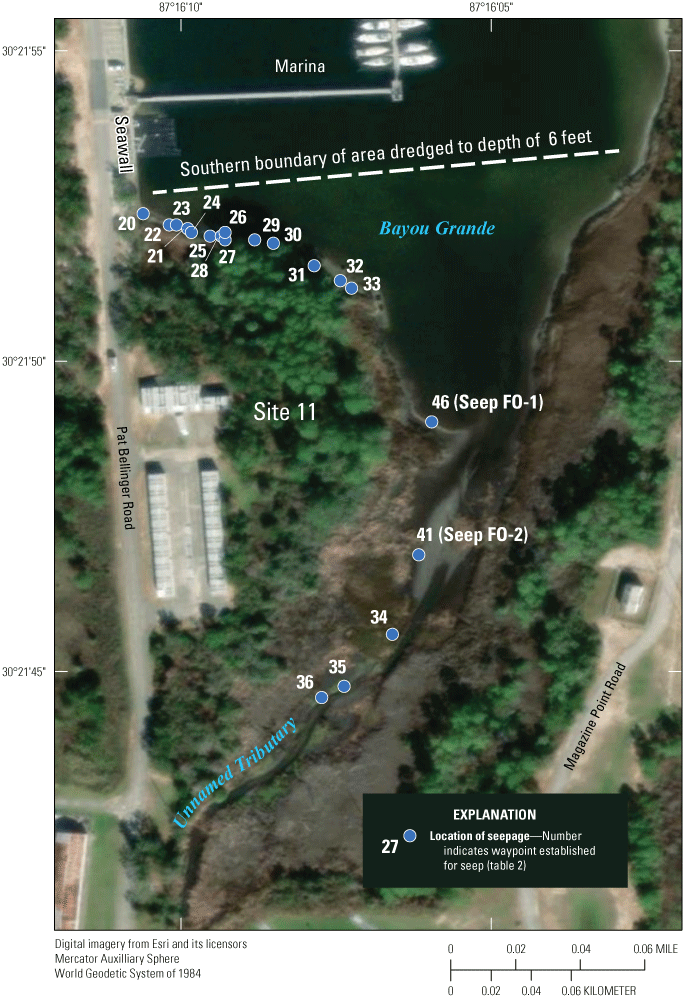
Visible seeps flagged during groundwater seepage surveys March 14–16, 2018, Site 11 and Bayou Grande, Naval Air Station Pensacola. Seeps observed during the subsequent installation of the fiber-optic distributed temperature sensing survey are labeled “FO-1” and “FO-2.”
Handheld Thermal Imaging Camera Surveys
A representative IR camera image (fig. 16) shows the warmer temperature of focused as well as diffuse groundwater seepage relative to cooler surface water at the seep shown in figure 14B along the eastern shoreline of Site 11 (fig. 15). The groundwater is warmest (near 15.5 °C) at the seep and cools as it flows down the shoreline into Bayou Grande.
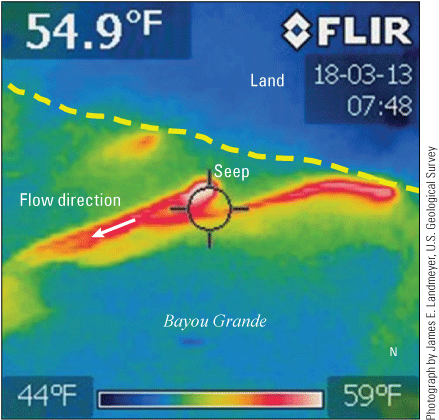
Infrared camera image of the surface temperature of land and water showing focused discharge of warmer groundwater (red, yellow, and white) at a representative seep (waypoint 24, fig. 15) and diffuse seepage along the shoreline between transects 1 and 2 where the groundwater table is exposed at low tide (yellow and green areas) compared to cooler surface water in Bayou Grande. Landward is to the right and top and Bayou Grande to the left and bottom. The yellow dashed line depicts the apparent position of the water table exposed at low tide. Photograph taken on March 13, 2018, at 7:48 a.m. central daylight time.
The physical measurement of temperature at the visible seeps and the temperatures recorded using the IR camera demonstrate that during March 14–16, 2018, discharging groundwater was about 8 °F warmer than surface water. An additional line of evidence that qualitatively supports the data is that in the early morning, rising steam was observed along the shoreline as the warmer groundwater discharged at low tide; the steam was condensation of warm groundwater evaporating over the cooler, denser air on top of Bayou Grande.
Fiber-Optic Distributed Temperature Sensing Survey
The water-temperature data collected every meter along the almost 1,000-m fiber-optic cable during March 13–16, 2018, are plotted as a thermogram, or heat map, in figure 17A. To summarize, the plot simultaneously displays the temperature data as a color in space (x axis) over the time (y axis) of the survey (Domanski and others, 2019). For example, the temperature (0 °C) measured by the cable placed in the ice-filled cooler is shown as dark blue; it remained at 0 °C throughout the duration of the survey, as indicated by the consistency of the blue color over time. The higher temperatures shown are of water except at locations and times when the cable was either exposed to air during low tide (light blue) or where placed over ground and exposed to large changes in air temperature. The warmest temperatures (near 22.5 °C) are shown by the dark red color and reflect solar warming of the cable where exposed over land during midday (the left-hand part of figure 17A) or warming of surface water. The temperature of groundwater from seeps had been shown to be 15.5 °C and therefore, the locations of seeps near the cable are indicated as a yellow/orange color. The time during which the cable was deployed is shown on the y axis, beginning after deployment during the late afternoon of March 13, 2018, and ending during the early morning of March 16, 2018. The cable deployment from initial submergence under water at 952 m (the beginning of the nearshore cable portion) to the exposure of the offshore cable portion at 207 m (table 2) is shown from right to left on the x axis. These locations and other important locations are listed in table 2, as well as the locations of visible seeps already discussed and shown on figure 15. The times during which high and low tides occurred are shown as red or purple dashed lines, respectively, on figure 17A.
Table 2.
Locations of visible seeps and of the fiber-optic cable, with depth below surface water at some locations, Site 11, Naval Air Station Pensacola, Florida.[Latitude and longitude shown in degrees decimal minutes, referenced to the North American Datum of 1983. Times shown in 24-hour format. CT, central daylight time; ft, foot; m, meter; --, no data]
| Waypoint | Latitude (degrees decimal minutes) |
Longitude (degrees decimal minutes) |
Meter mark1 (fig. 11) |
Depth below surface water (ft) |
Comment2 | |||
|---|---|---|---|---|---|---|---|---|
| Nearshore cable portion |
Offshore cable portion |
Nearshore cable |
Offshore cable |
|||||
| 56 | 30 21.866 | −087 16.144 | -- | 123 | Dry | 1.12 | Inside cable out of water over land. | |
| 55 | 30 21.867 | −087 16.144 | -- | 153 | Dry | 1.11 | Inside cable in ice-filled cooler (fig. 10). | |
| 54 | 30 21.872 | −087 16.178 | -- | 204 | -- | -- | Outer cable out of water over shoreline. | |
| 19 | 30 21.873 | −087 16.177 | 952.5 | 207 | 0.43 | 0.53 | Mar. 14, 2018, 2:00 p.m. CT. Cable deployment starts in water at 952.5 m as nearshore cable. Offshore cable leaves water at 207 m and is laid over ground up to ice bath and Oryx (fig. 8). | |
| 20 | 30 21.872 | −087 16.173 | 946 | 213 | 0.7 | 0.9 | Seep. | |
| 21 | 30 21.870 | −087 16.170 | 939 | 221 | 0.7 | 1.18 | Seep. | |
| 22 | 30 21.870 | −087 16.168 | 934 | 224 | 0.65 | 1.22 | Seep. | |
| 23 | 30 21.869 | −087 16.165 | 931.5 | 228 | 0.68 | 1.33 | Seep. | |
| 24 | 30 21.868 | −087 16.164 | 928.5 | 231 | 0.65 | 1.42 | Seep. | |
| 25 | 30 21.867 | −087 16.159 | 922 | 237 | 0.62 | 1.4 | Seep. | |
| 26 | 30 21.867 | −087 16.156 | 920 | 239 | 0.6 | 1.43 | Seep. | |
| 27 | 30 21.866 | −087 16.155 | 916 | 243 | 0.71 | 1.48 | Seep. | |
| 28 | 30 21.868 | −087 16.155 | 915 | 244 | 0.71 | 1.48 | Seep. | |
| 29 | 30 21.866 | −087 16.147 | 902 | 257 | 0.1 | 1.14 | Seep. | |
| 53 | 30 21.866 | −087 16.146 | 900 | 258 | -- | -- | Bend in inner cable. | |
| 30 | 30 21.865 | −087 16.142 | 893 | 267 | 0.26 | 1.13 | Seep. | |
| 57 | 30 21.863 | −087 16.135 | 882 | 279 | 0.18 | 1.32 | -- | |
| 58 | 30 21.861 | −087 16.130 | 874 | 287.5 | Dry | 1.1 | Cable out of water. | |
| 52 | 30 21.859 | −087 16.129 | 868 | 291 | -- | -- | Cable on muddy oyster bar. | |
| 31 | 30 21.859 | −087 16.131 | 870 | 292 | 0.26 | 1.14 | Seep. | |
| 51 | 30 21.854 | −087 16.126 | 860 | 303 | -- | -- | Big stump. Shallow oysters. Outer cable deeper. | |
| 32 | 30 21.855 | −087 16.124 | 857 | 304 | 0.53 | 1.22 | Seep. | |
| 33 | 30 21.853 | −087 16.121 | 851 | 310 | 0.26 | 1.37 | Seep. | |
| 50 | 30 21.850 | −087 16.121 | 846 | 318 | -- | -- | North end of old boat debris. Inner cable goes back in water. | |
| 49 | 30 21.841 | −087 16.120 | 825 | 338 | -- | -- | South end of old boat debris wreck. Inner cable behind debris on mud flat. | |
| 59 | 30 21.841 | −087 16.112 | 823 | 342 | 0.61 | 1.35 | -- | |
| 48 | 30 21.836 | −087 16.117 | 815 | 349 | -- | -- | Roofing material debris. Cable high. | |
| 47 | 30 21.832 | −087 16.116 | 807 | 357 | -- | -- | Cable on wood debris. | |
| 45 | 30 21.827 | −087 16.108 | 795 | 370 | -- | -- | Wire debris and oysters on shallow bar. | |
| 60 | 30 21.826 | −087 16.106 | 792 | 371 | 0.6 | 0.62 | -- | |
| 46 | 30 21.812 | −087 16.101 | 765 | 396 | -- | -- | Cables together. Seep FO-1 (fig. 15). | |
| 42 | 30 21.794 | −087 16.097 | -- | 433 | -- | -- | North end of mud flat at creek mouth. | |
| 41 | 30 21.765 | −087 16.105 | 667 | 491 | -- | -- | South end of mud flat at creek mouth. Seep FO-2 (fig. 15). | |
| 34 | 30 21.760 | −087 16.110 | 657 | 500 | -- | -- | March 14, 2018, 1445 hours CT, seep. | |
| 40 | 30 21.756 | −087 16.108 | 650 | 508 | -- | -- | Mouth of creek. Cables on top of each other. | |
| 35 | 30 21.746 | −087 16.123 | 624 | 534 | 0.5 | 0.67 | Seep (fig. 9). | |
| 36 | 30 21.743 | −087 16.129 | 610 | 548 | 1.83 | 0.82 | Seep. Inside cable in deeper hole. | |
| 39 | 30 21.737 | −087 16.134 | 592 | -- | -- | -- | Flow detected through marsh, but cold. Likely tidal discharge. No flag. | |
| 38 | 30 21.730 | −087 16.136 | -- | 573 | -- | -- | Outer cable raised on debris. | |
| -- | 30 21.729 | −087 16.139 | 576 | 574 | 0.75 | 1.2 | March 14, 2018, 3:15 p.m. CT. | |
| 37 | 30 21.729 | −087 16.139 | 575 | 575 | -- | -- | Bend in cable where it was looped back as outer cable. | |
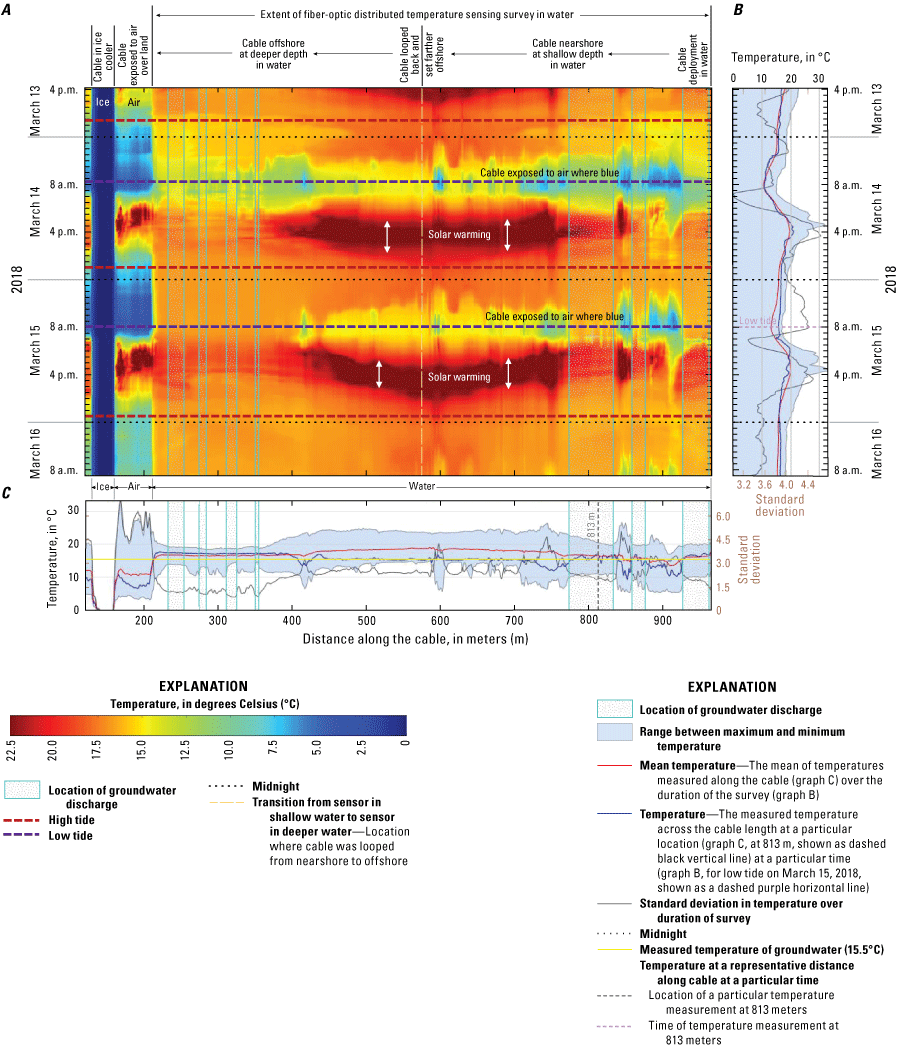
A, Temperature data collected over distance and time from the fiber-optic distributed temperature sensing (FO-DTS) survey conducted March 13–16, 2018, at Site 11 and Bayou Grande, Naval Air Station Pensacola. The FO-DTS cable deployment is summarized along the top of the thermogram, progressing from right to left. B, Temperature measurements with standard deviation as a function of time along the cable. C, Temperature measurements with standard deviation as a function of distance along the cable.
Figure 17B, C summarizes the temperature measurements displayed on the heat map using a more two-dimensional conventional format. The blue line in figure 17B, C represents the temperature along the cable for a particular time by using a fixed location for reference (low tide, March 15, 2018, at 813 m). The light-blue shaded area represents the spread between the minimum and maximum temperatures measured along the cable (fig. 17B) over time (fig. 17C). The least spread is denoted where temperature did not change over time, such as in the ice-filled cooler. In contrast, the largest spread is shown by the temperature of the cable exposed over land. The red line is the mean temperature recorded along the cable (fig. 17B) over time (fig. 17C). The standard deviation for temperature is shown as the black line in both plots. Evidence of groundwater discharge provided by this data includes areas along the cable characterized by the (1) smallest temperature minimums and maximums, (2) the smallest standard deviation of water temperature, and (3) measured temperatures near that of groundwater (15.5 °C, shown as a yellow line on figure 17C) during low- to rising-tide conditions. These lines of evidence converge because the warmer groundwater acts to buffer the large changes in surface-water temperature expected from warming by solar radiation (noon to afternoon) to cooling during nighttime.
Locations along the cable characterized by the smallest range between minimum and maximum temperatures (<3 °C) and standard deviation (<2 °C) provide an initial line of evidence of locations of groundwater discharge. Locations that met these criteria along the nearshore cable portion include about (right to left) 952–929 m, 863–850 m, and 835–780 m, and along the offshore cable portion include about 350–227 m, with evidence of focused discharge at roughly 355, 322, 283, and 240–250 m. These locations are summarized as falling within the area covered by the light-blue stippled vertical columns in figure 17A, C. These minimum and maximum temperatures and lowest standard deviations would perhaps be even lower at these locations, except for the fact that the low tide was lower on March 14 than the other days of deployment, which led to larger changes in temperature caused by more exposure of the cable to nighttime lows in air temperature and subsequent propagation of this cooler temperature through the surface-water column (or increased loss of heat from the warmer groundwater). These locations are also characterized by having less change in surface-water temperature than other cable locations because of solar heating during the afternoon. For example, the cable from around 760 to 425 m had the highest water temperatures (near 22.5 °C) during the afternoon on March 14 and 15, 2018. In contrast, during the same time, the cable from around 820 to 759 m had lower temperatures (less than 18 °C). This occurred in both shallow (nearshore cable portion) and deeper (offshore cable portion) locations, so the depth of the cable in the water column does not appear to contribute to the moderation in surface-water temperature. In sum, the data indicate that the area of groundwater discharge appears to be focused along the northern and northeastern shoreline of Site 11.
The mean temperatures recorded overnight (from 4:00 p.m. to 4:00 a.m. central daylight time the following day) by the cable are shown in figure 18. Nighttime trends in temperature are useful, because such temperatures are not affected by increases in water temperature due to solar heating and decreases in water temperature that are due to shading by trees or clouds. Most groundwater discharge appears to be focused near the northern shoreline (nearshore cable portion between 750 and 950 m and offshore cable portion between 219 and 412 m) where the mean nighttime temperature is near that of groundwater.
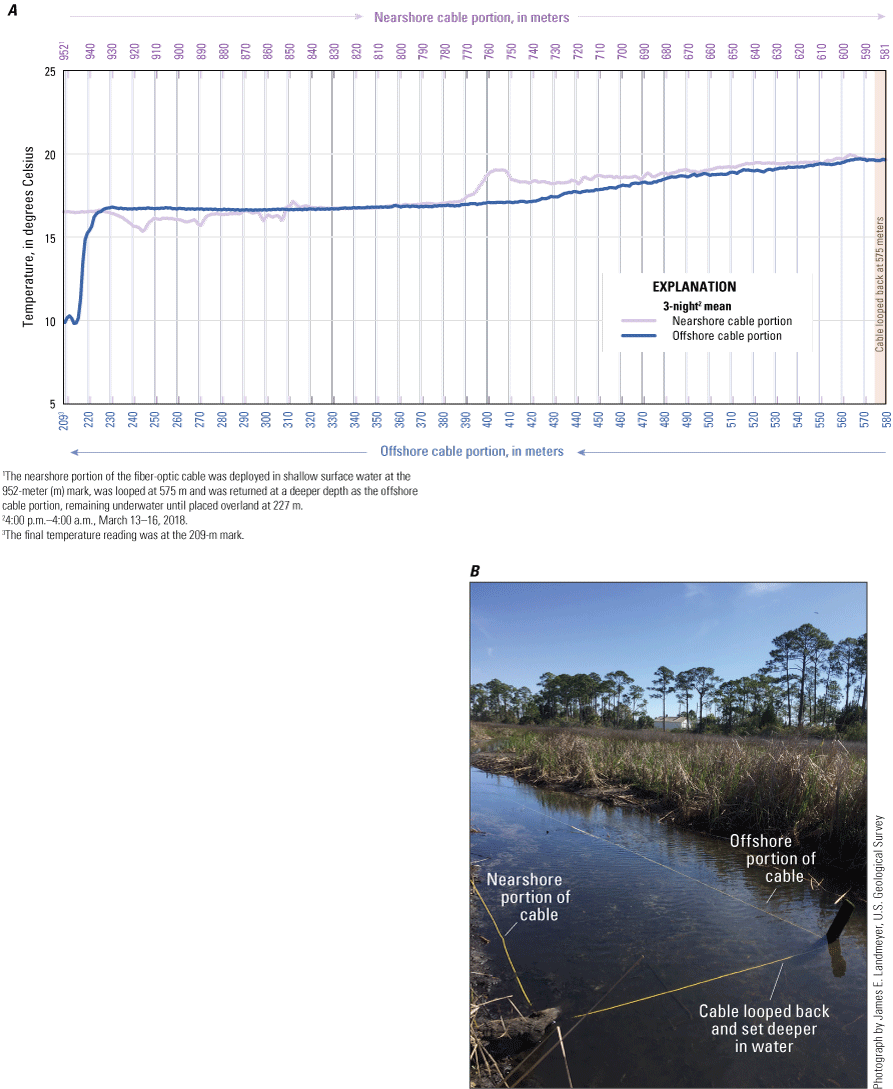
A, Three-night mean water temperatures, from 4:00 p.m. to 4:00 a.m. central daylight time the following day, along the fiber-optic cable, for the March 13–16 fiber-optic distributed temperature sensing survey. In this plot, the cable is deployed in surface water at 207 meters (m; nearshore cable portion), looped at 575 m, as shown in B, and returns back as the offshore cable portion, remaining underwater until placed over land at 227 m. Groundwater temperature is roughly 15.5 °C. Values below that temperature indicate very shallow and cooler surface water covering the cable or the subaerial exposure of the cable to cooler night air, especially to the extreme left, where the outer cable was placed over land.
A lack of variability in the 4-day mean water temperature data indicates areas of groundwater discharge (fig. 19). The difference in mean temperature between the inner cable portion and the outer cable portion confirms groundwater discharge is located predominantly near the shoreline. The variability in mean temperature for the nearshore cable is caused by cable exposure to cold air during low tide.
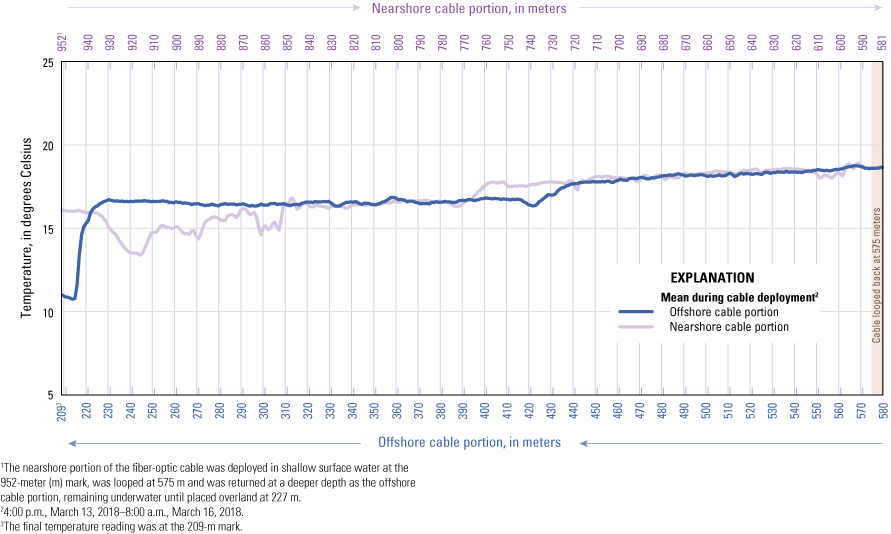
Four-day mean water temperature data from the fiber-optic cable for the March 13–16 fiber-optic distributed temperature sensing survey. In this plot, the cable is deployed in surface water at 207 meters (m; inner cable), looped at 575 m, and returns back as the outer cable, remaining underwater until placed over land at 227 m. Temperature of groundwater discharge is about 15.5 °C. Values below that temperature indicate very shallow and cooler surface water covering the cable or the aerial exposure of the cable to cooler night air, especially to the extreme left, where the offshore cable portion was placed over land.
Temperature and Specific Conductance Sensors with Data Loggers
Plots showing the temperature and specific conductance of subsurface water, as measured and logged by the sensors between September 12, 2018, and September 19, 2022 (for most sensors), for transects 1–6 are shown in figures 20–25. Specific conductance values equal to 17,501 µS/cm and above indicate when saline surface water was at that particular sensor location in the subsurface. Conversely, values equal to or less than 1,000 µS/cm indicate when fresh groundwater was at that particular sensor. Values between 1,001 and 17,500 indicate when the sensor was surrounded by a mixture of saline surface water and fresh groundwater. As stated previously, the dry season in Pensacola, Florida, is generally accepted as being from late November-early December to mid-May. Specific events, such as hurricanes, are labelled, as well as periods of below and above average precipitation for Pensacola, Florida (National Weather Service, 2023).
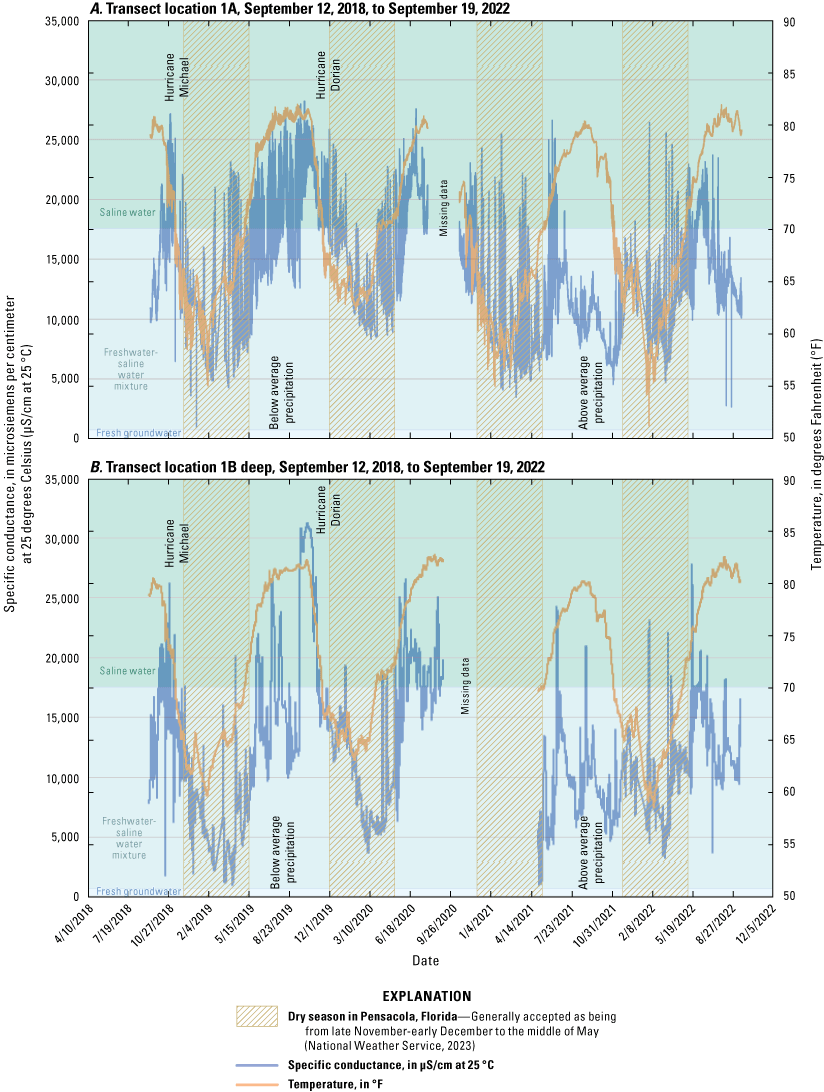
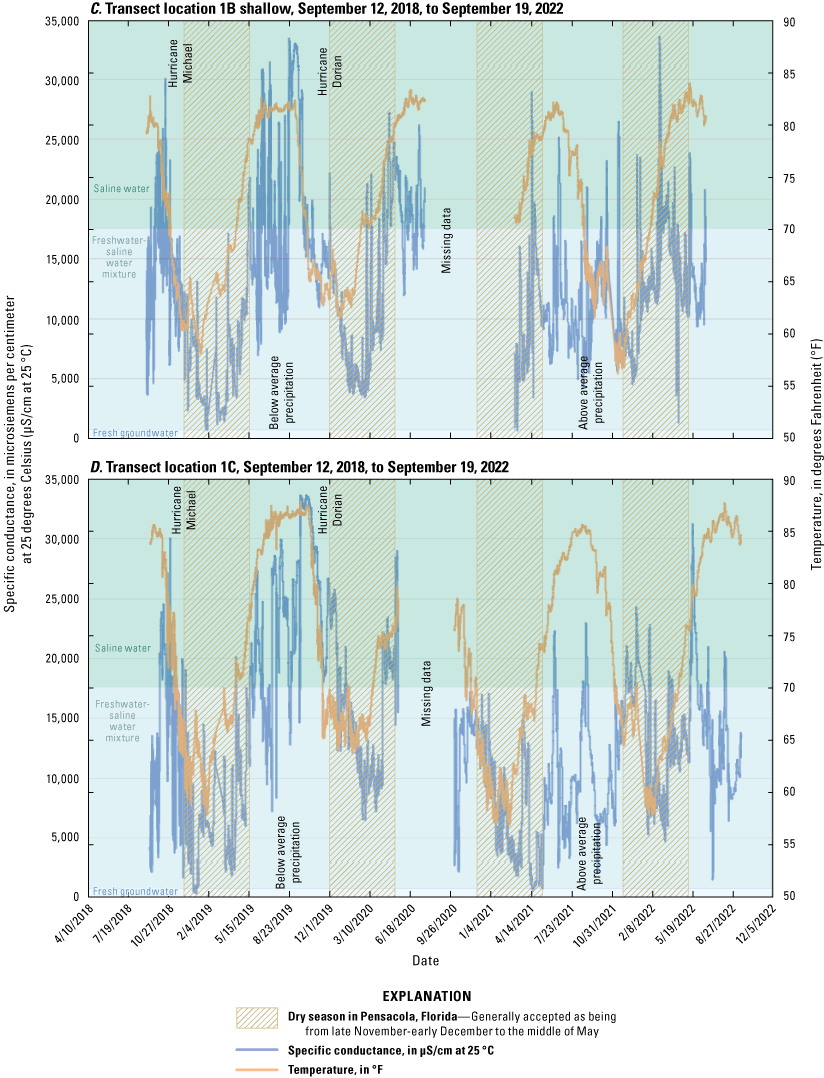
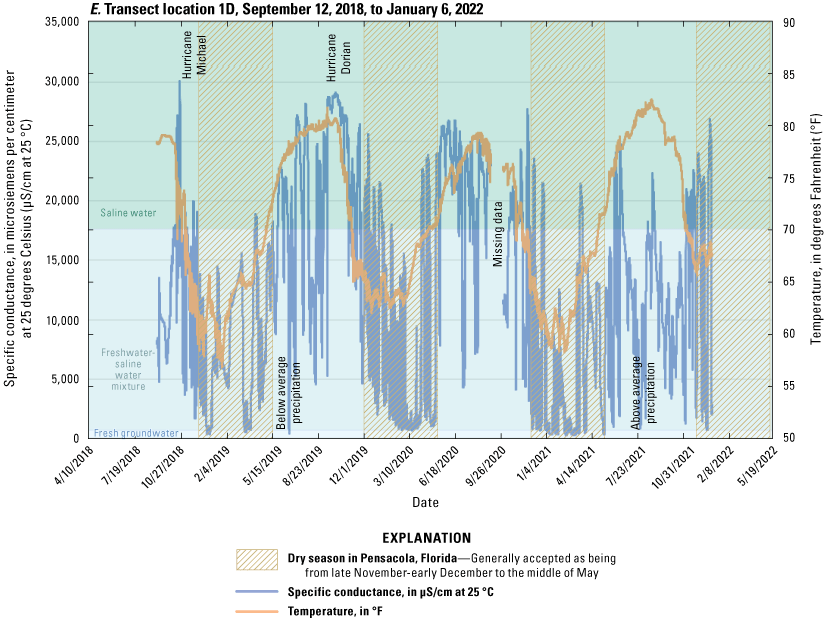
Temperature and specific conductance data for sensors at A, transect location 1A, B, transect location 1B deep, C, transect location 1B shallow, D, transect location 1C, from September 12, 2018, to September 19, 2022; and E, for transect location 1D, from September 12, 2018, to January 6, 2022.
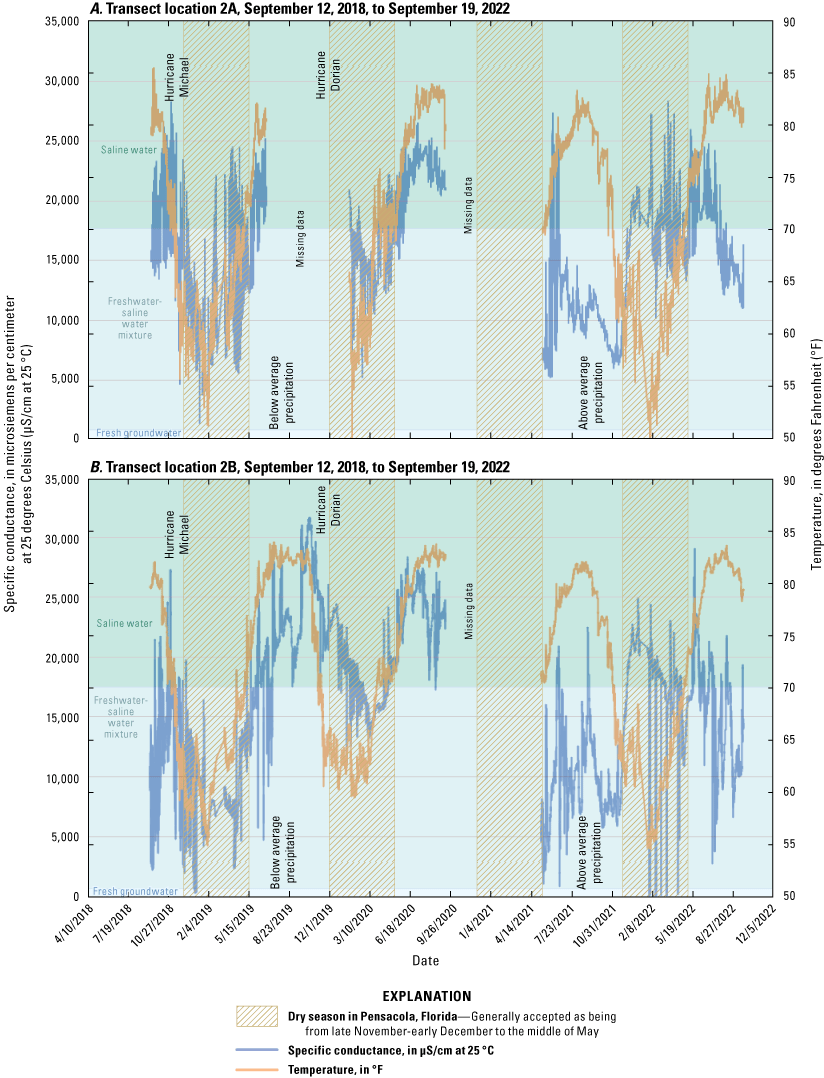
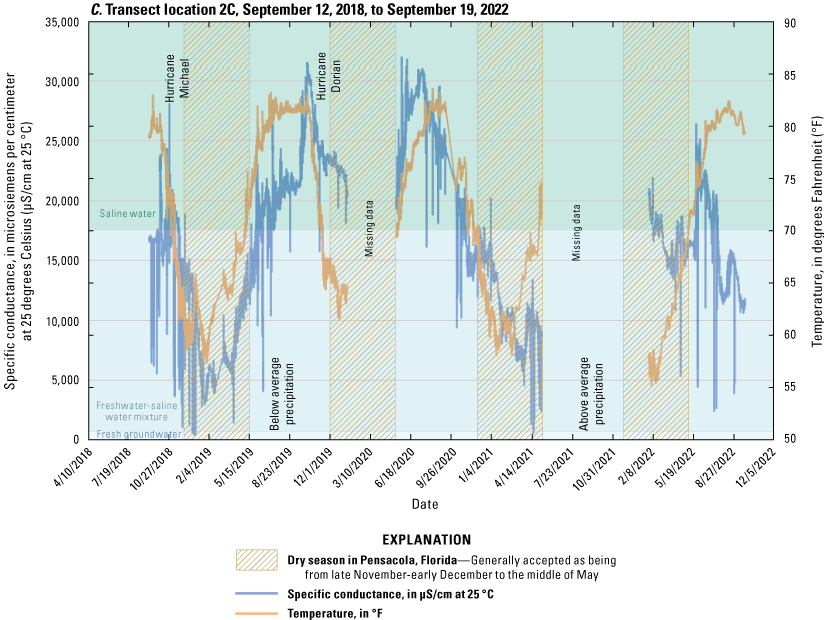
Temperature and specific conductance data for sensors at A, transect location 2A, B, transect location 2B, and C, transect location 2C, from September 18, 2018, to September 19, 2022.
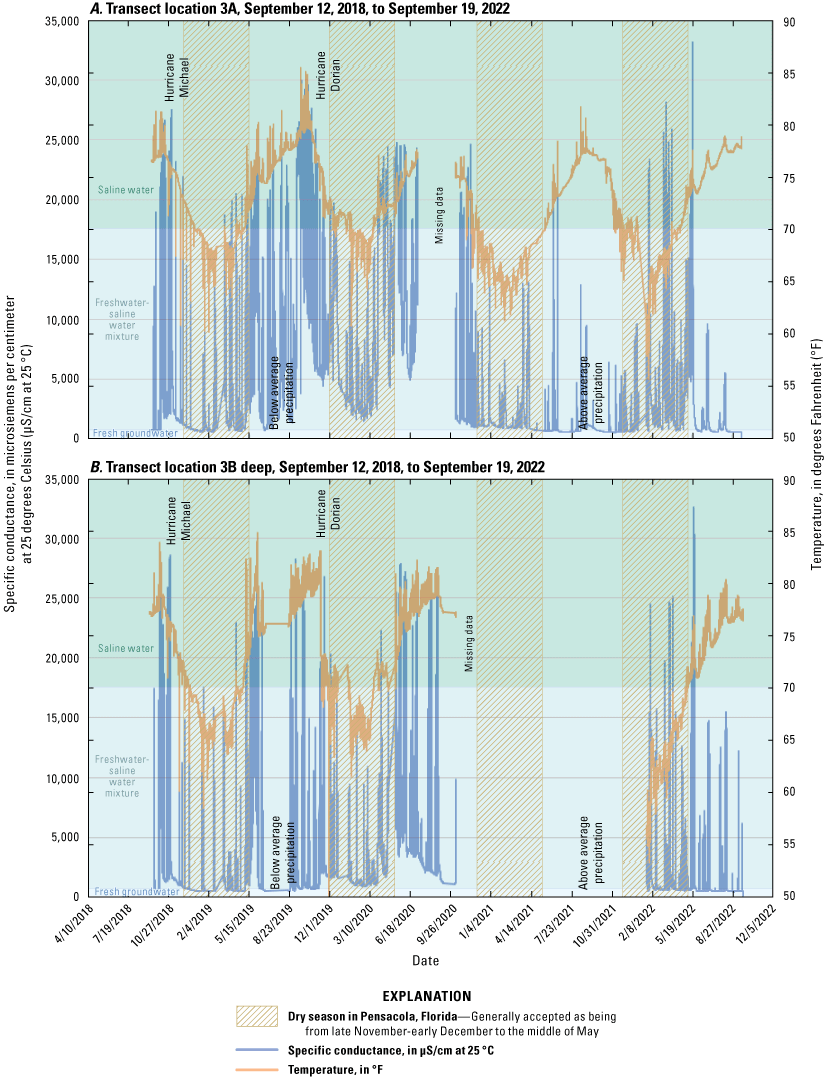
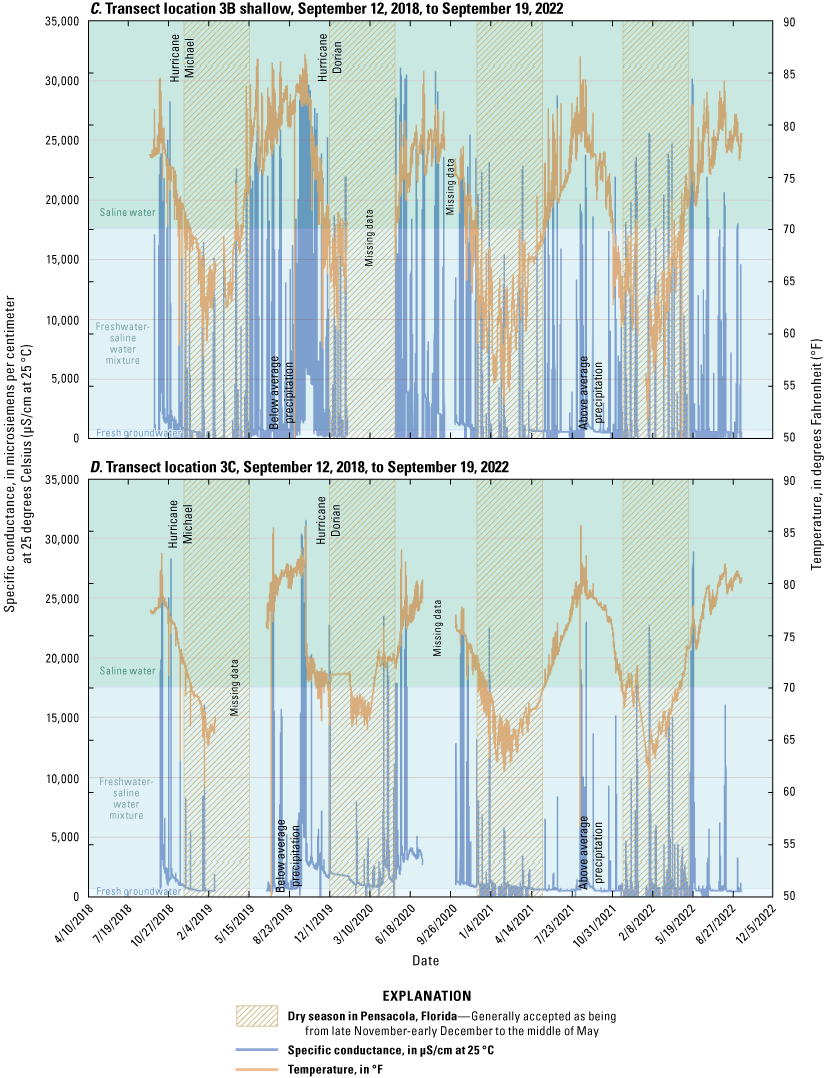
Temperature and specific conductance data for sensors at A, transect location 3A, B, transect location 3B deep, C, transect location 3B shallow, and D, transect location 3C from September 18, 2018, to September 19, 2022.
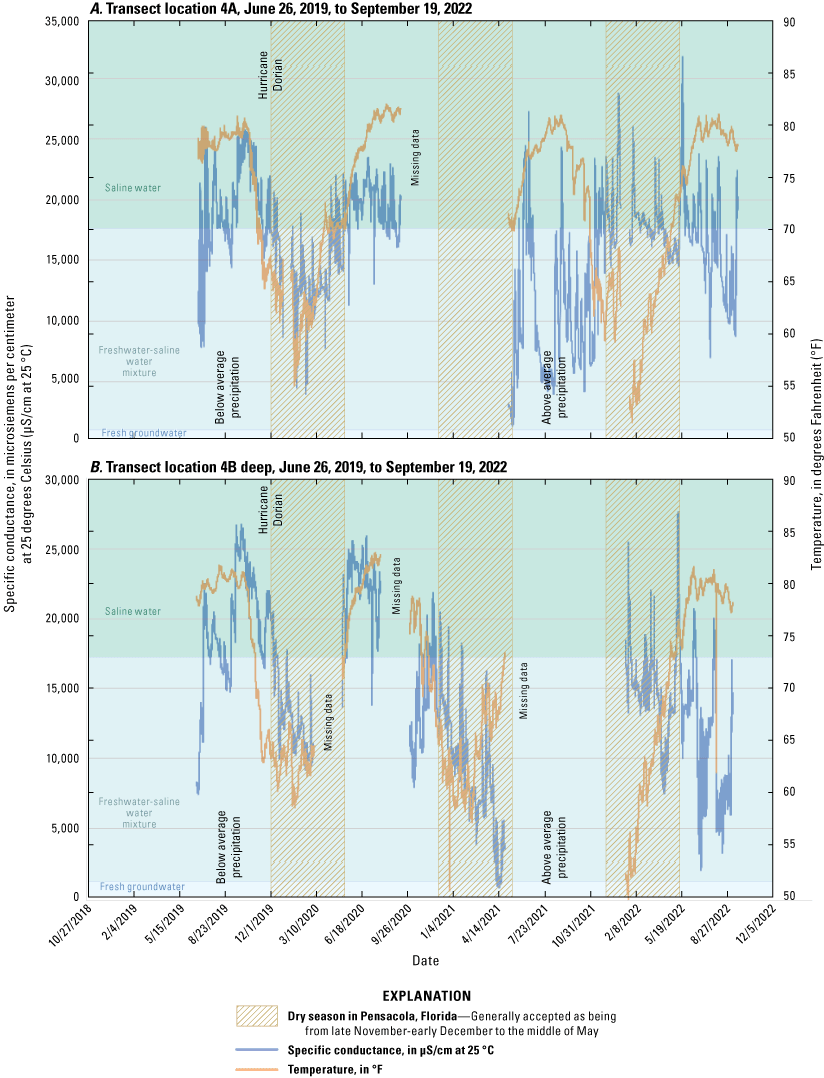
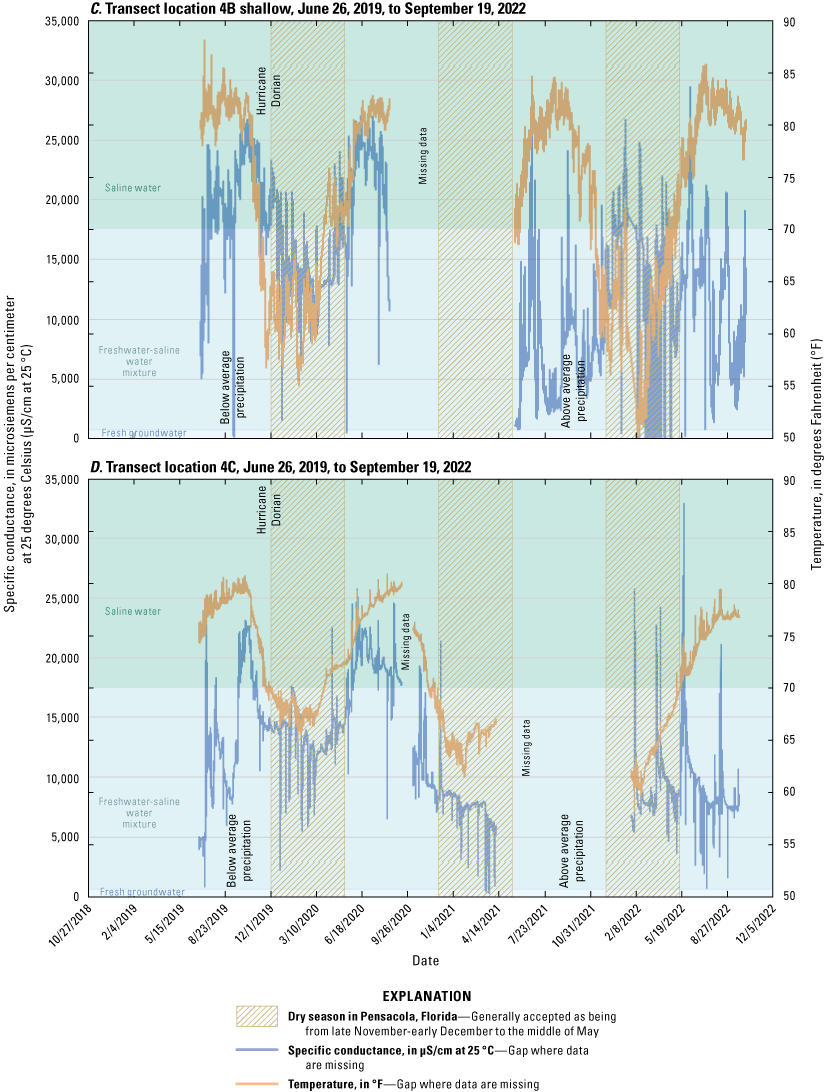
Temperature and specific conductance data for sensors at A, transect location 4A, B, transect location 4B deep, C, transect location 4B shallow, and D, transect location 4C from June 26, 2019, to September 19, 2022.
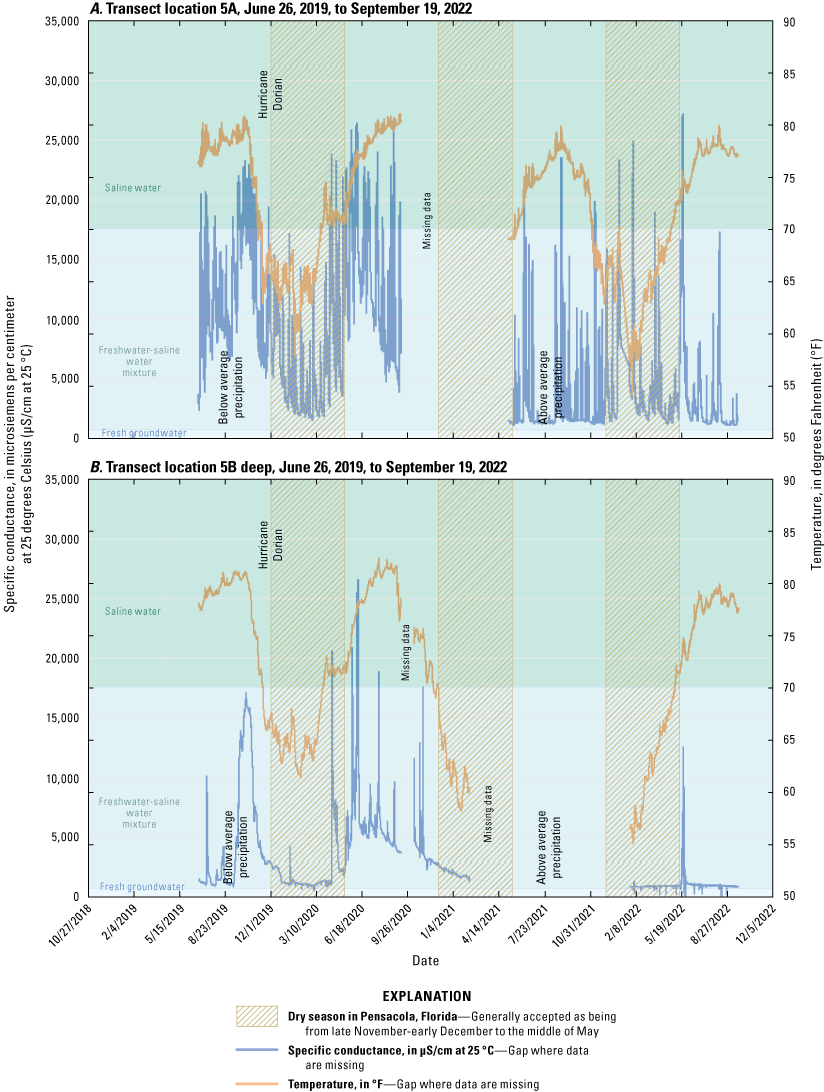
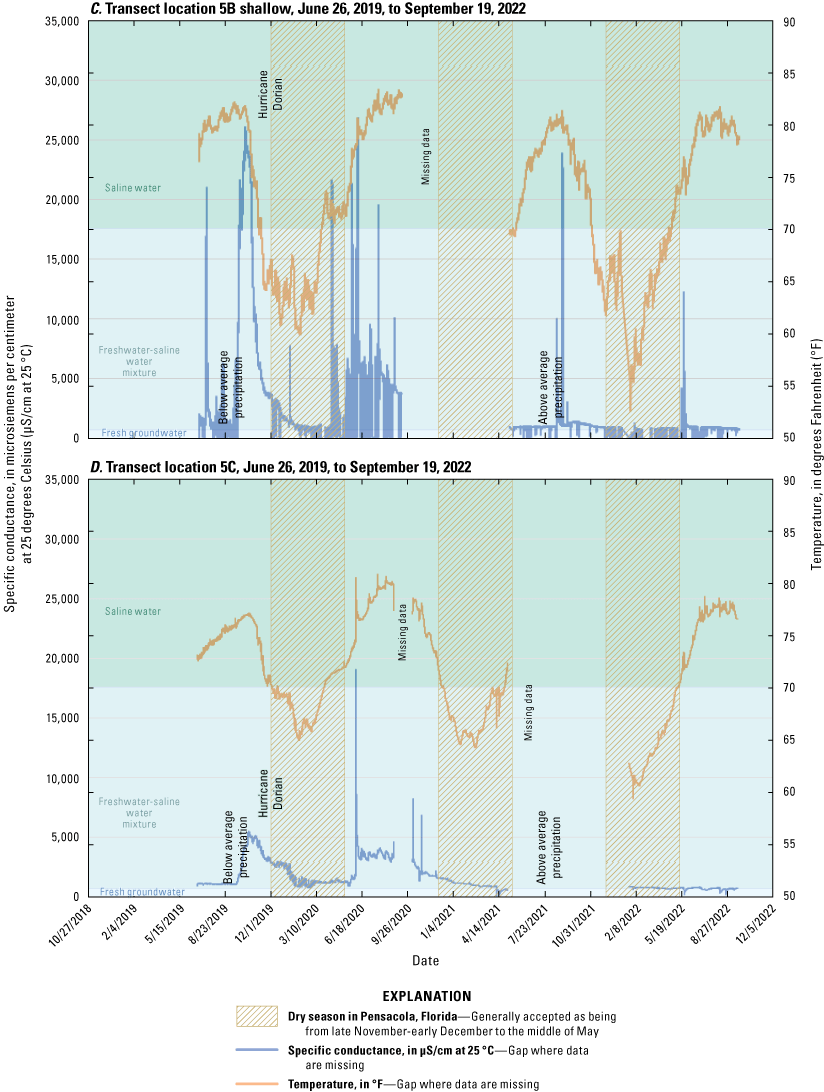
Temperature and specific conductance data for sensors at A, transect location 5A, B, transect location 5B deep, C, transect location 5B shallow, and D, transect location 5C from June 26, 2019, to September 19, 2022.
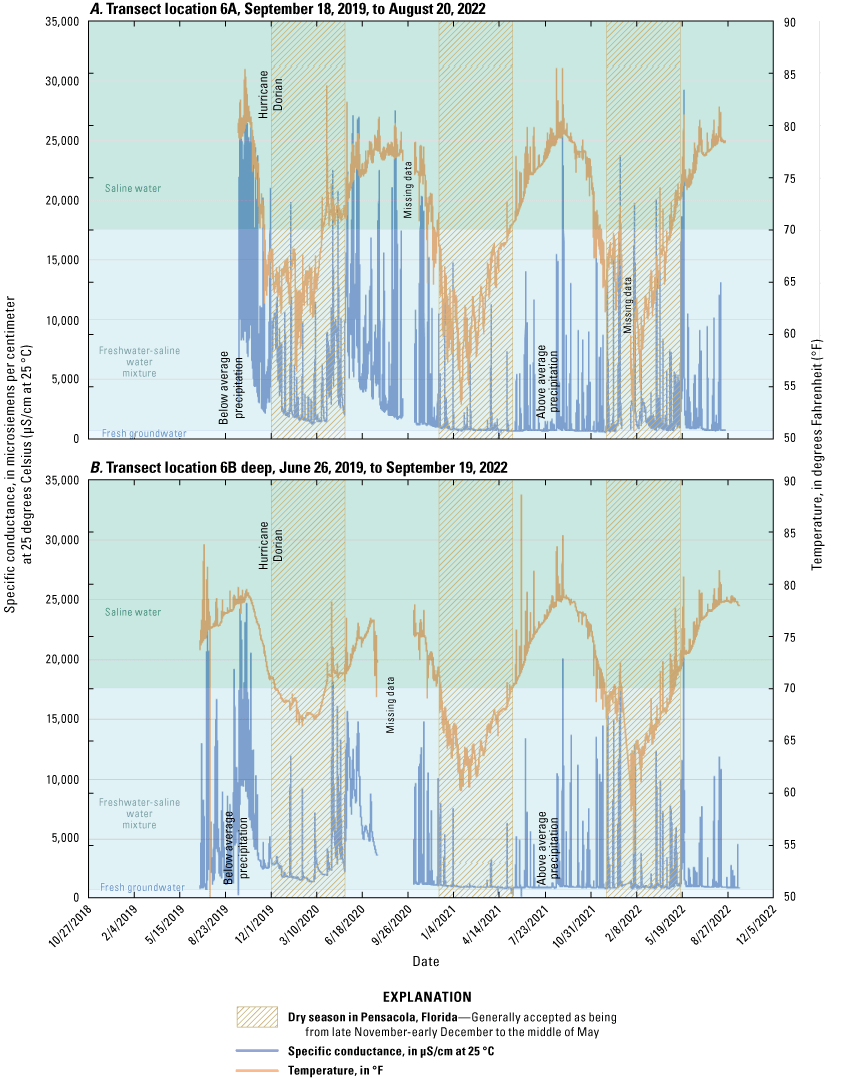
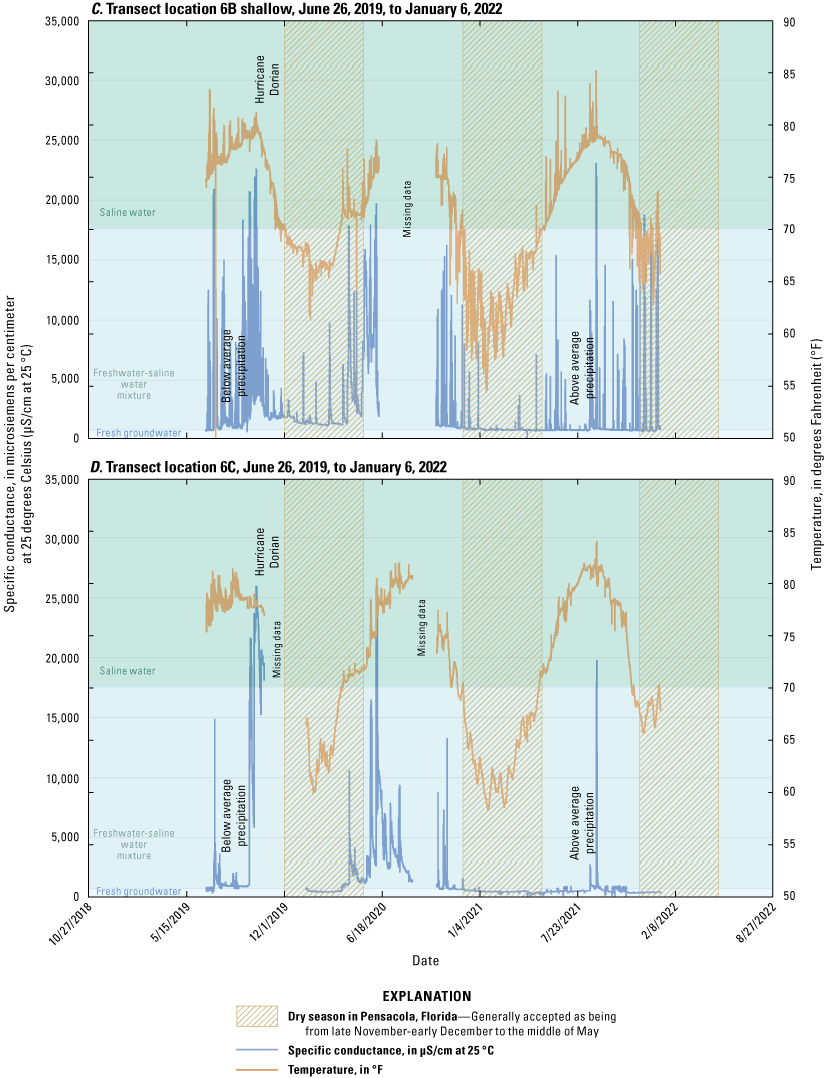
Temperature and specific conductance data for sensors at A, transect location 6A, B, transect location 6B deep, from June 26, 2019, to September 19, 2022; and C, transect location 6B shallow, and D, transect location 6C from June 26, 2019, to January 6, 2022.
Transect 1
The data from the sensors located in the subsurface along transect 1 indicate generally similar trends for specific conductance and temperature from 2018 to early 2021 (fig. 20). In general, under conditions of average precipitation (about 65 inches per year; National Weather Service, 2023), the lowest specific conductance and temperature measurements in the subsurface were observed during the dry winter and spring months (December–May) and the highest specific conductance and temperature measurements were observed during the wet summer and fall months (June–November). During the winter and spring months, surface-water levels are low (especially during low-tide conditions, which occur 12 hours of each day in the study area) and precipitation is low, but groundwater levels (heads) are high because of lower rates of evapotranspiration. Therefore, under these conditions, a seaward head gradient exists from Site 11 to Bayou Grande. In contrast, during the summer/fall months, surface-water levels are high (especially during high-tide conditions, which occur 12 hours each day in the study area), precipitation is high, but groundwater levels are low because of higher evapotranspiration rates. As such, the surface-water levels are higher than near-shore groundwater levels, especially during high tide. Under these conditions, a landward head gradient exists from Bayou Grande to Site 11. Hurricanes that produce storm surges occur during this time of year and can produce the highest specific conductance values measured. For example, during October 2018 and early September 2019, specific conductance spiked rapidly at all sensors in transect 1 because of storm surges related to Hurricanes Michael and Dorian, respectively. In both cases, the specific conductance took a few weeks to return to levels before the storm as the surge water flowed back into Bayou Grande. The seasonal trend in subsurface temperature reflects changes in surface-water temperature because of seasonal changes in air temperature, as well as an increased component of groundwater (average temperature of about 15.5 °C) during the winter and spring. Combined, the data reveal that for most of the monitoring period, the subsurface area depicted by transect 1 is characterized by saline to brackish water, with only a few periods of time during the winter of 2019 when predominantly fresh groundwater was measured. This scenario occurs because transect 1 is located in a low-lying area of Site 11 and because 2019 was characterized by below-average precipitation (National Weather Service, 2023). During the summer and fall of 2021, the specific conductance values were the lowest measured for that season during the 4-year study period (and temperatures were slightly cooler compared to the same time in previous years), because precipitation during 2021 was above average (National Weather Service, 2023). As such, increased recharge occurred, and saline surface-water intrusion decreased. This impact of precipitation on specific conductance was less noticeable for those sensors located farther inland, like those at transect location 1D (fig. 20E). The highest specific conductivities were measured by sensors at transect location 1C, 15 ft inland from the shoreline (fig. 20D). There was no appreciable difference in trends for specific conductance and temperature with depth at transect locations 1B deep (fig. 20B) and 1B shallow (fig. 20C).
Transect 2
The data for all of the sensors located along transect 2 (fig. 21) have similar trends for specific conductance and temperature from 2018 to early 2021, as was observed for transect 1. Both transects 1 and 2 are in low-lying areas, so this similarity supports the overall trends observed. The data also reveal that, most of the time, this low-lying area is characterized by saline to brackish water, with only a few periods during the winters of 2018 and 2022 when fresh groundwater was measured. Fresh groundwater also was measured during the summer of 2021 when precipitation was above average, as was described for transect 1.
Transect 3
The data for all of the sensors located along transect 3 have similar trends for specific conductance and temperature, as was observed for transects 1 and 2 (fig. 22). However, all sensors along transect 3 experienced a longer time period during the winter and spring of each year that is characterized by fresh groundwater, with the freshest water measured at location 3C (fig. 22D), the farthest inland from Bayou Grande along that transect. Because of the higher altitude of land surface at transect 3 relative to land surface at transects 1 and 2, the data represent mostly fresh groundwater, occasionally with increased high specific conductance from either higher than normal high tides or following a storm surge.
Transect 4
The data collected by all of the sensors located along transect 4 started later than for transects 1–3, but indicate similar trends for specific conductance and temperature (fig. 23) as was observed for transects 1 and 2, also located in a low-lying area. The data for all of the sensors located along transect 4 indicate predominantly brackish water. The sole exception was for transect location 4B shallow (fig. 23C), where low specific conductance and low temperature characterized the spring of 2022.
Transect 5
The data for all of the sensors located along transect 5 (fig. 24) indicate similar trends for specific conductance and temperature, as was observed for transect 3. All sensors along transect 5 experienced a longer time period during the winter and spring characterized by fresh groundwater than during the summer and fall, with the freshest water measured at transect location 5C (fig. 24D), which is located farthest inland from Bayou Grande. Because of the slightly higher altitude of transect 5 relative to Bayou Grande, the data represent mostly fresh groundwater flow to Bayou Grande, occasionally with higher specific conductance either during high tides or following storm surge.
Transect 6
The data for all of the sensors located along transect 6 (fig. 25) indicate similar trends for specific conductance and temperature, as was observed for transects 3 and 5. All sensors along transect 6 experienced a longer time period during the winter and spring characterized by fresh groundwater than during the summer and fall, with the freshest water measured at transect location 6C (fig. 25D), which is located farthest inland from Bayou Grande along that transect. Because of the slightly higher altitude of transect 6 relative to Bayou Grande, the data represent mostly fresh groundwater flow to Bayou Grande, occasionally with pulses of high specific conductance either during high tides or following storm surge. In fact, the rapid change in specific conductance at transect location 6A (fig. 25A) supports the concept that the groundwater/surface-water interface is dynamic.
Approximate Mappable Location of the Fresh Groundwater/Saline Surface-Water Interface
Data collected during the documentation of visible seeps, the IR camera surveys, the FO-DTS survey, and the continuous water temperature and specific conductance data from the six transects were compiled as multiple lines of evidence to map the approximate horizontal (and to the extent practicable, the vertical) location of the fresh groundwater/saline surface-water interface at Site 11 during the study period (fig. 26). The interface is farther inland where land surface altitudes (and, therefore, water-table altitudes) are lowest (transects 1, 2, and 4), which results in a thinner (<2 ft) lens of fresh groundwater. Conversely, the lens of fresh groundwater is thicker (>2 ft) at transects 3, 5, and 6, where land surface altitudes and water-table levels are higher. As indicated earlier, the location of the interface is dynamic, and its position will change predictably on the basis of season (wet versus dry) and events such as hurricanes that produce extreme precipitation amounts and often storm surge.
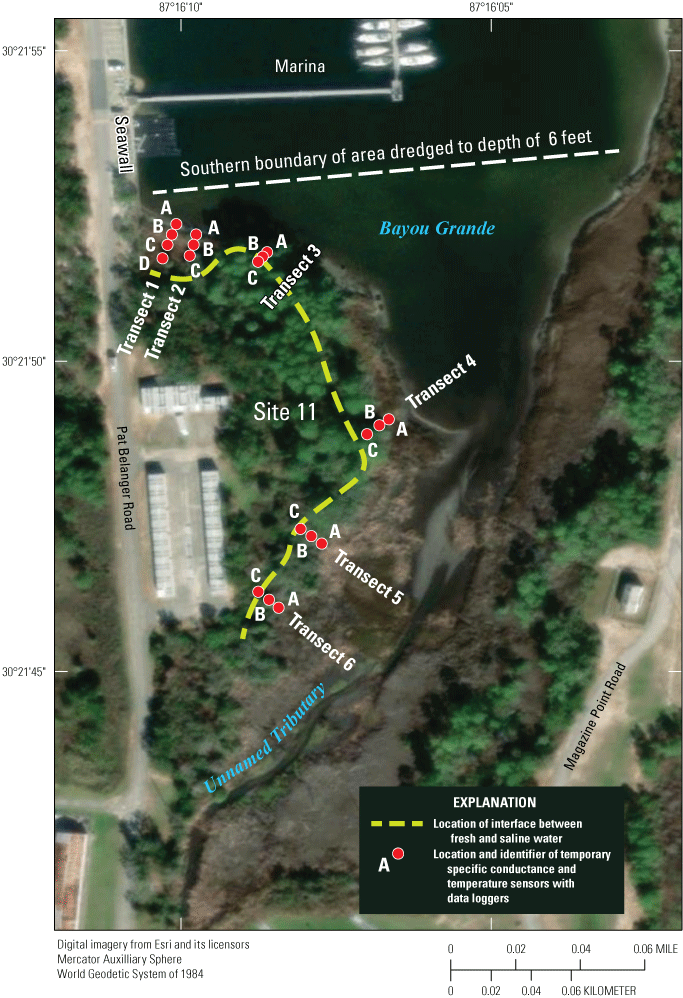
Approximate horizontal location of the fresh groundwater/saline surface-water interface at low tide, Site 11 and Bayou Grande, Naval Air Station Pensacola, during the study period based on documentation of visible seeps, infrared camera surveys, the fiber-optic distributed temperature sensing survey, and continuous water temperature and specific conductance data collected from the data loggers at the six transects.
Any future effort to locate, design, and install additional monitoring wells to provide samples of fresh groundwater from the shoreline of Site 11 will require acknowledging the fact that the location of the interface changes over time. The highest probability for the collection of fresh groundwater samples would be in monitoring wells installed at the inland part (location C) of transects 3, 5, and 6 (also refer to figs. 22D, 24D, and 25D, respectively). A monitoring well installed farther inland at these transects could be drilled deeper and screened deeper than a well installed along the same transect but closer to the shoreline. Wells installed closer to the shoreline, however, would tend to have groundwater that came from greater depths across the aquifer. Wells should be installed during the winter and spring when the low tide is at its lowest. Moreover, to further ensure the collection of fresh groundwater, all samples should be collected during low or falling tide.
Plants as Additional Indicators of Groundwater Seepage
During the field investigation, it became apparent that the species of plants that grew near the shoreline of Site 11 provided a fairly good estimate of what the data from the visible seepage survey, the IR camera survey, the FO-DTS survey, and the temperature/specific conductance data would ultimately indicate to be the approximate, long-term, landward location of the fresh groundwater/saline surface-water interface. The distribution of vegetation at Site 11 near the shoreline appears to be related to at least three factors: the altitude of the land surface, the presence (and duration) of saline water intrusion into the aquifer, and the frequency and availability of fresh water in the rooting zone from either precipitation or groundwater. Higher topographic altitudes permit a thicker unsaturated zone, more space for roots to occupy, more availability of fresh groundwater, and less chance for saline surface-water contamination by storm surge or by saline water intrusion. As a result, the higher altitudes tend to be characterized by pine trees and various hardwoods, such as live oaks (fig. 27). In contrast, lower altitudes are often flooded by saline water for prolonged periods of time and tend to be characterized by more saline tolerant plants such as Phragmites australis (common reed) or Spartina alterniflora.
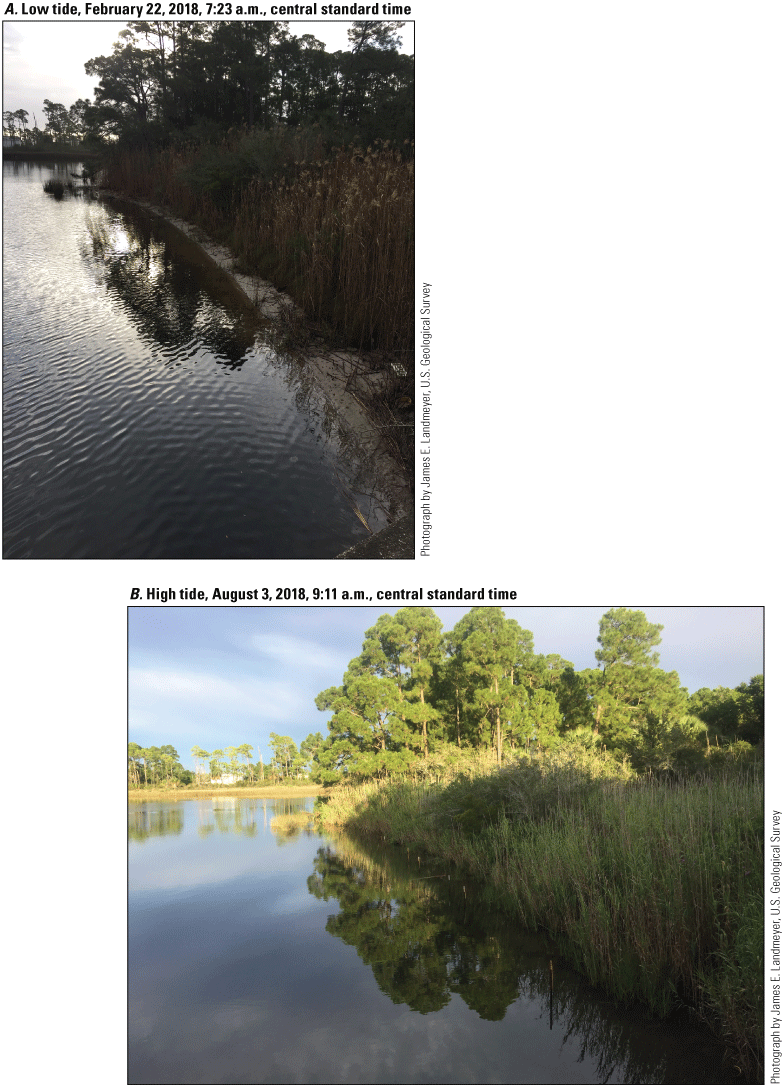
Shoreline bordering Site 11 and Bayou Grande looking east showing pine trees and various hardwoods growing in the upland area shown in background and in the lowland area shown in the foreground comprising Phragmites australis (common reed) or Spartina alterniflora. A, low tide, February 22, 2018, 7:23 a.m. central standard time, and B, high tide, August 3, 2018, 9:11 a.m. central daylight time.
The uptake of groundwater by the native vegetation at Site 11, if confirmed, may have implications for the overall remediation of Site 11. The vegetation may be helping to achieve the goal of monitored natural attenuation by (1) taking up Site 11 groundwater and lessening the volume that reaches Bayou Grande, and (2) taking up any dissolved contaminants (phytoremediation), which is itself a process of natural attenuation.
Summary and Conclusions
Site 11 is a former landfill at Operable Unit 2, North Chevalier Field Disposal Area, at Naval Air Station Pensacola, Florida. The former landfill is adjacent to Bayou Grande, a shallow, tidally influenced, and saline estuary of the Pensacola Bay watershed. Between 2018 and 2022, the U.S. Geological Survey used a multiple-lines-of-evidence approach to assess groundwater discharge that included a visual method and three physical methods based on the temperature difference between groundwater and surface water; one physical method also used the difference in specific conductance between fresh groundwater and saline surface water. Combined, the data collected between 2018 and 2022 indicate that fresh groundwater from Site 11 converges to discharge primarily at the northern and northeastern shoreline of Site 11, with discharge to exposed areas of the shore occurring when the tide is low (both daily and seasonally) and, therefore, a few feet offshore when the tide is high (both daily and seasonally). Conversely, the data indicate that saline surface water from Bayou Grande intrudes tens of feet into the shallow aquifer beneath Site 11, with farther intrusion during daily and seasonal high tide and following hurricanes or storm surge; the saline water added to the subsurface by the latter two processes flows back to Bayou Grande over time. As such, the horizontal and vertical location of the fresh groundwater/saline surface-water interface (interface) changes over time and primarily depends on the difference between the altitude of fresh groundwater at Site 11 and the surface-water level of Bayou Grande. Any new monitoring wells proposed for installation near the shoreline of Site 11 should be installed on the landward side of the location of the interface to provide the highest probability of collecting a sample of shallow groundwater from Site 11 flowing seaward and not be affected by the landward intrusion of saline water from Bayou Grande. Regardless of final well location, however, care would need to be taken to collect any groundwater samples at the correct tidal period and season to ensure that only fresh groundwater was sampled.
References Cited
Antolino, D.J., 2019, Groundwater/surface-water interactions along Ellerbe Creek in Durham, North Carolina, 2016–18: U.S. Geological Survey Scientific Investigations Report 2019–5097, 32 p., accessed March 1, 2023, at https://doi.org/10.3133/sir20195097.
Barlow, P.M., 2003, Ground water in freshwater-saltwater environments of the Atlantic Coast: U.S. Geological Survey Circular 1262, 113 p. [Also available at https://doi.org/10.3133/cir1262.]
Briggs, M.A., Buckley, S.F., Bagtzoglou, A.C., Werkema, D.D., and Lane, J.W., 2016, Actively heated high-resolution fiber-optic-distributed temperature sensing to quantify streambed flow dynamics in zones of strong groundwater upwelling: Water Resources Research, v. 52, p. 5179–5194, accessed February 24, 2021, at https://doi.org/10.1002/2015WR018219.
Chadwick, D.B., Groves, J., Smith, C., and Paulsen, R., 2003, Hardware description, protocols, and procedures, in Coastal contaminant migration monitoring—The Trident probe and UltraSeep system—Technologies to evaluate contaminant transfer between groundwater and surface water: San Diego, Calif., SPAWAR Systems Center San Diego, Technical Report 1902, 26 p., 10 app.
Domanski, M., Quinn, D., Day-Lewis, F.D., Briggs, M.A., Werkema, D., and Lane, J.W., Jr., 2019, DTSGUI—A Python program to process and visualize fiber-optic distributed temperature sensing data: Ground Water, v. 58, no. 5, p. 799–804, accessed November 19, 2019, at https://doi.org/10.1111/gwat.12974.
Florida Department of State, 2004, Rule 62–550—Drinking water standards, monitoring, and reporting in Florida Administrative Code & Florida Administrative Register: Florida Department of State web page, accessed August 11, 2022, at https://www.flrules.org/gateway/ChapterHome.asp?Chapter=62-550.
Hare, D.K., Briggs, M.A., Rosenberry, D.O., Boutt, D.F., and Lane, J.W., 2015, A comparison of thermal infrared to fiber-optic distributed temperature sensing for evaluation of groundwater discharge to surface water: Journal of Hydrology, v. 530, p. 153–166, accessed February 24, 2021, at https://doi.org/10.1016/j.jhydrol.2015.09.059.
Hayes, L.R., and Barr, D.E., 1982, Hydrology of the sand-and-gravel aquifer, southern Okaloosa and Walton Counties, northwest Florida: Reston, Va., U.S. Geological Survey Water-Resources Investigations Report 82–4110, 43 p., accessed May 14, 2023, at https://pubs.er.usgs.gov/publication/wri824110.
Irvine, D.J., Briggs, M.A., Lautz, L.K., Gordon, R.P., McKenzie, J., and Cartwright, I., 2016, Using diurnal temperature signals to infer vertical groundwater-surface water exchange: Ground Water, v. 55, no. 1, p. 10–26, accessed May 17, 2022, at https://doi.org/10.1111/gwat.12459.
Leaf, A.T., 2020, A distributed temperature sensing investigation of groundwater discharge to Haskell Lake, Lac du Flambeau Reservation, Wisconsin, July 27–August 1, 2016: U.S. Geological Survey Scientific Investigations Report 2020–5005, 17 p., accessed September 10, 2020, at https://doi.org/10.3133/sir20205005.
McBride, W.S., and Landmeyer, J.E., 2024, Specific conductance and fiber-optic distributed temperature sensing data collected at Operable Unit 2, North Chevalier Field Disposal Area (Site 11), Naval Air Station Pensacola, Florida, 2018–2022: U.S. Geological Survey data release, https://doi.org/10.5066/P1WQEBHV.
Moridnejad, M., Cameron, S., Shamseldin, A.Y., Verhagen, F., Moore, C., Melville, B.W., and Ward, N.D., 2020, Stream temperature modeling and fiber optic temperature sensing to characterize groundwater discharge: Ground Water, v. 58, no. 4, p. 661–673, accessed February 18, 2021, at https://doi.org/10.1111/gwat.12938.
National Weather Service, 2023, Temperature and precipitation data for Pensacola: National Oceanic and Atmospheric Administration, accessed April 1, 2023, at https://www.weather.gov/mob/climate_kpns.
Rosenberry, D.O., Briggs, M.A., Delin, G., and Hare, D.K., 2016, Combined use of thermal methods and seepage meters to efficiently locate, quantify, and monitor focused groundwater discharge to a sand-bed stream: Water Resources Research, v. 52, no. 6, p. 4486–4503, accessed June 4, 2021, at https://doi.org/10.1002/2016WR018808.
Slater, L.D., Ntarlagiannis, D., Day-Lewis, F.D., Mwakanyamale, K., Versteeg, R.J., Ward, A., Strickland, C., Johnson, C.D., and Lane, J.W., Jr., 2010, Use of electrical imaging and distributed temperature sensing methods to characterize surface water–groundwater exchange regulating uranium transport at the Hanford 300 Area, Washington: Water Resources Research, v. 46, no. 10, article W10533, 13 p., accessed October 5, 2023, at https://doi.org/10.1029/2010WR009110.
Tetra Tech, 2008, Pensacola Naval Air Station, Pensacola, Florida—Record of decision, operable unit 2: U.S. Navy, prepared by Tetra Tech, Pasadena, Calif., September 2008, accessed April 3, 2018, at https://cumulis.epa.gov/supercpad/SiteProfiles/index.cfm?fuseaction=second.docdata&id=0401221#SC.
Tetra Tech, 2016, Groundwater to surface water investigation—Operable unit 2—Site 11, North Chevalier Field Disposal Area: U.S. Navy Technical Memorandum, prepared by Tetra Tech, Pasadena, Calif., March 2016, accessed March 4, 2019, at https://cumulis.epa.gov/supercpad/SiteProfiles/index.cfm?fuseaction=second.docdata&id=0401221#SC.
U.S. Environmental Protection Agency [EPA], 2004, The ecological condition of the Pensacola Bay system, Northwest Florida (1994–2001): Gulf Breeze, Florida, U.S. Environmental Protection Agency, Office of Research and Development, National Health and Ecological Effects Research Laboratory, Gulf Ecology Division, EPA/620/R–05/002, 44 p.
U.S. Navy, 2015, Final record of decision amendment—Operable unit 2 (sites 11, 12, 25, 26, 27, and 30)—Naval Air Station Pensacola, Pensacola, Florida, revision no. 02: U.S. Navy, U.S. Naval Facilities Engineering Command Southeast, prepared by AGVIQ Environmental Services, 66 p., accessed September 27, 2023, at https://semspub.epa.gov/work/04/11053012.pdf.
Conversion Factors
Temperature in degrees Celsius (°C) may be converted to degrees Fahrenheit (°F) as follows:
°F = (1.8 × °C) + 32.
Temperature in degrees Fahrenheit (°F) may be converted to degrees Celsius (°C) as follows:
°C = (°F – 32) / 1.8.
Datums
Vertical coordinate information is referenced to mean sea level.
Horizontal coordinate information is referenced to the North American Datum of 1983 (NAD 83) and World Geodetic System of 1984 (WGS 84).
Altitude, as used in this report, refers to distance above the vertical datum.
Supplemental Information
Specific conductance is given in microsiemens per centimeter at 25 degrees Celsius (µS/cm at 25 °C).
Abbreviations
<
less than
DCE
dichloroethene
EPA
U.S. Environmental Protection Agency
FDEP
Florida Department of Environmental Protection
GPS
Global Positioning System
FO-DTS
fiber-optic distributed temperature sensing
IR
infrared
LCD
liquid crystal display
msl
mean sea level
NAS
Naval Air Station
NWFWMD
Northwest Florida Water Management District
PVC
polyvinyl chloride
SPAWAR
Space and Naval Warfare Systems Command
USGS
U.S. Geological Survey
For more information about this publication, contact
Director, South Atlantic Water Science Center
U.S. Geological Survey
1770 Corporate Drive, suite 500
Norcross, GA 30093
For additional information, visit
https://www.usgs.gov/centers/sawsc
Publishing support provided by
Lafayette Publishing Service Center
Disclaimers
Any use of trade, firm, or product names is for descriptive purposes only and does not imply endorsement by the U.S. Government.
Although this information product, for the most part, is in the public domain, it also may contain copyrighted materials as noted in the text. Permission to reproduce copyrighted items must be secured from the copyright owner.
Suggested Citation
Landmeyer, J.E., McBride, W.S., Tripp, C.H., and Singletary, M.A., 2024, Assessment of fresh groundwater discharge and saline surface-water intrusion at Operable Unit 2, North Chevalier Field Disposal Area (Site 11), Naval Air Station Pensacola, Florida, 2018–22: U.S. Geological Survey Scientific Investigations Report 2024–5058, 45 p., https://doi.org/10.3133/sir20245058.
ISSN: 2328-0328 (online)
Study Area
| Publication type | Report |
|---|---|
| Publication Subtype | USGS Numbered Series |
| Title | Assessment of fresh groundwater discharge and saline surface-water intrusion at Operable Unit 2, North Chevalier Field Disposal Area (Site 11), Naval Air Station Pensacola, Florida, 2018–22 |
| Series title | Scientific Investigations Report |
| Series number | 2024-5058 |
| DOI | 10.3133/sir20245058 |
| Publication Date | November 22, 2024 |
| Year Published | 2024 |
| Language | English |
| Publisher | U.S. Geological Survey |
| Publisher location | Reston, VA |
| Contributing office(s) | South Atlantic Water Science Center, Caribbean-Florida Water Science Center |
| Description | Report: x, 45 p.; Data Release |
| Country | United States |
| State | Florida |
| Other Geospatial | Naval Air Station Pensacola, North Chevalier Field Disposal Area (Site 11) |
| Online Only (Y/N) | Y |


