Assessment of the Interconnection Between Tampa Bay and the Floridan Aquifer System: Historical Groundwater Data Compilation and Analysis, 1976–2022
Links
- Document: Report (7.42 MB pdf) , HTML , XML
- Data Release: USGS water data for the Nation - USGS National Water Information System database
- NGMDB Index Page: National Geologic Map Database Index Page (html)
- Download citation as: RIS | Dublin Core
Abstract
The U.S. Geological Survey used existing data collected after the last major navigational channel modification in the mid-1980s to investigate groundwater levels and chloride concentrations in wells in the Floridan aquifer system and other aquifers beneath and near Tampa Bay. Tampa Bay is located on the west-central coast of Florida and provides access for commercial shipping. In 2021, the U.S. Army Corps of Engineers began to investigate alternatives to improve the efficiency of the deep-draft navigation channels within Tampa Bay, reduce costs, improve safety, and analyze the implications of modifying navigational channels. The Floridan aquifer system underlies Tampa Bay and is the primary source of public water supply in the region. Modifications to the channels have the potential to expose the Floridan aquifer system to the saltwater in Tampa Bay, with the potential to increase salinity in wells in the region. Other factors affecting the groundwater levels and the location of the freshwater/saltwater interface were also examined, including changes in sea level, groundwater extraction, and variations in climate.
Groundwater levels and well-construction reports were used to identify whether different aquifer units are well-connected. Twelve wells had available data before and after the last major channel modifications, which took place in the 1980s, with six datasets of chloride concentration available in areas along the northern and eastern coastline of Tampa Bay, which is nearest to historical dredging activities. Of these six, Kendall’s τ and p-values indicated increasing trends in chloride concentration for three datasets (TR 11-2, TR 10-2, 51), no trend in chloride concentration for two datasets (TR 9-3, 50), and a decreasing trend in chloride concentration for one dataset (TR 9-1). The upward trends in chloride concentration observed for TR 10-2 and 51 are likely the result of changes in local groundwater withdrawals. Well TR 11-2 had a gradual increasing trend in chloride concentration, fresh groundwater throughout the period of record, and a 3- to 4-foot increase in hydraulic head during the period of record, possibly caused by the construction and control of the Tampa Bypass Canal, resulting in changes to the regional potentiometric surface.
Introduction
Tampa Bay, also referred to herein as “the bay,” is a large, shallow embayment on the west-central coast of Florida that historically provided protected anchorage for ships (fig. 1). Increasing drafts of ships (depth of hull bottom below water line) necessitated the construction of a network of channels within the bay, beginning in the late 1800s (Lewis, 1976). The channels compose an extensive network over 40 miles (mi) in length that extends from the Gulf of Mexico to several ports, harbors, and industrial facilities along the 110 mi of Tampa Bay shoreline (Hutchinson, 1983) (fig. 2). Several deepening/widening and maintenance projects have been completed, and the channels currently range from 15 to 43 feet (ft) deep and from 130 to 500 ft wide within the bay and are over 90 ft just outside the mouth of the bay. The economic effects of the channel construction and modifications over the years have been substantial, with over 30 million tons of cargo being handled by the Tampa Port Authority in 2019 (U.S. Army Corps of Engineers [USACE], 2019). Martin and Associates (2016) estimated that activities at Port Tampa Bay (not shown; https://www.porttb.com) directly resulted in 16,040 jobs and $881 million in yearly personal income. An estimated 85,034 jobs were related to those same activities, with a yearly personal income of $5.1 billion. The effects on the economy of activities at Port Tampa Bay was estimated to be $15.6 billion yearly, producing $612 million in annual State and local sales taxes.
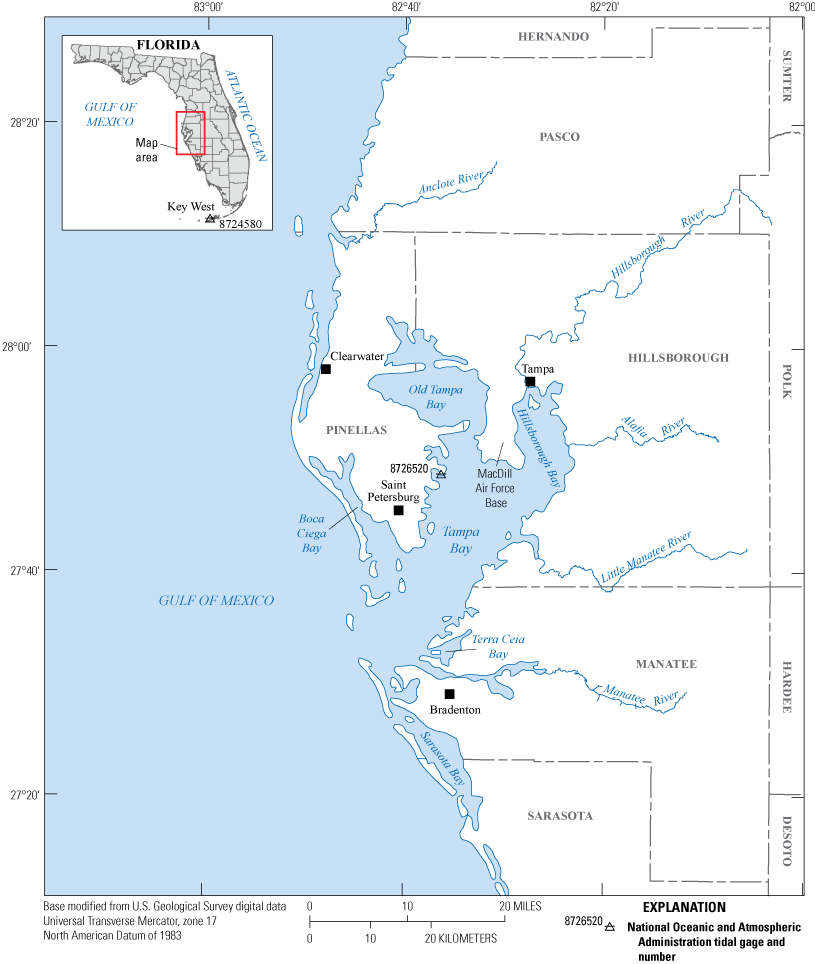
Study area surrounding Tampa Bay, Florida.
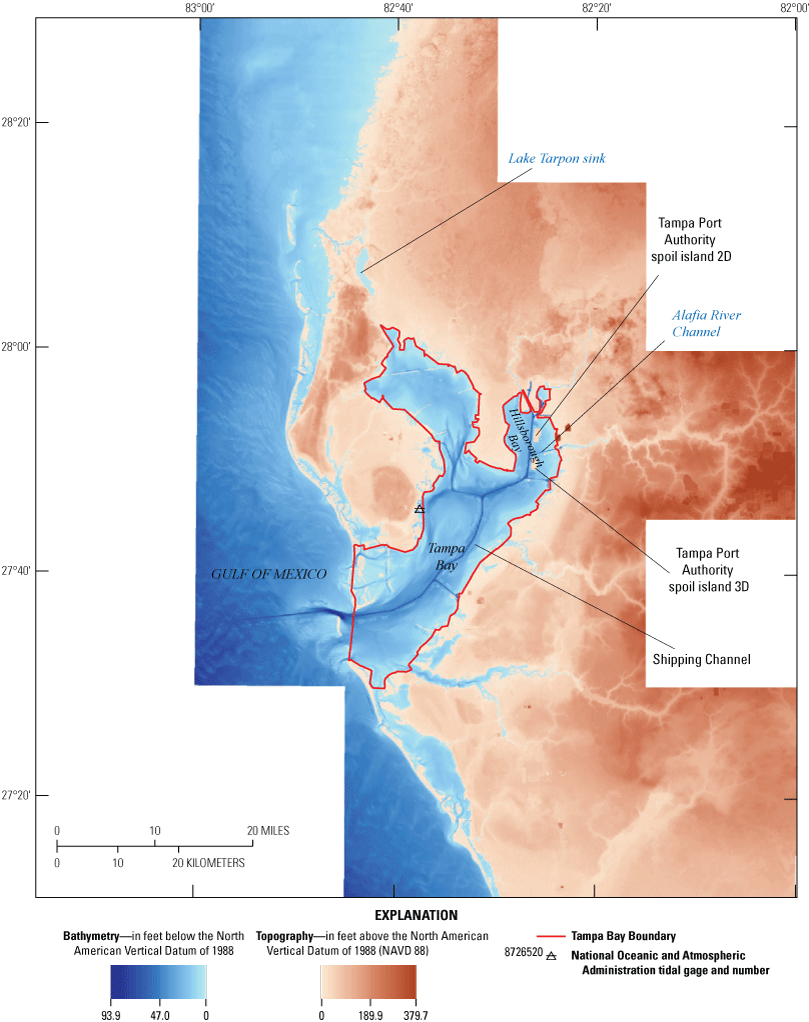
Topography and bathymetry of Tampa Bay, Florida (Cooperative Institute for Research in Environmental Sciences [CIRES], 2014).
Authorized dredging and channelization within the bay to accommodate larger ships began in the 1890s and has continued into the present, with the last major modification to the shipping channels having been completed in the mid-1980s. In August 2021, the USACE entered into an agreement with Port Tampa Bay to investigate alternatives to improve the ship navigation efficiency associated with the deep-draft navigation channels within the bay. The USACE investigation would also examine ways to reduce transportation costs and maintain safety in the Tampa Bay harbor. Among the alternatives being considered is further deepening and (or) widening of the shipping channels. There are some concerns regarding the potential environmental effects this activity may have on the bay. To address this issue, the U.S. Geological Survey (USGS), in cooperation with the USACE, initiated a study in 2023 to analyze the potential effects of channel modifications within the bay on changes in the potentiometric surface and groundwater salinity in areas surrounding the bay.
Purpose and Scope
The purpose of this report is to document the use of data compiled since the report by Hutchinson (1983) to analyze the potential effects that modifications to the shipping channels have had or may have had on the potentiometric surface and groundwater salinity in the coastal areas surrounding Tampa Bay (fig. 1). Existing groundwater level and geochemical data from the USGS National Water Information System (USGS, 2016) and data portal for the Southwest Florida Water Management District (SWFWMD, 2018a, b) were examined to investigate the effects of deepening or widening of navigation channels on the interconnection of the saline bay-water and groundwater, potential downward leakage of saline bay-water into the underlying aquifer, and the location and thickness of the saltwater front in the groundwater systems surrounding the bay. Hydraulic head and chloride concentration, in milligrams per liter, were examined in wells in the coastal areas surrounding the bay spanning the period 1976–2022.
The scope of this report includes analyses of available groundwater well data, including hydraulic head, geochemical, and well construction reports for wells within coastal areas surrounding the bay. Available data were analyzed to identify the factors that influence hydraulic heads and the locations and movement of the saltwater front. These factors include changes to mean tidal stage, groundwater withdrawals, and variations in rainfall and evapotranspiration. A second phase of this study, which is proposed but not part of this report, includes the development of a more refined groundwater model that incorporates variable density (freshwater to saltwater) to simulate the response of the groundwater system to breaches in the confining surficial sediments underlying Tampa Bay.
Groundwater data are available from several sources in the Tampa Bay region. Key sources of data used for this study are records from the Regional Observation and Monitor-well Program (ROMP) maintained by the SWFWMD and additional records maintained by the USGS (SWFWMD, 2018b; USGS, 2016). An inventory of available well data was compiled, and the groundwater data at well sites were analyzed for trends in water level and water quality. Statistical analysis of trends was based on the Kendall tau (τ) test (Helsel and others, 2020), using the R statistical package (R Core Team, 2022). The water-quality parameter of interest was chloride concentration, which is related to movement of the freshwater/saltwater interface.
Maps of the elevation of the potentiometric surface of the Floridan aquifer system (FAS) were also analyzed for trends related to hydrologic changes. A potentiometric surface is an imaginary surface representing the interpolation of static heads of groundwater within tightly cased wells that tap a confined aquifer (USGS, 2013). The potentiometric surface is equivalent to the water-table level within an unconfined aquifer and is typically mapped with contours for a particular time. The slope of the potentiometric surface is referred to as the “hydraulic gradient” and can be used to infer the direction of groundwater flow, given that groundwater flows down-gradient. The magnitude of the hydraulic gradient and an aquifer’s hydraulic properties determine the actual velocity and volumetric rate of the groundwater flow. The direction of groundwater flow is oriented perpendicular to the potentiometric contours, with flow traveling across them from higher areas of the potentiometric surface toward lower areas. The location, movement, and thickness of the saltwater front is affected by the hydraulic gradient and resulting groundwater flow rate. Trends in saltwater intrusion can be slowed, halted, or reversed by changes to the potentiometric surface and hydraulic gradient.
The relations between these trends and previous dredging activities within the bay, sea-level rise (SLR), and changes in water use were examined and are discussed. Regional changes within the hydrologic system are also compared to the predictive results of the related study conducted by Hutchinson (1983) surrounding previous channel modification activities.
Description of Study Area
Tampa Bay is adjacent to the Gulf of Mexico and is Florida’s largest open-water estuary (Goodwin, 1987). The bay is composed of several interconnected bays and lagoons grouped into seven segments: Hillsborough Bay, Old Tampa Bay, middle and lower Tampa Bay, Boca Ciega Bay, Terra Ceia Bay, and the tidal reach of Manatee River (fig. 1). Tampa Bay has a surface area of approximately 329 square miles and has an average bottom depth of 12.8 ft below the North American Vertical Datum of 1988 (NAVD 88) (fig. 2) (CIRES, 2014; SWFWMD, 2021a). The topography and bathymetry data within the drainage basin defined as Tampa Bay have elevations that range from −64.2 to 35.2 ft (NAVD 88), with areas above sea level consisting of Tampa Port Authority spoil islands 2D and 3D within Hillsborough Bay (fig. 2). The spoil islands serve as nesting areas for rare species of birds. Bathymetry values near the mouth of the bay include depths greater than 90 ft below NAVD 88. Locations of shipping channels are clearly indicated by linear features in the bathymetric map of the bay. Currently, the deepest channels are dredged to a depth of 43 ft below the bottom of the bay, corresponding to depths of approximately 50 to 60 ft below NAVD 88.
The area surrounding Tampa Bay is largely urbanized and includes the cities of Tampa, Saint Petersburg, Clearwater, and Bradenton, with Macdill Air Force Base situated on a peninsula that extends into the center of Tampa Bay (fig. 1). The four counties that surround the bay are Hillsborough, Pinellas, Pasco, and Manatee Counties. The combined population of these four counties has increased from 1.52 million in 1975 to 3.38 million in 2020—an increase of 122.4 percent (fig. 3) (Leach, 1978; U.S. Census Bureau, 1982, 2020, 2022). This population growth greatly outpaced that of the entire United States, whose population increased by 53.8 percent during the same period. Commercial, industrial, and recreational activities associated with the bay are a critical component of the regional economy, with commercial shipping also being an important component of the local economy.
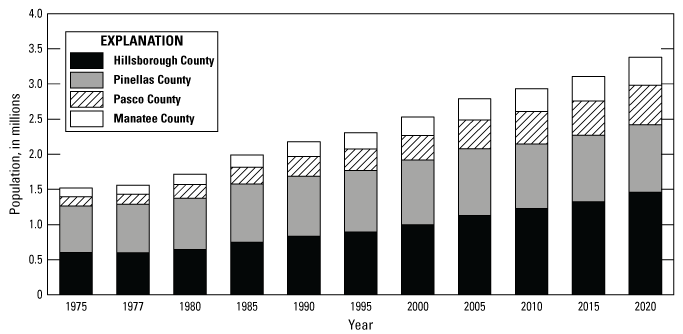
Population of the counties surrounding Tampa Bay, Florida, 1975–2020 (U.S. Census Bureau, 2020, 2022).
Previous Studies
A previous study of the hydrology of Tampa Bay was conducted by the USGS (Hutchinson, 1983) and included the development and testing of a groundwater model encompassing the Hillsborough Bay area in northeastern Tampa Bay (fig. 1) to test the possible effects of planned modifications to the channel network. The 97-square-mile domain of the groundwater model was oriented to align the vertical grid along the main shipping channel that was to be deepened under a proposed dredging project, which also included modifications to the Alafia River Channel (fig. 2). Five different scenarios were simulated: (1) existing channels with pumping; (2) dredged main shipping channel only with pumping; (3) dredged main shipping channel and Alafia River Channel with pumping; (4) existing channels without pumping; and (5) dredge main shipping channel and Alafia River Channel without pumping. The greatest hydrologic effects were expected to occur near a large industrial pumping center east of the main shipping channel along the Alafia River Channel where the dredging was likely to breach the upper confining bed. Historical potentiometric contours indicate a cone of depression once existed near this pumping center. The underlying Upper Floridan aquifer (UFA) already contained saltwater in the area but was believed to not be directly exposed to the bay prior to channel modifications.
The simulations by Hutchinson (1983) indicated that channel deepening would likely increase downward leakage into the FAS near the Alafia River Channel. However, the change in downward leakage with or without the channel modifications was small compared to the change in downward leakage with and without industrial pumping. Generally, when pumping and channel modifications were considered, the increased connectivity between the bay and the FAS would reduce the cone of depression near the pumping center and increase the potentiometric surface in the area by approximately 10 ft. The increased saltwater leakage through the channel cut would likely be drawn into the pumping center, reducing the stress on nearby freshwater resources formerly drawn to the well field. Additionally, the modifications to the main shipping channel would likely result in the potentiometric surface elevation equilibrating to bay water levels within Hillsborough Bay, resulting in slight increases in some areas and decreases in others. Dredging the Alafia River Channel had a much greater effect on the leakage and potentiometric surface than dredging the main shipping channel. These results not only indicated the potential effects of additional dredging within the bay, but also illustrated the affect that groundwater withdrawals had on regional groundwater flow.
Additional studies conducted by HydroGeoLogic, Inc., initially involved developing a sharp-interface model, then subsequently developing a density-dependent groundwater flow and solute transport model to simulate the position and movement of saline water in the UFA within the Southern Water Use Caution Area (HydroGeoLogic, Inc., 1994, 2002). The focus of these efforts was to analyze the effects of water extraction, rather than channel modifications, along the eastern coast of Tampa Bay and in areas south of the bay. Using the density-dependent groundwater flow and transport model, pumping scenarios of 400, 600, 800, and 1,000 million gallons per day (Mgal/d) were simulated with the Southern Water Use Caution Area, compared to a range of 562–832 Mgal/d reported within the same area during 1989–98. A total of 1,806 wells were included in the model domain. The model predicted 8.5 percent of them were affected by chloride concentrations exceeding 500 milligrams per liter (mg/L) under the then “current” conditions for the year 2000. After 50 years of water extraction, 12.4 percent could be affected by chloride concentrations exceeding 500 mg/L with pumping rates of 1,000 Mgal/d. In the highly permeable zone of the Avon Park Formation, the predicted inland movement of the saltwater front ranged from approximately 2.5 to 9 mi for the 400 and 1,000 Mgal/d pumping scenarios, respectively, after 50 years of simulation.
Collocated Unit Terminology Used in This Report
To help provide context to discussions in this report, collocated hydrogeologic and geologic units are mentioned where applicable. For brevity, the shortened designations shown in table 1 for these collocated units are used because most are referred to frequently in the text and because the full names of some hydrogeologic and geologic units are lengthy.
Table 1.
Designations used in this report for collocated hydrogeologic and geologic units.[SAS, surficial aquifer system; UCU, upper confining unit; UFA, Upper Floridan aquifer]
Geologic and Hydrogeologic Setting
The geologic setting of the Tampa Bay region includes unconsolidated sediment that overlies limestone bedrock. The unconsolidated sediment is referred to herein as “surficial sediment” and includes the surficial aquifer system (SAS). Surficial sediments form a confining unit that restricts vertical groundwater flow except where the sediment is breached by erosion or anthropogenic activities. These sediments are composed of sand, sandy-clay, and marl; have a total thickness of about 25 ft in the northern part of the bay, increasing to 250 ft in the southern part of the bay; and extend to areas surrounding the bay (Hutchinson, 1983). Below the surficial sediment lies Tertiary limestones of the UFA, which includes the Miocene Tampa Member of the Arcadia Formation and Hawthorn Group that overlies the Oligocene Suwannee Limestone. Deeper units include the Eocene Ocala Limestone and Avon Park Formation (Hutchinson, 1983; Williams and Kuniansky, 2015).
The hydrogeologic setting of the Tampa Bay region includes three primary aquifer units: the SAS, upper confining unit (UCU), and FAS (Miller, 1986; Arthur and others, 2008; Williams and Kuniansky, 2015) (fig. 4). The SAS is a permeable hydrogeologic unit that is contiguous with the land surface and has mostly unconfined water-table levels. Locally perched water-table conditions can occur. The SAS is not used as a major source of water within the region, with only minimal amounts of groundwater being withdrawn relative to those from the FAS (Marella, 2020). The SAS consists mostly of sand and locally may contain gravel and sandy limestone (Williams and Kuniansky, 2015). Arthur and others (2008) provide statistics concerning the hydraulic properties of the SAS, which varied widely. For example, the horizontal hydraulic conductivity ranged from 6.9 to 59.0 feet per day (ft/d), with a mean of 31.0 ft/d. Laboratory testing indicated the vertical conductivity was typically several orders of magnitude lower and ranged from 0.00002 to 1.86 ft/d, with a mean of 0.10 ft/d. The specific yield ranged from 0.005 to 0.26, with a mean of 0.15 (Arthur and others, 2008). These values likely correspond to areas and (or) depths having lower permeability because of sampling bias. The average thickness of the SAS is approximately 30 ft, excluding the ridges within the region (Arthur and others, 2008). Beneath Tampa Bay, the SAS is generally less than 40 ft thick and contains saltwater (Hutchinson, 1983). The SAS is not present everywhere in the region, however, and the FAS may be exposed in areas because of erosion or anthropogenic activities. In other areas, the SAS is either hydraulically well-connected to the FAS where the UCU is not present or provides “leaky” confinement.
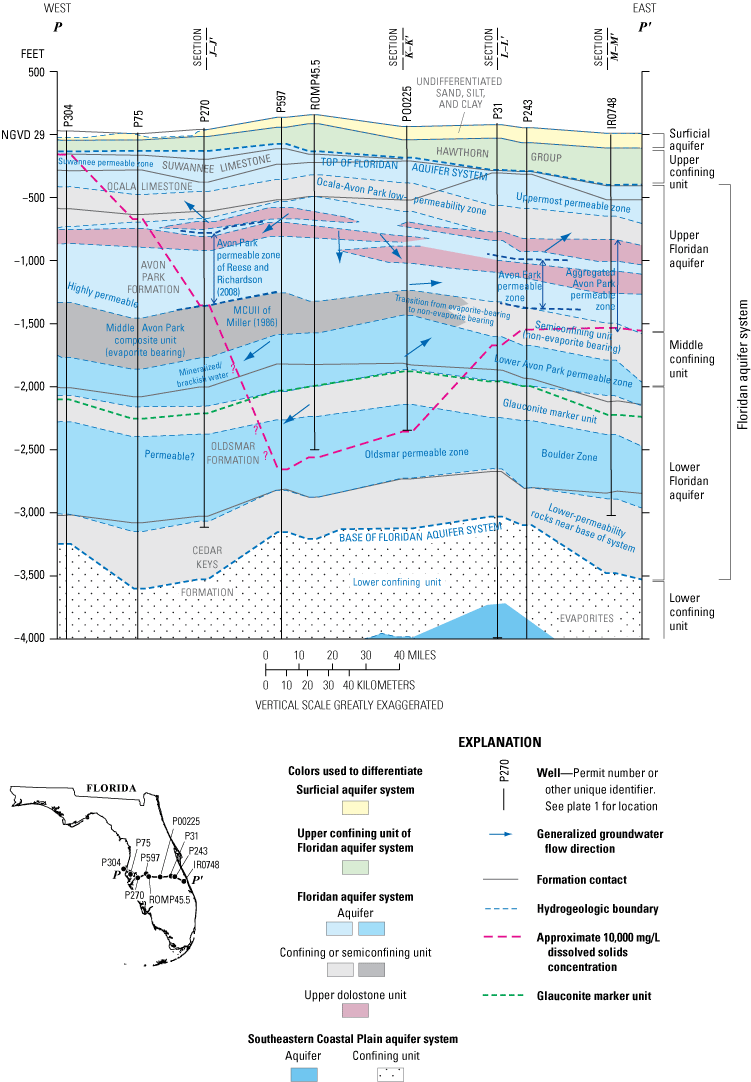
Generalized hydrogeologic cross section from offshore Pinellas County, Florida, to Indian River County, Fla. (from Williams and Kuniansky, 2015). NGVD 29, National Geodetic Vertical Datum of 1929.
The UCU, also known as the intermediate aquifer system/intermediate confining unit (IAS/ICU), lies below the SAS and generally is considerably lower in permeability than the SAS, effectively restricting the exchange of water between the SAS and underlying FAS. The UCU is present throughout much of Florida but is not present everywhere in the Tampa Bay region. Groundwater in the UCU is under confined conditions and is considered nearly hydraulically separated from the FAS (Arthur and others, 2008). The UCU separates the bay water from the FAS and generally thickens from north to south, having an average thickness of 25 ft in Old Tampa and Hillsborough Bays, increasing to approximately 250 ft in the southern part of Tampa Bay near the Gulf of Mexico. Locally, the UCU has been breached or removed by erosion or channelization exposing the FAS to saline bay water (Hutchinson, 1983).
The hydraulic properties of the UCU (IAS/ICU) are difficult to estimate, and the horizontal and vertical permeability of the system varies widely in the Tampa Bay region (Arthur and others, 2008). Arthur and others (2008) provided statistics of the hydraulic properties of the IAS/ICU. Using data from selected wells, they estimated the horizontal hydraulic conductivity ranged from 0.045 to 232.0 ft/d, with a mean of 38.5 ft/d. These values likely correspond to areas and (or) depths having higher permeability because of sampling bias. Laboratory testing indicated the vertical conductivity ranged from 0.00 to 0.03 ft/d, with a mean of 0.003 ft/d, which is considerably lower than the vertical conductivity of the SAS. The porosity ranged from 14.1 to 49.6 percent, with a mean of 34.1 percent (Arthur and others, 2008). The UCU is generally considered a single entity coinciding with the Hawthorn Group and contains multiple water-bearing zones separated by confining units. Discontinuous facies result in some zones being well-connected with other zones that abruptly culminate (Knochenmus, 2006). The resulting zones that are capable of being used as groundwater sources are discontinuous and difficult to map. Current estimates of the extent of these zones cover the majority of Manatee County and extend northward into the southern part of Hillsborough County. Areas north of these zones are generally characterized as having low permeability UCU sediments (Arthur and others, 2008). Groundwater withdrawals from the UCU in 2015 were 4.6 and 9.2 percent of total withdrawals for Hillsborough and Manatee Counties, respectively, and there were no reported groundwater withdrawals for Pinellas and Pasco Counties (Marella, 2020).
The FAS is present throughout the State of Florida and is considered the deepest part of the active groundwater system (Arthur and others, 2008). In general, the FAS is a vertical sequence of highly permeable carbonate rocks; however, the zones of high permeability are rarely vertically continuous. Well data indicate that the zones of very high permeability that typically conform to bedding planes alternate with zones whose permeability can be slightly to considerably lower (Miller, 1986; Williams and Kuniansky, 2015). Therefore, the FAS has been divided conceptually into an upper and lower zone, namely the UFA and Lower Floridan Aquifer (LFA), with these higher permeability zones separated by middle Floridan composite and confining units. Within the areas surrounding the bay, the UFA is approximately 1,100 ft thick (Arthur and others, 2008). The middle composite and confining units within the FAS are regional, noncontinuous, and not present in some areas. The FAS is everywhere underlain by low-permeability rocks referred to as the “lower confining unit” (Miller, 1986; Williams and Kuniansky, 2015).
The FAS contains groundwater under confined conditions where overlain by the UCU and can contain groundwater under unconfined conditions where directly connected to the SAS or exposed. The FAS is used regionally as a water-yielding hydrologic unit and is the primary source of drinking water for approximately 10 million people across the southeastern United States (Arthur and others, 2008; Bellino and others, 2018). The UFA contains freshwater portions that are the principal source of freshwater supply for the Tampa Bay region. Groundwater withdrawals for 2015 from the FAS totaled 293.8 Mgal/d for the four counties that surround the bay (Hillsborough, Pinellas, Manatee, and Pasco Counties) (Marella, 2020). Along the coastal regions of Florida, the LFA typically contains brackish to saline water that is not economically feasible for use as a potable water source.
Arthur and others (2008) provided statistics on the hydraulic properties of the FAS. Using data from selected wells, they estimate the horizontal hydraulic conductivity ranged from 7.7 to 6,050 ft/d, with a mean of 276.6 ft/d. Laboratory testing indicated the vertical conductivity ranged from 0.00 to 1.73 ft/d, with a mean of 0.10 ft/d. The porosity ranged from 2.3 to 53.5 percent, with a mean of 37.1 percent (Arthur and others, 2008).
Hydrologic Stressors and Groundwater Flow
The direction of groundwater flow and the position of the saltwater front in aquifers are affected by hydrologic stressors such as groundwater withdrawals (pumping from wells), SLR, climate variability (changes in rainfall and evapotranspiration [ET]), and regional groundwater flow directions and gradients. The flow directions and gradients are inferred from maps of groundwater levels, commonly referred to as a “potentiometric surface maps.”
Groundwater Withdrawals
The total groundwater withdrawals from all aquifers, which include withdrawals for industrial, agricultural, and public supply, averaged 408 Mgal/d for the four counties surrounding Tampa Bay for 1975–2015 (fig. 5, table 2) (Leach, 1978, 1983; Leach and Healy, 1980; Marella, 1988, 1992, 1999, 2004, 2009, 2014, 2020). The peak withdrawal for this period occurred in 2000 and was 502 Mgal/d, which decreased to 308 Mgal/d by 2015. For these four counties, 294 Mgal/d of the total 308 Mgal/d of groundwater withdrawals for 2015, which corresponds to 95 percent, were withdrawn from the FAS (Marella, 2020). The reduction in total withdrawals from the peak in 2000 to 2015 can be attributed to several factors, which include decreased withdrawals for agricultural and public supply.
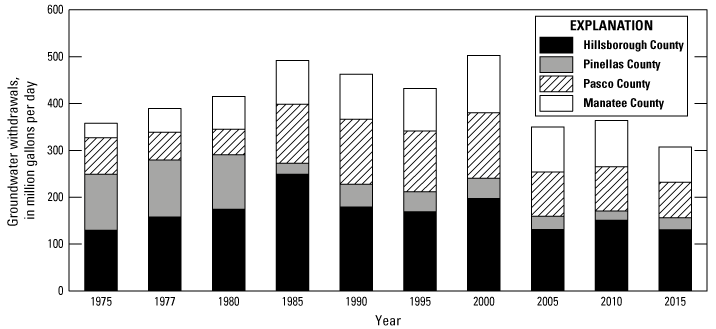
Groundwater withdrawals for Hillsborough, Pinellas, Pasco, and Manatee Counties, Florida, 1975–2015 (Leach, 1978, 1983; Leach and Healy, 1980; Marella, 1988, 1992, 1999, 2004, 2009, 2014, 2020).
Table 2.
Groundwater withdrawals for selected Florida counties, 1975–2015 (Leach, 1978, 1983; Leach and Healy, 1980; Marella, 1988, 1992, 1999, 2004, 2009, 2014, 2020).[Mgal/d, millions of gallons per day]
Hutchinson (1983) reported that in 1977, groundwater withdrawals from the FAS averaged approximately 330 Mgal/d for the Tampa Bay region. Marella (2020; table 2) reported groundwater withdrawals of 389 Mgal/d. The discrepancy between estimates results from the exclusion of Pasco County by Hutchinson (1983) from the Tampa Bay region. An estimated 271 Mgal/d of the 330 Mgal/d was considered freshwater and 59 Mgal/d was considered saline water, of which 55 Mgal/d was withdrawn from wells at a phosphate processing plant at the mouth of the Alafia River. Leach and Healy (1980) provided a similar estimate of industrial self-supplied saline groundwater for Hillsborough County of 57 Mgal/d in 1977 (table 3).
Table 3.
Industrial groundwater withdrawals for self-supplied industrial use in Hillsborough County, Florida, 1975–2015 (Leach, 1978, 1983; Leach and Healy, 1980; Marella, 1988, 1992, 1999, 2004, 2009, 2014, 2020).[Mgal/d, millions of gallons per day]
A cone of depression in the potentiometric surface of an aquifer can result from water withdrawals from wells. Changes in the potentiometric surface over time are discussed later in the “Historical Potentiometric Surface Data” section of this report. A cone of depression near the mouth of the Alafia River in Hillsborough County was present on the potentiometric surface map for May 1978 and was attributed by Hutchinson (1983) to these industrial withdrawals of saline water from the FAS at a depth of approximately 1,000 ft, which would likely be within the UFA/Avon Park Formation. Between the 1980 and 1985 water use estimates for the State of Florida, the industrial supply of saline water from the FAS for Hillsborough County decreased to zero, where it remained through 2015 (table 3) (Leach, 1978, 1983; Leach and Healy, 1980; Marella, 1988, 1992, 1999, 2004, 2009, 2014, 2020). These data indicate the phosphate processing plant at the mouth of the Alafia River no longer relied on self-supplied saline groundwater withdrawals from the FAS after 1985 and perhaps as early as 1981.
Hutchinson (1983) noted two additional cones of depression in the Tampa Bay region in the May 1978 potentiometric surface map for the FAS. One depression in Pasco County was attributed to municipal withdrawals, and a second depression in southern Hillsborough and northern Manatee Counties was attributed to agricultural withdrawals. The groundwater withdrawals for public supply within Hillsborough, Pinellas, Pasco, and Manatee Counties averaged 168 Mgal/d for the 1975–2015 period and peaked at 242 Mgal/d in 2000 (fig. 6) (Leach, 1978, 1983; Leach and Healy, 1980; Marella, 1988, 1992, 1999, 2004, 2009, 2014, 2020). In 1975, 88 percent of the groundwater withdrawals for public supply occurred in Pinellas County. By 1985, public-supply groundwater withdrawals occurring in Hillsborough and Pasco Counties exceeded those in Pinellas and Manatee Counties, and this remained the case through 2015 (fig. 6).
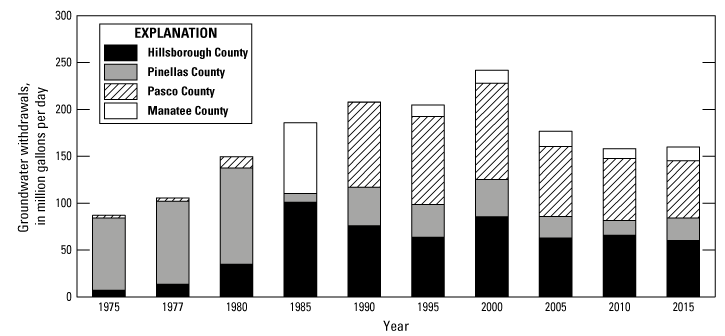
Public-supply groundwater withdrawals for Hillsborough, Pinellas, Pasco, and Manatee Counties, Florida, 1975–2015 (Leach, 1978, 1983; Leach and Healy, 1980; Marella, 1988, 1992, 1999, 2004, 2009, 2014, 2020).
Agricultural water withdrawals can vary greatly from year to year and depend on climatic conditions. Such conditions reduce the recharge to aquifers and often lead to lower regional water-table levels and potentiometric surfaces, while simultaneously increasing demand for agricultural withdrawals. These factors work to increase the magnitude and spatial extent of drawdowns during drier years, which can then lead to further inland movement of the saltwater front. The agricultural groundwater withdrawals for 1975–2015 averaged 161.6 Mgal/d and reached a peak of 229.6 Mgal/d in 1985 for the four counties that surround the bay, with most of the withdrawals occurring in Hillsborough and Manatee Counties (fig. 7A) (Leach, 1978, 1983; Leach and Healy, 1980; Marella, 1988, 1992, 1999, 2004, 2009, 2014, 2020). Annual rainfall for the four counties during these years ranged from 31.3 to 66.2 inches (in.) (fig. 7B) (SWFWMD, 2022).
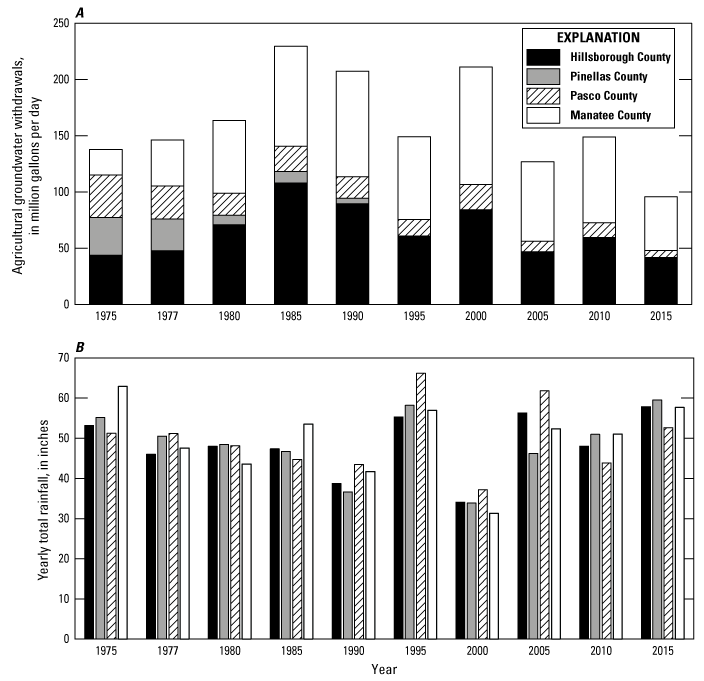
A, Agricultural groundwater withdrawals, and B, annual rainfall totals for Hillsborough, Pinellas, Pasco, and Manatee Counties, Florida, 1975–2015 (Leach, 1978, 1983; Leach and Healy, 1980; Marella, 1988, 1992, 1999, 2004, 2009, 2014, 2020; SWFWMD, 2022).
Overall, in the Tampa Bay region, total groundwater withdrawals and public-supply withdrawals of groundwater peaked around 2000, and agricultural withdrawals peaked in the mid-1980s (Leach, 1978, 1983; Leach and Healy, 1980; Marella, 1988, 1992, 1999, 2004, 2009, 2014, 2020). Additionally, the industrial saline groundwater withdrawals at the mouth of the Alafia River ceased between 1980 and 1985. These withdrawals placed stress on the aquifer system, which is evident on the potentiometric surface maps presented and discussed later in the “Historical Potentiometric Surface Data” section.
Sea-Level Rise
SLR is expected to increase groundwater elevations in coastal aquifers with the effects extending some distance inland (Bjerklie and others, 2012; Rotzoll and Fletcher, 2013; Decker and others, 2019; Decker, 2022). The distance inland over which SLR affects aquifers depends on many factors, including aquifer characteristics, surface-water controls, groundwater recharge, and groundwater extraction. In coastal areas, increased sea-level elevation can decrease gradients in the potentiometric surface, causing inland migration of the saltwater front. Intrusion of saline water into areas of groundwater extraction can necessitate mitigation strategies such as decreasing well production or possibly abandoning or relocating well fields.
Historical
Although not in the area of Tampa Bay, the Key West, Florida tidal gage (National Oceanic and Atmospheric Administration, [NOAA], 8724580) (figs. 1 [inset map] and 8) in southernmost Florida has one of the longest continuous periods of record within the State and is often used to analyze long-term trends in mean sea level (NOAA, 2023a). The trend in monthly mean tidal level can vary based on the period of record considered. The linear trend in monthly mean tidal level at Key West, Fla., when using all 110 years of available data from 1913 to 2022 is an increase in sea level of 0.101 inch per year (in/yr) (fig. 8). The linear trend over the 37-year period from 1986 to 2022 is an increase of 0.175 in/yr, indicating an increased rate of SLR in recent decades. Similar trends have been measured at the St. Petersburg, Fla. tidal gage (NOAA 8726520) (figs. 1, 2, and 9) (NOAA, 2023b). The linear trend in monthly mean tidal level was an increase of 0.120 in/yr for the 76-year period 1947–2022 and an increase of 0.181 in/yr for 1986–2022, which indicates approximately 6.7 in. or 0.56 ft of SLR over the last 37 years (fig. 9). The mean tidal level at the St. Petersburg, Fla. tidal gage during 1986–2022 was −0.13 ft (NAVD 88). The increased elevation of mean sea level within the bay likely caused a similar increase in hydraulic heads in the underlying aquifer and for some distance inland. This likely caused the saltwater/freshwater interface to move farther inland, but the amount of movement has not been quantified.
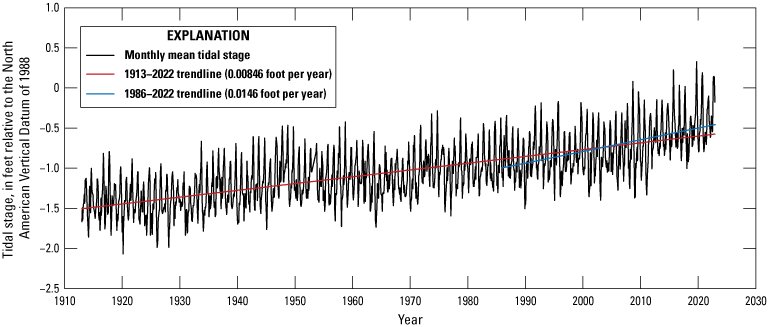
Monthly mean tidal stage at Key West, Florida, tidal gage (National Oceanic and Atmospheric Administration [NOAA] Station 8724580) and linear models of trends (NOAA, 2023a).
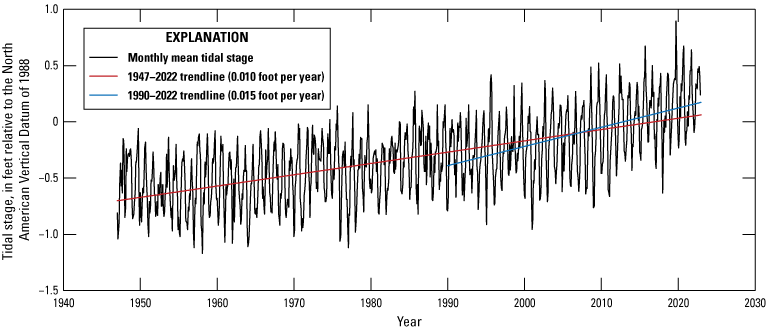
Monthly mean sea level at St. Petersburg, Florida, tidal gage (National Oceanic and Atmospheric Administration [NOAA] Station 8726520) and linear models of trends (NOAA, 2023b).
Projected
Projections of sea-level rise in the future are used during planning processes and analyses of alterations to the hydrologic system within a coastal environment (Sweet and others, 2017; Decker, 2022). The NOAA projections of global mean sea-level rise include six projection scenarios that range from 0.98 ft to 8.20 ft of SLR by 2100 (Sweet and others, 2017). These scenarios can be adjusted by incorporating nearby tidal gages to create regional projections of future sea level. The likelihood of exceeding these SLR projections has been quantified under different representative concentration pathways (RCPs) that correspond to possible future greenhouse gas concentrations and radiative forcing through 2100: RCP 2.6, RCP 4.5, and RCP 8.5 (table 4). The RCP 2.6 scenario is considered unlikely and would require strong mitigation activities with net-negative greenhouse gas emissions toward the end of the 21st century (Sweet and others, 2017). The RCP 4.5 scenario is an intermediate and most likely scenario in which emissions are stabilized by 2050 then begin to decline in the latter half of the 21st century. The RCP 8.5 scenario is generally taken as the worst-case scenario in which emissions continue to rise throughout the 21st century. The range and likelihood of these projections is intended to be incorporated into a risk-based approach to coastal planning and management.
Table 4.
Probability of exceeding global mean sea-level rise scenarios under different representative concentration pathways (Sweet and others, 2017).[NOAA, National Oceanic and Atmospheric Administration; GMSL, global mean sea level; ft, foot; SLR, sea-level rise; RCP, representative concentration pathway; %, percent]
The Tampa Bay Climate Science Advisory Panel (TBCSAP) recommends using the NOAA intermediate-low, intermediate, and high SLR projection curves for planning projects within the Tampa Bay region (TBCSAP, 2019). These three SLR curves are a subset of the six SLR curves presented by NOAA and exclude the low, intermediate-high, and extreme scenarios (table 4). When the global mean sea-level rise projections were adjusted regionally using data from the St. Petersburg, Fla. tidal gage (NOAA 8726520) and the USACE Sea Level Change Curve Calculator Tool (USACE, 2022), the intermediate-low, intermediate, and high NOAA SLR projections result in 1.9, 3.9, and 8.5 ft of SLR between 2000 and 2100, respectively (table 5) (TBCSAP, 2019).
These regional projections can be reproduced using the Sea Level Analysis Tool (USACE, 2023), which superseded the USACE Sea Level Change Curve Calculator Tool. The 5-year mean sea level centered on the year 2000 was calculated to be −0.25 ft (NAVD 88) based on St. Petersburg Fla. tidal gage data for 1998–2002. Adding the SLR projections to mean sea level for 2000 results in projected sea levels for 2100 of 1.65, 3.65, and 8.25 ft (NAVD 88) for the intermediate-low, intermediate, and high SLR scenarios, respectively (table 5, fig. 10). These scenarios for projected sea levels can be compared to a calculated sea level of 1.26 ft (NAVD 88) for 2100, obtained by adding the 0.181 in/yr averaged linear trend observed for 1986–2022 at the St. Petersburg Fla. tidal gage (NOAA 8726520) to the mean sea level for 2000. Based on the published data in table 4, SLR will likely exceed the intermediate-low SLR scenario but will likely not exceed the intermediate scenario under the most likely RCP 4.5 scenario. The 5-year mean sea level at the St. Petersburg Fla. tidal gage has trended near or slightly above the NOAA intermediate-low SLR projections during 2000–20, with an increasing rate toward the end of the available record (fig. 11). The 5-year mean sea level at the St. Petersburg Fla. tidal gage increased 0.43 ft between 2000 and 2020 compared to projected values of 0.37, 0.53, and 0.83 ft interpolated from the intermediate-low, intermediate, and high NOAA SLR projections, respectively. If sea level continues to trend toward the intermediate-low and intermediate SLR scenarios, then the likely SLR for the Tampa Bay region, referenced to the year 2000, will be between 0.95 and 1.44 ft for 2050 and between 1.90 and 3.90 ft for 2100. The resulting expected mean sea level would be between 0.7 and 1.19 ft (NAVD 88) for 2050 and between 1.10 and 2.08 ft for 2100 (NAVD 88) (table 5).
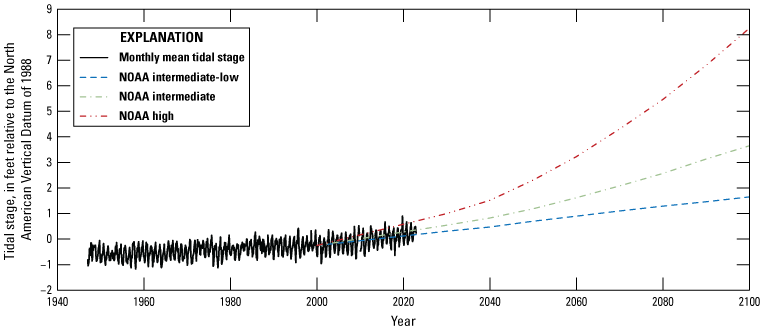
Monthly mean sea level at the National Oceanic and Atmospheric Administration (NOAA) St. Petersburg, Florida, tidal station 8726520 with NOAA intermediate-low, intermediate, and high sea-level rise projections, 2000–2100 (NOAA, 2023b; Tampa Bay Climate Science Advisory Panel [TBCSAP], 2019).
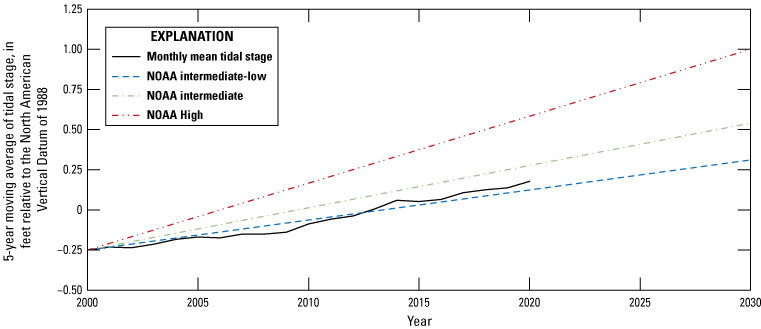
Five-year moving average of monthly mean sea level at the National Oceanic and Atmospheric Administration (NOAA) St. Petersburg, Florida, tidal station 8726520 with NOAA intermediate-low, intermediate, and high sea-level rise projections (NOAA, 2023b; Tampa Bay Climate Science Advisory Panel [TBCSAP], 2019).
Table 5.
Projected regional sea-level rise and regional mean sea level for the Tampa Bay region for National Oceanic and Atmospheric Administration scenarios (Tampa Bay Climate Science Advisory Panel [TBCSAP], 2019).[NOAA, National Oceanic and Atmospheric Administration; ft, foot; NAVD 88, North American Vertical Datum of 1988; int-low, intermediate-low]
Rainfall and Evapotranspiration
Rainfall recharges groundwater in an aquifer, whereas evapotranspiration returns rainfall or surface water back to the atmosphere (Freeze and Cherry, 1979; Davie, 2008). Rainfall that does not recharge groundwater or return to the atmosphere can become surface runoff to rivers or directly to the bay. Aquifers can also discharge water to the land surface or sea floor given the right hydrologic conditions, such as at springs. In the Tampa Bay region, the FAS is recharged in three primary ways: inland areas are recharged by downward leakage of rainfall through the overlying SAS and confining unit or directly where the FAS is exposed at land surface; areas under the bay are recharged by leakage from the bay that occurs through surficial sediments or directly where the FAS is exposed at the sea floor; and the FAS can receive water through interflow from adjacent aquifers (Hutchinson, 1983).
The amount of precipitation minus evapotranspiration (ET) occurring over an area represents the net water flux available for recharge to an aquifer, with increases in rainfall and decreases in ET likely leading to increased recharge (Freeze and Cherry, 1979; Davie, 2008). Conversely, decreases in rainfall and increases in ET would likely lead to decreased recharge to an aquifer. The elevation of a potentiometric surface is controlled by recharge to an aquifer as well as other factors such as changes in storage and discharge (Taylor and Alley, 2001). Years for which precipitation minus ET totals are higher than average will likely also have higher potentiometric levels in inland areas where the FAS is exposed and the aquifer is recharging and, as a result, increased potentiometric gradients toward the coast. The increased gradient can decrease or stop the inland movement of the saltwater front or even lead to coastward movement of the front. Seasonal variations in precipitation minus ET will also alter the potentiometric surface, with elevations typically being higher during the wet season than during the dry season.
From 1915 to 2022, the mean annual rainfall totals for the four counties surrounding Tampa Bay were 52.7, 51.7, 53.4, and 54.0 in. for Hillsborough, Pinellas, Manatee, and Pasco Counties, respectively (fig. 12, table 6) (SWFWMD, 2022). The minimum annual rainfall totals over the same period were 34.1, 33.8, 34.4, and 31.3 in. for these counties, respectively, and the maximum annual rainfall totals over the same period were 80.7, 85.2, 84.8, and 75.7 in., respectively. The mean annual rainfall totals averaged for all four counties for 1915–2022 was 53.0 in., with a standard deviation of 7.8 in. The minimum and maximum annual rainfall for the same period were 34.1 and 81.6 in., respectively (fig. 13, table 6).
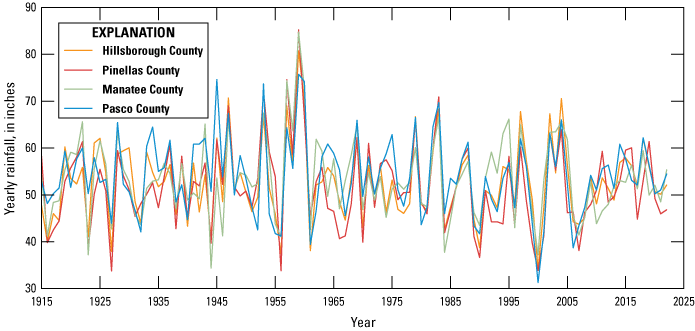
Annual rainfall totals for each of the four counties surrounding Tampa Bay (Southwest Florida Water Management District [SWFWMD], 2022).
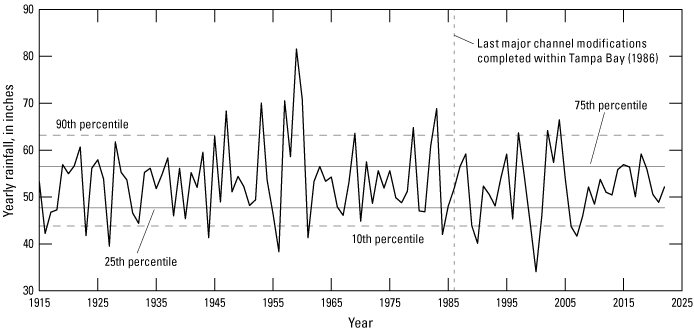
Annual rainfall totals averaged over the four counties surrounding Tampa Bay (Hillsborough, Pinellas, Manatee, and Pasco Counties) (Southwest Florida Water Management District [SWFWMD], 2022).
Table 6.
Summary of rainfall totals and statistics for 1915–2022 for the counties surrounding Tampa Bay (Southwest Florida Water Management District [SWFWMD], 2022).[in., inch]
Prolonged periods of below-normal rainfall could lower inland groundwater levels altering the potentiometric gradient toward the bay (Taylor and Alley, 2001). Reduced elevations within the potentiometric surface could increase the intrusion of saltwater from Tampa Bay into aquifers surrounding the bay (Hutchinson, 1983). In areas underlying the bay, a potentiometric surface with higher mean values relative to mean tidal levels will generally result in upward groundwater discharge from the FAS rather than downward leakage of saline water into the FAS. Net leakage of saline water from the bay into the FAS will likely occur when the mean potentiometric surface falls below mean tidal levels (Hutchinson, 1983). Cones of depression in the potentiometric surface caused by groundwater extraction typically enlarge during drier years and shrink or disappear during wetter years. ET tends to exhibit less year-to-year variation, but years of increased actual ET can produce similar effects by reducing the net recharge to the aquifer systems and lowering the potentiometric surface.
For the period 1986–2022 (37 years), which corresponds to the years following the last major channel modifications, the mean of the yearly rainfall for the four counties surrounding Tampa Bay was 51.9 in., with a standard deviation of 6.8 in. For the 37 years (1949–85) preceding this period, the mean of the yearly rainfall was 54.2 in., which is 4.3 percent greater than the subsequent period, with a standard deviation of 6.8 in. (table 6). The minimum and maximum of the mean yearly rainfall for 1986–2022 were also lower than the rainfall for 1949–85: 34.1 in. compared to 38.4 in., and 66.5 in. compared to 81.6 in. Based on the entire measurement period, the number of years considered “drier than average,” which fall below the 25th percentile (47.8 in.), and those are considered a “dry” year, which fall below the 10th percentile (43.9 in.), were both higher for 1986–2022 than for 1949–85: 9 “drier than average” years during 1986–2022 compared to 8 “drier than average” years during 1949–85, and 4 “dry” years during 1986–2022 compared to 3 “dry” years during 1949–85. The number of years considered “wetter than average”, which exceed the 75th percentile (56.6 in.), and those considered a “wet” year , which exceed the 90th percentile (63.2 in.), were lower during 1986–2022 compared to 1949–85: 8 “wetter than average” years during 1986–2022 compared to 10 “wetter than average” years during 1949–85, and 3 “wet” years during 1986–2022 compared to 7 “wet” years during 1949–85. The increased number of “drier than average” years and an overall reduction in rainfall after 1986 might be contributing factors in saltwater intrusion in the coastal areas surrounding the bay.
Estimates of actual ET are available for the conterminous United States using an operational Simplified Surface Energy Balance (SSEBop) model (Senay and others, 2013) for 2000–18. These are estimates of the net depth of water removed from the system and are a fraction of the calculated potential ET, which represents the atmospheric demand if sufficient water were available. For 2000–18, the average annual actual ET totals for the four counties surrounding the bay were 36.6, 37.3, 38.2, and 30.4 in/yr for Hillsborough, Pinellas, Manatee, and Pasco Counties, respectively (table 7). Actual ET has less yearly variability when compared to other atmospheric forcings like rainfall (fig. 14). The mean of the estimated precipitation minus ET for the four counties, calculated by subtracting actual ET from the rainfall totals, ranged from 1.0 to 29.2 in. for 2000–18 (fig. 14, table 7). A value of 0.0 was assigned for a given county’s effective yearly rainfall total when estimated actual ET was larger than that county’s yearly rainfall total, which occurred only in 2000 for Hillsborough County.
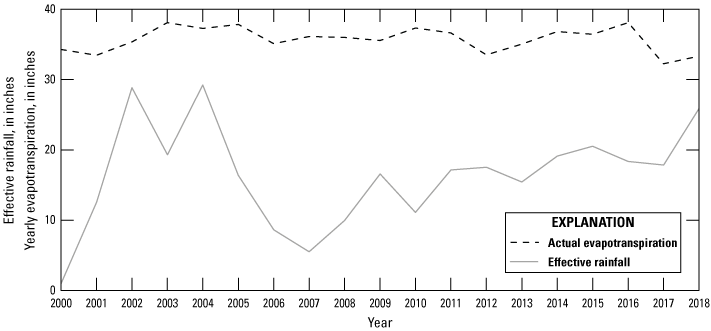
Mean estimated actual evapotranspiration and precipitation minus evapotranspiration totals for the four counties surrounding Tampa Bay (Hillsborough, Pinellas, Manatee, and Pasco Counties) (Senay and others, 2013).
Table 7.
Summary of yearly actual evapotranspiration and precipitation minus evapotranspiration totals for the counties surrounding Tampa Bay, 2000–18.[ET, evapotranspiration; in, inch]
Historical Potentiometric Surface Data
Historical potentiometric surface contours for the UFA in the Tampa Bay region have been created by the SWFWMD and USGS since 1975 (SWFWMD, 2021b). These data are referenced to the National Geodetic Vertical Datum of 1929 (NGVD 29), which is inconsistent with other data presented and discussed within this report. For reference purposes, when converting from NGVD 29 to NAVD 88, the SWFWMD reports a shift range of +0.7 to +1.1 ft across the entire district (SWFWMD, 2018a). Tidal values at the St. Petersburg Fla. NOAA tidal station (8726520; NOAA, 2023a) were compared to potentiometric surface elevations and have a NGVD 29 to NAVD 88 shift of +0.873 ft. For reference, the mean tidal level was 0.44 ft (NGVD 29) during May 1978, with mean high and low water levels of 1.14 and −0.25 ft (NGVD 29), respectively (table 8). Areas of the potentiometric-surface map with hydraulic head values lower than the mean tide would tend to have a net downward migration of saline water from the bay into the UFA where that aquifer is exposed. Areas where the potentiometric surface for the UFA exceeds mean tidal levels would tend to have groundwater discharging upward to the bay from the UFA where the aquifer is exposed.
Table 8.
Mean tidal levels for the month of May for National Oceanic and Atmospheric Administration (NOAA) St. Petersburg, Florida, tidal station 8726520 (NOAA, 2023b).[ft, foot; NAVD 88, North American Vertical Datum of 1988; NGVD 29, National Geodetic Vertical Datum of 1929]
A baseline potentiometric surface created to represent estimated predevelopment conditions corresponding to the period 1880–1930 indicates predevelopment groundwater flow directions were oriented toward the bay and Gulf of Mexico throughout the study area (fig. 15). The predevelopment potentiometric surface map has estimated hydraulic heads within the UFA that exceed tidal levels across the entire study area (fig. 15), which indicates that the natural setting of the UFA would be to discharge to Tampa Bay where exposed. Note that there were no cones of depression on the predevelopment potentiometric map (fig. 15).
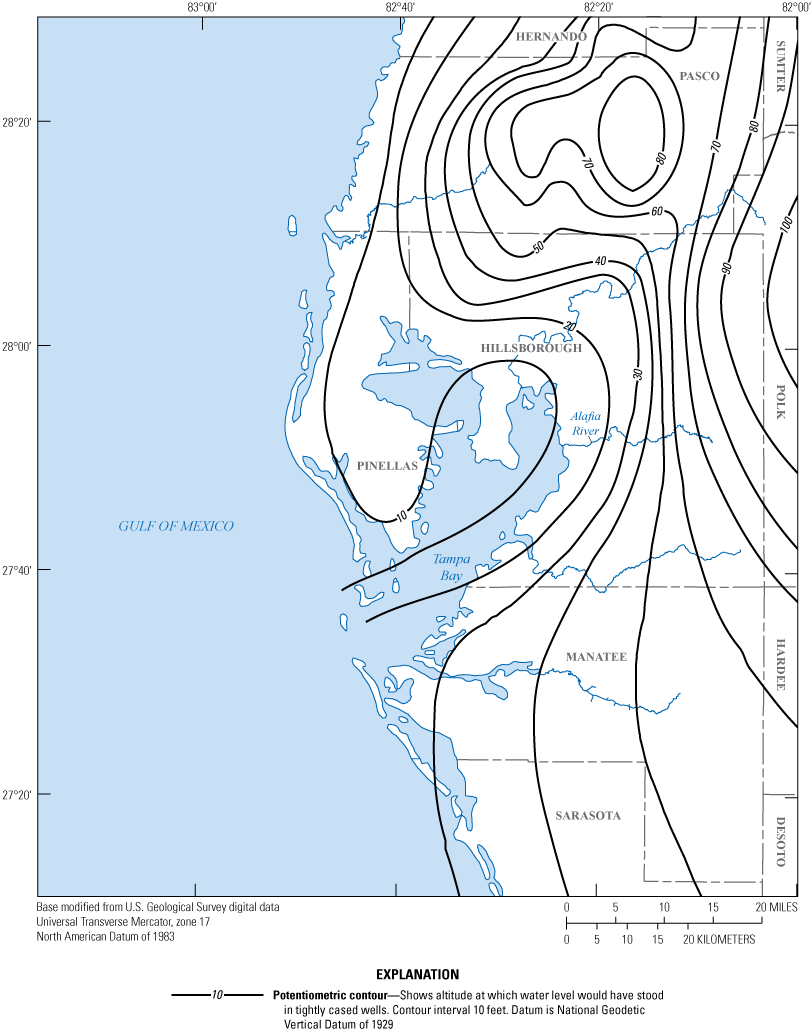
Estimated predevelopment (1880–1930) potentiometric surface of the Floridan aquifer system (Southwest Florida Water Management District [SWFWMD], 2021b).
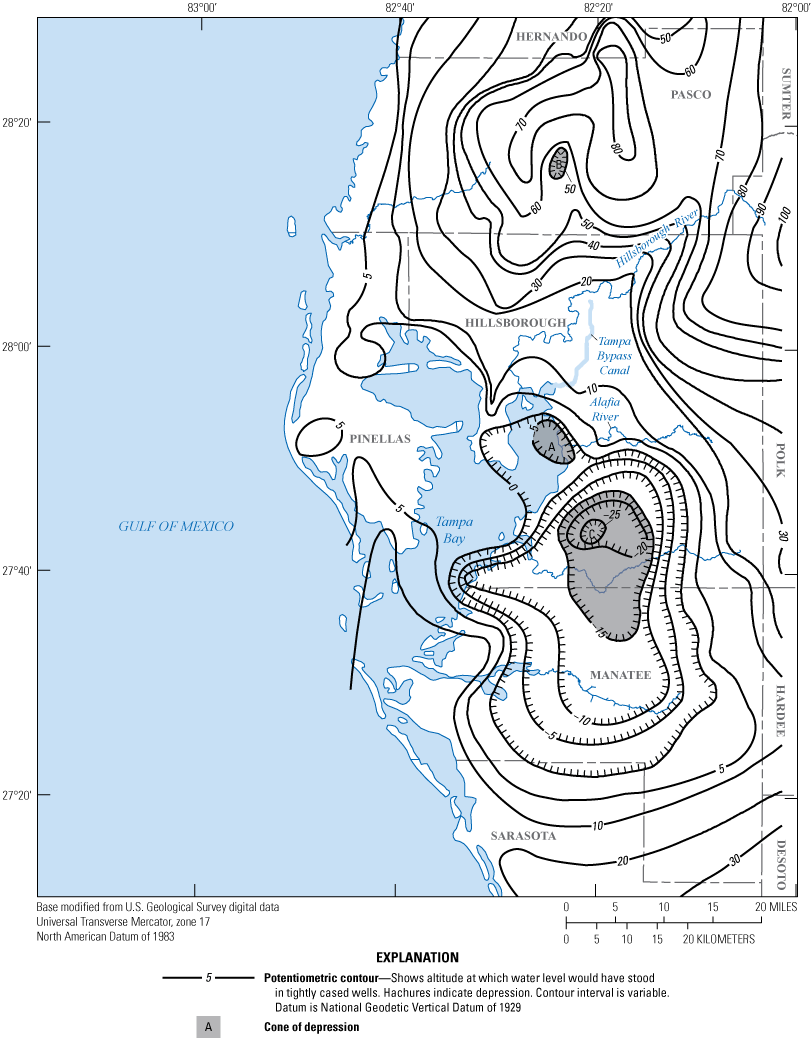
Hutchinson (1983) noted three cones of depression in the potentiometric surface of the UFA for May 1978 (labelled “A,” “B,” and “C” in fig. 16). The month of May typically corresponds to the end of the dry season when hydraulic heads are likely lowest for the year and pumping stresses are highest. Cone of depression A in Hillsborough County corresponds to the industrial extraction of saline groundwater at the mouth of the Alafia River, previously discussed in the “Groundwater Withdrawals” section. Depression B in Pasco County was attributed to municipal pumping, and depression C in Manatee County was attributed to agricultural pumping. Surface contours indicate a groundwater flow direction from the bay toward depressions A and C along the eastern and southeastern coast of the bay during May 1978. Groundwater inland of depressions A and C likely flows westward toward those depressions. Hydraulic heads within depression A are below 0 ft (NGVD 29) and would likely indicate downward leakage of saline water from the bay into the underlying aquifer.
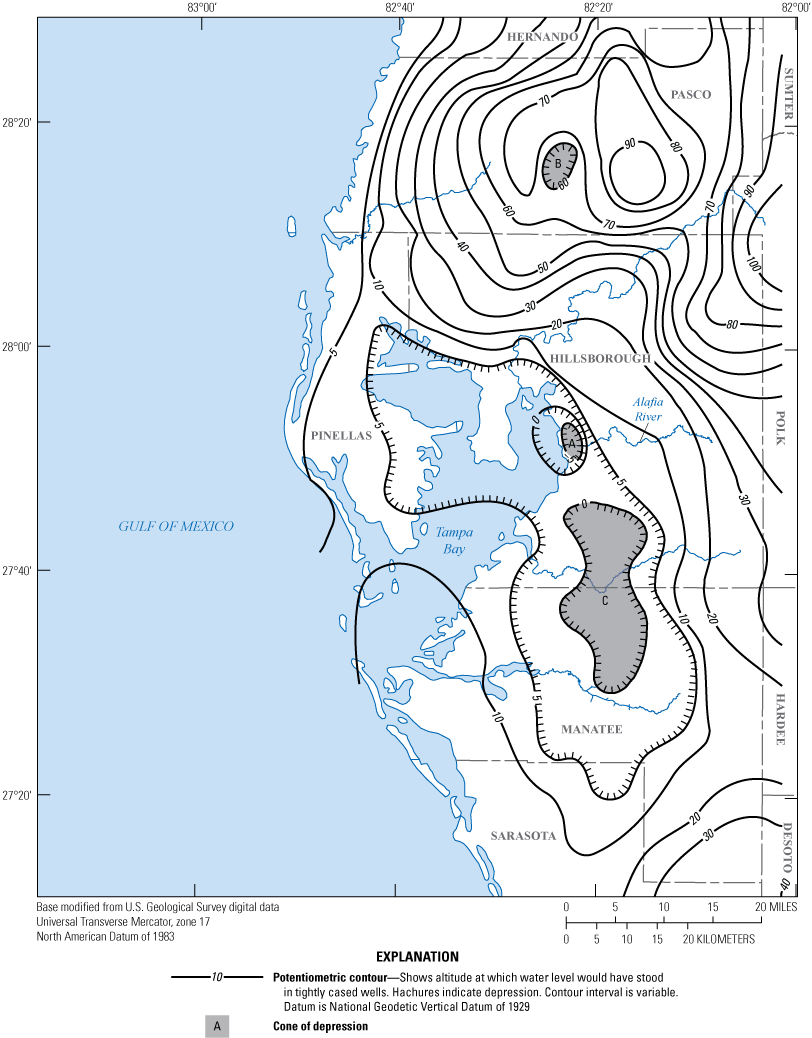
Potentiometric surface of the Floridan aquifer system for May 1978 (Southwest Florida Water Management District [SWFWMD], 2021b).
Cones of depression and hydraulic heads in the UFA evident on the May 1978 potentiometric-surface map are also evident in the May 1985 map (fig. 17). In 1985, the monthly mean tidal level was 0.56 ft (NGVD 29) (table 8). During this period, the area of depression A extended farther into the northeastern bay and depression C was larger and extended farther north than in May 1978, resulting in areas along the eastern coast of the bay with hydraulic heads below 0 ft (NGVD 29). Throughout these areas, saline water from the bay would likely enter the UFA where the aquifer is exposed.
Potentiometric surface of the Floridan aquifer system for May 1985 (Southwest Florida Water Management District [SWFWMD], 2021b).
After 1985, depression A is no longer evident, as shown on the potentiometric surface maps for May 1987, 1995, 2011, and 2019, which is likely due to decreased industrial groundwater withdrawals (table 3; figs. 18–21). The cessation of industrial pumping of saline water at an industrial site near depression A was noted in the “Groundwater Withdrawals” section of this report (table 3). Areas in the northern part of Tampa Bay have potentiometric surface elevations between 0 and 5 ft (NGVD 29), with no areas below 0 ft in May 1987 (fig. 18). The mean tidal level during this time was 0.45 ft (NGVD 29), with mean high and low water levels of 1.36 and −0.57 ft (NGVD 29), respectively (table 8). Hydraulic head values throughout the bay, except for the area coinciding with depression A in May 1978 and May 1985, are likely to be higher than mean tidal values, resulting in most areas discharging groundwater from the UFA where the aquifer is exposed to the bay. These same conditions are evident on the potentiometric surface maps for May 1995, 2011, and 2019 (figs. 19–21). Although the northern areas of these maps have contours more like those for predevelopment estimates than the maps for 1978, 1985, and 1987, the effects of pumping and other stresses on the system are still evident in the later years of available data.
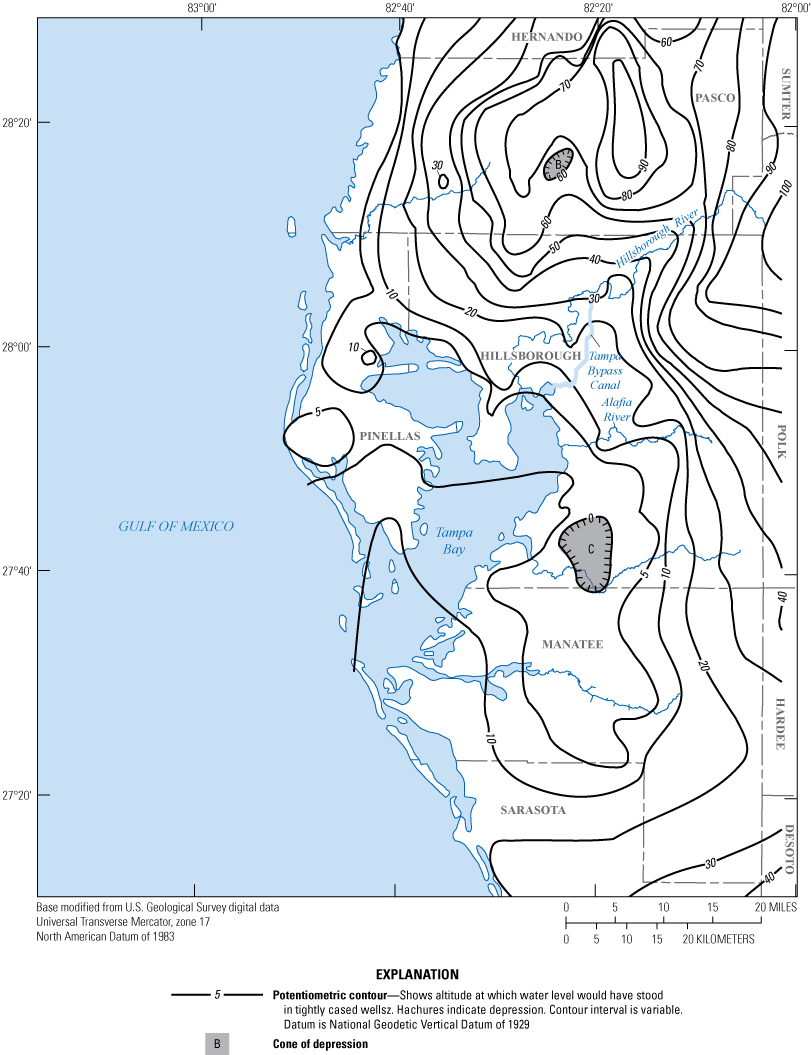
Potentiometric surface of the Floridan aquifer system for May 1987 (Southwest Florida Water Management District [SWFWMD], 2021b).
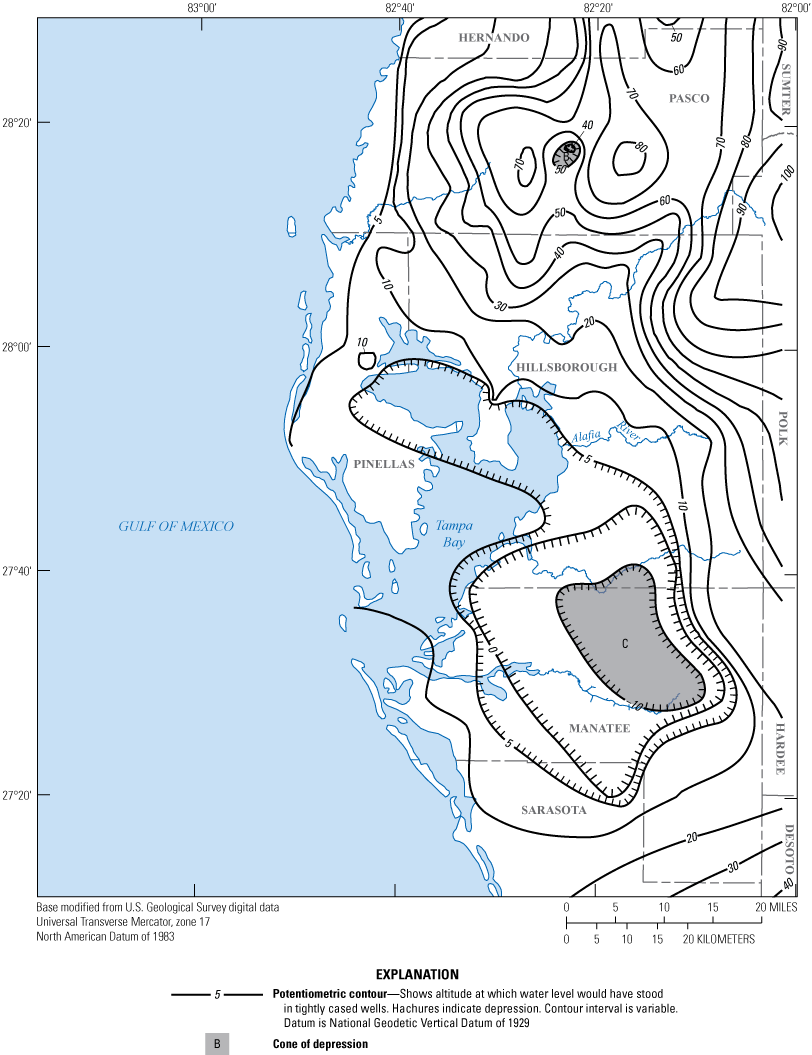
Potentiometric surface of the Floridan aquifer system for May 1995 (Southwest Florida Water Management District [SWFWMD], 2021b).
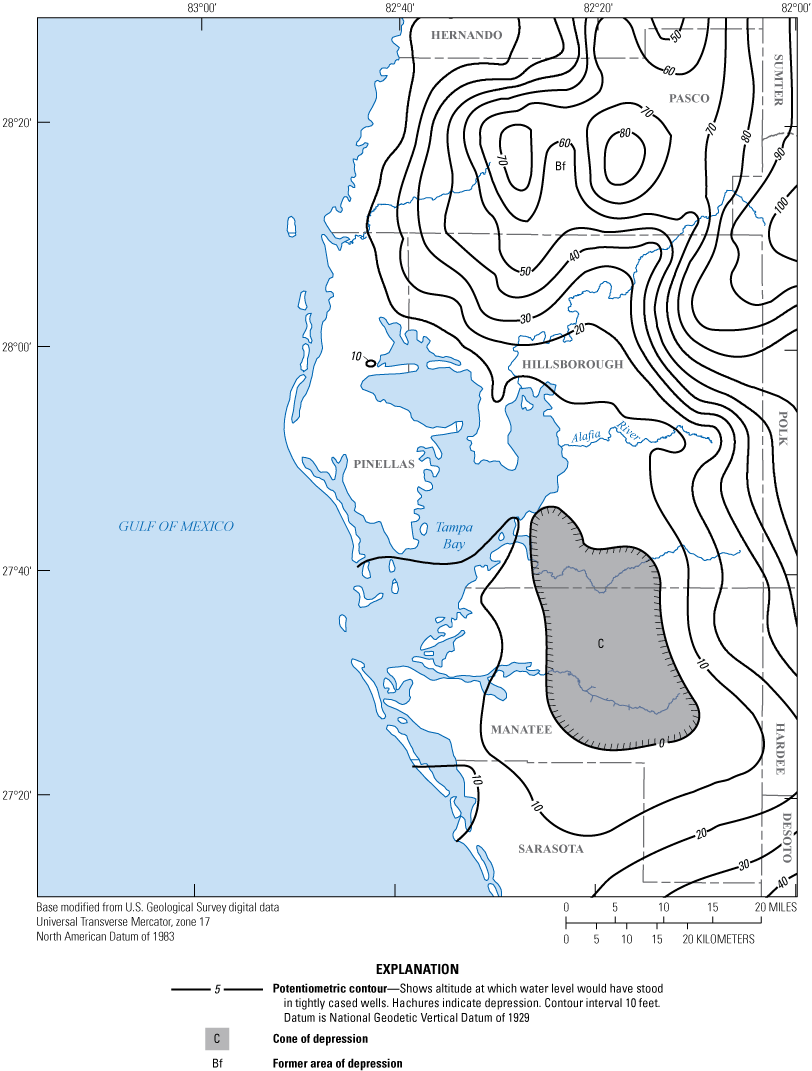
Potentiometric surface of the Floridan aquifer system for May 2011 (Southwest Florida Water Management District [SWFWMD], 2021b).
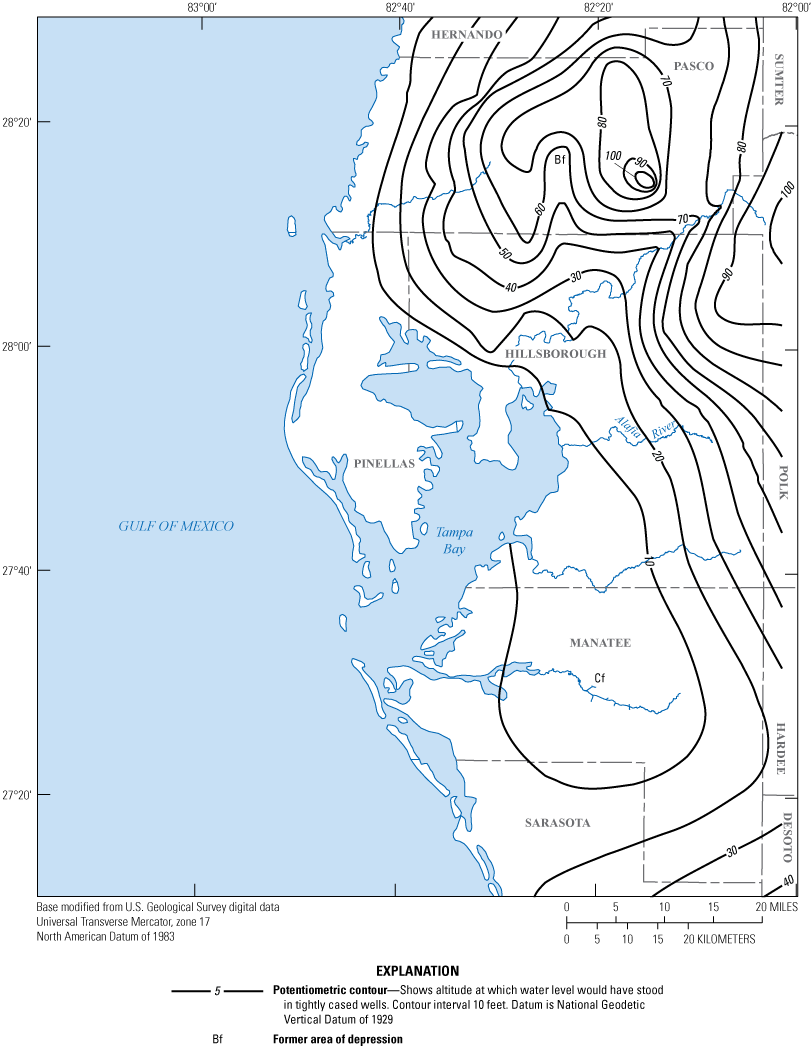
Potentiometric surface of the Floridan aquifer system for May 2019 (Southwest Florida Water Management District [SWFWMD], 2021b).
The construction of the Tampa Bypass Canal (fig. 22) system likely caused changes within the historical potentiometric surfaces as well. The canal system, excavated during 1966–81, was constructed to divert water from the Hillsborough River to mitigate flooding. Reports indicate that during excavation of the canal system, the confining bed separating the UFA from the SAS was likely breached in several places (Knutilla and Corral, 1984). Base-flow discharge after 1978 from the Tampa Bypass Canal was estimated to be approximately twice that of preconstruction discharge. This is an indication that the general groundwater flow direction in the area was vertically upward, with net hydraulic heads within the UFA above those of the measured Tampa Bypass Canal stages. Hydraulic heads within the UFA adjacent to the bay were largely unaffected; however, hydraulic heads farther inland along the middle sections of the Tampa Bypass Canal increased by as much as 4 ft because of the impoundment of water within the Tampa Bypass Canal. Farther upstream from the Tampa Bypass Canal, hydraulic heads within the UFA were lowered by approximately 2–4 ft.
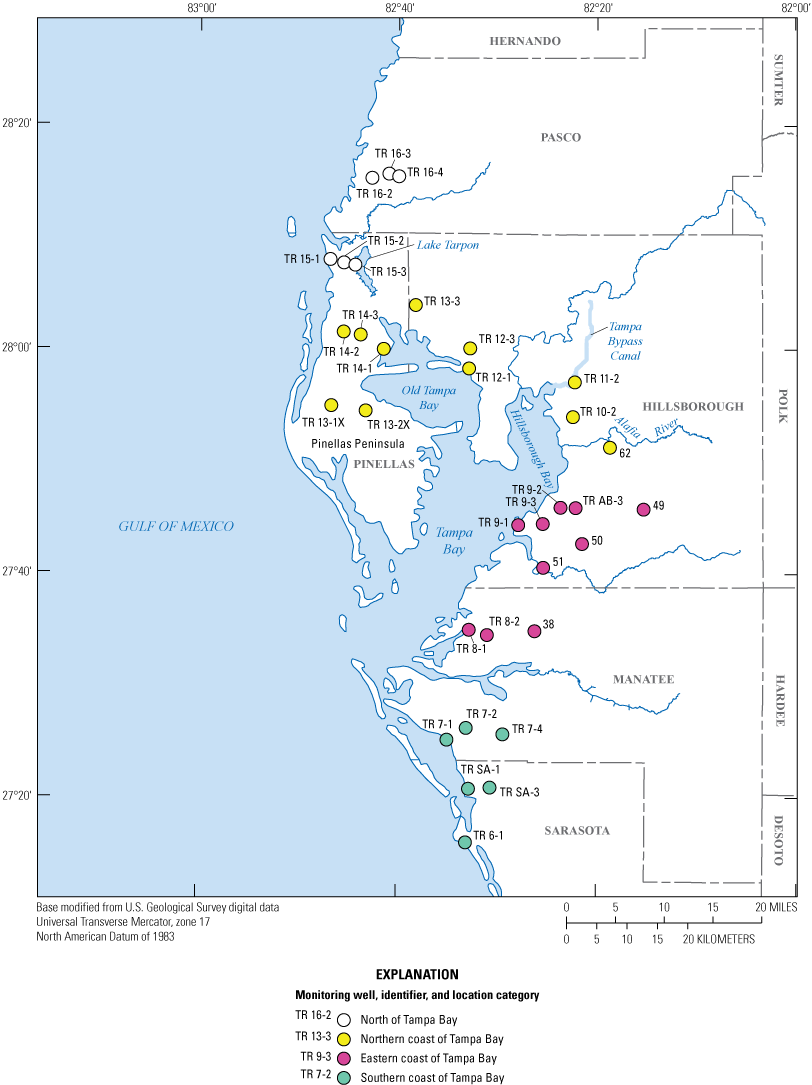
Hydraulic head and chloride concentration monitoring wells surrounding Tampa Bay, Florida (Southwest Florida Water Management District [SWFWMD], 2018b; U.S. Geological Survey [USGS], 2016).
Additionally, tidal levels increased during 1978–2019, with mean tidal levels of 0.44, 0.56, 0.45, 0.81, 0.71, 1.06, and 1.10 ft (NGVD 29) for 1978, 1985, 1987, 1995, 2011, 2016, and 2019, respectively (table 8). As tidal levels increase, the area of the bay where the potentiometric surface of the FAS is lower than the mean tidal level can increase in size and result in downward leakage of saline water into the UFA where the aquifer is exposed. Projected increases in future sea levels would likely lead to increases in both the areal extent and the number of time periods of potential saline-water leakage from the bay into the underlying, exposed UFA.
Historical Data From Groundwater and Chloride Concentration Monitoring Wells
Hydraulic head and geochemical data from individual monitoring wells are sometimes available at various depths associated with different aquifers or hydrologic units. Comparing hydraulic heads measured from various depths within a single well can reflect how well the aquifers are hydraulically connected to one another (Miller, 1986; Williams and Kuniansky, 2015). Within this report, a larger difference in measured hydraulic head between two aquifer units at a single location was interpreted as suggesting those aquifer units are not hydraulically well-connected. Conversely, similarities in measured hydraulic head between two aquifer units at a single location was interpreted as suggesting those aquifers are hydraulically well-connected. The well depth referenced for this analysis is the well-casing depth reported for each well. The full open interval for each well would be located between the casing depth and the total well depth (“bottom of the hole”). Comparing hydraulic heads at similar depths between adjacent wells can indicate the horizontal hydraulic gradient in the area. Comparing measured hydraulic heads in wells adjacent to the bay to mean measured tidal levels can indicate whether the aquifer is more likely to be discharging to the bay or receiving downward leakage from the bay in areas where the FAS is exposed (Hutchinson, 1983).
The constituent whose data are used to examine saltwater intrusion is typically chloride (Cl−) concentration (Prinos and others, 2014). Some wells might have high chloride concentrations at depth, and the vertical hydraulic connection combined with geochemical information can be used to evaluate whether high chloride concentrations are due to migration from below (from deeper in the aquifer) or above (from the bay). When describing chloride concentrations within this report, groundwater having a dissolved chloride concentration (1) less than 1,000 mg/L will be referred to as “fresh,” (2) equal to or greater than 1,000 mg/L and less than 10,000 mg/L will be referred to as “brackish,” and (3) greater than 10,000 mg/L will be referred to as “saline.” Monitoring-well locations have been grouped on the basis of geographic location to assess patterns and trends for areas that surround Tampa Bay: north of Tampa Bay, along the northern coast of Tampa Bay, along the eastern coast of Tampa Bay, and along the southern coast of Tampa Bay (fig. 22).
When describing long-term trends, Kendall’s τ is used to evaluate the monotonic relation between sets of paired values (Helsel and others, 2020). Kendall’s τ ranges from 1 to −1. Positive values of τ indicate measured values increase over time, whereas negative values of τ indicate measured values decrease over time. The significance of τ is evaluated using calculated p-values where the null hypothesis tested is that there is no trend (τ equals zero). A p-value greater than 0.05 indicates no significant trend. A dataset with a positive τ and a p-value less than 0.05 is considered to have a significant increasing trend, whereas a dataset with a negative τ and a p-value less than 0.05 is considered to have a significant decreasing trend. The cor.test function within the R programming language was used to calculate both Kendall’s τ and p (R Core Team, 2022).
Summary of Historical Data From Groundwater and Chloride Monitoring Wells
Twenty hydraulic head datasets and two chloride concentration datasets were evaluated for wells with an SAS hydrogeologic unit designation (tables 9 and 10, fig. 23). No significant regional trends in hydraulic head or chloride concentration were indicated by Kendall’s τ and p-values within these datasets that could be related to the stressors of the aquifer system being considered.
Table 9.
Summary of trends in hydraulic head data from Regional Observation and Monitor-well Program groundwater monitoring wells of interest in areas surrounding Tampa Bay (Southwest Florida Water Management District [SWFWMD], 2018b; U.S. Geological Survey [USGS], 2016).[Monitoring wells shown in figure 22. ROMP, Regional Observation and Monitor-well Program; ft, foot; UCU, upper confining unit; UFA, Upper Floridan aquifer; lower Arcadia Formation, lower part of the Arcadia Formation of the Hawthorn Group, upper Arcadia Formation, upper part of the Arcadia Formation of the Hawthorn Group; Tampa Member, Tampa Member of the Arcadia Formation]; significant trends determined using Kendall’s τ and p-values <0.05]
Table 10.
Summary of trends in chloride concentration data from Regional Observation and Monitor-well Program groundwater monitoring wells of interest in areas surrounding Tampa Bay (Southwest Florida Water Management District [SWFWMD], 2018b; U.S. Geological Survey [USGS], 2016).[Monitoring wells shown in figure 22. ROMP, Regional Observation and Monitor-well Program; ft, foot; -, no data; UCU, upper confining unit; UFA, Upper Floridan aquifer; lower Arcadia Formation, lower part of the Arcadia Formation of the Hawthorn Group, upper Arcadia Formation, upper part of the Arcadia Formation of the Hawthorn Group; Tampa Member, Tampa Member of the Arcadia Formation; significant trends indicated by Kendall’s τ and p-values]
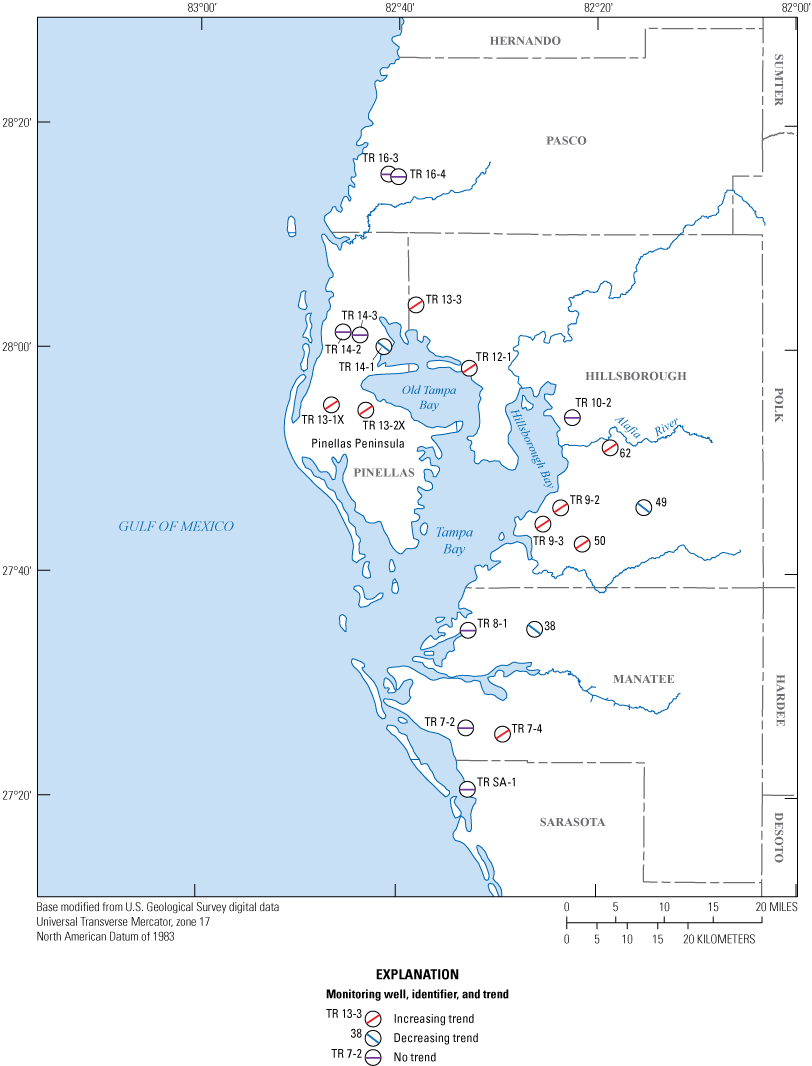
Long-term trends indicated in datasets of hydraulic head for wells with a hydrogeologic unit designation of SAS (Southwest Florida Water Management District [SWFWMD], 2018b; U.S. Geological Survey [USGS], 2016). SAS, surficial aquifer system. Significant trends determined using Kendall’s τ and p-values <0.05.
All being part of the Hawthorn Group, the 21 hydraulic head datasets having hydrogeologic/geologic designations of UCU/Hawthorn Group, UFA/upper Arcadia Formation, UFA/lower Arcadia Formation, and UFA/Tampa Member were combined for the analysis (SWFWMD, 2018b; USGS, 2016). An increasing trend in hydraulic head was indicated using Kendall’s τ and p-values along the eastern and northern coast of Tampa Bay, and a likely decreasing trend was indicated using Kendall’s τ and p-values along the coast in the areas south of Tampa Bay (table 9, fig. 24). Eighteen chloride concentration datasets were evaluated for wells having hydrogeologic/geologic designations of UCU/Hawthorn Group, UFA/upper Arcadia Formation, UFA/lower Arcadia Formation, and UFA/Tampa Member. The calculated Kendall’s τ and p-values of data from 14 wells indicate decreasing or no significant trends in chloride concentration along the eastern and northern coast of the bay as well as along the coast south of the bay, although chloride concentrations are relatively low at these depths (table 10, fig. 25). Changes seen within the potentiometric surface of the UFA, likely due to changes in groundwater extraction, during the study period are one potential cause for these regional trends in hydraulic head and chloride concentration (figs. 16–21).
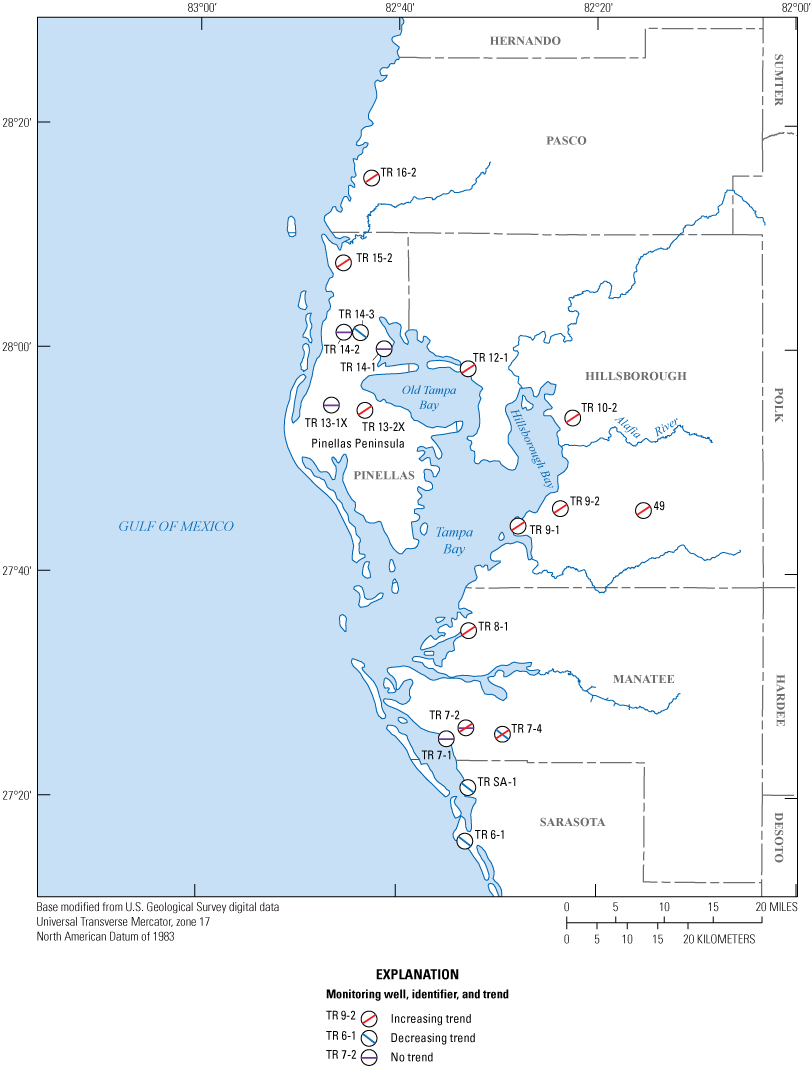
Long-term trends indicated in datasets of hydraulic head for wells with hydrogeologic/geologic unit designations of UCU/Hawthorn Group, UFA/upper Arcadia Formation, UFA/lower Arcadia Formation, and UFA/Tampa Member (Southwest Florida Water Management District [SWFWMD], 2018b; U.S. Geological Survey [USGS], 2016). UCU, upper confining unit; UFA, Upper Floridan aquifer. Significant trends determined using Kendall’s τ and p-values <0.05.
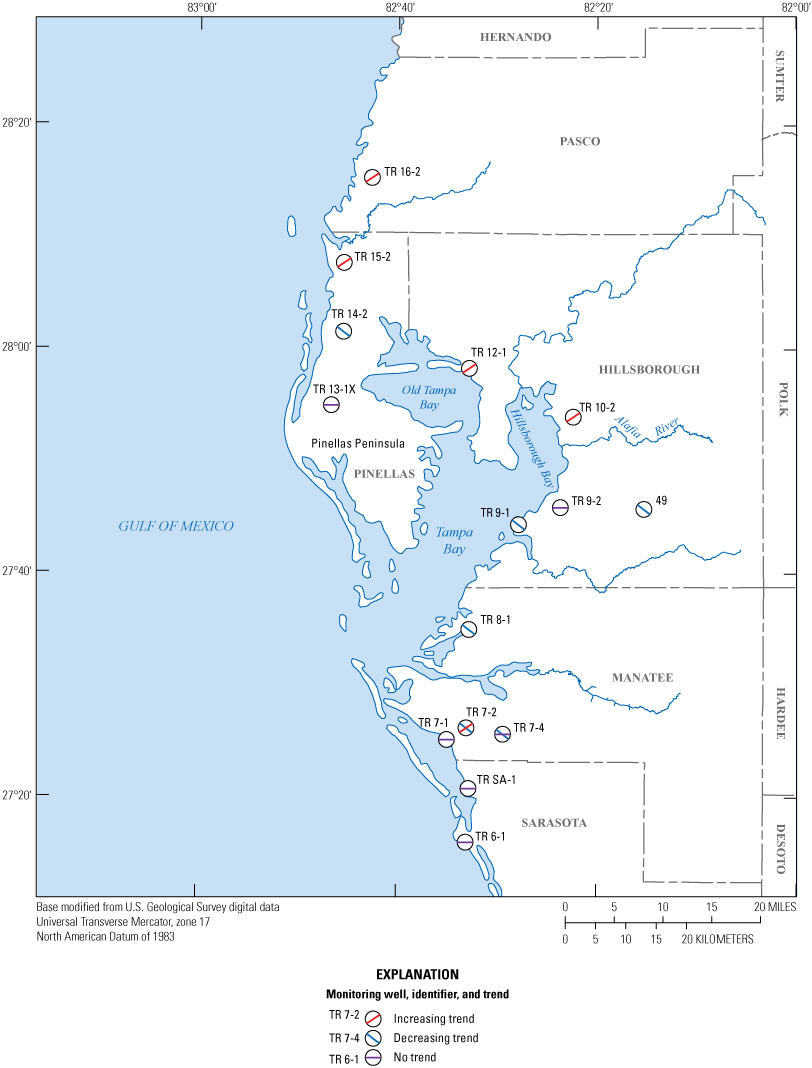
Long-term trends indicated in datasets of chloride concentration for wells with hydrogeologic/geologic unit designations of UCU/Hawthorn Group, UFA/upper Arcadia Formation, UFA/lower Arcadia Formation, and UFA/Tampa Member (Southwest Florida Water Management District [SWFWMD], 2018b; U.S. Geological Survey [USGS], 2016). UCU, upper confining unit; UFA, Upper Floridan aquifer. Significant trends determined using Kendall’s τ and p-values <0.05.
Nineteen hydraulic head datasets were evaluated for wells with a hydrogeologic/geologic unit designation of UFA/Suwannee Limestone. Using Kendall’s τ and p-values, an increasing trend in hydraulic head was indicated along the eastern coast of Tampa Bay and a decreasing trend in hydraulic head was indicated along the northern coast of the bay (table 9, fig. 26). Twelve chloride concentration datasets were evaluated for wells with a hydrogeologic/geologic unit designation of UFA/Suwannee Limestone. Increasing trends in chloride concentration were indicated by Kendall’s τ and p-values along the coast in the northern part of the bay and south of the bay (table 10, fig. 27). Limited chloride concentration data were available along the eastern coast of Tampa Bay with a hydrogeologic/geologic unit designation of UFA/Suwannee Limestone.
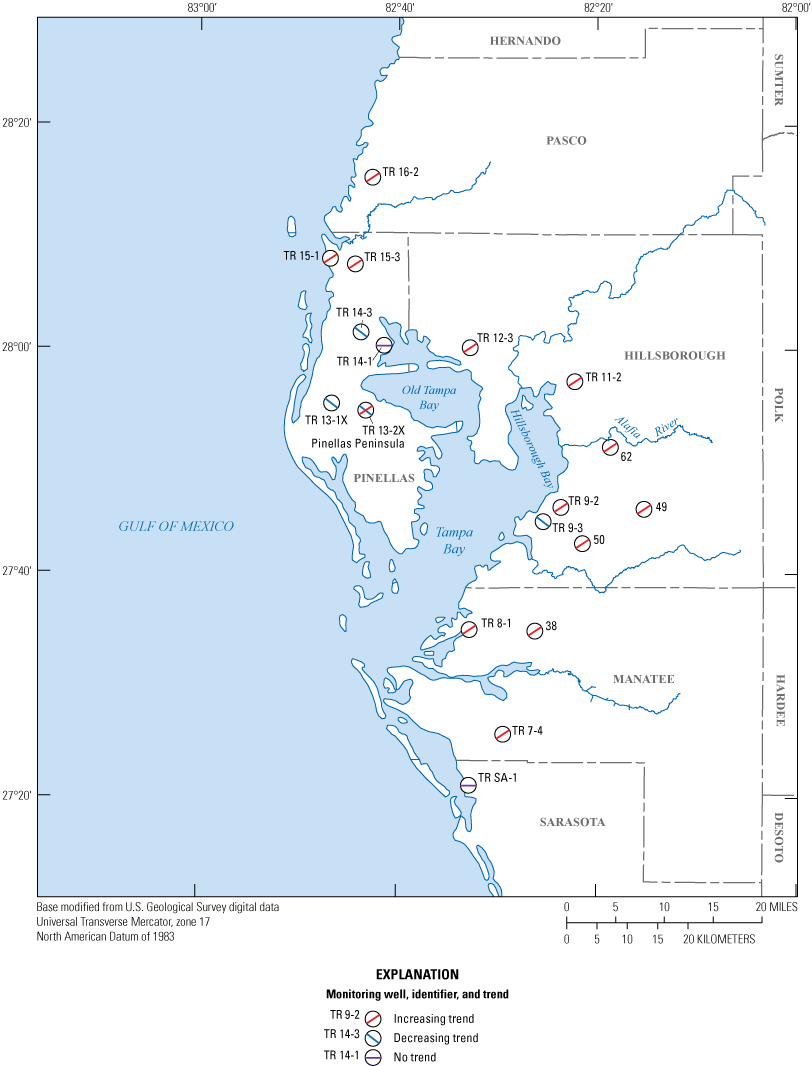
Long-term trends indicated in datasets of hydraulic head for wells with a hydrogeologic/geologic unit designation of UFA/Suwannee Limestone (Southwest Florida Water Management District [SWFWMD], 2018b; U.S. Geological Survey [USGS], 2016). UFA, Upper Floridan aquifer. Significant trends determined using Kendall’s τ and p-values <0.05.
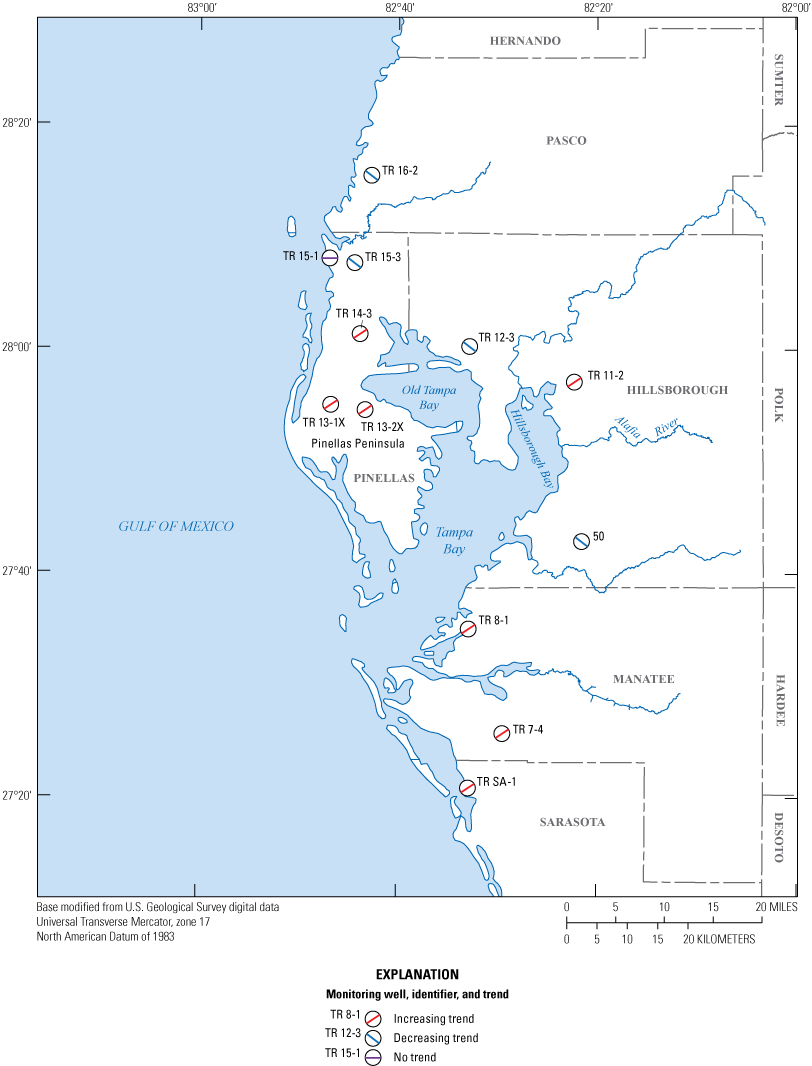
Long-term trends indicated in datasets of chloride concentration for wells with a hydrogeologic/geologic unit designation of UFA/Suwannee Limestone (Southwest Florida Water Management District [SWFWMD], 2018b; U.S. Geological Survey [USGS], 2016). UFA, Upper Floridan aquifer. Significant trends determined using Kendall’s τ and p-values <0.05.
Six hydraulic head datasets were evaluated for wells having a hydrogeologic/geologic unit designation of UFA/Ocala Limestone. Because only a few datasets were available, regional trends in hydraulic head could not be determined (table 9, fig. 28). Only three chloride concentration datasets were available for wells having a hydrogeologic/geologic unit designation of UFA/Ocala Limestone. Using Kendall’s τ and p-values, all three datasets indicate an increasing trend, and all locations are along the eastern coast of Tampa Bay; however, with so few datasets, no significant regional trends could be determined (table 10).
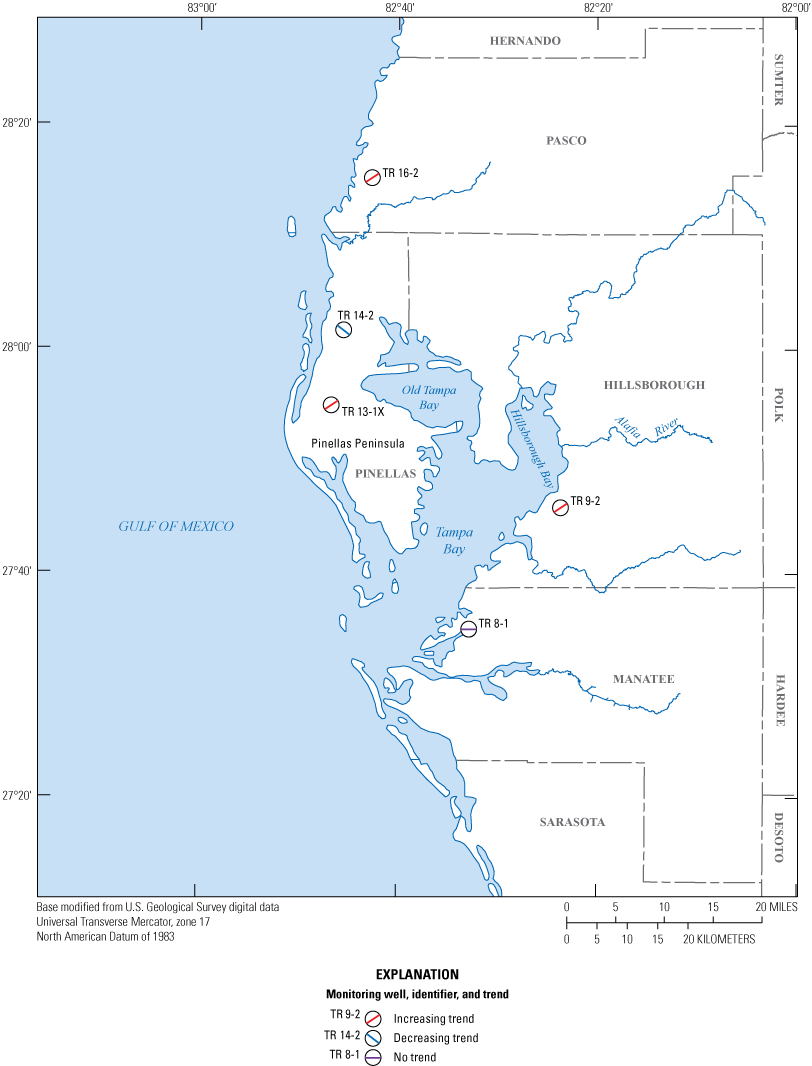
Long-term trends indicated in datasets of hydraulic head for wells with a hydrogeologic/geologic unit designation of UFA/Ocala Limestone (Southwest Florida Water Management District [SWFWMD], 2018b; U.S. Geological Survey [USGS], 2016). UFA, Upper Floridan aquifer. Significant trends determined using Kendall’s τ and p-values <0.05.
Fourteen hydraulic head datasets and 15 chloride concentration datasets were evaluated for wells with a hydrogeologic/geologic unit designation of UFA/Avon Park Formation. Kendall’s τ and p-values indicate increasing trends in both hydraulic head and chloride concentration along the eastern coast of Tampa Bay and south of the bay (tables 9 and 10, figs. 29 and 30).
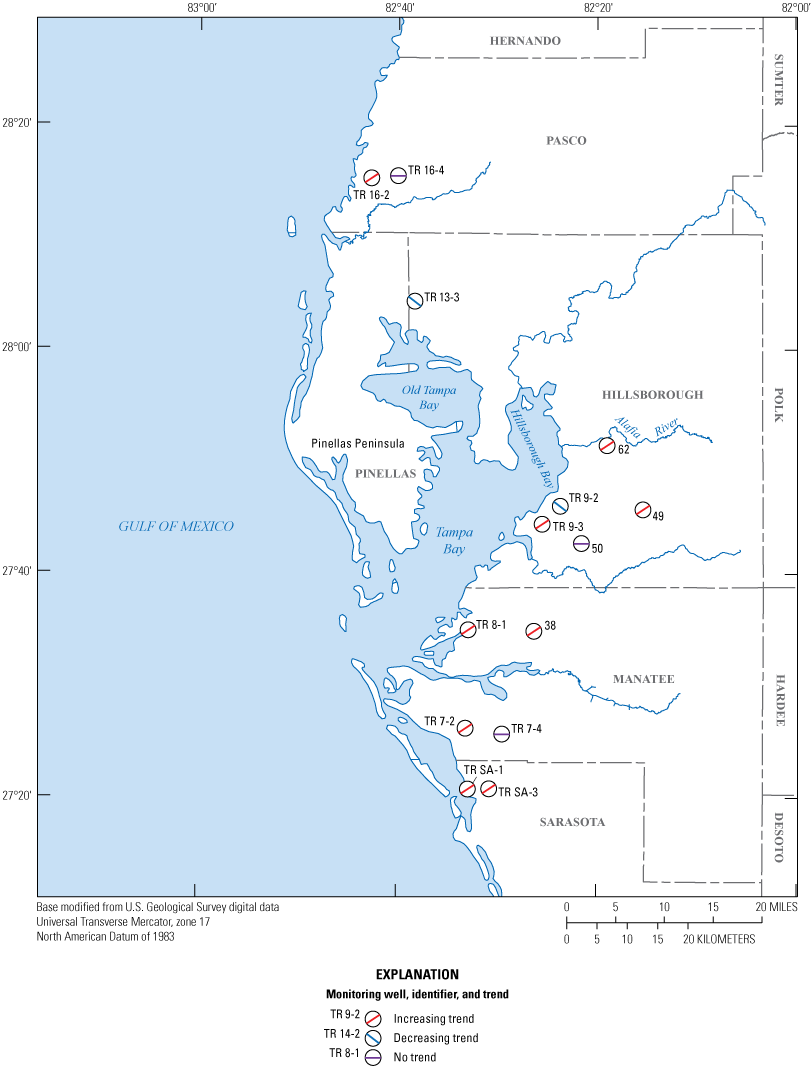
Long-term trends indicated in datasets of hydraulic head for wells with a hydrogeologic/geologic unit designation of UFA/Avon Park Formation (Southwest Florida Water Management District [SWFWMD], 2018b; U.S. Geological Survey [USGS], 2016). UFA, Upper Floridan aquifer. Significant trends determined using Kendall’s τ and p-values <0.05.
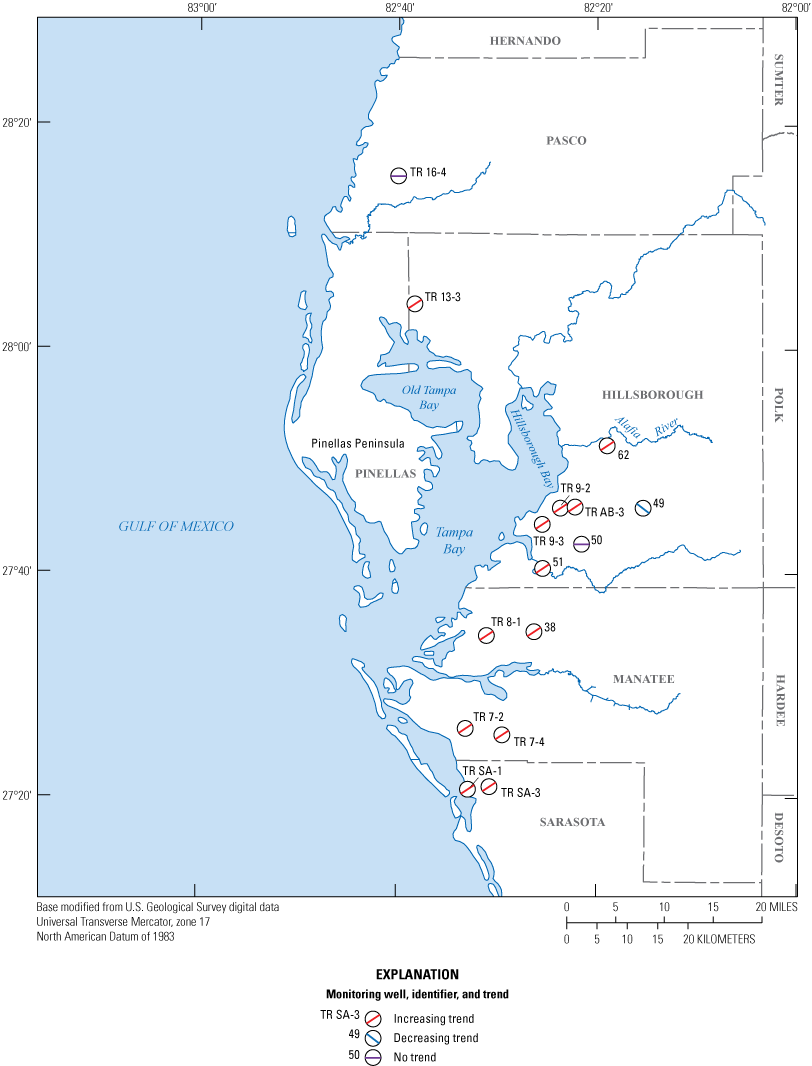
Long-term trends indicated in datasets of chloride concentrations for wells with a hydrogeologic/geologic unit designation of UFA/Avon Park Formation (Southwest Florida Water Management District [SWFWMD], 2018b; U.S. Geological Survey [USGS], 2016). UFA, Upper Floridan aquifer. Significant trends determined using Kendall’s τ and p-values <0.05.
Three wells north of Tampa Bay had available data before and after the last major channel modifications completed in the mid-1980s: TR 15-1, TR 15-2, and TR 15-3 (tables 9 and 10, fig. 22) (SWFWMD, 2018b; USGS, 2016). Each well had hydraulic heads monitored at a single depth beginning in 1978 with hydrogeologic/geologic unit designations of UFA/Suwannee Limestone, UFA/Tampa Member, and UFA/Suwannee Limestone for wells TR 15-1, TR 15-2, and TR 15-3, respectively. Kendall’s τ and p-values for measured hydraulic heads indicated increasing trends throughout the period of record. Chloride concentrations show no significant trend, an increasing trend, and a decreasing trend for wells TR 15-1, TR 15-2, and TR 15-3, respectively.
Three wells along the northern coast of Tampa Bay had available data before and after the last major channel modifications completed in the mid-1980s: TR 13-3, TR 11-2, and TR 10-2 (tables 9 and 10, fig. 22) (SWFWMD, 2018b; USGS, 2016). Well TR 13-3 had hydraulic heads monitored at two depths with hydrogeologic/geologic unit designations of SAS and UFA/Avon Park Formation beginning in 1977 and 1982, respectively. Kendall’s τ and p-values of hydraulic head data indicate an increasing trend in the SAS and a decreasing trend in the UFA/Avon Park Formation. Kendall’s τ and p-values of hydraulic head data at well TR 11-2 monitored at a single depth in the UFA/Suwannee Limestone beginning in 1980 indicate an increasing trend. Well TR 10-2 has hydraulic heads and chloride concentrations monitored within the Arcadia Formation beginning in 1980. Kendall’s τ and p-values for both hydraulic head and chloride concentration datasets for this well indicate increasing trends.
Four wells located along the eastern coast of Tampa Bay had available data before and after the last major channel modifications completed in the mid-1980s: TR 9-1, TR 9-3, 50, and 51 (tables 9 and 10, fig. 22) (SWFWMD, 2018b; USGS, 2016). Well TR 9-1 had hydraulic heads and chloride concentrations monitored at a single depth within the lower part of the Arcadia Formation beginning in 1976 and 1978, respectively. Kendall’s τ and p-values for hydraulic head data indicated an increasing trend, whereas Kendall’s τ and p-values for chloride concentration data indicated a decreasing trend. Well TR 9-3 had hydraulic heads and chloride concentrations measured within the SAS beginning in 1976 and 1978, respectively. Kendall’s τ and p-values for the hydraulic head and chloride concentration datasets indicated an increasing trend and no significant trend, respectively. Well 50 had hydraulic heads and chloride concentrations monitored within the SAS beginning in 1976. Kendall’s τ and p-values for the hydraulic head and chloride concentration datasets within the SAS monitored depth indicated an increasing trend and a decreasing trend, respectively. Well 51 had chloride concentrations monitored within the UFA/Avon Park Formation beginning in 1976, with Kendall’s τ and p-values indicating an increasing trend.
Two wells along the southern coast of Tampa Bay had available data before and after the last major channel modifications completed in the mid-1980s: TR 7-1 and TR 6-1 (tables 9 and 10, fig. 22) (SWFWMD, 2018b; USGS, 2016). Well TR 7-1 had hydraulic heads and chloride concentrations measured at a single depth within the lower part of the Arcadia Formation beginning in 1983 and 1981, respectively, with Kendall’s τ and p-values for both datasets indicating no significant trends. Well TR 6-1 had hydraulic heads and chloride concentrations measured at a single depth within the lower part of the Arcadia Formation beginning in 1979. Kendall’s τ and p-values for the hydraulic head and chloride concentration datasets indicated a decreasing trend and no significant trend, respectively.
Groundwater Monitoring Wells North of Tampa Bay
The trends and changes in hydraulic head and chloride concentration observed at wells north of Tampa Bay (fig. 22) cannot be attributed to channelization within the bay because these locations are too far removed from the bay. Data from these wells are presented to illustrate changes in potentiometric levels within the region that are likely the result of alterations in groundwater withdrawals, aquifer recharge, SLR, and interaction with surface-water features such as Lake Tarpon (fig. 22). Table 11 lists the ROMP wells whose data were analyzed for trends in hydraulic head and chlorine concentration.
Table 11.
Summary of Regional Observation and Monitor-well Program groundwater monitoring wells of interest in the area well north of Tampa Bay (Southwest Florida Water Management District [SWFWMD], 2018b; U.S. Geological Survey [USGS], 2016).[Monitoring wells shown in figure 22. ROMP, Regional Observation and Monitor-well Program; Horizontal coordinate information is referenced to North American Datum of 1983 (NAD 83). deg, degrees; min, minutes; sec, seconds; ft, foot; NAVD 88, North American Vertical Datum of 1988; SAS, surficial aquifer system; UFA, Upper Floridan aquifer; Tampa Member, Tampa Member of the Arcadia Formation; interface, interface between Upper Floridan aquifer and shallower units; -, no data]
ROMP wells TR 16-2, TR 16-3, and TR 16-4 are in the northern part of the study area, approximately 15 mi north of northernmost extent of Tampa Bay, and are oriented west to east along a transect that extends inland from the gulf coast (fig. 22). Well TR 16-2 is located approximately 2 mi east of the gulf coast and has hydraulic heads monitored within the UFA/Tampa Member (68-ft depth), UFA/Suwannee Limestone (210-ft depth), UFA/Ocala Limestone (350-ft depth), and the UFA/Avon Park Formation (455-ft depth) (table 11). Hydraulic head data from the ROMP TR 16-2 well for 1992–2022 are shown in figure 31. Kendall’s τ and p-values for these data indicate increasing trends for this period (table 12), with mean heads of 5.92, 5.84, 0.60, and −0.12 ft (NAVD 88) for the UFA/Tampa Member (68-ft depth), UFA/Suwannee Limestone (210-ft depth), UFA/Ocala Limestone (350-ft depth), and UFA/Avon Park Formation (455-ft depth) wells, respectively. The measured hydraulic heads within the shallower locations (68- and 210-ft depths) have mean values approximately 5 ft higher than hydraulic heads within the deeper locations (350- and 455-ft depths), suggesting these aquifer units are not well-connected and indicating an upward hydraulic head gradient. There likely exists a confining unit between the two shallower formations, UFA/Tampa Member and UFA/Suwannee Limestone, and the two deeper formations, UFA/Ocala Limestone and UFA/Avon Park Formation, resulting in the differences in measured hydraulic heads. The mean chloride concentration of 330 mg/L within the UFA/Tampa Member (68-ft depth) indicates freshwater within the UCU, and the mean chloride concentration of 1,242 mg/L within the UFA/Suwannee Limestone (210-ft depth) indicates brackish water within the upper portions of the UFA. There is a significant increasing trend in chloride concentration within the Tampa Formation (68-ft depth) and a decreasing trend in chloride concentration within the UFA/Suwannee Limestone (210-ft depth), indicated by the Kendall’s τ and p-values (table 13); however, the magnitude of change in chloride concentration within the UFA/Tampa Member (68-ft depth) is much smaller than within the UFA/Suwannee Limestone (210-ft depth). As noted, hydraulic heads at each depth have increased during this same period.
Table 12.
Summary of hydraulic head data from Regional Observation and Monitor-well Program groundwater monitoring wells of interest north of Tampa Bay (Southwest Florida Water Management District [SWFWMD], 2018b; U.S. Geological Survey [USGS], 2016).[Monitoring wells shown in figure 22. Dates shown as month, day, year. ROMP, Regional Observation and Monitor-well Program; ft, foot; NAVD 88, North American Vertical Datum of 1988; Kendall’s τ, Kendall’s tau]
Table 13.
Summary of chloride concentration data from Regional Observation and Monitor-well Program groundwater monitoring wells of interest north of Tampa Bay (Southwest Florida Water Management District [SWFWMD], 2018b; U.S. Geological Survey [USGS], 2016).[Monitoring wells shown in figure 22. Dates shown as month, day, year. ROMP, Regional Observation and Monitor-well Program; ft, foot; mg/L, milligram per liter; Kendall’s τ, Kendall’s tau]
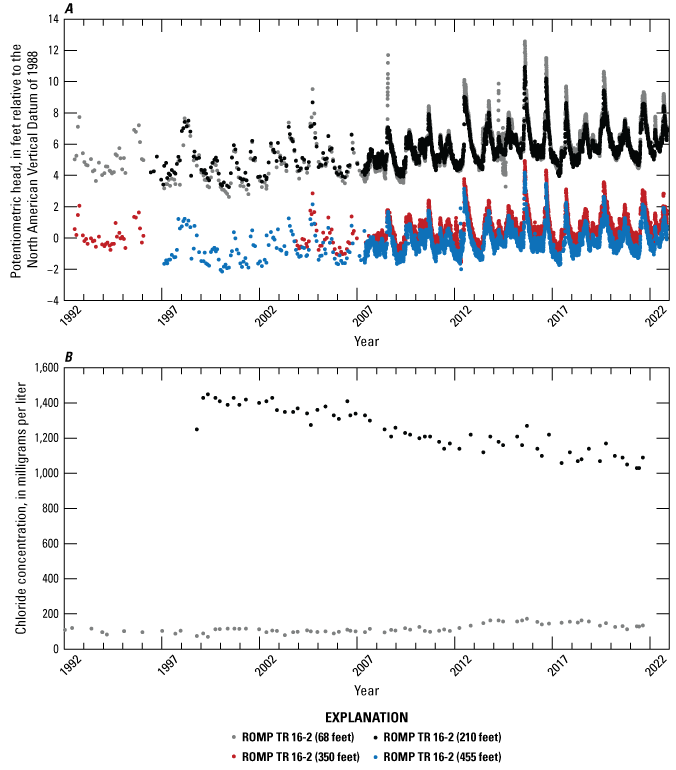
Hydraulic heads and chloride concentrations within the Regional Observation and Monitor-well Program well TR 16-2 (Southwest Florida Water Management District [SWFWMD], 2018b; U.S. Geological Survey [USGS], 2016). Increasing trend indicated in hydraulic heads at depths of 68, 210, 350, and 455 feet (table 12). Increasing trend indicated in chloride concentrations at 68 feet and decreasing trend indicated at 210 feet (table 13).
ROMP wells TR 16-3 and TR 16-4 each have hydraulic heads measured at two depths and are located approximately 3.5 and 4.5 mi from the gulf coast, respectively (fig. 22). In order of increasing depth, the wells within TR 16-3 are finished within the SAS (5-ft depth) and UFA/interface with Avon Park (494-ft depth) (table 11). The vertical gradient typically was downward during 2002–22, with measured hydraulic heads within the SAS higher than those within the UFA/Avon Park Formation (fig. 32) and mean values of 14.80 and 13.34 ft (NAVD 88), respectively, averaged for 2002–22 (table 12). Data records indicate the downward gradient was reversed during several measurement periods when heads within the UFA/Avon Park Formation were higher than land surface elevation (17.7 ft NAVD 88) (SWFWMD, 2018b; USGS, 2016). These periods correspond to large rainfall events associated with tropical disturbances, which include Hurricane Frances (September 5, 2004), Hurricane Jeanine (September 26, 2004), an unnamed tropical disturbance (August 3, 2015), and Hurricane Hermine (September 2, 2016) (Kane, 2005; Lawrence and Cobb, 2005; Marrero and others, 2016).
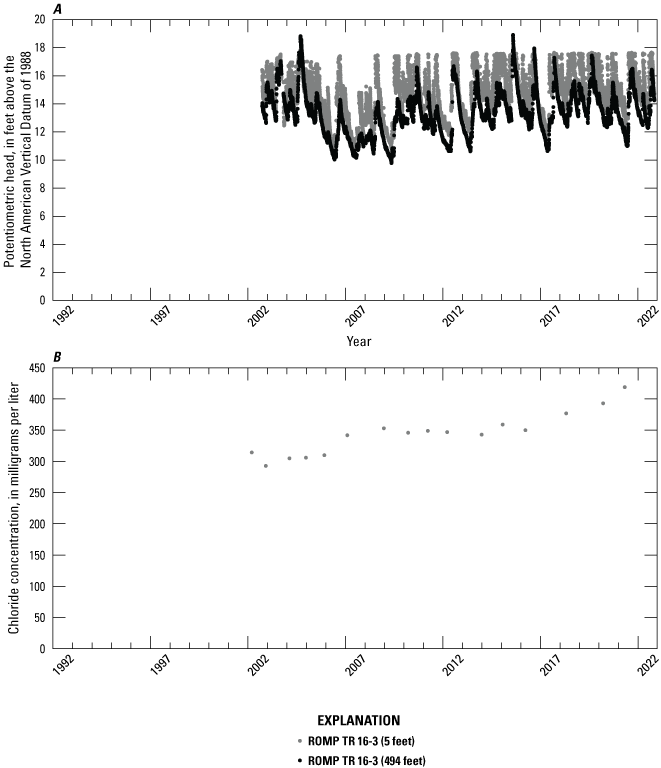
Hydraulic heads and chloride concentrations within the Regional Observation and Monitor-well Program well TR 16-3 (Southwest Florida Water Management District [SWFWMD], 2018b; U.S. Geological Survey [USGS], 2016). No trends indicated in hydraulic head (table 12). Increasing trend indicated in chloride concentrations at a depth of 494 feet (table 13).
The 4- and 740-ft-depth locations within well TR 16-4 are finished within the SAS and UFA/Avon Park Formation, respectively (table 11). There is typically a downward gradient in hydraulic head (fig. 33), with mean values of 17.66 and 15.92 ft (NAVD 88) averaged for 2002–22 within the SAS and UFA/Avon Park Formation, respectively (table 12). The similarity in mean values and trends in the data from TR 16-4 suggests that these aquifer units are well-connected.
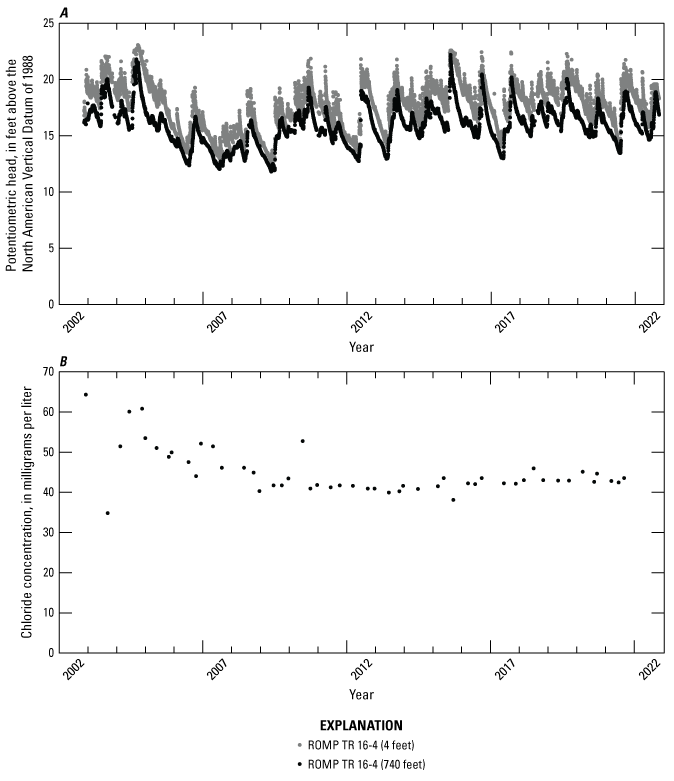
Hydraulic heads and chloride concentrations within the Regional Observation and Monitor-well Program well TR 16-4 (Southwest Florida Water Management District [SWFWMD], 2018b; U.S. Geological Survey [USGS], 2016). No trends indicated in hydraulic heads or chloride concentrations (tables 12 and 13).
ROMP wells TR 16-2, TR 16-3, and TR 16-4 have a pattern of decreasing hydraulic head toward the gulf shore, indicating groundwater flow toward the coast. ROMP wells TR 16-3 and TR 16-4 are farther inland than TR 16-2 (fig. 22) and have lower chloride concentrations, with mean values of 349 and 45 mg/L within the UFA/Avon Park Formation for TR 16-3 (494-ft depth) and TR 16-4 (740-ft depth), respectively, which indicate fresh groundwater (figs. 32 and 33, table 13). Kendall τ and p-values indicate a significant upward trend in chloride concentration over time within the UFA/Avon Park Formation at TR 16-3 (494-ft depth), and no significant trend over time occurs within the UFA/Avon Park Formation at TR 16-4 (740-ft depth).
ROMP wells TR 15-1, TR 15-2, and TR 15-3 are located farther south and closer to the Gulf of Mexico than TR 16-2, TR 16-3, and TR 16-4. The first three wells are oriented west to east along a transect at approximate distances of 0.1, 1.5 and 2.5 mi from the gulf coast, respectively, with TR 15-3 near Lake Tarpon (fig. 22, table 11). Each well has a single monitored depth, with hydrogeologic/geologic unit designations of UFA/Suwannee Limestone, UFA/Tampa Member, and UFA/Suwannee Limestone for TR 15-1 (80-ft depth), TR 15-2 (50-ft depth), and TR 15-3 (137-ft depth), respectively. The mean hydraulic heads for the period 1978–2022 indicate a downward gradient toward the coast with values of 2.13, 2.79, and 4.54 ft (NAVD 88) for TR 15-1, TR 15-2, and TR 15-3, respectively (table 12). Kendall τ and p-values indicate increasing trends in hydraulic head during this period for these three wells (table 12).
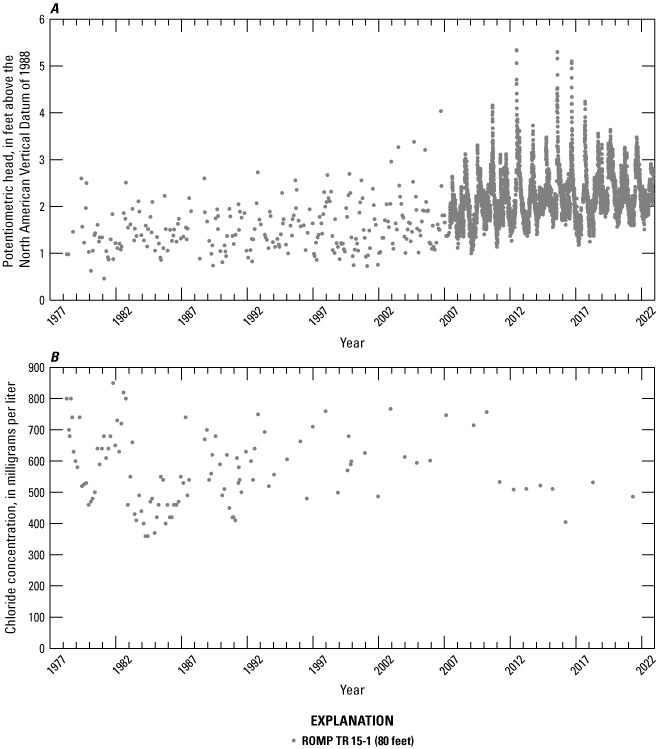
Hydraulic heads and chloride concentrations within the Regional Observation and Monitor-well Program well TR 15-1 (Southwest Florida Water Management District [SWFWMD], 2018b; U.S. Geological Survey [USGS], 2016). Increasing trend indicated in hydraulic heads at a depth of 80 feet (table 12). No trends indicated in chloride concentrations (table 13).
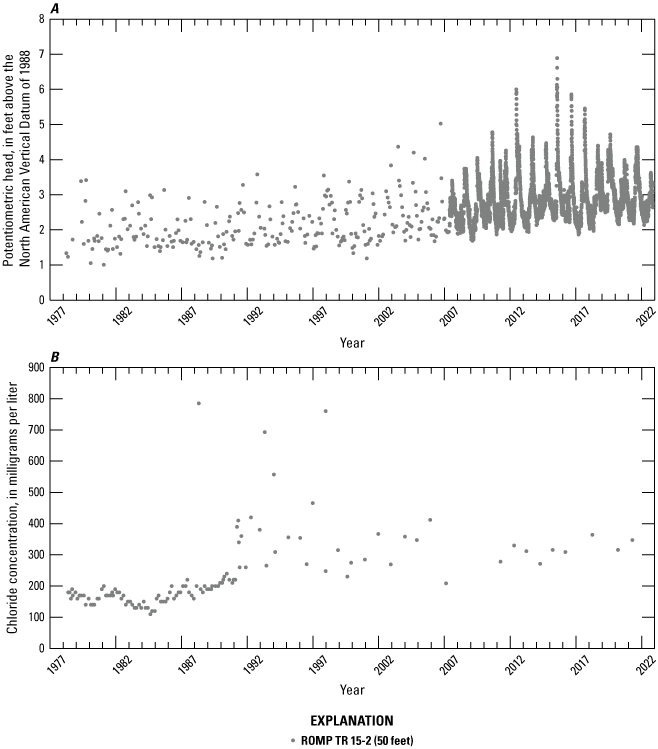
Hydraulic heads and chloride concentrations within the Regional Observation and Monitor-well Program well TR 15-2 (Southwest Florida Water Management District [SWFWMD], 2018b; U.S. Geological Survey [USGS], 2016). Increasing trend indicated in hydraulic heads and chloride concentrations at a depth of 50 feet (tables 12 and 13).
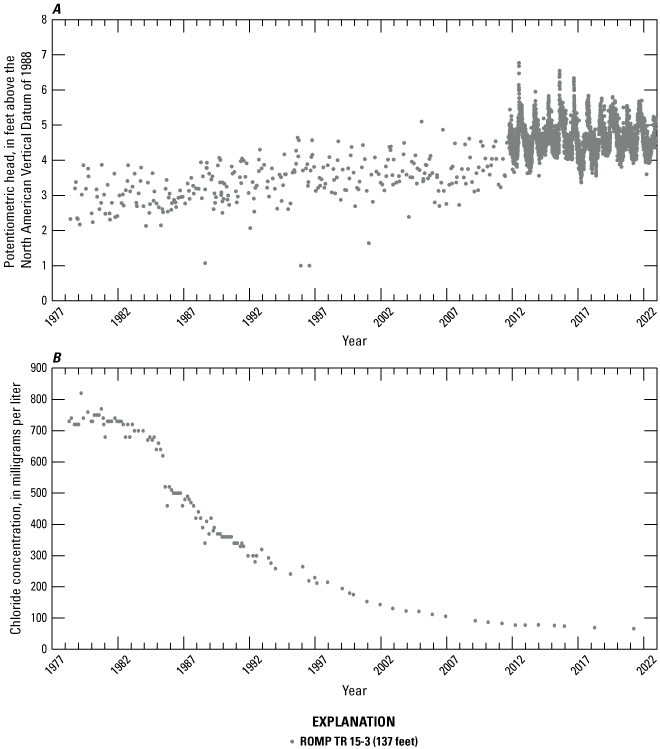
Hydraulic heads and chloride concentrations within the Regional Observation and Monitor-well Program well TR 15-3 (Southwest Florida Water Management District [SWFWMD], 2018b; U.S. Geological Survey [USGS], 2016). Increasing trend indicated in hydraulic heads at a depth of 137 feet (table 12). Decreasing trend indicated in chloride concentrations at a depth of 137 feet (table 13).
Fresh groundwater is indicated within ROMP wells TR 15-1, TR 15-2, and TR 15-3 at depths of 80, 50, 137 ft, respectively. For 1978–2022, chloride concentration data at TR 15-1 (UFA/Suwannee Limestone, 80-ft depth) have no significant trend and a mean value of 576 mg/L (fig. 34, table 13). Kendall’s τ and p-values for chloride concentration data for TR 15-2 (UFA/Tampa Member, 50-ft depth) indicate an increasing trend over time, with a mean value of 242 mg/L (fig. 35, table 13). The cause of the increasing chloride concentrations at TR 15-2 is not clear; however, groundwater withdrawals in the area could pull higher salinity water upward into the shallower aquifer. The chloride concentrations at TR 15-3 (UFA/Suwannee Limestone, 137-ft depth), the farthest inland well, significantly decreased from approximately 700 to 100 mg/L during 1978–2022, with a mean value of 432 mg/L (fig. 36, table 13). This decrease in chloride concentration was likely associated with the salinity conditions in nearby Lake Tarpon (fig. 2), located 1/8 mi east of TR 15-3. Lake Tarpon sink is located on the northwestern shoreline of Lake Tarpon and is hydrologically connected to the Gulf of Mexico (Dooris and Bartos, 1980). The Lake Tarpon sink previously acted as both an outflow and inflow source depending on tidal and lake conditions, causing high salinity conditions. During the 1960–70s, salinity mitigation activities were undertaken to freshen the lake, which included construction of a berm to enclose the sinkhole and the construction of a canal and water-control structure to discharge waters from the lake southward to Old Tampa Bay. Following these mitigation activities, chloride concentrations within the lake decreased from as high as 5,000 mg/L to values near the 250-mg/L drinking water standard (Dooris and Bartos, 1980). Changes in groundwater chloride concentrations within TR 15-3 illustrate the local hydraulic connection between the Gulf of Mexico and Lake Tarpon by means of groundwater transport through karst features.
In summary, wells north of Tampa Bay are sufficiently removed from the bay for evaluating trends in the region not affected by dredging. Hydraulic heads indicate flow directions westward toward the gulf coast. Wells near the gulf coast and near Lake Tarpon had hydraulic heads approaching those of tidal levels in the bay (having means as low as 2.13 ft) that still remained higher than tidal levels. At Lake Tarpon, the local effect of karst is illustrated by the changes in salinity in the lake associated with the Lake Tarpon sink that hydraulically connected the lake with the Gulf of Mexico, and subsequent mitigation measures that disconnected the lake from the sinkhole. Prior to mitigation measures, salinity was elevated despite the regional gradients in hydraulic head indicating flow from inland areas westward toward the Gulf of Mexico. This illustrates the difficulty in predicting the effect of karst features on local hydrology.
Groundwater Monitoring Wells Along the Northern Coast of Tampa Bay
Data from 11 wells within 5 mi of the northern coast of Tampa Bay were analyzed for trends (fig. 22, table 14) in hydraulic head and chloride concentrations. ROMP wells TR 14-1, TR 14-3, and TR 14-2 are oriented along a transect extending southeast to northwest between Old Tampa Bay and the Gulf of Mexico at distances of 0.5, 2.5, and 4 mi from the bay, respectively (fig. 22). Well TR 14-2 is approximately 2 mi from the Gulf of Mexico. Three depths were monitored at TR 14-1 within the SAS (9-ft depth), UFA/Tampa Member (70-ft depth), and UFA/Suwannee Limestone (268-ft depth), and the data collected at depths indicate similar hydraulic heads and responses, suggesting these aquifer units are well-connected at this location (fig. 37, table 14). The mean measured hydraulic heads at these three depths indicated a downward gradient, with values of 9.21, 8.43, and 8.07 ft (NAVD 88) during 1987–2022 for the SAS (9-ft depth), UFA/Tampa Member (70-ft depth), and UFA/Suwannee Limestone (268-ft depth) designations, respectively (table 15). Given that hydraulic heads are well above the tidal levels, groundwater would likely be discharging from an underlying aquifer into the bay if exposed in this area. There was no long-term monitoring of chloride concentration at TR 14-1.
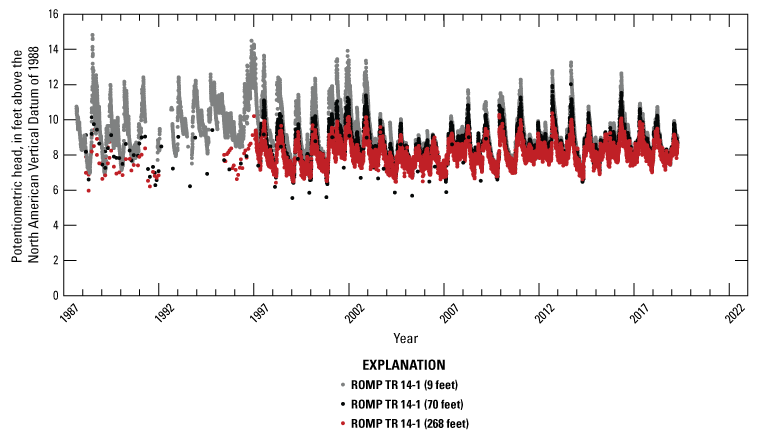
Hydraulic heads within the Regional Observation and Monitor-well Program well TR 14-1 (Southwest Florida Water Management District [SWFWMD], 2018b; U.S. Geological Survey [USGS], 2016). Decreasing trend indicated in hydraulic head at a depth of 9 feet. Increasing trend indicated in hydraulic head at a depth of 70 feet.
Table 14.
Summary of Regional Observation and Monitor-well Program groundwater monitoring wells of interest along the northern coast of Tampa Bay (Southwest Florida Water Management District [SWFWMD], 2018b; U.S. Geological Survey [USGS], 2016).[Monitoring wells shown in figure 22. Horizontal coordinate information is referenced to the North American Datum of 1983 (NAD 83). ROMP, Regional Observation and Monitor-well Program; deg, degrees; min, minutes; sec, seconds; NAVD 88, North American Vertical Datum of 1988; ft, foot; SAS, surficial aquifer system; UFA, Upper Floridan aquifer; Tampa Member, Tampa Member of the Arcadia Formation; -, no data]
Table 15.
Summary of hydraulic head data from Regional Observation and Monitor-well Program groundwater monitoring wells of interest along the northern coast of Tampa Bay (Southwest Florida Water Management District [SWFWMD], 2018b; U.S. Geological Survey [USGS], 2016).[Monitoring wells shown in figure 22. Dates shown as month, day, year. ROMP, Regional Observation and Monitor-well Program; ft, foot; NAVD 88, North American Vertical Datum of 1988; Kendall’s τ, Kendall’s tau]
TR 14-2 and TR 14-3 are located at higher land surface elevations (54- and 94-ft depths) compared to TR 14-1 (16-ft depth) and therefore have higher hydraulic heads within the SAS (figs. 38 and 39, table 14). Mean hydraulic heads for 1987–2022 within TR 14-2 were 48.10, 4.59, and 1.27 ft (NAVD 88) within the SAS (18-ft depth), UFA/Tampa Member (213-ft depth), and UFA/Ocala Limestone (440-ft depth), respectively (fig. 38, table 15). Mean hydraulic heads for 1987–2022 within well TR 14-3 were 90.04, 4.76, and 5.65 ft (NAVD 88) within the SAS (10-ft depth), UFA/Tampa Member (125-ft depth), and UFA/Suwannee Limestone (299-ft depth) (fig. 39, table 15), respectively. These data suggest that the SAS at TR 14-2 and TR14-3 does not appear to be as well-connected to the underlying aquifer units compared to the SAS at TR 14-1, with a confining unit likely present at TR 14-2 and TR 14-3. Well construction logs for wells TR 14-3 and TR 14-2 indicate approximately 70 ft and 43 ft of clay within the UCU/Hawthorn Group between the sand from the SAS and limestone from the UFA/Tampa Member, respectively (Decker, 1984b; Henderson and Decker, 1985). Data suggest the UFA/Tampa Member (213-ft depth) and UFA/Ocala Limestone (440-ft depth) hydrogeologic/geologic unit designations at TR 14-2 are not as well-connected when compared to the UFA/Tampa Member (125-ft depth) and UFA/Suwannee Limestone (299-ft depth) hydrogeologic/geologic unit designations at TR 14-3.
Williams and Kuniansky (2015) described the Suwannee permeable zone as including both the Tampa Member and Suwannee Limestone in west-central Florida, possibly explaining why these formations appear to be well-connected while the Tampa Member and the Ocala Limestone within these wells appear to not be. There were no significant long-term trends in hydraulic head at these three well locations. During the same period, chloride concentrations at TR 14-2 within the UFA/Tampa Member (213-ft depth) decreased from approximately 1,700 to 500 mg/L, while chloride concentrations at TR 14-3 within the UFA/Suwannee Limestone (299-ft depth) increased from approximately 20 to 1,700 mg/L (figs. 38 and 39, table 16). Chloride concentrations at TR 14-2 indicated saline groundwater present within the UFA/Ocala Limestone (440-ft depth), with values between 10,000 and 11,000 mg/L measured during 1988–91 (fig. 38). Chloride concentrations at TR 14-3 within the UFA/Suwannee Limestone (299-ft depth) increased from below 50 mg/L to over 1,700 mg/L during this period, transitioning from fresh to brackish. The TR 14-3 monitoring well is located near public-supply production wells cased in the Tampa Limestone, which together with the increase in chloride concentration, suggests higher salinity water being drawn upwards into the Suwannee Limestone from deeper within the UFA (SWFWMD, 2023).
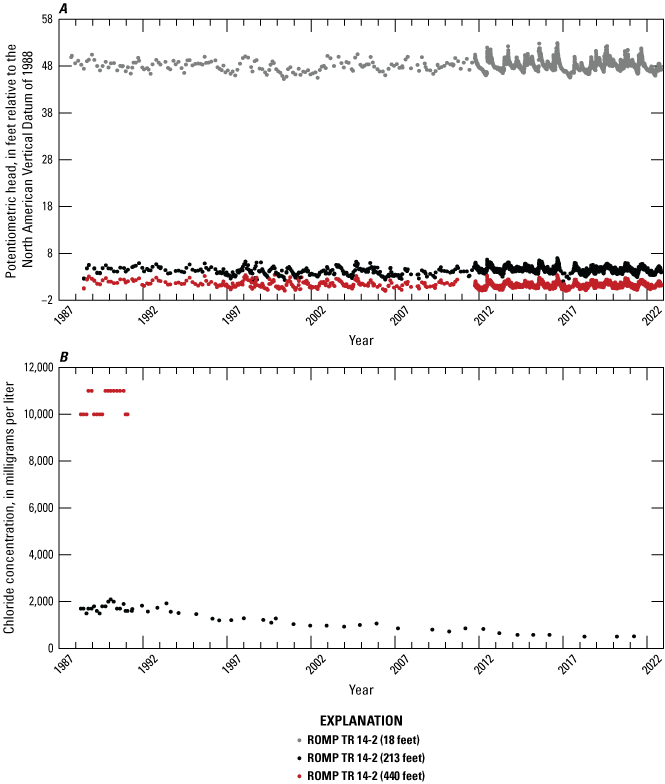
Hydraulic heads and chloride concentrations within the Regional Observation and Monitor-well Program well TR 14-2 (Southwest Florida Water Management District [SWFWMD], 2018b; U.S. Geological Survey [USGS], 2016). Decreasing trend indicated in hydraulic heads at a depth of 440 feet (table 15). Decreasing trend indicated in chloride concentrations at a depth of 213 feet (table 16).
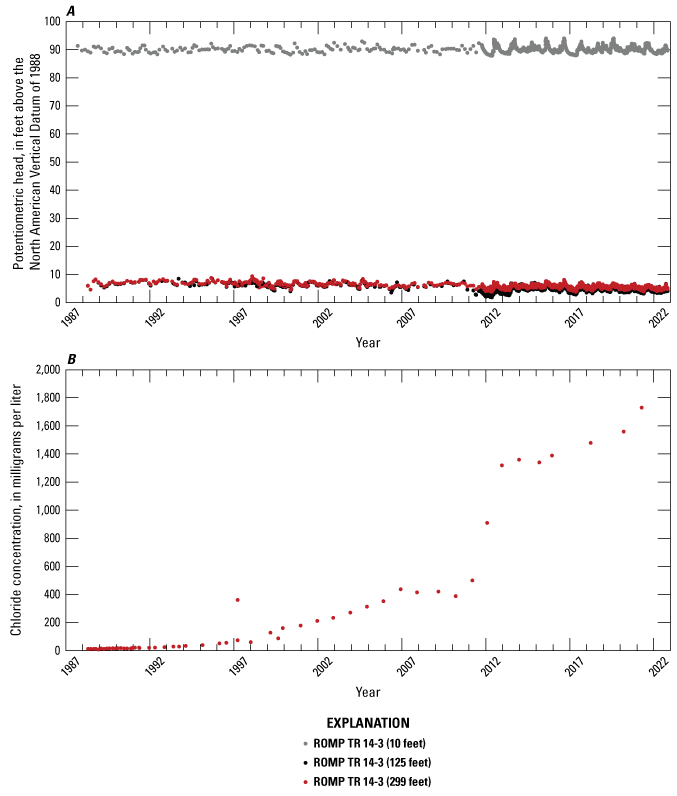
Hydraulic heads and chloride concentrations within the Regional Observation and Monitor-well Program well TR 14-3 (Southwest Florida Water Management District [SWFWMD], 2018b; U.S. Geological Survey [USGS], 2016). Decreasing trend indicated in hydraulic heads at depths of 125 and 299 feet (table 15). Increasing trend indicated in chloride concentrations at a depth of 299 feet (table 16).
Table 16.
Summary of chloride concentration data from Regional Observation and Monitor-well Program groundwater monitoring wells of interest along the northern coast of Tampa Bay (Southwest Florida Water Management District [SWFWMD], 2018b; U.S. Geological Survey [USGS], 2016).[Monitoring wells shown in figure 22. Dates shown as month, day, year. ROMP, Regional Observation and Monitor-well Program; ft, foot; mg/L, milligram per liter; Kendall’s τ, Kendall’s tau; -, no data]
Monitoring wells TR 13-1X and TR 13-2X are located west of Old Tampa Bay on the Pinellas Peninsula (fig. 22). Well TR 13-1X is located approximately 4 mi from the bay and 3 mi from the gulf coast and has four monitored depths finished within the SAS (10-ft depth), UFA/Tampa Member (173-ft depth), UFA/Suwannee Limestone (254-ft depth), and UFA/Ocala Limestone (520-ft depth) (table 14). The highest hydraulic heads in TR 13-1X are measured within the UFA/Tampa Member (173-ft depth) and UFA/Suwannee Limestone (254-ft depth), having mean hydraulic heads for 1988–2022 of 5.89 and 5.62 ft (NAVD 88), respectively (fig. 40, table 15).
The similar hydraulic heads and responses for TR-13-1X suggest that the UFA/Tampa Member (173-ft depth) and UFA/Suwannee Limestone (254-ft depth) hydrogeologic/geologic unit designations are well-connected. During the same period, hydraulic heads measured within the shallower SAS (10-ft depth) at TR 13-1X have a mean value of 3.24 ft (NAVD 88), indicating the likely presence of a confining unit between the SAS and the UFA/Tampa Member at this location (table 15). Well construction logs indicate the presence of clay from the UCU/Hawthorn Group between depths of 22 and 78 ft, likely resulting in confinement (Clayton, 1985b). The hydraulic heads within the SAS (10-ft depth), UFA/Tampa Member (173-ft depth), and UFA/Suwannee Limestone (254-ft depth) at TR 13-1X are each above mean tidal levels, indicating that there is an upward vertical gradient and that groundwater would likely discharge (rather than recharge) in the northwestern part of the bay. The lowest hydraulic heads at this location were measured within the UFA/Ocala Limestone (520-ft depth), with a mean value of −0.77 ft (NAVD 88) suggesting the UFA/Suwannee Limestone (254-ft depth) and the UFA/Ocala Limestone (520-ft depth) are not well-connected (table 15).
Well TR 13-2X is located 1.5 mi from the bay and had mean hydraulic heads of 13.18, 5.46, 4.04, and −1.62 ft (NAVD 88) within the SAS (10-ft depth), UFA/Tampa Member (146-ft depth), UFA/Suwannee Limestone (269-ft depth), and UFA/Suwannee Limestone (530-ft depth), respectively (fig. 41, table 15). The hydraulic heads within the UFA/Tampa Member (146-ft depth) and UFA/Suwannee Limestone (269-ft depth) are similar during the period 1988–2022, suggesting these aquifers are well-connected, as is the case at TR 13-1X. The lowest measured hydraulic heads at this location were measured within the UFA/Suwannee Limestone (530-ft depth), with a mean value of −1.62 ft. The differences in head between the two UFA/Suwannee Limestone monitored depths of 269 and 530 ft suggests these depth locations within the same aquifer designation are not well-connected. The differences in mean hydraulic heads between the SAS (10-ft depth) and UFA/Tampa Member (146-ft depth) would also suggest these aquifer units are not well-connected with the likely presence of a confining unit. Well construction logs for TR 13-2X indicate the presence of clay from the UCU/Hawthorn Group between depths of 39 and 123.5 ft, likely resulting in confinement (Clayton, 1985a). These results are like those from TR13-1X except for the higher hydraulic heads measured within the SAS at TR 13-2X. The likely cause for the differences in hydraulic heads is the higher land surface elevation at TR 13-2X, 16.6 ft (NAVD 88), compared to TR13-1X, 9.1 ft (NAVD 88) (table 14). In all but the UFA/Suwannee Limestone (530-ft depth), the mean hydraulic heads during the periods of record are greater than the mean tidal levels. Kendall’s τ and p-values indicate significant increasing trends in hydraulic head at TR 13-1X within the SAS (10-ft depth) and UFA/Ocala Limestone (520-ft depth) and at TR 13-2X within the UFA/Tampa Member (146-ft depth) and UFA/Suwannee Limestone (530-ft depth) (table 15). A significant decreasing trend in hydraulic head was indicated at TR 13-2X within the UFA/Suwannee Limestone (269-ft depth). Significant trends in hydraulic head were not indicated at the other monitored depths within either well.
Chloride concentrations at TR 13-1X within the UFA/Tampa Member (173-ft depth) have a mean value of 89 mg/L for 1988–99 and no significant trend (fig. 40, table 16); however, Kendall’s τ and p-values for chloride concentrations within the UFA/Suwannee Limestone (254-ft depth) indicate a significant increasing trend during the period 1988–2022, transitioning from fresh to brackish (greater than 1,000 mg/L), with a mean value of 574 mg/L. A significant increasing trend in chloride concentration at TR 13-2X within the UFA/Suwannee Limestone (269-ft depth) is also indicated by Kendall’s τ and p-values. However, chloride concentrations at this location were higher than those measured at TR 13-1X, with a mean value of 3,462 mg/L (fig. 41, table 16). A search of water use permits in this area did not reveal any nearby locations of groundwater production or withdrawal (SWFWMD, 2023).
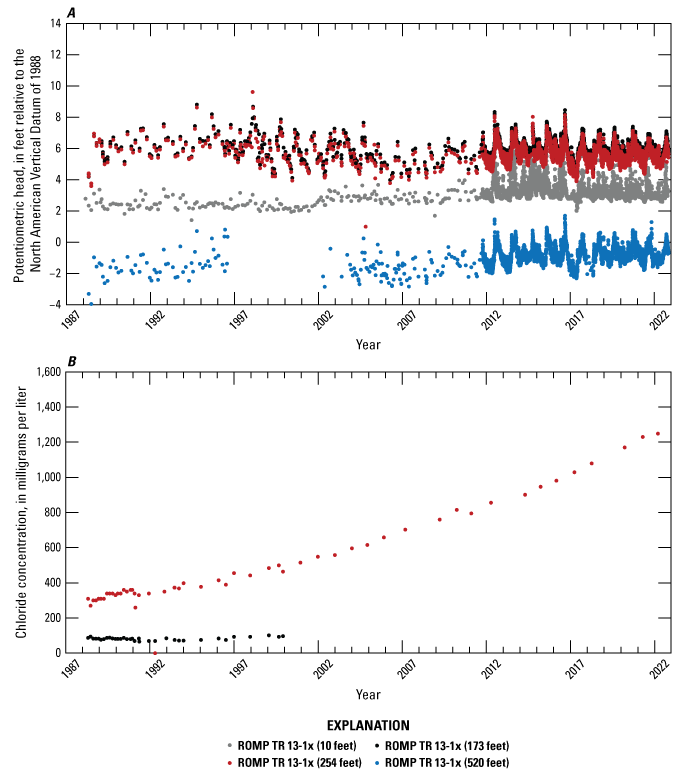
Hydraulic heads and chloride concentrations within the Regional Observation and Monitor-well Program well TR 13-1X (Southwest Florida Water Management District [SWFWMD], 2018b; U.S. Geological Survey [USGS], 2016). Increasing trend indicated in hydraulic heads at depths of 10 and 520 feet (table 15). Decreasing trend indicated in hydraulic heads at depths of 173 and 254 feet. Increasing trend indicated in chloride concentrations at a depth of 254 feet (table 16).
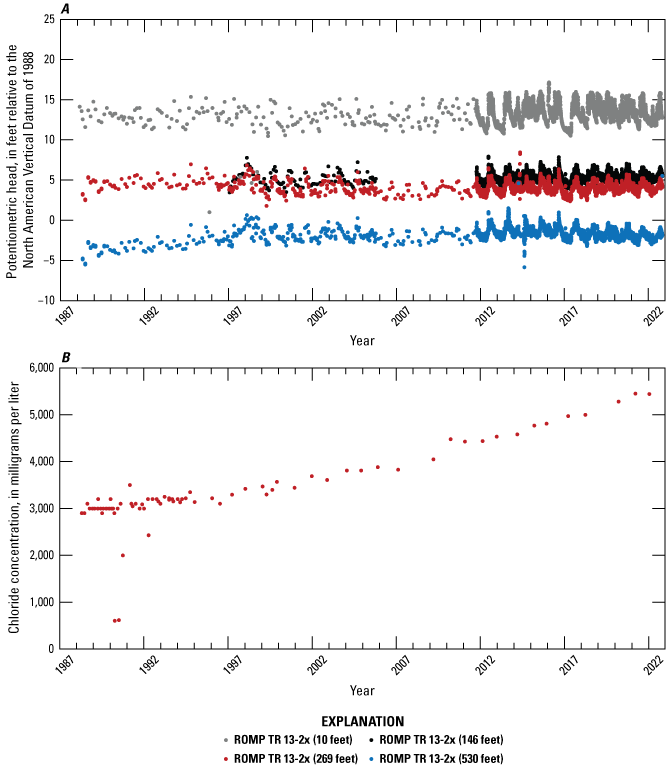
Hydraulic heads and chloride concentrations within the Regional Observation and Monitor-well Program well TR 13-2X (Southwest Florida Water Management District [SWFWMD], 2018b; U.S. Geological Survey [USGS], 2016). Increasing trend indicated in hydraulic heads at depths of 10, 146, and 530 feet (table 15). Decreasing trend indicated in hydraulic heads at a depth of 269 feet. Increasing trend indicated in chloride concentrations at a depth of 269 feet (table 16).
Groundwater well TR 13-3 is located approximately 3 mi north of Old Tampa Bay and has measured hydraulic heads within the SAS (10-ft depth) and UFA/Avon Park Formation (724-ft depth) (fig. 22). The mean hydraulic head for 1977–2022 within the SAS (10-ft depth) was 14.46 ft (NAVD 88) and the mean hydraulic head for 1982–2022 within the UFA/Avon Park Formation (724-ft depth) was 14.84 ft (NAVD 88) (fig. 42, table 15). The similarity in hydraulic heads and groundwater response between measurements suggest these aquifers are well-connected across these depths (table 15). Well construction logs do not indicate the presence of clays from the UCU/Hawthorn Group between these two depths, whereas Williams and Kuniansky (2015) indicate that within this geographic area, a well depth of 724 ft would likely be within the Avon Park permeable zone. Mean chloride concentration for 1991–2022 within the UFA/Avon Park Formation (724-ft depth) was 913 mg/L (table 16). Prior to approximately 1997, there was an upward vertical gradient in hydraulic head between the SAS and UFA/Avon Park Formation. After 1997, there is an increase in the frequency of periods of downward vertical gradient, which coincides with increased chloride concentrations within the UFA/Avon Park Formation. Kendall’s τ and p-values indicate an increasing trend in hydraulic head within the SAS (10-ft depth) and decreasing trend within the UFA/Avon Park Formation (724-ft depth), and an increasing trend in chloride concentration within the UFA/Avon Park Formation (724-ft depth), transitioning from fresh to brackish (tables 15 and 16).
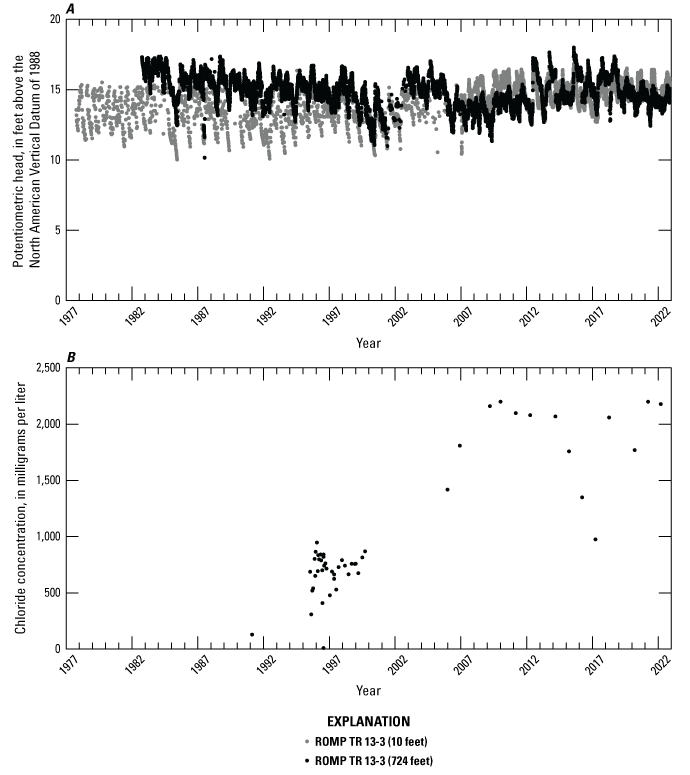
Hydraulic heads and chloride concentrations within the Regional Observation and Monitor-well Program well TR 13-3 (Southwest Florida Water Management District [SWFWMD], 2018b; U.S. Geological Survey [USGS], 2016). Increasing trend indicated in hydraulic heads at a depth of 10 feet (table 15). Decreasing trend indicated in hydraulic heads at a depth of 724 feet. Increasing trend indicated in chloride concentrations at a depth of 724 feet (table 16).
Monitoring wells TR 12-1 and TR 12-3 are located northeast of Old Tampa Bay approximately 0.3 and 3 mi from shore, respectively (fig. 22). The mean measured hydraulic head at TR 12-1 was 3.88 ft (NAVD 88) for 1996–2022 within the SAS (22-ft depth) and 4.48 ft (NAVD 88) for 1993–2022 within the UFA/Tampa Member (132-ft depth) (fig. 43, table 15). The similarities in hydraulic heads and responses during the measurement periods suggest the SAS and UFA/Tampa Member are well-connected at this location with a slight upward hydraulic head gradient (table 15). Well construction logs indicate approximately 15.5 ft of UCU/Hawthorn Group present between depths of 24 and 39.5 ft, which could indicate some confinement (SWFWMD, undated a). Monitoring well TR 12-3 has less available hydraulic head data than TR 12-1 because of an incomplete dataset during the period 1993–2022 at a single depth of 294 ft within the UFA/Suwannee Limestone (fig. 44, table 15). For this period, the mean hydraulic head was 11.05 ft (NAVD 88). Kendall’s τ and p-values indicate significant increasing trends in hydraulic head within the SAS (22-ft depth) and UFA/Tampa Member (132-ft depth) at TR 12-1 and within the UFA/Suwannee Limestone (294-ft depth) at TR 12-3 (table 15). Measured chloride concentrations within the UFA/Suwannee Limestone (132-ft depth) at TR 12-1 had a mean value of 548 mg/L for 1992–2022 and a significant increasing trend (fig. 43, table 16). Measured chloride concentrations within the UFA/Suwannee Limestone (294-ft depth) at TR 12-3 had a mean value of 67 mg/L for 1992–2022 and a significant decreasing trend, but with very low chloride concentrations (fig. 44, table 16). Groundwater within both TR 12-1 and TR 12-3 was considered fresh (less than 1,000 mg/L) at these depths during these periods.
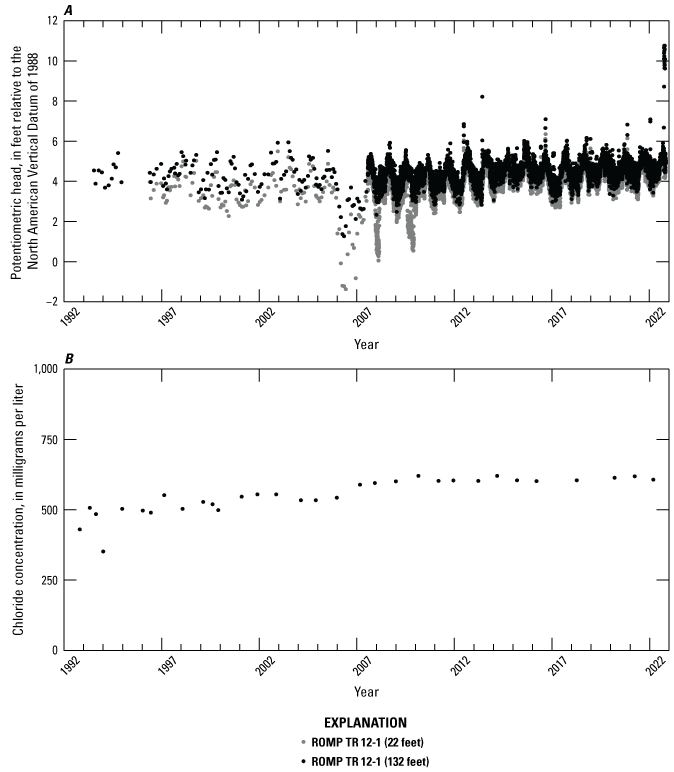
Hydraulic heads and chloride concentrations within the Regional Observation and Monitor-well Program well TR 12-1 (Southwest Florida Water Management District [SWFWMD], 2018b; U.S. Geological Survey [USGS], 2016). Increasing trend indicated in hydraulic heads at depths of 22 and 132 feet (table 15). Increasing trend indicated in chloride concentrations at a depth of 132 feet (table 16).
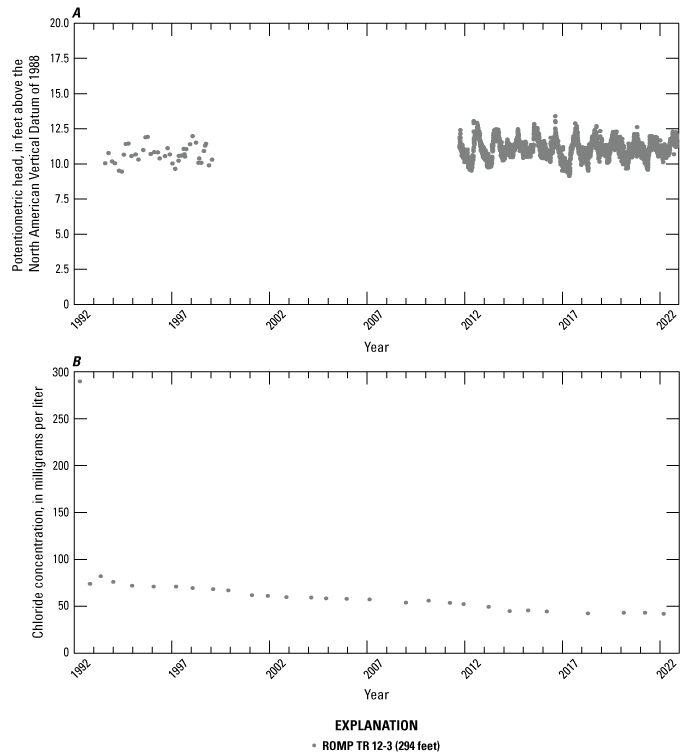
Hydraulic heads and chloride concentrations within the Regional Observation and Monitor-well Program well TR 12-3 (Southwest Florida Water Management District [SWFWMD], 2018b; U.S. Geological Survey [USGS], 2016). Increasing trend indicated in hydraulic heads and decreasing trend indicated in chloride concentrations at a depth of 294 feet (tables 15 and 16).
Groundwater monitoring wells TR 11-2, TR 10-2, and 62 are located along the northeastern coast of Hillsborough Bay (fig. 22). Well TR 11-2 has a single monitored depth within the UFA/Suwannee Limestone (300-ft depth) and is located near the Tampa Bypass Canal approximately 3 mi inland and downstream from all control structures on the canal. Hydraulic heads within the UFA/Suwannee Limestone (300-ft depth) at TR 11-2 had a mean value of 14.34 ft (NAVD 88) for 1980–2022 and an increasing trend with an approximate 2.5-ft rise by the end of this period (fig. 45, table 15). Chloride concentration data for 1982–2022 within the UFA/Suwannee Limestone (300-ft depth) at TR 11-2 had a mean concentration of 204 mg/L and a significant increasing trend (table 16). Multiple depths were not monitored at this location; however, well construction logs specify 33 ft of UCU/Hawthorn Group between depths of 7 and 40 ft, which could indicate some confinement (SWFWMD, undated b). Additionally, Williams and Kuniansky (2015) suggest that the monitored depth of 300 ft within this area likely lies within the Suwannee permeable zone.
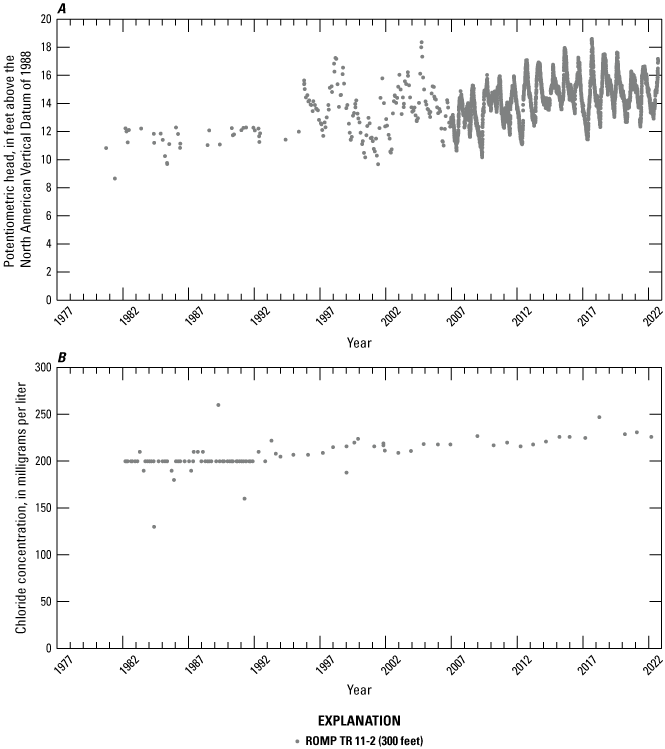
Hydraulic heads and chloride concentrations within the Regional Observation and Monitor-well Program well TR 11-2 (Southwest Florida Water Management District [SWFWMD], 2018b; U.S. Geological Survey [USGS], 2016). Increasing trend indicated in hydraulic heads and chloride concentrations at a depth of 300 feet (tables 15 and 16).
Hydraulic heads within well TR 10-2 were monitored within the SAS (3-ft depth) and UFA/Tampa Member (115-ft depth). Hydraulic heads within the SAS had a mean value of 11.67 ft for 1995–2022 (fig. 46, table 15). Hydraulic heads within the UFA/Tampa Member (115-ft depth) for 1980–2022 had a lower mean value of 9.16 ft (NAVD 88) and exhibited an increase of approximately 10 ft from 1980 to 1996. Hydraulic heads within the SAS (3-ft depth) at well TR 10-2 were approximately 3-4 ft higher compared to those in the UFA/Tampa Member (115-ft depth). After 1996, hydraulic heads demonstrated a steady increasing trend within the UFA/Tampa Member (115-ft depth) and no significant trend within the SAS (3-ft depth). Two possible reasons for the lack of change in the shallower aquifer are that either discharge to the surface could occur as hydraulic heads in the shallow aquifer approach land surface (14.0-ft depth) or the measurement system was not able to accurately capture the hydraulic heads beyond this range. The approximate 3-ft difference in measured hydraulic heads between the SAS and UFA/Tampa Member suggests the two aquifer units are not well-connected between the two monitored depths (table 14). Well construction logs indicate approximately 6 ft of UCU/Hawthorn Group present between depths of 19 and 25 ft and 28.5 ft of low permeability limestone present between depths of 34.5 and 63 ft (SWFWMD, undated c).
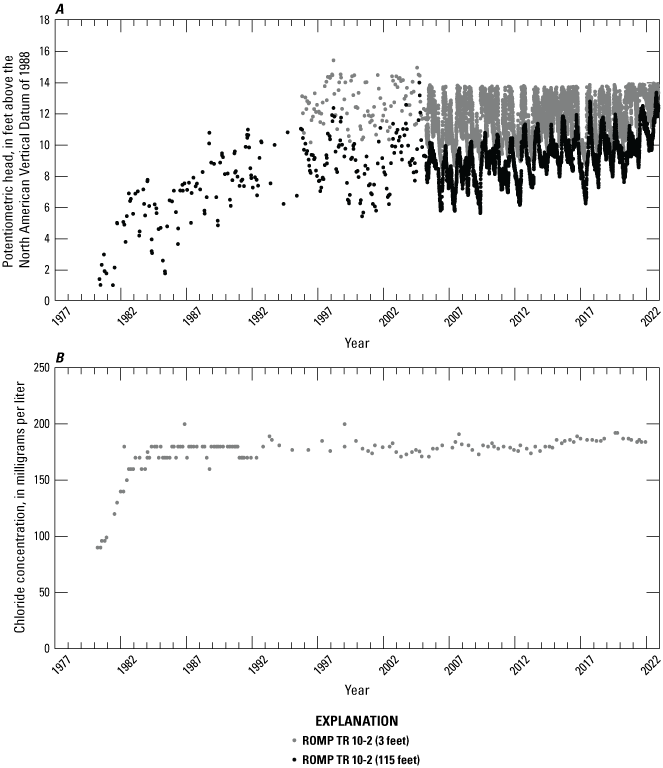
Hydraulic heads and chloride concentrations within the Regional Observation and Monitor-well Program well TR 10-2 (Southwest Florida Water Management District [SWFWMD], 2018b; U.S. Geological Survey [USGS], 2016). Increasing trend indicated in hydraulic heads and chloride concentrations at a depth of 115 feet (tables 15 and 16).
Chloride concentration data for 1980–2021 within the UFA/Tampa Member Formation at TR 10-2 had a mean value of 174 mg/L and indicated an abrupt increase of approximately 80 mg/L from 1980 to 1983 (fig. 46, table 16). The timing of this increase coincides with the cessation of industrial pumping of saline water from the UFA near the mouth of the Alafia River that was discussed previously in the “Groundwater Withdrawals” section (table 3). One hypothesis is that the groundwater withdrawals could have pulled freshwater down from the shallower aquifer and once withdrawals ceased, the salinity increased. Chloride concentrations at this depth seem to have stabilized at this increased level once the system was allowed to recover.
Groundwater monitoring well 62 is located south of the Alafia River approximately 5 mi inland from the bay (fig. 22, table 14). Measured hydraulic heads at this well for 2011–22 had mean values of 56.87 and 12.95 ft (NAVD 88) within the SAS (13-ft depth) and UFA/Suwannee Limestone (218-ft depth), respectively (fig. 47, table 15). Measured hydraulic heads for 1995–2022 had a mean value of 11.5 ft (NAVD 88) within the UFA/Avon Park Formation (625-ft depth). The higher hydraulic heads within the shallow aquifer at this well relative to those in nearby wells are likely due to the higher land-surface elevation, 59.4 ft (NAVD 88), at this measurement site relative to other sites along the northern coast of Tampa Bay, and likely presence of a confining unit between the SAS and UFA/Suwanee Limestone designations. Well construction logs in the area indicate approximately 150 ft of UCU/Hawthorn Group confining unit present between the SAS and UFA/Suwannee Limestone (Gates, 2013). The hydraulic heads measured at the deeper depths had very similar values and responses, suggesting the UFA/Suwannee Limestone (218-ft depth) and UFA/Avon Park Formation (625-ft depth) hydrogeologic/geologic unit designations are well-connected at this location. Hydraulic heads demonstrated a significant increasing trend for the period 1995–2021 at all depths. Measured chloride concentrations within the UFA/Avon Park Formation (625-ft depth) had a mean value of 27 mg/L for this period and exhibited a significant increasing trend, but the magnitude of change was slight (fig. 47; table 16).
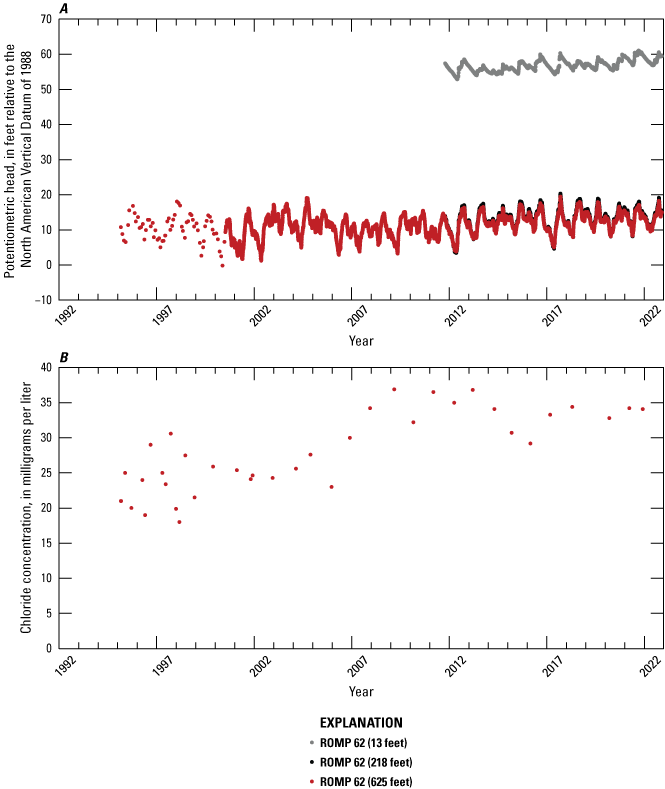
Hydraulic heads and chloride concentrations within the Regional Observation and Monitor-well Program well 62 (Southwest Florida Water Management District [SWFWMD], 2018b; U.S. Geological Survey [USGS], 2016). Increasing trend in hydraulic heads indicated at depths of 13, 218, and 625 feet (table 15). Increasing trend indicated in chloride concentrations at a depth of 625 feet (table 16).
In summary, wells considered to be located along the northern coast of Tampa Bay are located on the Pinellas Peninsula and along the northern coast of Old Tampa Bay and Hillsborough Bay. On the Pinellas Peninsula (TR 14-3, TR 13-1X, and TR 13-2X), deeper levels of the UFA (>250 ft) had upward trends in chloride concentration over time, but water withdrawal records that could explain this trend were not identified. That does not preclude the fact that water withdrawals occur in this area that affect salinity at the deeper monitoring levels. Hydraulic heads in this area were above tidal levels, indicating discharge to the bay if the UFA were exposed.
Along the northern coast of Old Tampa Bay, Kendall’s τ and p-values for data from well TR 13-3 indicate a decreasing trend in hydraulic head and an increasing trend in chloride concentrations at a depth of 724 ft, suggesting possible increased stresses on the groundwater system such as groundwater extraction. Data collected at wells TR 12-1 and TR 12-3 indicate increasing trends in hydraulic heads at depths of 10, 132, and 294 ft. Along the eastern coast of Hillsborough Bay (TR 11-2, TR 10-2 [115 ft], and 62), a similar pattern of increasing trend in hydraulic head was attributed to the cessation of saltwater withdrawals from the UFA in this region and recovery of cone of depression A (figs. 16 and 17). This area has also been affected by construction of the Tampa Bypass Canal in 1978. As previously discussed, base-flow discharge in the canal after construction was estimated to be approximately twice that of preconstruction discharge, indicating an upward flow of groundwater (discharge). Hydraulic heads inland along the canal system increased by as much as 4 ft because of the impoundment of water within the canal.
Groundwater Monitoring Wells Along the Eastern Coast of Tampa Bay
Hydraulic head and chlorine concentration data from 10 wells within 10 mi of the eastern coast of Tampa Bay were analyzed for trends (fig. 22, table 17). ROMP wells TR 9-1, TR 9-3, TR 9-2, and TR AB-3 are roughly oriented southwest to northeast along a transect extending inland from the bay (fig. 22). Well TR 9-1 is approximately 1 mi from the shoreline and has a single measurement depth within the UFA/lower Arcadia Formation (124-ft depth). Hydraulic heads measured 1976–2022 had a mean value of 11.82 ft (NAVD 88), which is 8.6 ft above land surface elevation, and exhibited a significant increasing trend during this period (fig. 48, table 18). Well construction logs noted that an artesian aquifer was encountered approximately 86 ft below land surface within the UCU/Hawthorn Group and was overlain by approximately 40 ft of a mixture of clay, marl, and limestone (SWFWMD, undated d). The mean measured chloride concentration during 1978–2022 was 26 mg/L, indicating fresh groundwater (table 19). Except for an approximate 4-year period when chloride concentrations approached 50 mg/L, the data indicate steady levels near 25 mg/L with a statistically significant decreasing trend.
Table 17.
Summary of Regional Observation and Monitor-well Program groundwater monitoring wells of interest within the area east of Tampa Bay (Southwest Florida Water Management District [SWFWMD], 2018b; U.S. Geological Survey [USGS], 2016).[Monitoring wells shown in figure 22. Horizontal coordinate information is referenced to the North American Datum of 1983 (NAD 83). ROMP, Regional Observation and Monitor-well Program; deg, degrees; min, minutes; sec, seconds; ft, foot; NAVD 88, North American Vertical Datum of 1988; SAS, surficial aquifer system; UFA, Upper Floridan aquifer; lower Arcadia Formation, lower part of the Arcadia Formation of the Hawthorn Group, upper Arcadia Formation, upper part of the Arcadia Formation of the Hawthorn Group; -, no data]
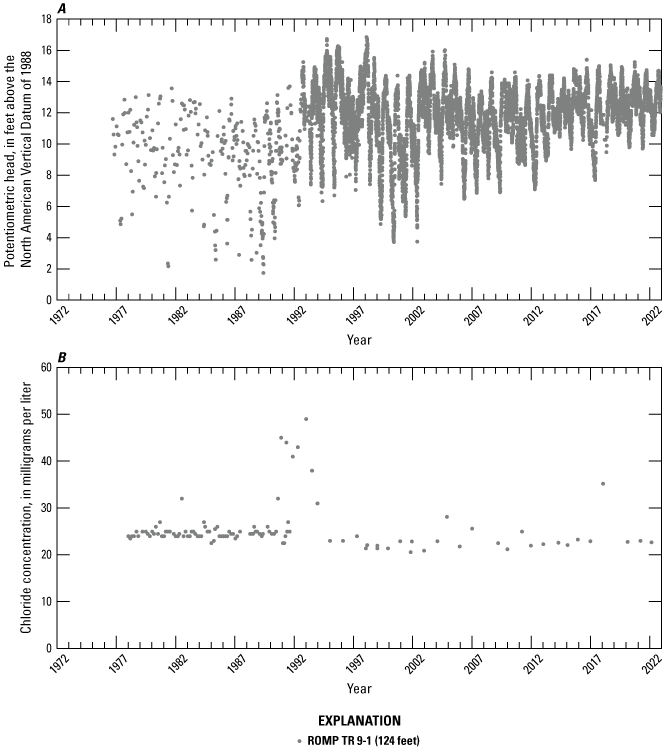
Hydraulic heads and chloride concentrations within the Regional Observation and Monitor-well Program well TR 9-1. Increasing trend indicated in hydraulic heads and decreasing trend indicated in chloride concentrations at a depth of 124 feet (tables 18 and 19).
Table 18.
Summary of hydraulic head data from Regional Observation and Monitor-well Program groundwater monitoring wells of interest in the area east of Tampa Bay (Southwest Florida Water Management District [SWFWMD], 2018b; U.S. Geological Survey [USGS], 2016).[Monitoring wells shown in figure 22. Dates shown as month, day, year. ROMP, Regional Observation and Monitor-well Program; ft, foot; NAVD 88, North American Vertical Datum of 1988; Kendall’s τ, Kendall’s tau]
Table 19.
Summary of chloride concentration data from Regional Observation and Monitor-well Program groundwater monitoring wells of interest in the area east of Tampa Bay (Southwest Florida Water Management District [SWFWMD], 2018b; U.S. Geological Survey [USGS], 2016).[Monitoring wells shown in figure 22. ROMP, Regional Observation and Monitor-well Program; ft, foot; mg/L, milligram per liter; Kendall’s τ, Kendall’s tau; -, no data]
ROMP well TR 9-3 is located approximately 2 mi east of the bay and has hydraulic head data for the SAS (20-ft depth), UFA/Suwannee Limestone (289-ft depth), and UFA/Avon Park Formation (764-ft depth) (table 17). Mean hydraulic heads for 1976–2022 were 3.16, −1.28, and 7.21 ft (NAVD 88) for the SAS, UFA/Suwannee Limestone, and UFA/Avon Park Formation, respectively (table 18). The differences in mean hydraulic head suggest these three hydrogeologic/geologic unit designations are likely separated by a confining unit and thus not well-connected. Well construction logs indicate 132 ft of UCU/Hawthorn Group present between depths of 28 and 160 ft and moderately high porosity and permeability at depths of 289 and 764 ft (Decker, 1984a). Kendall’s τ and p-values for the hydraulic head data from the UFA/Suwannee Limestone well (289-ft depth) indicate a significant downward trend after approximately 2005, whereas Kendall’s τ and p-values for the hydraulic head data for the SAS (20-ft depth) and UFA/Avon Park Formation (764-ft depth) indicated increasing trends (table 18). The lower mean hydraulic heads measured within the UFA/Suwannee Limestone indicate groundwater extractions likely are occurring in the area at these depths; however, the potentiometric-surface maps for the UFA in May 2019 do not show a cone of depression near this well (fig. 21). The lack of a depression on the map may be an artifact of the selection of deeper wells within the area to represent the potentiometric surface.
Chloride concentration data from TR 9-3 within the SAS (20-ft depth) and UFA/Suwannee Limestone (289-ft depth) indicate fresh groundwater and Kendall’s τ and p-values indicate no long-term trends, with mean chloride concentrations for 1990–2022 of 53 and 863 mg/L, respectively (fig. 49, table 19). The calculated mean chloride concentration of 863 mg/L within the UFA/Suwannee Limestone (289-ft depth) is likely higher than the central tendency because of 20 values within the dataset that are above 3,000 mg/L (not shown on figure). The higher values are the same magnitude as those of samples collected from the deeper UFA/Avon Park Formation (764-ft depth) at the same time of measurement and well above the values for the samples collected before and after those collected from the UFA/Suwannee Limestone. Removing these values from the calculation of the mean chloride concentration yields a value of 550 mg/L, which is likely more representative of the actual chloride concentration at this depth. Within the UFA/Avon Park Formation (764-ft depth), Kendall’s τ and p-values for chloride concentration data indicate a long-term increasing trend beginning in 1985, resulting in saline groundwater after approximately 2010 (fig. 49, table 19). Given the lower mean groundwater levels within the UFA/Suwannee Limestone (289-ft depth), any upward groundwater flow in this area from the deeper aquifer would result in increased salinity at shallower depths.
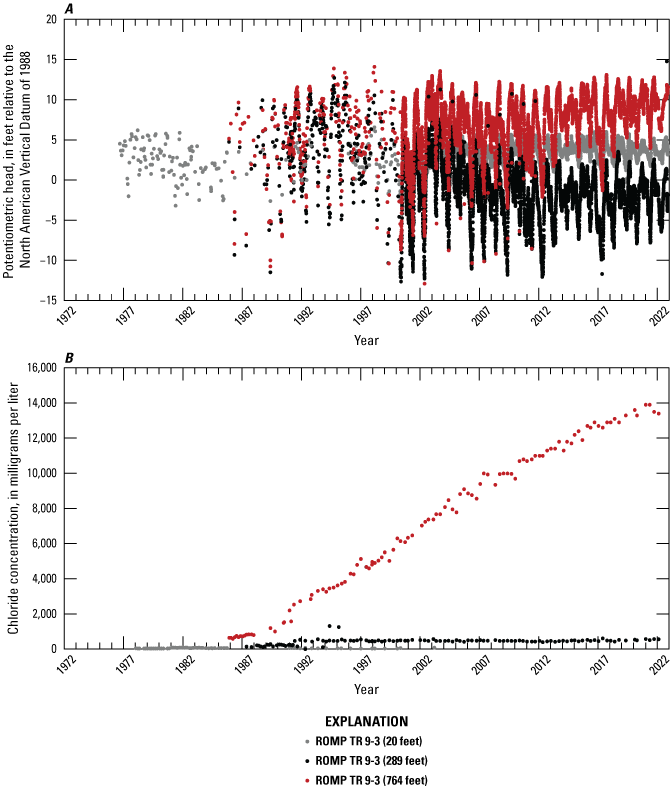
Hydraulic heads and chloride concentrations within the Regional Observation and Monitor-well Program well TR 9-3 (Southwest Florida Water Management District [SWFWMD], 2018b; U.S. Geological Survey [USGS], 2016). Increasing trend indicated in hydraulic heads at depths of 20 and 764 feet (table 18). Decreasing trend indicated in hydraulic heads at a depth of 289 feet. Increasing trend indicated in chloride concentrations at a depth of 764 feet (table 19).
ROMP well TR 9-2 is located approximately 2.5 mi from the bay and has data measured within the SAS (10-ft depth), UFA/lower Arcadia Formation (118-ft depth), UFA/Suwannee Limestone (247-ft depth), UFA/Ocala Limestone (622-ft depth), and the UFA/Avon Park Formation (714-ft depth) (table 17). Mean hydraulic heads for 1992–2022 within all but the deepest aquifer vary by only 1.72 ft, having values of 6.92, 8.23, 8.64, and 7.89 ft (NAVD 88) for the SAS, UFA/lower Arcadia Formation, UFA/Suwannee Limestone, and UFA/Ocala Limestone, respectively (figs. 50 and 51, table 18). The relative similarity in heads suggests these hydrogeologic/geologic unit designations are likely well-connected. However, well construction logs document the presence of 230.5 ft of UCU/Hawthorn Group formations between depths of 38 and 268.5 ft, indicating the presence of a confining unit between the SAS and lower aquifer units (Decker, 1990). The measured hydraulic heads for these four hydrogeologic/geologic unit designations and depths have an increasing trend during this period (table 18). The deepest well at ROMP well TR 9-2 is within the UFA/Avon Park Formation (714-ft depth) and generally has lower measured hydraulic heads than those within the shallower units, with a mean value of 4.35 ft (NAVD 88) during the same period (fig. 51, table 18). Kendall’s τ and p-values for measured hydraulic heads within the UFA/Avon Park Formation at TR 9-2 indicate a significant decreasing trend during this period. The larger differences in hydraulic heads suggest the UFA/Avon Park Formation is not well-connected with the shallower units and the likelihood of a confinement layer between them. Well construction logs describe approximately 239.5 ft of core as having low to low-moderate permeability between depths of 457.5 and 697 ft (Decker, 1990).
Chloride concentrations within the shallower wells at ROMP well TR 9-2 for 1990–2022 indicate freshwater conditions, and Kendall’s τ and p-values indicate no significant trends within the SAS (10-ft depth), UFA/lower Arcadia Formation (118-ft depth), and UFA/Suwannee Limestone (247-ft depth), with mean values of 37, 23, and 199 mg/L, respectively (fig. 50, table 19). Kendall’s τ and p-values for the chloride concentration data at the greater depths indicate significant increasing trends, with mean values of 934 and 4,971 mg/L within the UFA/Ocala Limestone (622-ft depth) and UFA/Avon Park Formation (714-ft depth), respectively (fig. 51, table 19). Groundwater within the UFA/Ocala Limestone transitions from fresh to brackish, whereas groundwater within the UFA/Avon Park Formation nearly completes the transition from brackish to saline, with a final value above 9,000 mg/L (fig. 51).
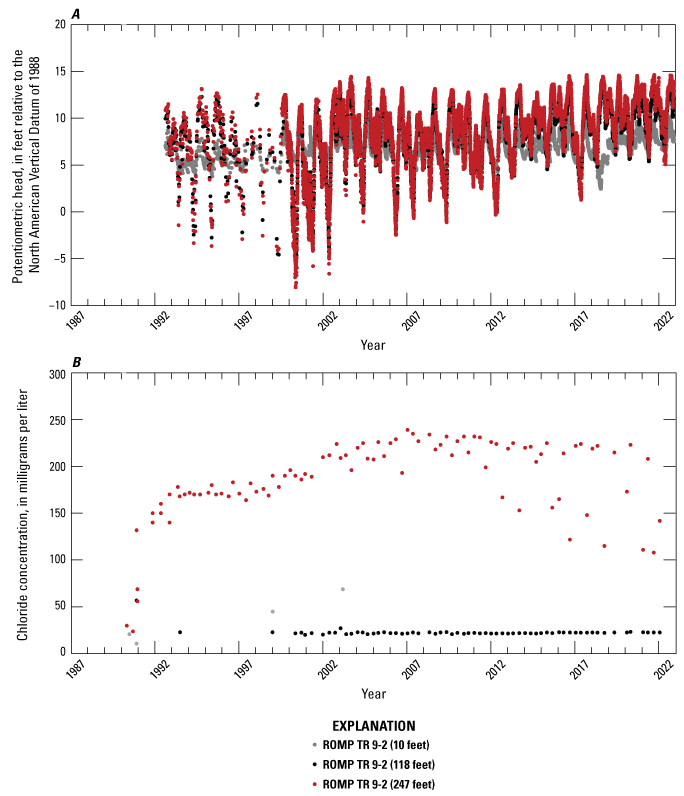
Hydraulic heads and chloride concentrations within the Regional Observation and Monitor-well Program well TR 9-2 (10, 118, and 247 feet deep) (Southwest Florida Water Management District [SWFWMD], 2018b; U.S. Geological Survey [USGS], 2016). Increasing trend indicated in hydraulic heads at depths of 10, 118, and 247 feet (table 18). No trends indicated in chloride concentrations (table 19).
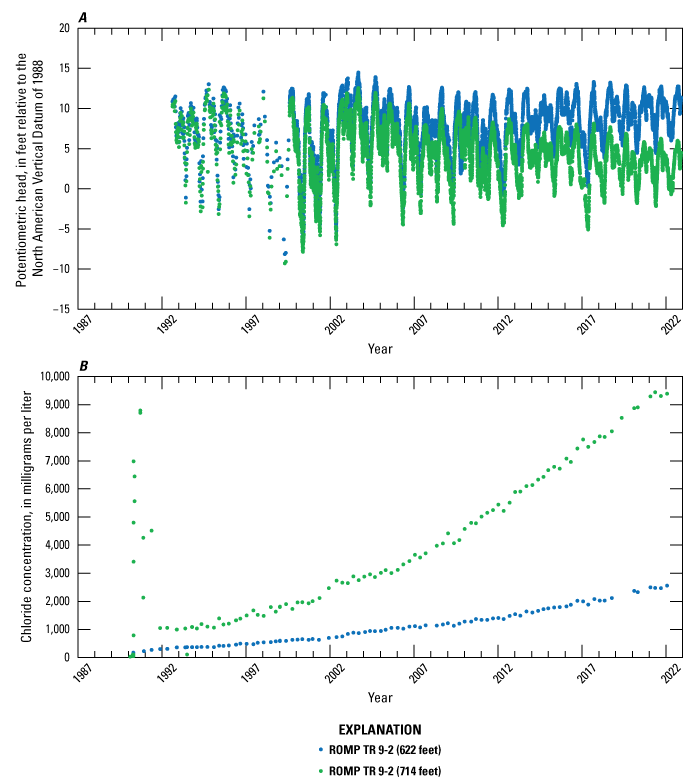
Hydraulic heads and chloride concentrations within the Regional Observation and Monitor-well Program well TR 9-2 (622 and 714 feet deep) (Southwest Florida Water Management District [SWFWMD], 2018b; U.S. Geological Survey [USGS], 2016). Increasing trend indicated in hydraulic heads at a depth of 622 feet (table 18). Decreasing trend indicated in hydraulic heads at a depth of 714 feet. Increasing trend indicated in chloride concentrations at depths of 622 and 714 feet (table 19).
Well TR AB-3 is located approximately 4 mi from the bay and has chloride concentrations measured within the UFA/Avon Park Formation at a single depth of 865 ft with no hydraulic head data (fig. 52, table 19). The mean measured chloride concentrations for 1993–2022 was 3,941 mg/L, and the data indicate an approximately 15-year increasing trend ending in 2008, after which chloride concentrations stabilize at a mean value of 7,900 mg/L. Kendall’s τ and p-values indicated a significant increasing trend in chloride concentration (table 19).
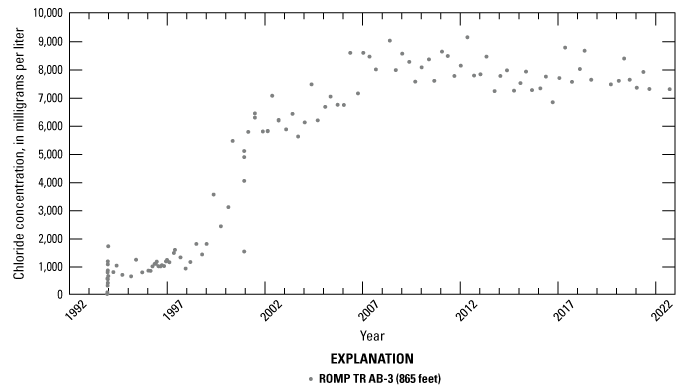
Chloride concentrations within the Regional Observation and Monitor-well Program well TR AB-3 (Southwest Florida Water Management District [SWFWMD], 2018b; U.S. Geological Survey [USGS], 2016). Increasing trend indicated in chloride concentrations at a depth of 865 feet (table 19).
ROMP wells 49, 50, and 51 are located farther east of the bay at approximate distances of 10, 6, and 5 mi from the shoreline, respectively (fig. 22). Well 49 has hydraulic heads measured within the SAS (37-ft depth), UFA/lower Arcadia Formation (230-ft depth), UFA/Suwannee Limestone (410-ft depth), and UFA/Avon Park Formation (792-ft depth) (table 17). The mean hydraulic heads for 1992–2022 measured within the UFA/Suwannee Limestone (410-ft depth) and UFA/Avon Park Formation (792-ft depth) have similar values of 11.67 and 11.50 ft (NAVD 88), respectively (fig. 53, table 18). This similarity suggests these hydrogeologic/geologic unit designations are well-connected. The shallower monitoring well within the SAS (37-ft depth) has a much higher mean hydraulic head of 135.35 ft for this same period, likely because of the higher land surface elevations in the area, 143.1 ft (NAVD 88), and the likelihood of a confining unit beneath (table 17). Well construction logs specify 301.5 ft of UCU/Hawthorn Group between depths of 77.5 and 379 ft, which acts as an effective confining unit between the SAS and deeper aquifer units (Decker, 1989a). The mean hydraulic head within the UFA/lower Arcadia Formation (230-ft depth) for 1991–2022 was 16.20 ft (NAVD 88), which is approximately 5 ft higher than heads within the deeper monitored depths (table 18). This would indicate that the UFA/lower Arcadia Formation and UFA/Suwannee Limestone are not as well-connected as the UFA/Suwannee Limestone and the UFA/Avon Park Formation. There are significant increasing trends in hydraulic head within the UFA/lower Arcadia Formation (230-ft depth), UFA/Suwannee Limestone (410-ft depth), and UFA/Avon Park Formation (792-ft depth) and a decreasing trend within the SAS (37-ft depth).
Chloride concentrations were measured within the UFA/lower Arcadia Formation (230-ft depth) and UFA/Avon Park Formation (792-ft depth). Groundwater within each aquifer unit was fresh, having what appeared to be stable, low chloride levels; however, Kendall’s τ and p-values indicate decreasing chloride concentration trends in both datasets (table 19, fig. 53). The mean measured chloride concentration for 1996–2022 within the UFA/lower Arcadia Formation (230-ft depth) was 5 mg/L (table 19). The mean measured chloride concentration for 1993–2022 for the UFA/Avon Park Formation (792-ft depth) was 14 mg/L.
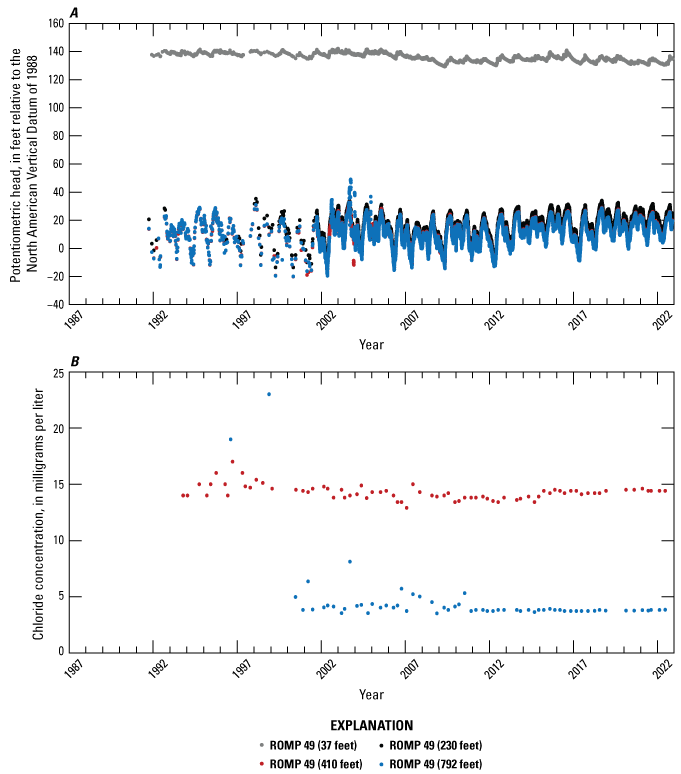
Hydraulic heads and chloride concentrations within the Regional Observation and Monitor-well Program well 49 (Southwest Florida Water Management District [SWFWMD], 2018b; U.S. Geological Survey [USGS], 2016). Decreasing trend indicated in hydraulic heads at a depth of 37 feet (table 18). Increasing trend indicated in hydraulic heads at depths of 230, 410, and 792 feet. Decreasing trend indicated in chloride concentrations at depths of 230 and 792 feet (table 19).
ROMP well 50 has hydraulic heads measured within the SAS (32-ft depth), UFA/Suwannee Limestone (200-ft depth), and UFA/Avon Park Formation (1,393-ft depth) (table 17). The mean hydraulic head within the SAS (32-ft depth) was 41.24 ft (NAVD 88) for 1979–2022, compared to 10.66 and 5.08 ft (NAVD 88) within the UFA/Suwannee Limestone (200-ft depth) and UFA/Avon Park Formation (1,393-ft depth), respectively, for 1985–2022 (table 18). The higher hydraulic heads measured within the SAS are likely due to higher land surface elevations (44-ft depth) and the likelihood of the presence of a confining unit between the SAS and UFA/Suwannee Limestone hydrogeologic/geologic unit designations. Well construction logs describe 83 ft of UCU/Hawthorn Group between depths of 55 and 138 ft, likely resulting in confinement between the SAS and lower aquifer units (SWFWMD, undated e). The hydraulic head data indicate significant increasing trends within the SAS (32-ft depth) and UFA/Suwannee Limestone (200-ft depth) and no significant trends within the UFA/Avon Park Formation (1,393-ft depth) (table 18, fig. 54).
Chloride concentration data from ROMP well 50 indicated fresh groundwater within the SAS (32-ft depth) and UFA/Suwannee Limestone (200-ft depth), having mean chloride concentrations of 54 and 43 mg/L, respectively, and brackish water within the UFA/Avon Park Formation (1,393-ft depth), having a mean chloride concentration of 2,161 mg/L (fig. 54, table 19). The Kendall’s τ and p-values indicate no significant trend in chloride concentration within the UFA/Avon Park Formation (1,393-ft depth) and decreasing trends in the datasets for the shallower depths (SAS and UFA/Suwannee Limestone). There does seem to be an increase in chloride concentration within the UFA/Avon Park Formation (1,393-ft depth) near the beginning of the dataset, despite the lack of a statistically significant long-term trend.
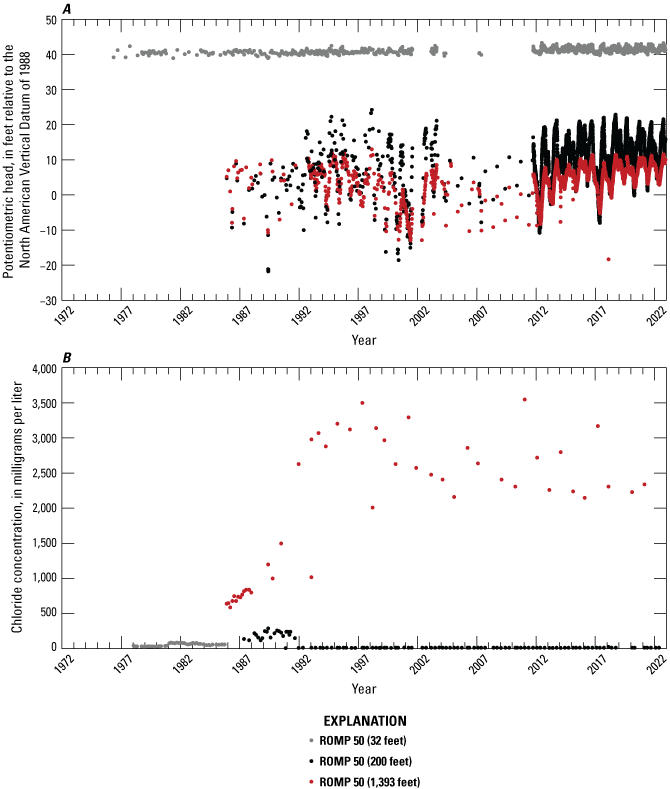
Hydraulic heads and chloride concentrations within the Regional Observation and Monitor-well Program well 50 (Southwest Florida Water Management District [SWFWMD], 2018b; U.S. Geological Survey [USGS], 2016). Increasing trend indicated in hydraulic heads at depths of 32 and 200 feet (table 18). Decreasing trend indicated in chloride concentrations at a depth of 200 feet (table 19).
ROMP well 51 has chloride concentrations measured at a single depth within the UFA/Avon Park Formation (220-ft depth); hydraulic heads were not measured (fig. 55, table 19). The mean measured chloride concentration for 1993–2022 was 31 mg/L, and Kendall’s τ and p-values indicate an increasing trend beginning in 2008. However, the absolute values for measured chloride concentration are still low and indicate fresh groundwater at this depth.
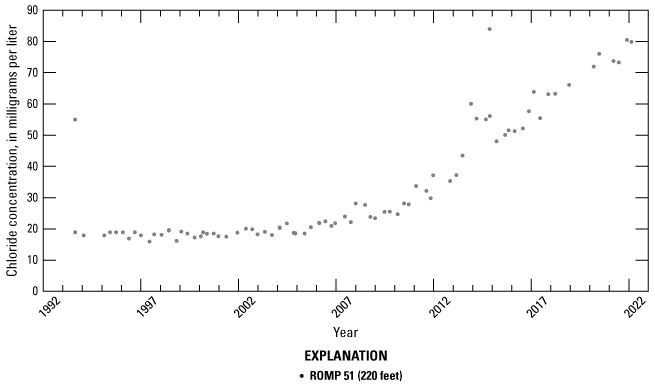
Chloride concentrations within the Regional Observation and Monitor-well Program well 51 (Southwest Florida Water Management District [SWFWMD], 2018b; U.S. Geological Survey [USGS], 2016). Increasing trend indicated in chloride concentrations at a depth of 220 feet (table 19).
ROMP wells TR 8-1, TR 8-2, and 38 are oriented west to east along a transect that extends inland from the shoreline of Tampa Bay (fig. 22). Well TR 8-1 is approximately 2 mi from the bay and has hydraulic heads measured within the SAS (17-ft depth), UFA/upper Arcadia Formation (100-ft depth), UFA/Suwannee Limestone (390-ft depth), UFA/Ocala Limestone (635-ft depth), UFA/Ocala Limestone (900-ft depth), and UFA/Avon Park Formation (1,130-ft depth) (table 17). Hydraulic head data for 1994–2022 have a mean value of 7.37 ft (NAVD 88) within the SAS (17-ft depth) and no significant long-term trends (fig. 56, table 18). There was an upward vertical gradient measured through the first four monitored depths down to the UFA/Ocala Limestone (635-ft depth), indicating artesian pressure and possible confinement between the SAS and lower hydrogeologic/geologic unit designations. Hydraulic head data for 1991–2022 have a mean of 13.56 ft (NAVD 88) within the UFA/upper Arcadia Formation (100-ft depth) and an increasing trend (table 18). The mean hydraulic heads within the UFA/Suwannee Limestone (390-ft depth) and the UFA/Ocala Limestone (635-ft depth) were similar, having values of 16.39 and 16.51 ft (NAVD 88), respectively, suggesting these hydrogeologic/geologic unit designations are well-connected. The vertical gradient below a depth of 635 ft was downward. The mean hydraulic heads within the UFA/Ocala Limestone (900-ft depth) and UFA/Avon Park Formation (1,130-ft depth) for 1992–2022 were 14.23 ft and −6.11 ft (NAVD 88), respectively, suggesting these hydrogeologic/geologic unit designations are not well-connected (UFA/Ocala Limestone and UFA/Avon Park Formation) (fig. 57, table 18). Well construction logs describe 224 ft of the upper part of the UCU/Hawthorn Group between depths of 39 and 263 ft, indicating likely confinement between the SAS and deeper aquifer units (Dewitt, 1992). Well construction logs also describe a likely confining bed separating the upper-middle part of the UFA/Suwannee Limestone from the top of the UFA/Ocala Limestone. Kendall’s τ and p-values indicate a significant increasing trend in hydraulic head data within the UFA/Avon Park Formation (1,130-ft depth) and no significant trend within the UFA/Ocala Limestone at a depth of 900 ft (table 18).
The mean measured chloride concentrations down to a depth of 635 ft indicate fresh groundwater, having values of 82, 101, 136, and 115 mg/L, respectively, within the SAS (17-ft depth), UFA/upper Arcadia Formation (100-ft depth), UFA/Suwannee Limestone (390-ft depth), and UFA/Ocala Limestone (635-ft depth) (table 19). Groundwater at a depth of 900 ft within the UFA/Ocala Limestone had a mean measured chloride concentration of 2,556 mg/L for 1990–2022, indicating brackish water, whereas data from a shorter measurement period (1991–2000) within the UFA/Avon Park Formation (1,130-ft depth) had a mean value of 17,557 mg/L, indicating saline groundwater (fig. 57, table 19). Kendall’s τ and p-values indicate a decreasing trend within the chloride concentration dataset for the UFA/upper Arcadia Formation (100-ft depth), and increasing trends are indicated within the chloride concentration datasets for the UFA/Suwannee Limestone (390-ft depth), UFA/Ocala Limestone (635-ft depth), and UFA/Ocala Limestone (900-ft depth) (fig. 56, table 19).
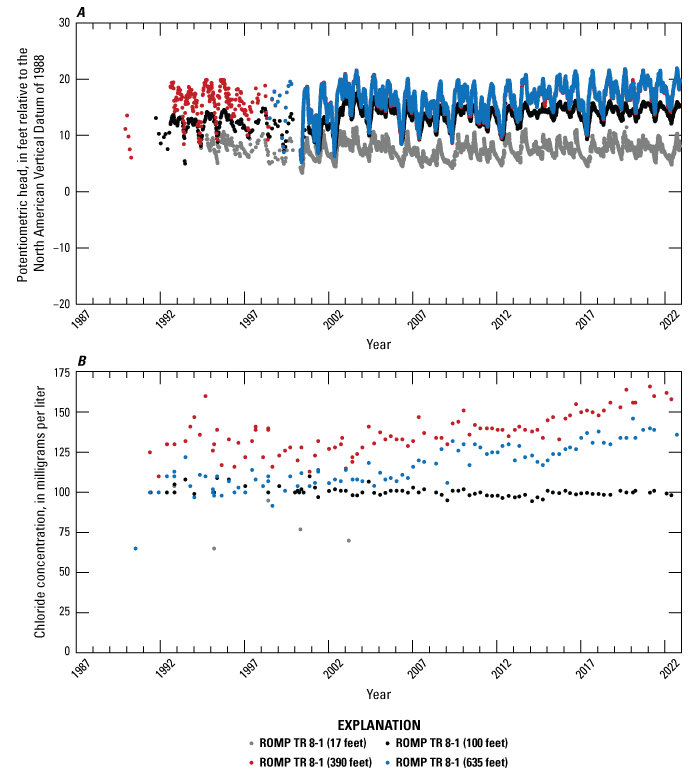
Hydraulic heads and chloride concentrations within the Regional Observation and Monitor-well Program well TR 8-1 (17, 100, 390, and 635 feet deep) (Southwest Florida Water Management District [SWFWMD], 2018b; U.S. Geological Survey [USGS], 2016). Increasing trend indicated in hydraulic heads at depths of 100, 390, and 635 feet (table 18). Decreasing trend indicated in chloride concentrations at a depth of 100 feet (table 19). Increasing trend indicated in chloride concentrations at depths of 390 and 635 feet.
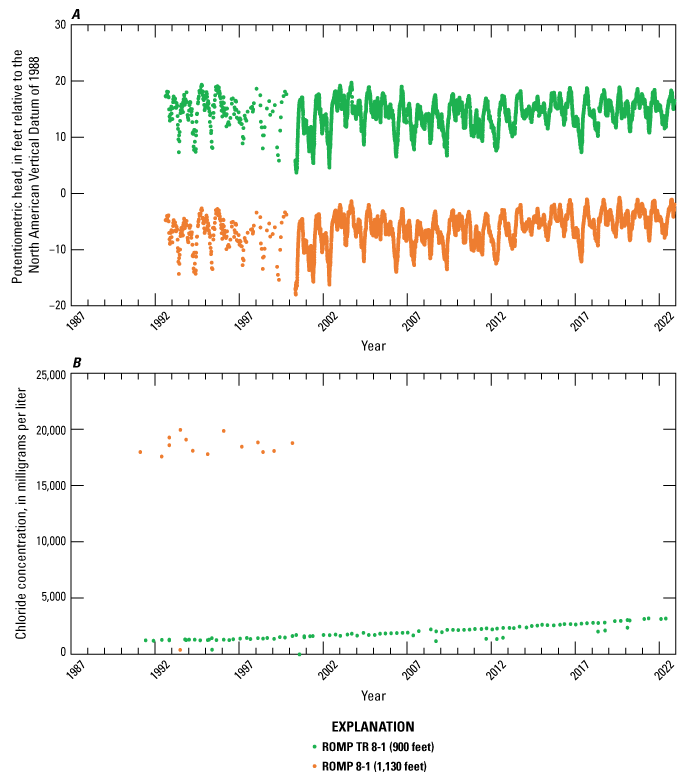
Hydraulic heads and chloride concentrations within the Regional Observation and Monitor-well Program well TR 8-1 (900 and 1,130 feet deep) (Southwest Florida Water Management District [SWFWMD], 2018b; U.S. Geological Survey [USGS], 2016). Increasing trend indicated in hydraulic heads at a depth of 1,130 feet (table 18). Increasing trend indicated in chloride concentrations at a depth of 900 feet (table 19).
ROMP well 8-2 is located approximately 4 mi from the bay and has chloride concentrations measured at a single depth of 917 ft within the UFA/Avon Park Formation; hydraulic heads were not measured (fig. 58, table 19). The mean measured chloride concentration for 1999–2022 was 4,157 mg/L, and Kendall’s τ and p-values for the dataset indicate an increasing trend for the entire period of data collection. The chloride concentrations during this period increase from 1,300 to 6,330 mg/L.
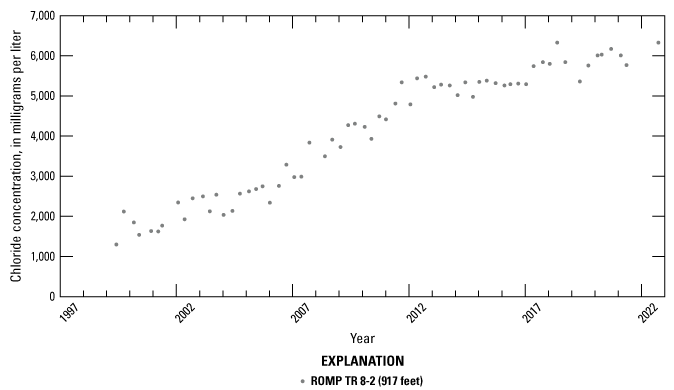
Chloride concentrations within the Regional Observation and Monitor-well Program well TR 8-2 (Southwest Florida Water Management District [SWFWMD], 2018b; U.S. Geological Survey [USGS], 2016). Increasing trend indicated in chloride concentrations at a depth of 917 feet (table 19).
ROMP well 38 is located approximately 8 mi from the bay and has hydraulic heads measured within the SAS (2-ft depth), SAS (10-ft depth), UFA/Suwannee Limestone (425-ft depth), and UFA/Avon Park Formation (1,100-ft depth) (fig. 22, table 17). The mean measured hydraulic heads within the two SAS wells (2- and 10-ft depths) are similar, having values of 32.11 and 31.89 ft (NAVD 88) for 2014–22, respectively (fig. 59, table 18). This is not unexpected considering the similar monitoring depths within the SAS. The mean measured hydraulic heads within the UFA/Suwannee Limestone (425-ft depth) and UFA/Avon Park Formation (1,100-ft depth) are also like each other but lower than those in the SAS, having values of 12.35 and 12.24 ft (NAVD 88), respectively, suggesting the UFA/Suwannee Limestone and UFA/Avon Park Formation are well-connected. The higher hydraulic heads within the SAS are likely due to the higher land surface elevation (about 34-ft depth) at the well (table 17) and the SAS and UFA/Suwannee Limestone hydrogeologic/geologic unit designations not being well-connected. Well construction logs describe two confining units between the SAS and UFA/Suwannee Limestone (Mallams, 2023). The first is 67 ft thick and lies between depths of 40 and 107 ft, and the second is 80 ft thick and lies between depths of 260 and 340 ft. Kendall’s τ and p-values indicate significant decreasing trends in hydraulic head within the SAS (2- and 10-ft depths) and increasing trends within the UFA/Suwannee Limestone (425-ft depth) and UFA/Avon Park Formation (1,100-ft depth).
Chloride concentrations are only measured within the UFA/Avon Park Formation (1,100-ft depth), and the mean value of 73 mg/L for 2017–22 indicates fresh groundwater (table 19). There is an increasing trend in the chloride concentration data within the UFA/Avon Park Formation (1,100-ft depth); however, the concentration values are low and these data were only collected for 6 years (fig. 59).
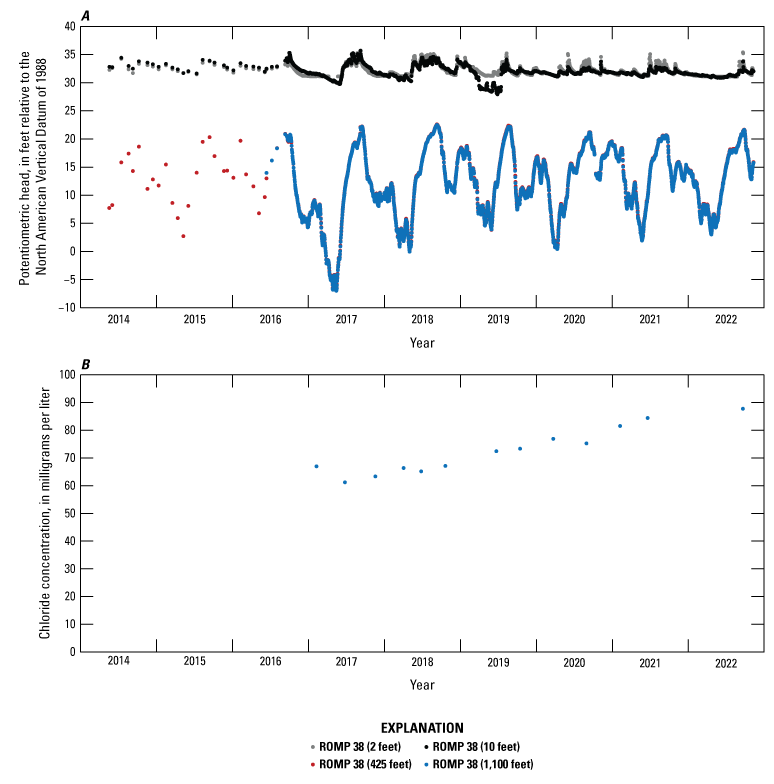
Hydraulic heads and chloride concentrations within the Regional Observation and Monitor-well Program well 38 (Southwest Florida Water Management District [SWFWMD], 2018b; U.S. Geological Survey [USGS], 2016). Decreasing trend indicated in hydraulic heads at depths of 2 and 10 feet (table 18). Increasing trend indicated in chloride concentrations at a depth of 1,100 feet (table 19).
In summary, wells on the eastern coast of Tampa Bay generally had higher hydraulic heads within the shallower groundwater aquifer units than the lower units because of the higher land-surface elevations within the area and the presence of confining units. Trends in hydraulic head were generally upward. This area has a broad cone of depression whose surface elevation has risen from below sea level during 1978–2011 (figs. 17–20) to above sea level in 2019 (fig. 21). Upward trends in hydraulic head generally were observed, particularly at shallower depths. Chloride concentrations were generally in the range of freshwater except at deeper levels within the UFA/Avon Park Formation (monitored as deep as 1,393 ft below land surface), which were in the range of brackish water.
Groundwater Monitoring Wells Along the Southern Coast of Tampa Bay
Six wells within 5.5 mi of the southern coast of Tampa Bay (fig. 22, table 20) were analyzed for trends in hydraulic head and chloride concentration. ROMP wells TR 7-1, TR 7-2, and TR 7-4 are oriented west to east along a transect south of Tampa Bay that extends inland from the shoreline of the Gulf of Mexico (fig. 22). ROMP well TR 7-1 is located less than 0.5 mi from the shoreline and has hydraulic heads measured at a single depth within the UFA/lower Arcadia Formation (320-ft depth). The mean hydraulic head was 17.34 ft (NAVD 88) for 1983–2022, indicating artesian pressure and likely confinement, with a land-surface elevation of 7.6 ft (NAVD 88) at the well site (fig. 60, tables 20 and 21). Well construction logs describe a multizoned artesian system, with the first zone present between depths of 45 and 140 ft and the second zone present between depths of 240 and 380 ft (New, 1981). The top of the first confining unit is specified to begin at a depth range of approximately 20–25 ft, with the second unit described as existing between the two artesian zones. Kendall’s τ and p-values for the dataset indicate no significant trend in hydraulic head (table 21). Chloride concentration data indicate fresh groundwater having a mean value of 88 mg/L for 1981–2022, and Kendall’s τ and p-values indicate no significant trend (table 22).
Table 20.
Summary of Regional Observation and Monitor-well Program groundwater monitoring wells of interest along the southern coast of Tampa Bay (Southwest Florida Water Management District [SWFWMD], 2018b; U.S. Geological Survey [USGS], 2016).[Monitoring wells shown in figure 22. Horizontal coordinate information is referenced to the North American Datum of 1983 (NAD 83). ROMP, Regional Observation and Monitor-well Program; ft, foot; deg, degrees; min, minutes; sec, seconds; NAVD 88, North American Vertical Datum of 1988; UFA, Upper Floridan aquifer; lower Arcadia Formation, lower part of the Arcadia Formation of the Hawthorn Group, SAS, surficial aquifer system; UCU, upper confining unit; upper Arcadia Formation, upper part of the Arcadia Formation of the Hawthorn Group; Tampa Member, Tampa Member of the Arcadia Formation; -, no data]
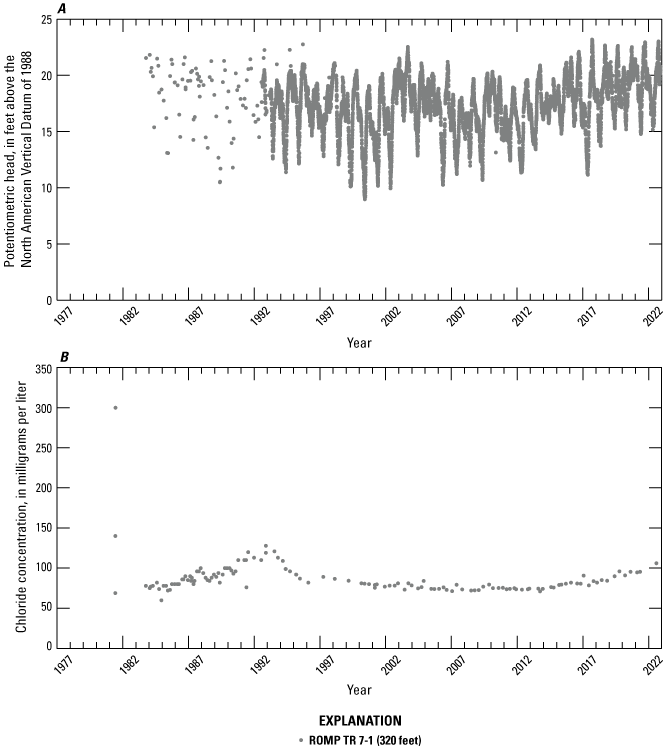
Hydraulic heads and chloride concentrations within the Regional Observation and Monitor-well Program well TR 7-1 (Southwest Florida Water Management District [SWFWMD], 2018b; U.S. Geological Survey [USGS], 2016). No trends indicated in hydraulic head or chloride concentration data (tables 21 and 22).
Table 21.
Summary of hydraulic head data from Regional Observation and Monitor-well Program groundwater-monitoring wells of interest along the southern coast of Tampa Bay (Southwest Florida Water Management District [SWFWMD], 2018b; U.S. Geological Survey [USGS], 2016).[Monitoring wells shown in figure 22. Dates shown as month, day, year. ROMP, Regional Observation and Monitor-well Program; ft, foot; NAVD 88, North American Vertical Datum of 1988; Kendall’s τ, Kendall’s tau; -, no data]
Table 22.
Summary of chloride concentration data from Regional Observation and Monitor-well Program groundwater monitoring wells of interest along the southern coast of Tampa Bay (Southwest Florida Water Management District [SWFWMD], 2018b; U.S. Geological Survey [USGS], 2016).[Monitoring wells shown in figure 22. Dates shown as month, day, year. ROMP, Regional Observation and Monitor-well Program; ft, foot; mg/L, milligram per liter; -, no data]
ROMP well TR 7-2 is located approximately 3 mi from the bay and has hydraulic heads measured within the SAS (12-ft depth), UCU/Hawthorn Group (57-ft depth), UFA/upper Arcadia Formation (198-ft depth), UFA/Tampa Member (358-ft depth), and UFA/Avon Park Formation (957-ft depth) (table 20). The mean hydraulic heads for 1994–2022 within the SAS (12-ft depth), UCU/Hawthorn Group (57-ft depth), and the UFA/upper Arcadia Formation (198-ft depth) have similar values of 14.43, 13.92, and 14.88 ft (NAVD 88), respectively (fig. 61, table 21). Well construction logs describe an upper confining unit and semiconfining beds between depths of 21 and 155 ft and a lower confining unit between depths of 310 and 332 ft (Rappuhn, 1995). Below 332 ft lies the FAS, which in this area, includes the Tampa Member of the Arcadia Formation. Kendall’s τ and p-values for the datasets indicate an increasing trend in hydraulic head within the UFA/upper Arcadia Formation (198-ft depth) and no significant trends within the SAS (12-ft depth) and UCU/Hawthorn Group (57-ft depth) (table 21). Kendall’s τ and p-values for the datasets indicate an increasing trend in hydraulic head within the UFA/Tampa Member (358-ft depth) and UFA/Avon Park Formation (957-ft depth) beginning in approximately 2012. The mean measured hydraulic heads within the UFA/Tampa Member (358-ft depth) and UFA/Avon Park Formation (957-ft depth) were higher than at the shallower depths and similar to each another, with values of 16.38 and 16.67 ft (NAVD 88), respectively (fig. 62, table 21). This similarity suggests the UFA/Tampa Member and UFA/Avon Park Formation are well-connected, whereas the UFA/Tampa Member is not well-connected to the shallower units.
Mean chloride concentrations within well TR 7-2 indicate fresh groundwater within the SAS (12-ft depth), UCU/Hawthorn Group (57-ft depth), UFA/upper Arcadia Formation (198-ft depth), and UFA/Tampa Member, having values of 106, 78, 53, and 127 mg/L, respectively, during 1992–2022 (table 22). Kendall’s τ and p-values for datasets of chloride concentration indicate an increasing trend within the UCU/Hawthorn Group (57-ft depth) and a decreasing trend within the UFA/upper Arcadia Formation (198-ft depth). Chloride concentrations within the UFA/Avon Park Formation (957-ft depth) had a mean value of 2,008 mg/L for all values within the dataset; however, the data included 18 measurements above 5,000 mg/L, including 14 above 10,000 mg/L (table 22). These higher values are more than an order of magnitude above adjacent measurements within the dataset. If these values are excluded from the calculation, the mean chloride concentration is 453 mg/L. Kendall’s τ and p-values indicate a decreasing trend in chloride concentration within UFA/Tampa Member (358-ft depth) and an increasing trend within the UFA/Avon Park Formation (957-ft depth).
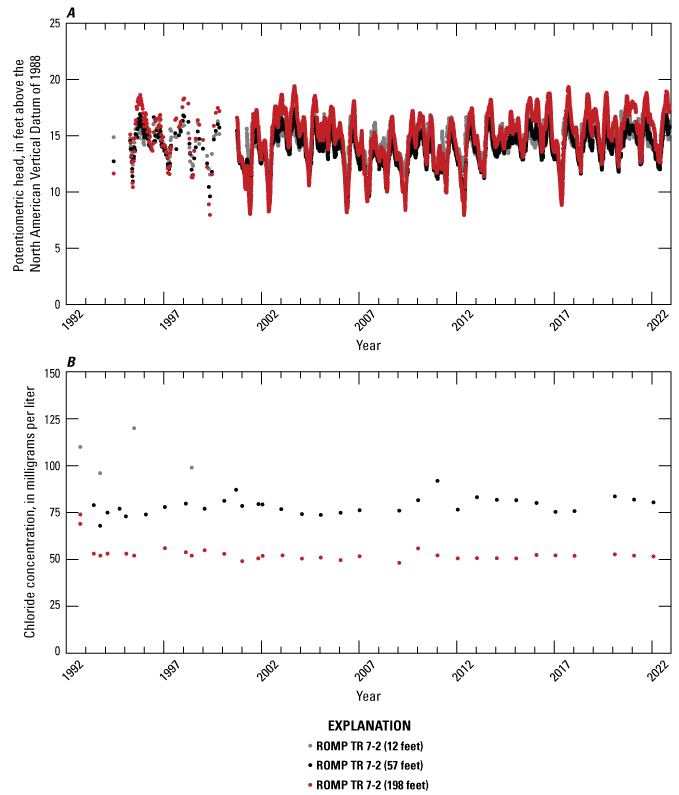
Hydraulic heads and chloride concentrations within the Regional Observation and Monitor-well Program well TR 7-2 (12, 57, and 198 feet deep) (Southwest Florida Water Management District [SWFWMD], 2018b; U.S. Geological Survey [USGS], 2016). Increasing trend indicated in hydraulic heads at a depth of 198 feet (table 21). Increasing trend indicated in chloride concentrations at a depth of 57 feet. Decreasing trend indicated in chloride concentrations at a depth of 198 feet (table 22).
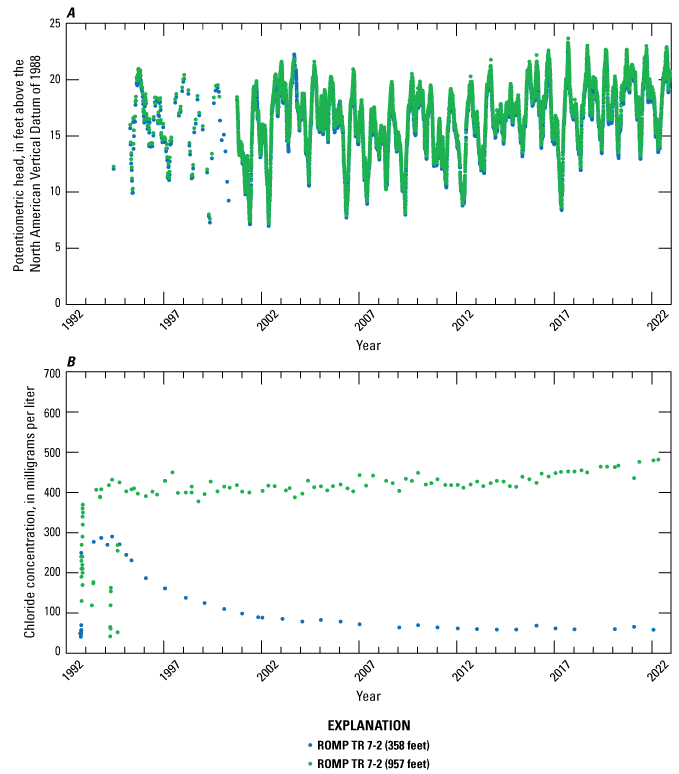
Hydraulic heads and chloride concentrations within the Regional Observation and Monitor-well Program well TR 7-2 (358 and 957 feet deep) (Southwest Florida Water Management District [SWFWMD], 2018b; U.S. Geological Survey [USGS], 2016). Increasing trend indicated in hydraulic heads at depths of 358 and 957 feet (table 21). Decreasing trend indicated in chloride concentrations at a depth of 358 feet (table 22). Increasing trend indicated in chloride concentrations at a depth of 957 feet.
ROMP well TR 7-4 is located approximately 5.5 mi east of the Tampa Bay shoreline and has hydraulic heads measured within the SAS (15-ft depth), UFA/lower Arcadia Formation (213-ft depth), UFA/Tampa Member (377-ft depth), UFA/Suwannee Limestone (560-ft depth), and UFA/Avon Park Formation (1,162-ft depth) (table 20). Measured hydraulic heads within the SAS (15-ft depth) had a mean value of 6.12 ft (NAVD 88) for 1988–2022 and a significant increasing trend (fig. 63, table 21). The measured hydraulic heads within the UFA/lower Arcadia Formation (213-ft depth) were lower than those within the SAS, having a mean value of −3.84 ft (NAVD 88) for 1988–2022 and a significant decreasing trend. Prior to 2006, hydraulic heads within the UFA/lower Arcadia Formation (213-ft depth) were generally higher than those within the SAS (15-ft depth). After 2006, the hydraulic heads within the UFA/lower Arcadia Formation were generally lower than those within the SAS (fig. 63, table 21). After 2019, hydraulic heads within the UFA/lower Arcadia Formation were as low as −90 ft (NAVD 88) during some periods. The changes in hydraulic head at well TR 7-4 after 2006 and again after 2019 indicate changes to the stresses on the system. The differences in hydraulic head and responses within the data indicate the SAS (15-ft depth) and UFA/lower Arcadia Formation (213-ft depth) are not well-connected. Well construction logs describe the presence of 356 ft of UCU/Hawthorn Group between depths of 18 and 374 ft, which effectively acts as a confining unit (Decker, 1989b).
Hydraulic heads deeper within the aquifer at well TR 7-4 are generally higher than those within the SAS and UFA/lower Arcadia Formation. The mean measured hydraulic heads were 14.16, 14.11, and 12.51 ft (NAVD 88) within the UFA/Tampa Member (377-ft depth), UFA/Suwannee Limestone (560-ft depth), and the UFA/Avon Park Formation (1,162-ft depth) (fig. 64, table 21). The similarity in heads within the UFA/Tampa Member and UFA/Suwannee Limestone and difference between both and heads within the UFA/Avon Park Formation suggest the UFA/Tampa Member and UFA/Suwannee Limestone are well-connected and the UFA/Suwannee Limestone and deeper UFA/Avon Park Formation are not well-connected. Kendall’s τ and p-values for the hydraulic head data within the UFA/Tampa Member (377-ft depth) and UFA/Suwannee Limestone (560-ft depth) indicate increasing trends that are visible after approximately 2012 (fig. 64, table 21). Kendall’s τ and p-values for the hydraulic head data within the UFA/Avon Park Formation (1,162-ft depth) indicate no significant trend.
Chloride concentration data collected at all but the deepest depth at ROMP well TR 7-4 indicate fresh groundwater having mean values of 32, 32, 28, and 47 mg/L within the SAS (15-ft depth), UFA/lower Arcadia Formation (213-ft depth), UFA/Tampa Member (377-ft depth), and UFA/Suwannee Limestone (560-ft depth), respectively (table 22). Kendall’s τ and p-values indicate a significant decreasing trend in chloride concentration within the UFA/lower Arcadia Formation (213-ft depth), with freshening occurring from 1995 to approximately 2008. Kendall’s τ and p-values for the data indicate an increasing trend in chloride concentration within the UFA/Suwannee Limestone (560-ft depth) and no significant trend within the UFA/Tampa Member (377-ft depth). Kendall’s τ and p-values indicated an increasing trend in chloride concentration within the UFA/Avon Park Formation (1,162-ft depth) with a transition to brackish sometime after 2015 and a mean value of 634 mg/L for 1991–2022 (fig. 64, table 22).
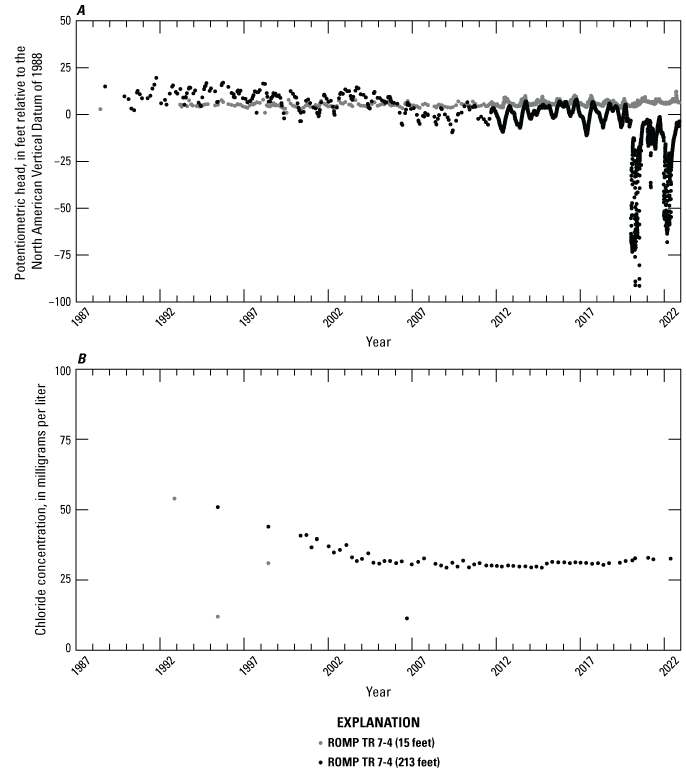
Hydraulic heads and chloride concentrations within the Regional Observation and Monitor-well Program well TR 7-4 (15, 213, and 377 feet deep) (Southwest Florida Water Management District [SWFWMD], 2018b; U.S. Geological Survey [USGS], 2016). Increasing trend indicated in hydraulic heads at depths of 15 and 377 feet (table 21). Decreasing trend indicated in chloride concentrations at a depth of 213 feet (table 22). Increasing trend indicated in chloride concentrations at a depth of 377 feet.
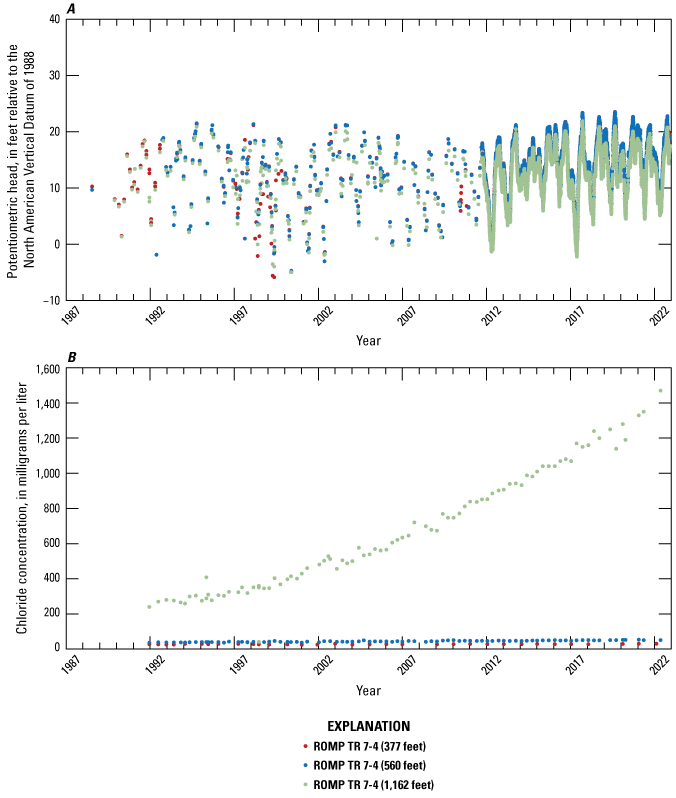
Hydraulic heads and chloride concentrations within the Regional Observation and Monitor-well Program well TR 7-4 (560 and 1,162 feet deep) (Southwest Florida Water Management District [SWFWMD], 2018b; U.S. Geological Survey [USGS], 2016). Increasing trend indicated in hydraulic heads at a depth of 560 feet (table 21). Increasing trend indicated in chloride concentrations at depths of 560 and 1,162 feet (table 22).
ROMP wells TR SA-1 and TR SA-3 are located farther south along the gulf coast than TR 7-1, TR 7-2, and TR 7-4 (fig. 22). Well TR SA-1 is less than 0.3 mi from the bay and has hydraulic heads measured within the SAS (4-ft depth), UFA/lower Arcadia Formation (328-ft depth), UFA/Suwannee Limestone (708-ft depth), and UFA/Avon Park Formation (995-ft depth). During 1998–2022, mean hydraulic heads had an upward gradient, with values of 1.66, 4.95, 9.78, and 17.04 ft (NAVD 88) within the SAS (4-ft depth), UFA/lower Arcadia Formation (328-ft depth), UFA/Suwannee Limestone (708-ft depth), and UFA/Avon Park Formation (995-ft depth), respectively (fig. 65, table 21). With a land-surface elevation of 6.0 ft at TR-SA1, the mean hydraulic head values indicate artesian pressure within the UFA/Suwannee Limestone and UFA/Avon Park Formation and the likely presence of one or more confining units between the UFA/Suwannee Limestone and the shallower units. Well construction logs describe the presence of approximately 469 ft of UCU or IAS/ICU between depths of 29 and 498 ft (Lee, 1998). Additionally, Lee (1998) noted that the Ocala Limestone is considered to be a semiconfining unit separating the permeable beds of the Suwannee Limestone and Avon Park Formation. Kendall’s τ and p-values for the hydraulic head data within the SAS (4-ft depth) and UFA/Suwannee Limestone (708-ft depth) do not indicate any significant trends for 1998–2022 (table 21). Kendall’s τ and p-values for the measured hydraulic head data within the UFA/Avon Park Formation (995-ft depth) indicate an increasing trend, whereas the Kendall’s τ and p-values for hydraulic head data collected within UFA/lower Arcadia Formation (328-ft depth) indicate a decreasing trend.
Kendall’s τ and p-values for chloride concentration data from ROMP well TR SA-1 indicate increasing trends within the UFA/Suwannee Limestone (708-ft depth) and UFA/Avon Park Formation (995-ft depth), having mean values of 1,105 and 773 mg/L, respectively (tables 22 and 20). The mean value of 773 mg/L within the UFA/Avon Park Formation is skewed by four measurements above 1,000 mg/L, one of which is over 17,000 mg/L. If these outliers are excluded from the calculation of the mean, the mean concentration would be 501 mg/L. The chloride concentrations within the SAS (4-ft depth) and UFA/lower Arcadia Formation (328-ft depth) indicate fresh groundwater at these depths, having mean values of 604 and 182 mg/L, respectively, and Kendall’s τ and p-values indicate no significant trends.
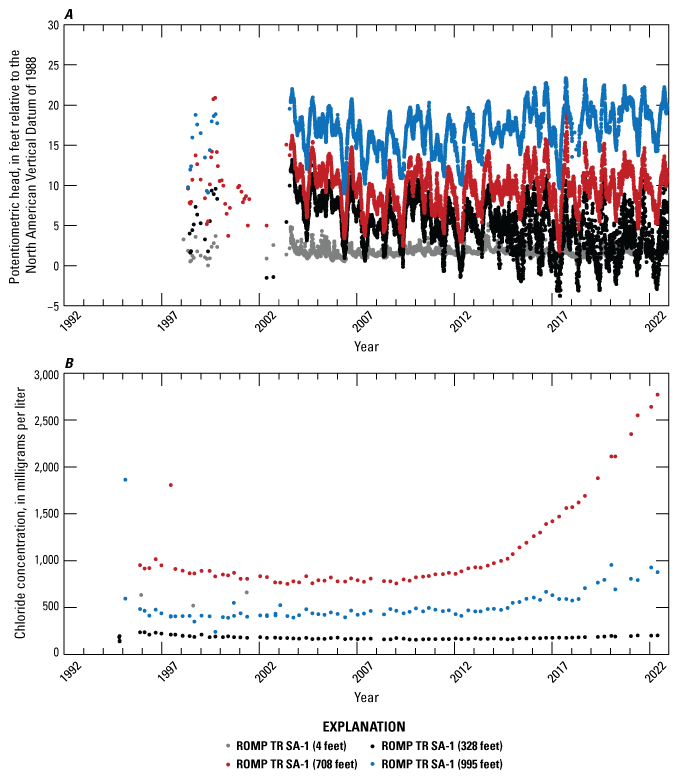
Hydraulic heads and chloride concentrations within the Regional Observation and Monitor-well Program well TR SA-1 (Southwest Florida Water Management District [SWFWMD], 2018b; U.S. Geological Survey [USGS], 2016). Decreasing trend indicated in hydraulic heads at a depth of 328 feet (table 21). Increasing trend indicated in hydraulic heads at a depth of 995 feet. Increasing trend indicated in chloride concentrations at depths of 708 and 995 feet (table 22).
ROMP well TR SA-3 is located approximately 2.5 mi from the Tampa Bay shoreline and has groundwater and chloride concentrations measured at a single depth of 1,096 ft within the UFA/Avon Park Formation (fig. 22, table 20). The mean hydraulic head and chloride concentration for 1998–2022 at this depth were 17.72 ft (NAVD 88) and 264 mg/L, respectively (fig. 66, tables 21 and 22). Kendall’s τ and p-values for the hydraulic head data indicate an increasing trend, with the final yearly average being 5.5 ft higher than the average during the first year (table 21). Kendall’s τ and p-values for the chloride concentration data indicate an increasing trend for the measurement period (table 22).
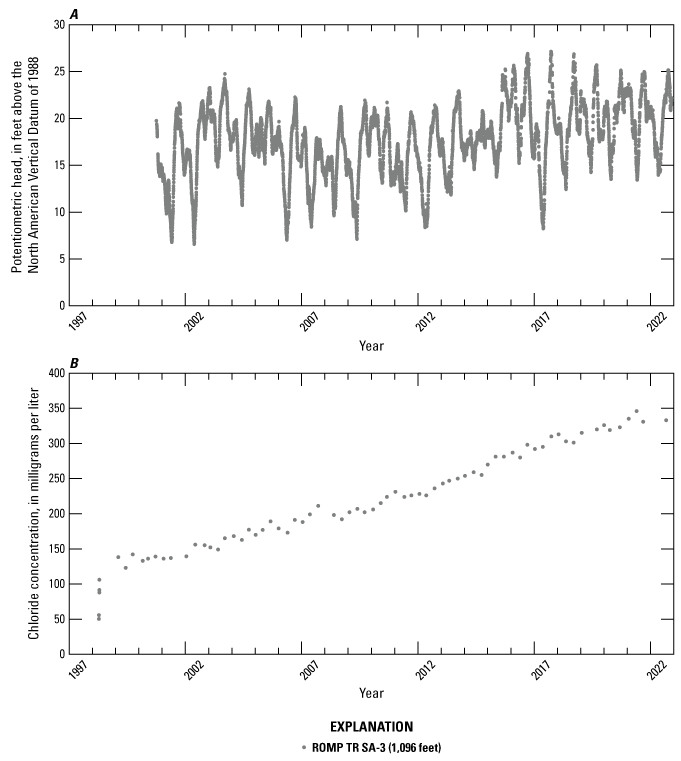
Hydraulic heads and chloride concentrations within the Regional Observation and Monitor-well Program well TR SA-3 (Southwest Florida Water Management District [SWFWMD], 2018b; U.S. Geological Survey [USGS], 2016). Increasing trend indicated in hydraulic heads and chloride concentrations at a depth of 1,096 feet (tables 21 and 22).
ROMP well TR 6-1 is located approximately 0.3 mi from the Tampa Bay shoreline and has groundwater and chloride concentrations measured at a single depth of 315 ft within the UFA/lower Arcadia Formation (fig. 22, table 20). Despite not having water levels monitored at multiple depths, four major water-level changes were described in the well construction report for this site (SWFWMD, undated f). Water under artesian pressure was first encountered within the Tamiami Formation at a depth of approximately 40 ft, with hydraulic heads approximately 2.8 ft above the land surface elevation of 4.2 ft (NAVD 88) at the well site. A second artesian zone was encountered within the upper part of the UCU/Hawthorn Group at a depth of approximately 90 ft, with hydraulic heads approximately 2 ft above land-surface elevation. A third artesian zone was encountered within an unspecified formation at a depth of approximately 225 ft with hydraulic heads approximately 4.5 ft above land-surface elevation. A fourth artesian zone was encountered within the UFA/Suwannee Limestone at an approximate depth of 520 ft, with hydraulic heads approximately 13.5 ft above land-surface elevation. The mean hydraulic head and chloride concentration for 1979–2022 at this depth were 4.17 ft (NAVD 88) and 480 mg/L (fig. 67, tables 21 and 22). Kendall’s τ and p-values for the hydraulic head data indicate a decreasing trend that is visible across the entire measurement period (table 21). Kendall’s τ and p-values for the chloride concentration data indicate a significant increasing trend, with a visible period of approximately 10 years, in the beginning of the measurement period followed by a relatively stable period (fig. 67, table 22).
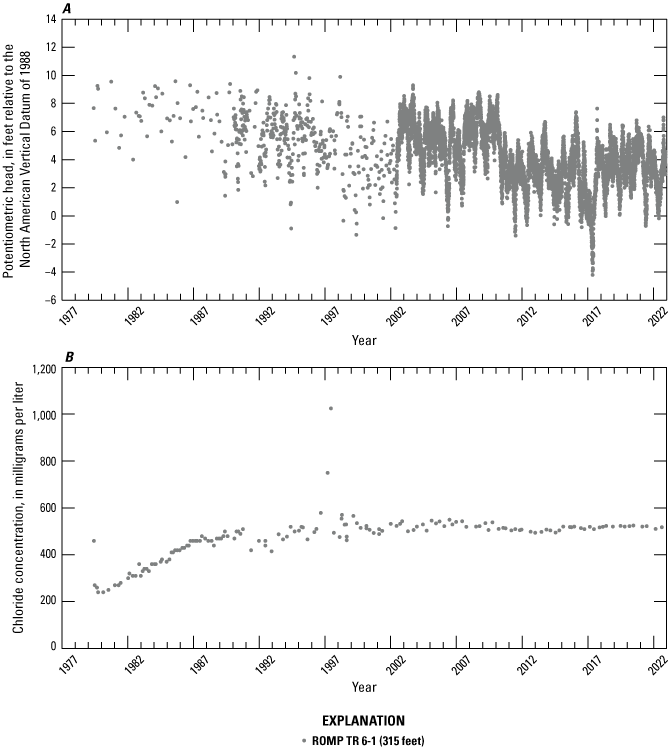
Hydraulic heads and chloride concentrations within the Regional Observation and Monitor-well Program well TR 6-1 (Southwest Florida Water Management District [SWFWMD], 2018b; U.S. Geological Survey [USGS], 2016). Decreasing trend indicated in hydraulic heads at a depth of 315 feet (table 21).
In summary, wells along the southern coast of Tampa Bay have upward water-level trends at deeper depths (TR 7-2, TR 7-4), but have exhibited responses to hydrologic stress where potentiometric levels have dropped to as low as −90 ft (NAVD 88) and recovered since 2019. The causes of the rapid changes have not been identified; however, these changes illustrate the potential sensitivity of karst groundwater systems.
Data Analysis Summary
Generally, there are three hydrostratigraphic units within the Tampa Bay region: the SAS, the UCU, and the underlying FAS. The UCU is neither continuous nor present in all parts of the study area; where the UCU is absent, either the SAS is in direct contact with the FAS, resulting in a strong hydraulic connection, or the SAS is also absent and the FAS is directly exposed, resulting in areas where the FAS is unconfined. The FAS consists of the UFA, Middle Avon Park composite unit, and LFA. Increasing the physical dimensions of the navigational channels within Tampa Bay through dredging could increase the area where exposure of the UFA to saline bay water already exists, could expose new areas of the UFA to saline bay water, or cause breaches in the underlying karst features. In areas where hydraulic heads within the UFA are higher than mean tidal levels within the bay, increased hydraulic connectivity would likely result in increased groundwater discharge to the bay and reduced hydraulic head within the UFA. In areas where the hydraulic head within the UFA is lower than mean tidal levels within the bay, the increased hydraulic connectivity would likely result in increased downward flow of saline bay water into the UFA and increased hydraulic head within the UFA. The increased flow of saline water into the UFA could lead to increased saltwater intrusion.
The estimated predevelopment potentiometric surface map of the area surrounding Tampa Bay shows hydraulic heads within the FAS that generally decrease from inland areas westward toward the shoreline of the Gulf of Mexico or Tampa Bay. Predevelopment hydraulic head under the bay was higher than the mean tidal level, indicating the FAS would naturally discharge to the bay where exposed. Further exposure of areas of the FAS directly to the bay in this hydrologic setting would likely increase groundwater discharge to the bay and could decrease potentiometric gradients.
The UFA is the primary source of public-supply and agricultural withdrawals in the Tampa Bay region. Cones of depression are present within the water table and potentiometric surface because of groundwater withdrawals. Three areas exhibiting cones of depression were noted by Hutchinson (1983) in the potentiometric surface map of the FAS for May 1978. These cones of depression were attributed to water withdrawals for industrial water uses, public supply, and agriculture. One of these depressions was near an industrial groundwater withdrawal location along the eastern shoreline of Tampa Bay and was a cause for concern when examining the effects of modifications to the navigational channels within the bay in the early 1980s. Groundwater levels within the area of this depression were well below mean tidal levels, likely indicating downward leakage of water from the bay into the FAS. Withdrawals at this site ceased between 1980 and 1985, resulting in the recovery of groundwater levels to values higher than mean tidal levels (figs. 16–19, table 3). The groundwater withdrawals for public supply peaked in 2000, then in subsequent years dropped below those for 1985 (fig. 6). The groundwater withdrawals for agricultural purposes peaked in 1985 and have been reduced substantially since 2000 (fig. 7). The downward trend in groundwater withdrawals has reduced the size of the cones of depression in the potentiometric surface maps; compared to maps before 1985, potentiometric surface maps for 2011 (fig. 20) and 2019 (fig. 21) have less pronounced cones of depression attributed to public-supply and agricultural withdrawals and no longer display the depression attributed to the industrial pumping center that ceased extractions (figs. 20 and 21). The contour maps for 2011 and 2019 show water levels within the FAS above or near mean tidal levels, indicating a reduced likelihood for net downward leakage from the bay.
The measured tidal levels in Saint Petersburg, Fla., indicated an approximate 0.56-ft increase in sea level from 1986 to 2022. Sea-level rise is likely to continue, and projected increases for the Tampa Bay region range from 1.9 ft to as much as 8.5 ft by 2100, with a more likely intermediate projection of 3.9 ft (TBCSAP, 2019). Rising sea level can decrease shoreward potentiometric gradients in a groundwater system that can result in the inland encroachment and widening of the saltwater front.
Variations in rainfall and evapotranspiration can result in year-to-year changes in the potentiometric surface in the area surrounding the bay. Years with higher total rainfall will likely be characterized by higher potentiometric surfaces inland and increased coastward gradients compared to years with lower total rainfall. The differences could result in fluctuations between upward discharge from the aquifer into the bay during wet years and downward leakage from the bay into the aquifer during dry years. The 37-year period from 1986 to 2022, following the last major channel modifications completed in the mid-1980s, had a mean yearly rainfall total 4.3 percent less than that of the prior 37-year period, 54.2 in. compared to 51.9 in. There was less variation in evapotranspiration during the period of record.
Hydraulic head measurements were used to infer whether the hydrogeologic/geologic unit designations are hydraulically well-connected at locations having multiple monitored depths. Similarities in magnitude and responses to changes in hydrologic stresses suggest the likelihood of adjacent aquifer units being hydraulically well-connected without the presence of a confining unit between them. Differences in magnitude and responses to changes in hydrologic stresses suggest adjacent aquifer units are not hydraulically well-connected, with a confining unit likely present between them. The connection between the SAS and UFA would likely be influenced the most by additional dredging. If dredging were to significantly thin or breach a confining unit, the resulting effects would likely be indicated by an increased hydraulic connection in the area. In the area north of Tampa Bay, the SAS and underlying UFA appeared to be well-connected at two locations having available data: TR 16-3 and TR 16-4 (tables 11–13). In the area along the northern coast of Tampa Bay, the results were mixed, with the SAS and UFA appearing well-connected at TR 14-1, TR 12-1, and TR 13-3; and appearing to be not well-connected at TR 14-2, TR 14-3, TR 13-1X, TR 13-2X, TR 10-2, and 62 (tables 14–16). The SAS and UFA appeared to not be well-connected along the eastern coast of Tampa Bay at locations having multiple monitored depths: TR 9-3, TR 9-2, 49, 50, TR 8-1, and 38 (tables 17–19). In the area along the southern coast of Tampa Bay, the datasets for two locations (TR 7-4 and TR SA-1) suggested the SAS and the underlying LA and UFA units were not well-connected, and the datasets for the other location with multiple monitored depths (TR 7-2) suggested the SAS and underlying Hawthorn Group and LA were well-connected, but not well-connected to the UFA below those units (tables 20–22).
Seven wells (TR 13-3, TR 11-2, TR 10-2, TR 9-1, TR 9-3, 50, and 51) located along the northern and eastern coast of Tampa Bay, where the effects of channel modifications on the groundwater chloride concentrations would likely be most evident had available datasets covering the periods before and after the last major channel modifications completed in the mid-1980s (tables 11–22). Six chloride concentration datasets were available from these seven wells. Kendall’s τ and p-values for three datasets indicate increasing trends within the UFA/Suwannee Limestone (TR 11-2), UFA/Tampa Member Formation (TR 10-2), and UFA/Avon Park Formation (51). Kendall’s τ and p-values for two chloride concentration datasets indicate no significant trend within the SAS (TR 9-3 and 50), and Kendall’s τ and p-values for one chloride concentration dataset indicate a decreasing trend within the UFA/Tampa Member (TR 9-1). The trends in hydraulic head within the wells along the northern and eastern coast of Tampa Bay were more consistent, with six datasets indicating increasing trends: three within the SAS (TR 13-3, TR 9-3, and 50), two within the UFA/Tampa Member (TR 10-2 and TR 9-1), and one within the UFA/Suwannee Limestone (TR 11-2). Kendall’s τ and p-values for one dataset from a well along the northern and eastern coast of Tampa Bay (TR 13-3) indicate a decreasing trend within the UFA/Avon Park Formation.
The significant decreasing trend in hydraulic head and significant increasing chloride concentrations within the UFA/Avon Park Formation at TR 13-3 are indicative of groundwater withdrawals in the area resulting in upconing of saline water from the deeper aquifer. The increasing trend in chloride concentration within the UFA/Suwannee Limestone at TR 11-2 is gradual, with a low mean value of 204 mg/L, whereas the increasing trend in hydraulic head is steeper, resulting in head values increasing by approximately 3–4 ft from 1980 to 2022. The increased hydraulic heads appear to be a result of regional changes in the potentiometric surface in and near this area. The difference in the location of the 20-ft contour on the potentiometric surface maps for 1985 and 1987 appears to be near the Tampa Bypass Canal and Hillsborough River, indicating a possible change in surface-water management after 1985 (figs. 17 and 18).
The increasing trends in hydraulic head and salinity within the UFA/lower Arcadia Formation at TR 10-2 likely are the result of groundwater recovery following the cessation of pumping from the industrial location near the mouth of the Alafia River during the early to mid-1980s (table 3). Chloride concentrations indicate freshwater is present at this depth, with a rapid increase from 1980 to approximately 1984 followed by stabilization and a steady, increasing trend thereafter. Hydraulic heads increase more slowly, stabilizing after approximately 1996 with a steady, increasing trend thereafter. These patterns in chloride concentration and hydraulic head indicate a period of recovery following the cessation of fresh groundwater drawdown toward the pumping depth of approximately 1,000 ft.
The increasing trend in chloride concentration within the UFA/Avon Park Formation at ROMP well 51, which began in approximately 2005, can likely be attributed to groundwater withdrawals. The well is located within or adjacent to an area that consistently displayed depressed hydraulic heads on the potentiometric maps because of groundwater withdrawals (figs. 16–20). The potentiometric surface maps indicate hydraulic heads near or below 0 ft (NGVD 29) within the UFA around the well.
The steady, increasing, 0.77-ft trend in hydraulic head within the SAS at TR 9-3 (table 18) during the 46-year period 1976–2022 (0.20 in/yr) is comparable to the rate of SLR within the bay (0.18 in/yr) and is likely a result of regional changes to shallow groundwater levels in coastal areas caused by increased sea levels. Monitoring within deeper formations at TR 9-3 began after the mid-1980s, and the hydraulic head data depict (1) an area where groundwater withdrawals result in hydraulic heads often below 0.0 ft (NAVD 88) within the UFA/Suwannee and (2) artesian pressure within the underlying UFA/Avon Park Formation. Chloride concentration data indicate the presence of freshwater within the SAS and UFA/Suwannee Limestone but also increasingly brackish water within the UFA/Avon Park Formation as saline groundwater is being drawn up into the shallower aquifer.
The increasing trend in hydraulic head within the UFA/lower Arcadia Formation at TR 9-1 is most evident during the period 1976 to approximately 1993, after which the increasing trend is smaller and steadier. This is consistent with changes in groundwater withdrawals resulting in changes in hydraulic head that are evident on the potentiometric surface maps (figs. 16–20). After 1985, the cone of depression C, attributed to agricultural withdrawals, was less prominent and moved eastward away from the coast. After 1993, the steadily increasing groundwater levels are more comparable to SLR, likely a result of regional changes in groundwater levels within coastal areas caused by an increase in sea level. Kendall’s τ and p-values for chloride concentrations within the UFA/lower Arcadia Formation at TR 9-1 indicate a decreasing trend; however, the chloride concentrations are low, having an average value of 26 mg/L, and the decreasing trend is gradual over the measurement period (fig. 48).
ROMP well 50 is an inland well location and analysis of data collected from the well indicated a steadily increasing trend in hydraulic head within the SAS, resulting in an approximate increase of 1.49 ft during 1976–2022. Chloride concentrations were low within the SAS, having a mean value of 54 mg/L, with Kendall’s τ and p-values indicating no significant trends.
Five wells (TR 15-1, TR 15-2, TR 15-3, TR 7-1, and TR 6-1) located in the area north of Tampa Bay and along the southern coast of Tampa Bay, where the effects of channel modifications would likely not be seen, each had one chloride concentration and one hydraulic head dataset available for analysis. Kendall’s τ and p-values for the well locations within the area north of Tampa Bay indicated an increasing trend in chloride concentrations within the UFA/Tampa Member (TR 15-2), no trend in chloride concentrations within the UFA/Suwannee Limestone (TR 15-1), and a decreasing trend in chloride concentrations within the UFA/Suwannee Limestone (TR 15-3). Kendall’s τ and p-values for well locations along the southern coast of Tampa Bay indicated no significant trends in chloride concentrations within the UFA/lower Arcadia Formation (TR 7-1 and TR 6-1).
Kendall’s τ and p-values for the well locations within the area north of Tampa Bay indicated increasing trends in hydraulic heads within the UFA/Suwannee Limestone (TR 15-1 and TR 15-3) and the UFA/lower Arcadia Formation (TR 15-2). Kendall’s τ and p-values for the well locations along the southern coast of Tampa Bay indicated no significant trend within the UFA/lower Arcadia Formation (TR 7-1) and a decreasing trend within the UFA/lower Arcadia Formation (TR 6-1).
The increasing trends in hydraulic head within the UFA/Tampa Member and UFA/Suwannee Limestone at monitoring wells TR 15-1 and TR 15-2 are comparable to the rate of SLR during this period. Hydraulic heads increased by 0.70 and 0.68 ft within TR 15-1 and TR 15-2, respectively, during the 44-year period, resulting in increasing rates of 0.19 and 0.185 in/yr, respectively, compared to the SLR rate of 0.18 in/yr experienced within the bay. The cause of the increasing trends in chloride concentration within the UFA/Tampa Member at TR 15-2 is less clear.
Karst features can also affect water quality locally. Lake Tarpon was affected by a sinkhole along its western shore that discharged saline water from the Gulf of Mexico into the lake. Mitigation measures, including the construction of a berm around the sinkhole and channelization of flow from the lake to Tampa Bay, resulted in Lake Tarpon becoming a freshwater system. The decreasing trend in chloride concentration within the UFA/Suwannee Limestone at TR 15-3 is likely caused by the reduction in chloride concentration within Lake Tarpon and the highly conductive, connected karst aquifer. Other past activities that may have caused ongoing local effects include construction of the Tampa Bypass Canal along the Hillsborough River (which discharges into the northeast corner of Tampa Bay). Impoundment of water within the canal increased hydraulic head in some areas, decreased hydraulic head upstream, and increased base flow in the Hillsborough River.
Opportunities for Future Research
Identifying the contributing factors responsible for freshwater/saltwater interface location and movement and understanding and quantifying the effects of those factors are challenging problems for decisionmakers in the Tampa Bay region. Some factors, such as groundwater extraction rates, timing, and location, can be managed to reduce the likelihood of saltwater intrusion into sensitive areas. Other factors, such as increased sea level or changes in climatic forcings, cannot be controlled, and mitigation and adaptation strategies could be developed to address these factors. The evolving conditions at each monitoring well and snapshots of estimated potentiometric surfaces could be analyzed using historical data. Hypotheses about the contributions of individual factors to changes observed in historical datasets can be developed and those concepts could be used to estimate the effect of further potential changes to the system. However, the ability to decipher the effect each variable has on the hydrologic system is limited, and estimates of future conditions would likely have low levels of confidence. The uncertainty of estimates of future conditions could be reduced through the creation and use of physics-based quantitative tools that can analyze the changes to the freshwater/saltwater balance caused by alterations within the hydrogeologic system.
A three-dimensional variable-density groundwater flow and transport model could be used to quantify the effects that changes to the individual factors have on the groundwater system and illustrate the interactions of those factors. A substantial amount of data are available within the Tampa Bay region to create and calibrate this type of tool. A historical simulation could be used to simulate the location of the saltwater front and how changes in forcings affected its movement. Groundwater flow and transport models could be used to simulate proposed modifications to groundwater withdrawals or the physical system that may alter the connectivity between Tampa Bay and the underlying Floridan aquifer system. Future scenarios could be developed that incorporate changes in forcings, such as groundwater withdrawals, sea level, rainfall, and ET, or changes to the physical system itself, such as further exposure of the FAS to Tampa Bay water. Analytical tools such as groundwater flow and transport models could reduce the uncertainties associated with developing management plans and preparing the region for the future under evolving conditions.
References Cited
Arthur, J.D., Fischler, C., Kromhout, C., Clayton, J.M., Kelley, G.M., Lee, R.A., Li, L., O’Sullivan, M., Green, R.C., and Werner, C.L., 2008, Hydrologic framework of the Southwest Florida Water Management District: Florida Geological Survey Bulletin No. 68, 175 p., accessed December 21, 2022, at http://publicfiles.dep.state.fl.us/FGS/FGS_Publications/B/B68.pdf.
Bellino, J.C., Kuniansky, E.L., O’Reilly, A.M., and Dixon, J.F., 2018, Hydrogeologic setting, conceptual groundwater flow system, and hydrologic conditions 1995–2010 in Florida and parts of Georgia, Alabama, and South Carolina: U.S. Geological Survey Scientific Investigations Report 2018–5030, 103 p., accessed April 1, 2024, at https://doi.org/10.3133/sir20185030.
Bjerklie, D.M., Mullaney, J.R., Stone, J.R., Skinner, B.J., and Ramlow, M.A., 2012, Preliminary investigation of the effects of sea-level rise on groundwater levels in New Haven, Connecticut: U.S. Geological Survey Open-File Report 2012–1025, 46 p., accessed August 1, 2024, at https://pubs.usgs.gov/of/2012/1025/pdf.
Clayton, J., 1985a, Executive summary—TR 13-2X (Pinellas Vo Tech), Pinellas County, basin 16, S32, T29S, R16E, 16–020–018 (February 1985): Southwest Florida Water Management District web page, accessed April 1, 2024, at https://www.swfwmd.state.fl.us/sites/default/files/medias/documents/ROMP_TR13_2x_Pinellas_Vo_Tech.pdf.
Clayton, J., 1985b, Executive summary—TR 13-1X (East Bay), Pinellas County, basin 16, S35, T29S, R15E, 16–020–017 (October 1985): Southwest Florida Water Management District web page, accessed April 1, 2024, at https://www.swfwmd.state.fl.us/sites/default/files/medias/documents/ROMP_TR13_1X_East_Bay.pdf.
Cooperative Institute for Research in Environmental Sciences [CIRES] at the University of Colorado, Boulder, 2014, Continuously Updated Digital Elevation Model (CUDEM)—1/9 arc-second resolution bathymetric-topographic tiles: NOAA National Centers for Environmental Information web page, accessed January 12, 2003, at https://doi.org/10.25921/ds9v-ky35.
Decker, J.D., 2022, Drainage infrastructure and groundwater system response to changes in sea level and precipitation, Broward County, Florida: U.S. Geological Survey Scientific Investigations Report 2022–5074, 99 p., accessed August 1, 2024, at https://doi.org/10.3133/sir20225074.
Decker, J.D., Hughes, J.D., and Swain, E.D., 2019, Potential for increased inundation in flood-prone regions of southeast Florida in response to climate and sea-level changes in Broward County, Florida, 2060–69: U.S. Geological Survey Scientific Investigations Report 2018–5125, 106 p., accessed August 1, 2024, at https://doi.org/10.3133/sir20185125.
Decker, J.L., 1984a, Executive summary—TR 9-3 “Simmons #3,” S. 32 T. 31 S. R. 19E. (February 1984): Southwest Florida Water Management District web page, accessed April 1, 2024, at https://www.swfwmd.state.fl.us/sites/default/files/medias/documents/ROMP_TR9_3_Simmons_3_Executive_Summary.pdf.
Decker, J.L., 1984b, Executive summary—TR14-2 “Amberlea Park,” S25, T28S, R15E (November 1984): Southwest Florida Water Management District web page, accessed April 1, 2024, at https://www.swfwmd.state.fl.us/sites/default/files/medias/documents/ROMP_TR14_2_Amberlea_Park.pdf.
Decker, J.L., 1989a, ROMP 49 “Balm Park”—Executive summary, Hillsborough County, basin 11/S.25, T.31S, R.20E/11–020–007 (March 1989): Southwest Florida Water Management District web page, accessed April 1, 2024, at https://www.swfwmd.state.fl.us/sites/default/files/medias/documents/ROMP_49_Balm.pdf.
Decker, J.L., 1989b, ROMP TR7-4 “Ward Lake”—Executive summary, Manatee County, basin 21/S.22, T.35S, R.18E/21–020–040 (April 1989): Southwest Florida Water Management District, 76 p., accessed April 1, 2024, at https://www.swfwmd.state.fl.us/sites/default/files/medias/documents/ROMP_TR7_4_Ward_Lake.pdf.
Decker, J.L., 1990, ROMP TR 9-2 “Apollo Beach”—Wrap #1, executive summary, Hillsborough County, basin 11/S. 22, T31S, range 19E, parcel no. 11–620–101 (April 1990): Southwest Florida Water Management District web page, accessed April 1, 2024, at https://www.swfwmd.state.fl.us/sites/default/files/medias/documents/ROMP_TR9_2_Apollo_Beach.pdf.
Dewitt, D.J., 1992, ROMP TR 8-1 Rubonia, wrap #2—Statement of completed work, executive summary addendum (September 1992): Southwest Florida Water Management District web page, accessed April 1, 2024, at https://www.swfwmd.state.fl.us/sites/default/files/medias/documents/ROMP_TR8_1_Rubonia.pdf.
Dooris, P.M., and Bartos, L.F., 1980, Factors affecting salinity reduction in Lake Tarpon, Pinellas County, Florida: Journal of the American Water Resources Association, v. 16, no. 2, p. 203–206, accessed December 2, 2023, at https://onlinelibrary.wiley.com/doi/epdf/10.1111/j.1752-1688.1980.tb02379.x.
Gates, M.T., 2013, Well construction and aquifer performance testing for the Dover-Plant City freeze management plan in Hillsborough and Polk Counties, Florida: Southwest Florida Water Management District, 82 p., accessed April 1, 2024, at https://www.swfwmd.state.fl.us/sites/default/files/medias/documents/Dover_-_Plant_City_Freeze_Mgmt_Plan_-_Well_Construction_and_APT_Report_2.pdf.
Goodwin, C.R., 1987, Tidal-flow, circulation, and flushing changes caused by dredge and fill in Tampa Bay, Florida: U.S. Geological Survey Water-Supply Paper 2282, 88 p., accessed December 21, 2022, at https://pubs.usgs.gov/wsp/2282/report.pdf.
Helsel, D.R., Hirsch, R.M., Ryberg, K.R., Archfield, S.A., and Gilroy, E.J., 2020, Statistical methods in water resources: U.S. Geological Survey Techniques and Methods, book 4, chap. A3, 458 p., accessed December 1, 2023, at https://doi.org/10.3133/tm4a3.
Henderson, G.L., and Decker, J.L., 1985, Executive summary—TR14-3 “Countryside Park,” T28S, R16E, S.31 (July 25, 1985): Southwest Florida Water Management District web page, accessed April 1, 2024, at https://www.swfwmd.state.fl.us/sites/default/files/medias/documents/ROMP_TR14_3_Countryside_Park.pdf.
Hutchinson, C.B., 1983, Assessment of the interconnection between Tampa Bay and the Floridan aquifer, Florida: U.S. Geological Survey Water-Resources Investigations Report 82–54, 55 p., accessed December 21, 2022, at https://pubs.usgs.gov/wri/1982/0054/report.pdf.
HydroGeoLogic, Inc., 2002, Three-dimensional density-dependent flow and transport modeling of saltwater intrusion in the Southern Water Use Caution Area: Southwest Florida Water Management District, final report, prepared by HydroGeoLogic, Inc., Herndon, Virginia, 213 p., accessed March 17, 2024, at https://www.swfwmd.state.fl.us/sites/default/files/solicitations/Figure%201%20-%202002%20HydoGeoLogic%20Model%20Report.pdf.
Kane, R.L., 2005, Floods in southwest-central Florida from Hurricane Frances, September 2004: U.S. Geological Survey Fact Sheet 2005–3028, 4 p., accessed September 16, 2024, at https://pubs.usgs.gov/fs/2005/3028/pdf/fs2005_3028.pdf.
Knochenmus, L.A., 2006, Regional evaluation of the hydrogeologic framework, hydraulic properties, and chemical characteristics of the intermediate aquifer system underlying southern west-central Florida: U.S. Geological Survey Scientific Investigations Report 2006–5013, 52 p., accessed March 17, 2024, at https://pubs.er.usgs.gov/publication/sir20065013.
Knutilla, R.L., and Corral, M.A., Jr., 1984, Impacts of the Tampa Bypass Canal on the areal hydrology, Hillsborough County, Florida: U.S. Geological Survey Water-Resources Investigation Report 84–4222, 71 p., accessed August 25, 2023, at https://pubs.usgs.gov/wri/1984/4222/report.pdf.
Lawrence, M.B., and Cobb, H.D., 2005, Hurricane Jeanne 13–28 September 2004: National Hurricane Center Tropical Cyclone Report, 20 p., accessed September 16, 2024, at https://www.weather.gov/media/mlb/surveys/jeanne_NHC.pdf.
Leach, S.D., 1978, Source, use, and disposition of water in Florida, 1975: U.S. Geological Survey Water-Resources Investigations Report 78–17, 89 p., accessed March 3, 2023, at https://pubs.usgs.gov/wri/1978/0017/report.pdf.
Leach, S.D., 1983, Source, use, and disposition of water in Florida, 1980: U.S. Geological Survey Water-Resources Investigations Report 82–4090, 337 p., accessed March 3, 2023, at https://permanent.fdlp.gov/gpo132998/report.pdf.
Leach, S.D., and Healy, H.G., 1980, Estimated water use in Florida, 1977: U.S. Geological Survey Water-Resources Investigations Report 79–112, 76 p., accessed March 3, 2023, at https://pubs.usgs.gov/wri/1979/0112/report.pdf.
Lee, R.A., 1998, ROMP TR SA-1 (Payne Terminal)—Drilling and testing report saltwater interface monitor-wellsite, Sarasota County, Florida (March 1998): Southwest Florida Water Management District, 366 p., accessed April 1, 2024, at https://www.swfwmd.state.fl.us/sites/default/files/medias/documents/ROMP_TRSA_1_Payne_Terminal.pdf.
Lewis, R.R., III, 1976, Impact of dredging in the Tampa Bay estuary, 1876–1976, in Time stressed coastal environments—Assessment and future action, Proceedings of Second Annual Conference of the Coastal Society, New Orleans, Louisiana, November 17–20, 1976: Arlington, Virginia, Coastal Society, 24 p., accessed December 21, 2022, at https://tampabay.wateratlas.usf.edu/upload/documents/Impact%20of%20Dredging%20in%20the%20Tampa%20Bay%20Estuary,%201876-1976.pdf.
Mallams, K.D., 2023, Hydrogeology, water quality, and well construction at the ROMP 38—Parrish well site in Manatee County, Florida (August 2023): Southwest Florida Water Management District, 263 p., accessed April 1, 2024, at https://www.swfwmd.state.fl.us/sites/default/files/medias/documents/ROMP%2038%20Parrish%20-%20Well%20Site%20Report.pdf.
Marella, R.L., 1988, Water withdrawals, use, and trends in Florida, 1985: U.S. Geological Survey Water-Resources Investigations Report 88–4103, 43 p., accessed March 3, 2023, at https://pubs.usgs.gov/wri/1988/4103/wri884103.pdf.
Marella, R.L., 1992, Water withdrawals, use, and trends in Florida, 1990: U.S. Geological Survey Water-Resources Investigations Report 92–4140, 38 p., accessed March 3, 2023, at https://pubs.usgs.gov/wri/1992/4140/report.pdf.
Marella, R.L., 1999, Water withdrawals, use, and trends in Florida, 1995: U.S. Geological Survey Water-Resources Investigations Report 99–4002, 90 p., accessed March 3, 2023, at https://fl.water.usgs.gov/PDF_files/wri99_4002_marella.pdf.
Marella, R.L., 2004, Water withdrawals, use, and trends in Florida, 2000: U.S. Geological Survey Water-Resources Investigations Report 2004–5151, 136 p., accessed March 3, 2023, at https://pubs.usgs.gov/sir/2004/5151/report.pdf.
Marella, R.L., 2009, Water withdrawals, use, and trends in Florida, 2005: U.S. Geological Survey Scientific Investigations Report 2009–5125, 49 p., accessed March 3, 2023, at https://pubs.usgs.gov/sir/2009/5125/pdf/sir2009-5125.pdf.
Marella, R.L., 2014, Water withdrawals, use, and trends in Florida, 2010: U.S. Geological Survey Scientific Investigations Report 2014–5088, 59 p., accessed March 3, 2023, at https://doi.org/10.3133/sir20145088.
Marella, R.L., 2020, Water withdrawals, uses, and trends in Florida, 2015: U.S. Geological Survey Scientific Investigations Report 2019–5147, 52 p., accessed February 23, 2023, at https://doi.org/10.3133/sir20195147.
Marrero, T., McNeill, C., and DiNatale, S., 2016, Hermine brings heavy rains to parts of Tampa Bay, with more to come: Tampa Bay Times, August 31, 2016, accessed September 16, 2024, at https://www.tampabay.com/news/weather/hermine-brings-heavy-rains-to-parts-of-tampa-bay-with-more-to-come/2291777/.
Martin and Associates, 2016, The local and regional economic impacts of Port Tampa Bay: Tampa, Florida, Port Tampa Bay, prepared by Martin Associates, Lancaster, Pennsylvania, 46 p., accessed January 9, 2023, at https://frontrunner-bucket.s3.amazonaws.com/19C50C62-5056-907D-8DA1-F2F8EC080E35.pdf.
Miller, J.A., 1986, Hydrogeologic framework of the Floridan aquifer system in Florida and parts of Georgia, Alabama, and South Carolina: U.S. Geological Survey Professional Paper 1403-B, 101 p., 33 pls., accessed December 1, 2022, at https://pubs.usgs.gov/pp/1403b/report.pdf.
National Oceanic and Atmospheric Administration [NOAA], 2023a, St. Petersburg, FL—Station ID—8726520: NOAA Tides & Currents web page, accessed January 23, 2023, at https://tidesandcurrents.noaa.gov/stationhome.html?id=8726520.
National Oceanic and Atmospheric Administration [NOAA], 2023b, Key West, FL—Station ID—8724580: NOAA Tides & Currents web page, accessed January 23, 2023, at https://tidesandcurrents.noaa.gov/stationhome.html?id=8724580.
New, G.H., 1981, TR 7-1 “Bowlees Creek,” Bradenton—Executive summary (October 1981): Southwest Florida Water Management District web page, accessed April 1, 2024, at https://www.swfwmd.state.fl.us/sites/default/files/medias/documents/ROMP_TR7_1_Bowlees_Creek.pdf.
Prinos, S.T., Wacker, M.A., Cunningham, K.J., and Fitterman, D.V., 2014, Origins and delineation of saltwater intrusion in the Biscayne aquifer and changes in the distribution of saltwater in Miami-Dade County, Florida: U.S. Geological Survey Scientific Investigations Report 2014–5025, 106 p., accessed August 15, 2024, at https://doi.org/10.3133/sir20145025.
Rappuhn, D.H., 1995, ROMP TR7-2 ONECO—Monitor well site, Manatee County, Florida, final report (January 1995): Southwest Florida Water Management District web page, 372 p., accessed April 1, 2024, at https://www.swfwmd.state.fl.us/sites/default/files/medias/documents/ROMP_TR7_2_Oneco.pdf.
R Core Team, 2022, R—A language and environment for statistical computing: Vienna, Austria, R Foundation for Statistical Computing website, accessed December 1, 2023, at https://www.R-project.org.
Rotzoll, K., and Fletcher, C.H., 2013, Assessment of groundwater inundation as a consequence of sea-level rise: Nature Climate Change, v. 3, no. 3, p. 477–481, accessed August 8, 2024, https://www.nature.com/articles/nclimate1725#citeas.
Senay, G., Bohms, S., Singh, R., Gowda, P., Velpuri, N., Alemu, H., and Verdin, P., 2013, Operational evapotranspiration mapping using remote sensing and weather datasets—A new parameterization for the SSEB approach: Journal of the American Water Resources Association, v. 49, no. 3, p. 577–591, accessed February 16, 2023, at https://doi.org/10.1111/jawr.12057.
Southwest Florida Water Management District [SWFWMD], 2018a, Vertical datum upgrade: Southwest Florida Water Management District web page, accessed July 26, 2024, at https://www.swfwmd.state.fl.us/resources/data-maps/vertical-datum-upgrade.
Southwest Florida Water Management District [SWFWMD], 2018b, Regional Observation and Monitor-well Program (ROMP): Southwest Florida Water Management District web page, accessed August 6, 2024, at https://www.swfwmd.state.fl.us/projects/regional-observation-and-monitor-well-program-romp.
Southwest Florida Water Management District [SWFWMD], 2021a, Southwest Florida Water Management District Geospatial Open Data Portal—Drainage basin boundaries: Southwest Florida Water Management District web page, accessed January 12, 2023, at https://data-swfwmd.opendata.arcgis.com/search?groupIds=da7085d62405427ca49321873adf87a6.
Southwest Florida Water Management District [SWFWMD], 2021b, Southwest Florida Water Management District Geospatial Open Data Portal—Potentiometric surface data: Southwest Florida Water Management District web page, accessed March 4, 2023, at https://data-swfwmd.opendata.arcgis.com/search?groupIds=da7085d62405427ca49321873adf87a6.
Southwest Florida Water Management District [SWFWMD], 2022, Rainfall summary data by region: Southwest Florida Water Management District web page, accessed February 6, 2023, at https://www.swfwmd.state.fl.us/resources/data-maps/rainfall-summary-data-region.
Southwest Florida Water Management District [SWFWMD], 2023, Water Management Information System—Water use permits: Southwest Florida Water Management District web page, accessed May 31, 2023, at https://www18.swfwmd.state.fl.us/search/search/searchwupsimple.aspx?_ga=2.172296355.1464253408.1685541927-961872103.1669733276.
Southwest Florida Water Management District [SWFWMD], [undated] a, Executive summary—ROMP site TR 12-1, core and two monitor wells: Southwest Florida Water Management District web page, accessed April 1, 2024, at https://www.swfwmd.state.fl.us/sites/default/files/medias/documents/ROMP_TR12_1_Eisenhower_Blvd.pdf.
Southwest Florida Water Management District [SWFWMD], [undated] b, Executive summary—ROMP site TR 11-2, core and chloride monitor: Southwest Florida Water Management District web page, accessed April 1, 2024, at https://www.swfwmd.state.fl.us/sites/default/files/medias/documents/ROMP_TR11_2_78th_Street.pdf.
Southwest Florida Water Management District [SWFWMD], [undated] c, Executive summary—ROMP site TR 10-2, water table and chloride monitor, core: Southwest Florida Water Management District web page, accessed April 1, 2024, at https://www.swfwmd.state.fl.us/sites/default/files/medias/documents/ROMP_TR10_2_Progress_Village.pdf.
Southwest Florida Water Management District [SWFWMD], [undated] d, Executive summary—TR 9-1, core and monitor well: Southwest Florida Water Management District web page, accessed April 1, 2024, at https://www.swfwmd.state.fl.us/sites/default/files/medias/documents/ROMP_TR9_1_Simmons_Park.pdf.
Southwest Florida Water Management District [SWFWMD], [undated] e, Executive summary—ROMP site no. 50, three monitor wells: Southwest Florida Water Management District web page, accessed April 1, 2024, at https://www.swfwmd.state.fl.us/sites/default/files/medias/documents/ROMP_50_Sun_City_Center.pdf.
Southwest Florida Water Management District [SWFWMD], [undated] f, Executive summary—ROMP site TR 6-1 core: Southwest Florida Water Management District web page, accessed April 1, 2024, at https://www.swfwmd.state.fl.us/sites/default/files/medias/documents/ROMP_TR6_1_Siesta_Key.pdf.
Sweet, W.V., Kopp, R.E., Weaver, C.P., Obeysekera, J., Horton, R.M., Thieler, E.R., and Zervas, C., 2017, Global and regional sea level rise scenarios for the United States: National Oceanic and Atmospheric Administration Technical Report NOS CO-OPS 083, 75 p., accessed February 10, 2023, at https://tidesandcurrents.noaa.gov/publications/techrpt83_Global_and_Regional_SLR_Scenarios_for_the_US_final.pdf.
Tampa Bay Climate Science Advisory Panel [TBCSAP], 2019, Recommended projections of sea-level rise in the Tampa Bay region: Tampa Bay Climate Science Advisory Panel, 19 p., accessed February 9, 2023, at https://www.mymanatee.org/gisapps/pm/climateAdaptation/CSAP_SLR_Recommendation_2019.pdf.
Taylor, J.T., and Alley, W.M., 2001, Ground-water-level monitoring and the importance of long-term water-level data: U.S. Geological Survey Circular 1217, 77 p., accessed August 10, 2024, at https://pubs.usgs.gov/circ/circ1217/pdf/circular1217.pdf.
U.S. Army Corps of Engineers [USACE], 2019, Waterborne Commerce Statistics Center—CY 2019 waterborne tonnage by State (in units of 1000 tons): U.S. Army Corps of Engineers Digital Library website, accessed January 9, 2023, at https://usace.contentdm.oclc.org/digital/collection/p16021coll2/id/6753.
U.S. Army Corps of Engineers [USACE], 2022, Sea-level Change Curve Calculator (ver. 2022.72): U.S. Army Corps of Engineers website, accessed November 17, 2023, at https://cwbi-app.sec.usace.army.mil/rccslc/slcc_calc.html.
U.S. Army Corps of Engineers [USACE], 2023, Sea Level Analysis Tool (SLAT): U.S. Army Corps of Engineers website, accessed November 17, 2023, at https://climate.sec.usace.army.mil/slat/.
U.S. Census Bureau, 1982, Preliminary estimates of the intercensal population of counties—1970–1979: U.S. Census Bureau Population Estimates and Population Distribution Branches web page, accessed March 2, 2023, at https://www2.census.gov/programs-surveys/popest/tables/1900-1980/counties/totals/e7079co.txt.
U.S. Census Bureau, 2020, Annual estimates of the resident population for counties in Florida—April 1, 2010 to July 1, 2019: U.S. Census Bureau, Population Division, March 2020, CO–EST2019–ANNRES–12, accessed January 12, 2023, at https://www.census.gov/data/tables/time-series/demo/popest/2010s-counties-total.html.
U.S. Census Bureau, 2022, Annual estimates of the resident population for counties in Florida—April 1, 2020 to July 1, 2021: U.S. Census Bureau, Population Division, March 2022, CO–EST2021–ANNRES–POP, accessed January 12, 2023, at https://www.census.gov/data/tables/time-series/demo/popest/2020s-counties-total.html.
U.S. Geological Survey [USGS], 2013, Groundwater glossary: U.S. Geological Survey web page, accessed March 4, 2023, at https://pubs.usgs.gov/gip/gw/glossary.html#:~:text=Potentiometric%20surface%20%2D%20An%20imaginary%20surface,unconfined%20aquifers%2C%20the%20water%20 table.
U.S. Geological Survey [USGS], 2016, USGS water data for the Nation: U.S. Geological Survey National Water Information System database, accessed August 6, 2024, at https://waterdata.usgs.gov/nwis/.
Williams, L.J., and Kuniansky, E.L., 2015, Revised hydrogeologic framework of the Floridan aquifer system in Florida and Parts of Georgia, Alabama, and South Carolina: U.S. Geological Survey Professional Paper 1807, 140 p., 23 pls., accessed December 21, 2022, at https://doi.org/10.3133/pp1807.
Conversion Factors
U.S. customary units to International System of Units
Datums
Vertical coordinate information is referenced to the North American Vertical Datum of 1988 (NAVD 88) and National Geodetic Vertical Datum of 1929 (NGVD 29).
Horizontal coordinate information is referenced to North American Datum of 1983 (NAD 83).
Elevation, as used in this report, refers to distance above the vertical datum.
Supplemental Information
Concentrations of chemical constituents in water are in milligrams per liter (mg/L).
Abbreviations
ET
evapotranspiration
FAS
Floridan aquifer system
IAS
intermediate aquifer system
ICU
intermediate confining unit
LFA
Lower Floridan aquifer
NOAA
National Oceanic and Atmospheric Administration
RCP
representative concentration pathway
ROMP
Regional Observation and Monitor-well Program
SAS
surficial aquifer system
SLR
sea-level rise
SSEBop
Simplified Surface Energy Balance
SWFWMD
Southwest Florida Water Management District
TBCSAP
Tampa Bay Climate Science Advisory Panel
UCU
upper confining unit
UFA
Upper Floridan aquifer
USACE
U.S. Army Corps of Engineers
USGS
U.S. Geological Survey
For more information about this publication, contact
Director, Caribbean-Florida Water Science Center
U.S. Geological Survey
4446 Pet Lane, Suite 108
Lutz, FL 33559
For additional information, visit
https://www.usgs.gov/centers/car-fl-water
Publishing support provided by
Lafayette Publishing Service Center
Disclaimers
Any use of trade, firm, or product names is for descriptive purposes only and does not imply endorsement by the U.S. Government.
Although this information product, for the most part, is in the public domain, it also may contain copyrighted materials as noted in the text. Permission to reproduce copyrighted items must be secured from the copyright owner.
Suggested Citation
Decker, J.D., 2024, Assessment of the interconnection between Tampa Bay and the Floridan aquifer system—Historical groundwater data compilation and analysis, 1976–2022: U.S. Geological Survey Scientific Investigations Report 2024–5073, 95 p., https://doi.org/10.3133/sir20245073.
ISSN: 2328-0328 (online)
Study Area
| Publication type | Report |
|---|---|
| Publication Subtype | USGS Numbered Series |
| Title | Assessment of the interconnection between Tampa Bay and the Floridan aquifer system: Historical groundwater data compilation and analysis, 1976–2022 |
| Series title | Scientific Investigations Report |
| Series number | 2024-5073 |
| DOI | 10.3133/sir20245073 |
| Publication Date | December 02, 2024 |
| Year Published | 2024 |
| Language | English |
| Publisher | U.S. Geological Survey |
| Publisher location | Reston, VA |
| Contributing office(s) | Caribbean-Florida Water Science Center |
| Description | Report: x, 95 p.; Data Release |
| Country | United States |
| State | Florida |
| Other Geospatial | Tampa Bay |
| Online Only (Y/N) | Y |


