

Water-Budget Analysis of the Medina and Diversion Lake System, With Estimated Recharge to the Edwards Aquifer and the Upper Zone of the Trinity Aquifer, Bandera, Bexar, and Medina Counties, Texas, 1955–2022
Links
- Document: Report (8.48 MB pdf) , HTML , XML
- Data Release: USGS Data Release - Datasets and R scripts used for the water-budget analysis of the Medina and Diversion Lake system, Bandera, Bexar, and Medina Counties, Texas, 1955–2022
- Download citation as: RIS | Dublin Core
Acknowledgments
The authors wish to thank the San Antonio Water System and the Edwards Aquifer Authority for funding the operation and maintenance of the streamgages used in this study. Mr. Gary Cox, Mrs. Pam Van Delden, and Mr. Garrett Van Delden are acknowledged for permitting access to their properties for the placement of the evaporation instruments.
William Asquith, U.S. Geological Survey, assisted with analyses and review.
Abstract
The U.S. Geological Survey—in cooperation with the San Antonio Water System and the Edwards Aquifer Authority—used data collected during four different periods (March 1955–August 1964, October 1995–September 1996, March 2001–June 2002, and March 2017–October 2022) as part of a new study to refine previously derived relations between the altitude of the water surface of Medina Lake and recharge to the Edwards aquifer and the upper zone of the Trinity aquifer in the form of seepage losses from Medina Lake and the immediately downstream Diversion Lake. Any seepage losses that occur within the conservation pools of Medina and Diversion Lakes infiltrate the Edwards aquifer and the upper zone of the Trinity aquifer as recharge. To quantify recharge to the Edwards aquifer and the upper zone of the Trinity aquifer from Medina and Diversion Lakes, daily water budgets were used to calculate monthly and annual recharge (method 1). A new statistical analysis culminated in a new log-log weighted least-squares (WLS) regression equation that relates recharge from Medina and Diversion Lakes to the Medina Lake stage. Recharge estimates obtained by using the new log-log WLS regression equation (method 2), as well as the recharge estimated by using a method published in 1978 (referred to as the “Puente method”) (method 3), were compared with the calculated recharge during March 2017–September 2022. During March 2017–September 2022, the WLS estimated recharge was 224,310 acre-feet, 0.5 percent less than the calculated recharge of 225,400 acre-feet. The Puente method estimated recharge was 342,080 acre-feet, about 52 percent more than the calculated recharge. The analysis of the three methods indicates that WLS estimated recharge provides a more accurate accounting of actual recharge to the Edwards aquifer and the upper zone of the Trinity aquifer compared to the Puente method.
Introduction
Medina Lake and the immediately downstream Diversion Lake (hereinafter referred to as the “Medina and Diversion Lake system”) are within parts of Bandera, Bexar, and Medina Counties in Texas and drain approximately 650 square miles (mi2) upstream from the U.S. Geological Survey (USGS) streamgaging station on the Medina River near Riomedina, Texas (fig. 1). Medina Lake is impounded by Medina Lake Dam and straddles the Medina-Bandera County line. Diversion Lake is impounded by Medina Diversion Lake Dam and is approximately 5 river miles downstream from Medina Lake Dam in Medina County.
Medina Lake Dam was constructed in 1912 to impound water for irrigation. The conservation pool altitude of Medina Lake is 1,064.2 feet (ft) above the National Geodetic Vertical Datum of 1929 (NGVD 29) (Sullivan and others, 2003; National Geodetic Survey, 2011). When full, Medina Lake contains approximately 255,000 acre-feet (acre-ft) of water and covers an area of approximately 6,066 acres. Medina Diversion Lake Dam is immediately downstream from Medina Lake Dam and impounds approximately 2,555 acre-ft of water when filled to its spillway altitude of 919 ft above NGVD 29. Part of the water from Diversion Lake can be diverted at Medina Diversion Lake Dam through the Medina Irrigation Canal to the Bexar-Medina-Atascosa Water Control and Improvement District irrigation network, which provides irrigation water to approximately 33,000 acres of farmland in the Medina River Valley south of the study area (Sullivan and others, 2003).
The relation between recharge to the underlying groundwater system from the Medina and Diversion Lake system has been the subject of several previously published studies (Puente, 1978; Lambert and others, 2000; Asquith and Slattery, 2016; Slattery and Miller, 2017).Although many previous studies have focused on the seepage losses from the Medina and Diversion Lake system as providing recharge to the Edwards aquifer, other studies (Small and Lambert, 1998; Clark and others, 2020) describe the seepage losses as providing recharge to the Edwards and Trinity aquifers because the rocks that contain the upper zone of the Trinity aquifer are also in contact with Medina and Diversion Lakes (Clark, 2003; Johnson and others, 2010; Gary and others, 2011; Hunt and others, 2016; Saribudak, 2016).
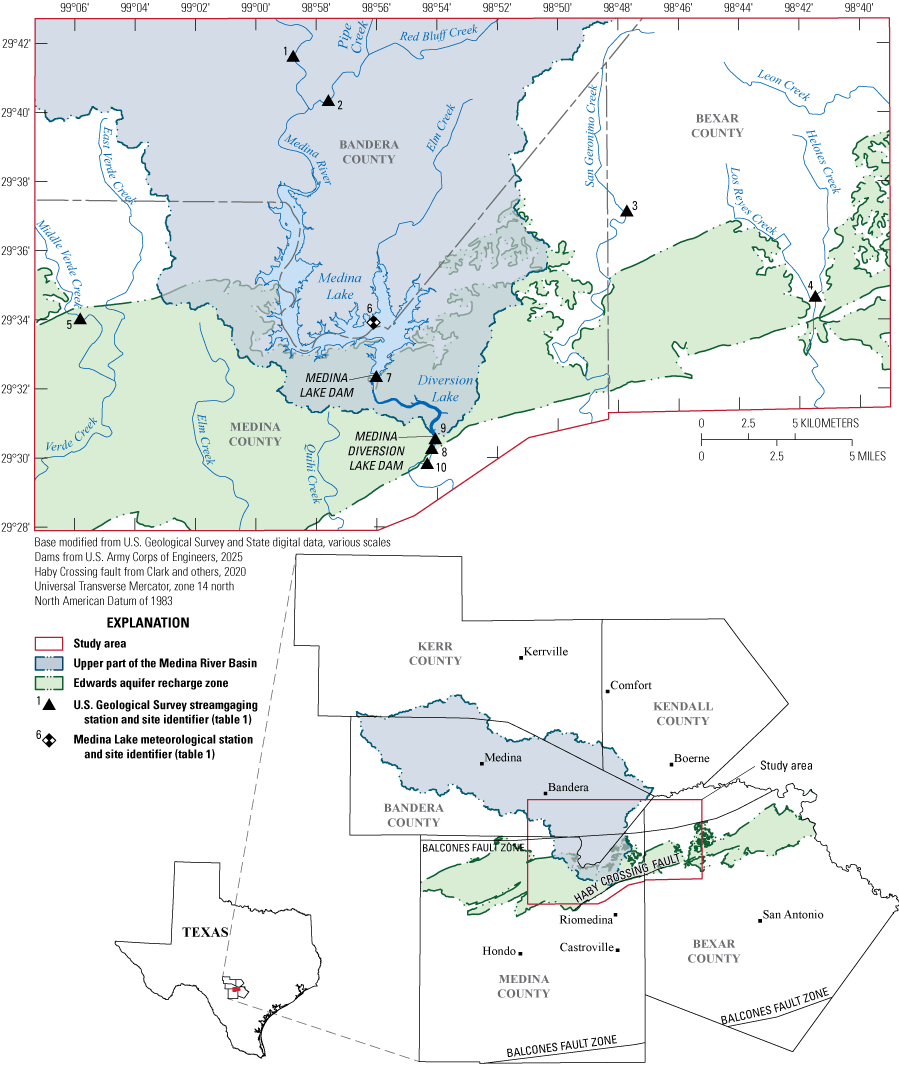
The study area, selected hydrogeologic features, and data-collection sites in the upper Medina River drainage area, Bandera, Bexar, and Medina Counties, Texas.
Geology and Hydrostratigraphy
The following Cretaceous-age geologic units (listed from oldest to youngest) are exposed at the land surface in the study area (fig. 2): the lower and upper members of the Glen Rose Limestone of the Trinity Group (Rose, 1972; Clark and others, 2020); the Kainer/Fort Terrett and Person/Segovia Formations of the Edwards Group (Rose, 1972; Clark and others, 2020); the Georgetown Formation, Del Rio Clay, and Buda Limestone Formation of the Washita Group; and the Eagle Ford, Austin, and Taylor Groups. The rocks that compose the Washita Group, Eagle Ford Group, Austin Group, and Taylor Group (Clark and others, 2020) form the upper confining unit to the Edwards aquifer and will not be discussed further in this report. The Edwards aquifer is contained in the rocks that compose the Edwards Group (or in the stratigraphically equivalent Devils River Limestone), and the Trinity aquifer is contained in the rocks that compose the Trinity Group; the upper zone of the Trinity aquifer is contained in the upper member of the Glen Rose Limestone (fig. 2). The Edwards and Trinity aquifers have been identified as major aquifers by the Texas Water Development Board (TWDB) (George and others, 2011). The carbonate rocks (limestone and dolomite) that contain both aquifers are part of a karst system characterized by sinkholes, vugs, fractures, and conduits (Clark and others, 2020, 2023). Base flow in Medina River is supported by groundwater inflows from the hydraulically connected Edwards and Trinity aquifers. Groundwater recharge occurs through the surficial rocks that contain the Edwards and Trinity aquifers. The rocks that contain these aquifers are characterized by solution enhanced porosity and permeability that has developed along faults and fractures. Porosity is the percentage of interstices (void space) in a rock unit and is determined by dividing the volume of interstices by the total rock volume. The degree to which the pore spaces are connected determines the permeability of the rock unit (Lohman, 1972). The Edwards and Trinity aquifers are characterized by porosity and permeability that vary spatially in the rock units underlying the Medina and Diversion Lake system, providing a pathway for seepage losses of surface water stored in the lakes to enter the groundwater system (Clark and others, 2020, 2023). Previous studies established that recharge occurs as seepage losses from the lake system into the subsurface and can be related to the altitude of the water surface of Medina Lake in feet above NGVD 29 (hereinafter referred to as “Medina Lake stage”) (Lambert and others, 2000; Slattery and Miller, 2017). Within the Medina and Diversion Lake system, seepage losses enter the Edwards aquifer and the upper zone of the Trinity aquifer as recharge. The Edwards aquifer is absent upgradient from Medina Lake. Recharge in the Medina Lake drainage area upgradient from the Medina and Diversion Lake system consists of a large degree of precipitation that enters the upper and middle zones of the Trinity aquifer. Further information on the geology and hydrostratigraphy of the area is provided in Clark and others (2020, 2023).
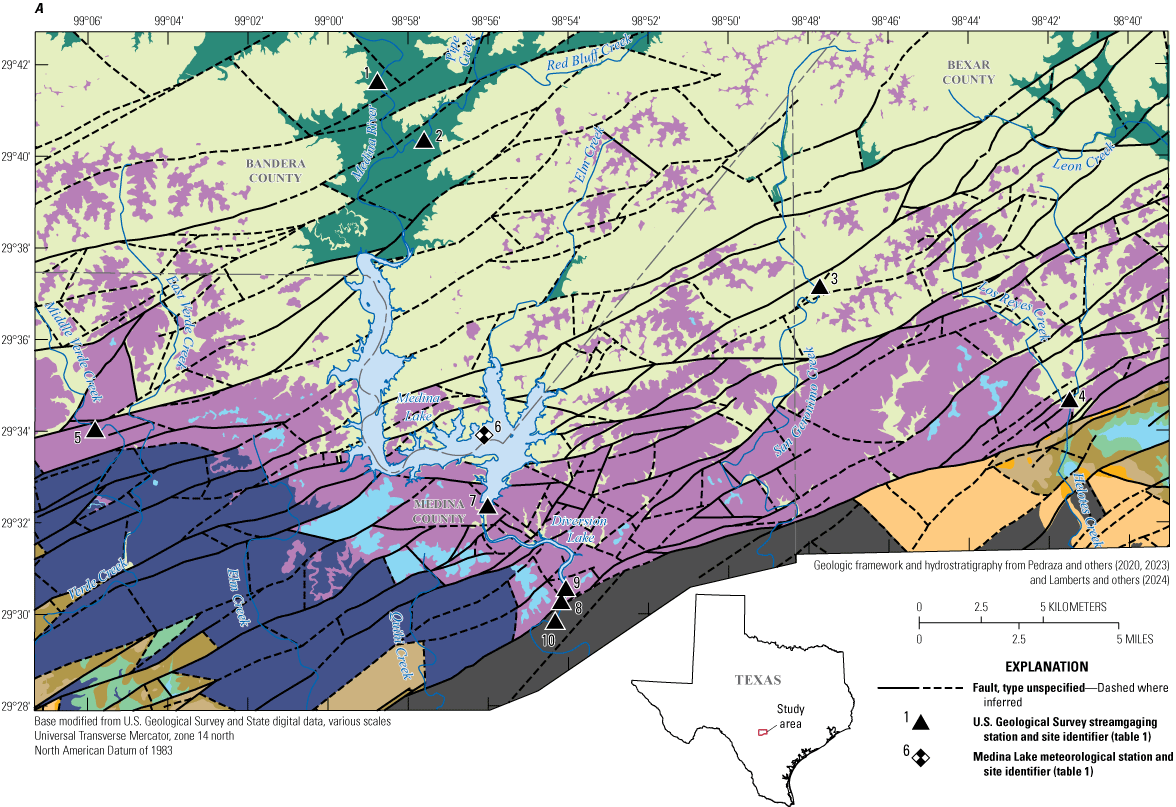
A, The surface and shallow subsurface geology in the study area and B, an explanation of the hydrostratigraphic units shown in the upper Medina River drainage area, Bandera, Bexar, and Medina Counties, Texas.
Previous Studies
The mean annual recharge to the entire Edwards aquifer in south-central Texas has been estimated as approximately 689,000 acre-feet per year (acre-ft/yr) (1934–2022) (Slattery and Choi, 2023). Seepage losses from Medina and Diversion Lakes have been estimated to contribute a mean annual recharge amount of 61,300 acre-ft (1934–2022), or about 9 percent of the total mean annual recharge to the Edwards aquifer (Slattery and Choi, 2023). Recent studies indicated that the upper 120 ft of the upper zone of the Trinity aquifer is hydraulically connected to the Edwards aquifer in some locations (Clark, 2003; Johnson and others, 2010; Gary and others, 2011; Hunt and others, 2016; Saribudak, 2016). It is unknown how much of the 9 percent of the total estimated recharge to the Edwards aquifer ultimately recharges the upper zone of the Trinity aquifer (Lambert and others, 2000; Clark and Journey, 2006).
The amount of seepage losses entering the Edwards aquifer and the upper zone of the Trinity aquifer as recharge varies depending on the Medina Lake stage and the characteristics of the rocks underlying the lakes (fig. 2) (Puente, 1978; Lambert and others, 2000). Seepage losses from Medina and Diversion Lakes enter the aquifers through the porous and permeable outcrops of rocks containing the Edwards aquifer and the upper zone of the Trinity aquifer. Lohman (1972, p. 4) wrote, “Transmissivity is the rate at which water of the prevailing kinematic viscosity is transmitted through a unit width of the aquifer under a unit hydraulic gradient,” and explained that transmissivity indicates how readily groundwater can flow through a rock unit. Transmissivity is measured in cubic feet per day per square foot times the aquifer thickness in feet ([ft3/d/ft2])×ft), which can be simplified to feet squared per day (ft2/d) (Lohman, 1972). Because the porosity and permeability of the rocks that contain the Edwards and Trinity aquifers (and the resulting transmissivity) have been enhanced by secondary porosity along faulting and fracturing associated with the Balcones fault zone (figs. 1 and 2), the transmissivity in the Edwards aquifer and the upper zone of the Trinity aquifer can be quite large. Lohman (1972, p. 4) explains “Solution of carbonate rocks such as limestone or dolomite by water containing dissolved carbon dioxide takes place mainly along joints and bedding planes and may greatly increase the secondary porosity. Similarly, solution of gypsum or anhydrite by water alone may greatly increase the secondary porosity.” Within the Edwards aquifer, transmissivity in areas of faulting ranges from 10,000 to as much as about 5,000,000 ft2/d, whereas within the Trinity aquifer, transmissivity ranges from 100 to 58,000 ft2/d (Lambert and others, 2000).
Whereas groundwater recharge in the form of seepage losses from the Medina and Diversion Lake system can occur in all hydrostratigraphic units underlying the lakes, certain units are more permeable based on their lithology and the resulting effective porosities (Clark and others, 2020). The rock units that contain the Edwards aquifer and the upper zone of the Trinity aquifer are in contact with Medina Lake in the southern part of Medina Lake. Because faulting has displaced the rock units that contain the Edwards aquifer and the upper zone of the Trinity aquifer, contacts between the lake and the rock units have been identified at altitudes of 1,045, 970, 960, and 945 ft above NGVD 29 (Clark and others, 2020). In Diversion Lake, most of the recharge in the form of seepage losses enters the upper zone of the Trinity aquifer, and the only location where seepage losses directly recharge the Edwards aquifer in Diversion Lake occurs in an area near Medina Diversion Lake Dam where faulting has placed the contact of the Edwards aquifer and the upper zone of the Trinity aquifer below the base of the lake (Small and Lambert, 1998; Lambert and others, 2000; Clark and others, 2020, 2024).
The amount of groundwater recharge entering the Edwards aquifer and the upper zone of the Trinity aquifer as seepage losses from Medina Lake can be related to the Medina Lake stage, as documented in previous studies (Lambert and others, 2000; Slattery and Miller, 2017). The relation between seepage losses from Medina Lake and the Medina Lake stage varies depending on the lake stage and depending on which hydrostratigraphic units are in contact with water impounded by Medina Lake Dam (Small and Lambert, 1998). The variation in the amount of recharge is a result of variations in the porosity and permeability of the hydrostratigraphic units underlying the lake (Small and Lambert, 1998). The amount of recharge entering the Edwards and Trinity aquifers in the form of seepage losses may increase as the Medina Lake stage increases, which increases the hydraulic head and thus creates a high-pressure gradient (Winter and others, 1998). Also, recharge in the form of seepage losses from Medina Lake is likely halted when the surficial hydrostratigraphic units that contain the Edwards and Trinity aquifers become saturated by large amounts of precipitation recharge. Once the hydrostratigraphic units that contain the aquifers are saturated, any additional water that infiltrates to the water table discharges from the aquifer because the aquifer is full and cannot accept it, resulting in rejected recharge (Lohman, 1972).
Incorporating engineering work done by others, Puente (1978) published two graphs depicting the correlation between reservoir stage and seepage into the aquifer, which he referred to as “correlation curves.” These curves relate the storage (and therefore, stage) in Medina Lake to monthly seepage losses from the Medina and Diversion Lake system. The first correlation curve represents seepage losses with a rising stage, and the second correlation curve represents seepage losses with a falling stage. Puente (1978, p. 23) noted, “the [correlation] curves are substantially different and apparently reflect the influence of bank storage.” Puente (1978) noted that the correlation curves were originally intended only as a tool for evaluating the design of a proposed reservoir in the lower part of the Medina River drainage area. Puente (1978) adapted the correlation curves to estimate annual recharge to the Edwards aquifer in that drainage area, assuming all seepage losses from Medina Lake entered the Edwards aquifer as recharge (hereinafter referred to as the “Puente method”). The Puente method is described in detail in the “Puente Method of Estimating Annual Groundwater Recharge From Medina Lake” section of this report. Small and Lambert (1998) and Clark and others (2020) describe how seepage from Medina Lake enters both the Edwards and Trinity aquifers as recharge, owing to their hydrological connection through faults and other karst features in some locations in and near Medina Lake (Clark, 2003; Johnson and others, 2010; Hunt and others, 2016; Saribudak, 2016).
During October 1995–September 1996, the USGS conducted a study (Lambert and others, 2000) with the objectives of better defining short-term rates of recharge from seepage losses and reducing the error and uncertainty associated with estimates of monthly seepage losses from the Medina and Diversion Lake system. As part of that study, the USGS developed water budgets for Medina Lake, Diversion Lake, and the Medina and Diversion Lake system to derive the amount of groundwater recharge attributable to seepage from the two individual lakes and from the Medina and Diversion Lake system. During that period of study, the Medina Lake stage ranged from 1,018 to 1,046 ft above NGVD 29. Consequently, the recharge estimates derived by the 1995–96 study (Lambert and others, 2000, p. 12) are considered “* * * valid only for a range in Medina Lake stage between about 1,018 and 1,046 ft above [NGVD 29].”
During a subsequent 2001–02 study, the USGS collected additional data to refine and, if possible, extend the previously derived (1995–96) relations between the Medina Lake stage and recharge to the Edwards aquifer and the upper zone of the Trinity aquifer to include the effects of reservoir stages less than 1,018 ft and greater than 1,046 ft above NGVD 29. The results of the 2001–02 study were originally published in 2004 featuring three different linear regression equations to estimate groundwater recharge from Medina Lake, Diversion Lake, and the Medina and Diversion Lake system. These equations were derived from the computation of water budgets, representing steady-state conditions over a range of stages for Medina and Diversion Lakes individually, and for the Medina and Diversion Lake system. The study found that seepage losses from Medina Lake increase with increases in the Medina Lake stage. Specifically, as the Medina Lake stage increased from 1,020 to 1,064 ft above NGVD 29, an increasing portion of the seepage losses from Medina Lake (as much as 40 percent) returned to Diversion Lake; and when the Medina Lake stage was greater than about 1,040 ft above NGVD 29, Diversion Lake gained more water than it lost to the groundwater system. This movement of water into and out of the groundwater system was also observed in the downstream reach between USGS streamgaging station 08180010 Diversion Lake near Riomedina, Tex. (site 9), and the downstream site USGS streamgaging station 08180500 Medina River near Riomedina, Tex. (site 10) (fig. 1; table 1). During periods when there was no flow past site 9, the Medina River gained between 32 and 94 acre-feet per day (acre-ft/d), the gains increasing with increases in the Diversion Lake stage (Slattery and Miller, 2017).
Table 1.
Hydrologic data-collection sites in the Medina and Diversion Lake study area, Bandera, Bexar, and Medina Counties, Texas, 2017–22.[dd, degrees; mm, minutes; ss, seconds; mi2, square miles; Seepageout, if positive (+), is seepage loss from the lake system that is assumed to recharge the underlying aquifers, and if negative (–), is seepage gain to the lake system from the underlying aquifers; N, north; W, west; SWin, surface-water inflow site; FM, Farm to Market; SWinc, surface-water streamflow site used to estimate discharge for ungaged areas; SH, State Highway; NA, not applicable; SWine, ungaged area of estimated discharge; E, evaporation at measurement site; P, precipitation at measurement site; ML, Medina Lake stage; ΔS, change in lake storage at measurement site; SrfA, lake surface area at measurement site; SWout, surface-water outflow at measurement site; Elev, Diversion Lake stage; station information from U.S. Geological Survey (2023)]
| Site identifier (fig. 1) | Station number | Station name | Latitude (dd mm ss) | Longitude (dd mm ss) | Drainage area (mi2) | Station type | Period of record available for Seepageout computation |
|---|---|---|---|---|---|---|---|
| 1 | 08178980 | Medina River above English Crossing near Pipe Creek, Tex. | 29°41'40” N | 98°58'46” W | 472 | SWin | March 4, 2017–October 6, 2022 |
| 2 | 08179110 | Red Bluff Creek at FM 1283 near Pipe Creek, Tex. | 29°40'23” N | 98°57'36” W | 57.9 | SWin | December 5, 2017–October 6, 2022 |
| 3 | 08180586 | San Geronimo Creek near Helotes, Tex. | 29°37'11” N | 98°47'43” W | 31.1 | SWinc | March 4, 2017–October 6, 2022 |
| 4 | 08181400 | Helotes Creek at Helotes, Tex. | 29°34'42” N | 98°41'29” W | 15 | SWinc | March 4, 2017–October 6, 2022 |
| 5 | 08200977 | Middle Verde Creek at SH 173 near Bandera, Tex. | 29°34'04” N | 99°05'49” W | 38.9 | SWinc | March 4, 2017–October 6, 2022 |
| NA | NA | Estimated discharge for ungaged area of Medina and Diversion Lakes | NA | NA | 177 | SWine | March 4, 2017–December 4, 2017 |
| NA | NA | Estimated discharge for ungaged area of Medina and Diversion Lakes | NA | NA | 119.1 | SWine | December 5, 2017–October 6, 2022 |
| 6 | 293355098560601 | Medina Lake meteorological station near Riomedina, Tex. | 29°33'55” N | 98°56'06” W | NA | E, P | March 4, 2017–October 6, 2022 |
| 7 | 08179500 | Medina Lake near San Antonio, Tex. | 29°32'24” N | 98°56'01” W | 634 | ML, ΔS, SrfA | March 4, 2017–October 6, 2022 |
| 8 | 08180000 | Medina Canal near Riomedina, Tex. | 29°30'19” N | 98°54'11” W | NA | SWout | March 4, 2017–October 6, 2022 |
| 9 | 08180010 | Diversion Lake near Riomedina, Tex. | 29°30'36” N | 98°54'04” W | 649 | Elev, ΔS, SrfA | March 4, 2017–October 6, 2022 |
| 10 | 08180500 | Medina River near Riomedina, Tex. | 29°29'53” N | 98°54'20” W | 650 | SWout | March 4, 2017–October 6, 2022 |
Using the linear regression equation developed during the 2001–02 study for the Medina and Diversion Lake system, seepage losses during October1995–September 2002 were computed and found to be about 44 percent less than the seepage losses estimated by using the Puente method. The study also indicated that seepage losses from Medina and Diversion Lakes could not be independently estimated based on the stage of the lakes because of the variable nature of seepage losses from Medina Lake that return as inflows to Diversion Lake or discharge to the Medina River downstream from Diversion Lake (Slattery and Miller, 2017).
A revised version of the report documenting the 2001–02 study was subsequently published in 2017, featuring three new regression equations resulting from a 2016 study (Slattery and Miller, 2017). The three new regression equations described in Slattery and Miller (2017) were the result of a detailed statistical reanalysis of the relation between the Medina Lake stage and the seepage losses from the Medina and Diversion Lake system completed in 2016 to improve upon the linear regression equations resulting from the previous 2001–02 study. The data for the 2016 study were published in a USGS data release (Asquith and Slattery, 2016) and as an appendix to Slattery and Miller (2017). The statistical reanalysis of the Medina Lake stage and the seepage losses culminated in a “preferred” log-log weighted least-squares (WLS) regression equation. This equation provided prediction intervals with the least amount of variability and a better relation between Medina Lake stage and groundwater recharge compared to the two other types of regression equations explored in 2016 and compared to the original linear regression equation. The coefficient of determination (R2) of the 2016 preferred regression equation was 0.88, and the probability (p-value) was less than 0.05, indicating that the regression model provided a reasonably good estimate of recharge to the Edwards aquifer and the upper zone of the Trinity aquifer with a high degree of confidence (Helsel and others, 2020). However, findings of the 2016 study also identified periods where the relation between Medina Lake stage and groundwater recharge estimates were not well defined and where additional data were needed to address data gaps. Therefore, between 2017 and 2022, the USGS—in cooperation with the San Antonio Water System and the Edwards Aquifer Authority— collected data as part of a new study to refine the previously derived relations between Medina Lake stage and recharge to the Edwards aquifer and the upper zone of the Trinity aquifer in the form of seepage losses from the Medina and Diversion Lake system. Between 2017 and 2022, additional water-budget data were collected at various data-collection sites in the upper Medina River drainage area (fig. 1) to refine previously published regression equations used to model the relation between the Medina Lake stage and the seepage losses from the lake system that provides recharge to the Edwards aquifer and the upper zone of the Trinity aquifer. The additional water-budget data collected during 2017–22 and the historical data from March 1955 through June 2002 were published in a companion USGS data release (Slattery and Choi, 2024).
Purpose and Scope
The purpose of this report is to quantitatively relate groundwater recharge to the Edwards aquifer and the upper zone of the Trinity aquifer (derived from the Medina and Diversion Lake system seepage losses) to the Medina Lake stage. Groundwater recharge was estimated using a water-budget approach for Medina and Diversion Lakes that included precipitation, evaporation, and surface-water data collected during March 1955–October 2022. The water-budget incorporated data collected by the USGS and various agencies during four different periods: March 1955–August 1964 (Slattery and Miller, 2017); October 1995–September 1996 (Lambert and others, 2000); March 2001–June 2002 (Slattery and Miller, 2017); and March 2017–October 2022. Water-budget data from the previous studies (March 1955–June 2002) were updated with the water-budget data collected during 2017–22 to develop a new log-log WLS regression equation to relate the Medina Lake stage to estimates of groundwater recharge. Recharge calculated from monthly and annual water budgets (method 1) were compared to recharge obtained from the new WLS regression equation (method 2) and to recharge obtained from a mass-balance (inflow minus outflow) approach published by Puente (1978) (method 3).
Water-Budget Analysis and Groundwater Recharge
To quantify recharge from seepage losses to the Edwards aquifer and the upper zone of the Trinity aquifer from the Medina and Diversion Lake system, daily water budgets were analyzed from March 4, 2017, to October 6, 2022, over a range of stages in Medina Lake. In the water-budget analysis, the applicable terms of the hydrologic cycle pertaining to Medina and Diversion Lakes were evaluated. Winter and others (1998, p. 2, fig. 1) provide a detailed illustration of the hydrologic cycle. The water-budget equation incorporates measurable terms of inflow and outflow to solve for (or otherwise scientifically estimate) unknown gains or losses, or both, from a lake or the lake system. The measurable terms include precipitation, evaporation, surface-water inflow and outflow, and change in lake storage. The net effect of the unknown gains and losses is represented by the residual of the measurable terms of the water-budget equation and is assumed to represent recharge to the Edwards aquifer and the upper zone of the Trinity aquifer; this residual is referred to as “Seepageout” in equation 1. Errors associated with each of the measurable terms of the water-budget equation also are included. The solution to the water-budget equation is obtained by balancing the contribution of each term of the water budget for any given budget period. The overall water-budget equation for the Medina and Diversion Lake system can be written as follows:
where (all units in acre-feet per day)Seepageout
if positive (+), is seepage loss from the lake system that is assumed to recharge the underlying aquifers, and if negative (–), is seepage gain to the lake system from the underlying aquifers;
P
is precipitation that falls on the lakes;
E
is evaporation from the lakes;
SWin
is surface-water inflow to the lakes;
SWout
is surface-water outflow from the lakes;
ΔS
is change in lake storage from the lakes; and
ei
is the uncertainty or error of each measured parameter (i) in the equation.
Consistent with previous studies (Lambert and others, 2000; Slattery and Miller, 2017), domestic and municipal withdrawals from and discharges into Medina and Diversion Lakes were presumed negligible and were not accounted for in the water-budget analysis. Furthermore, terms of groundwater inflow to the Medina and Diversion Lake system (which occurs only rarely) are unknown and are accounted for as the net Seepageout. Daily precipitation, evaporation, streamflow, and reservoir storage were measured directly, and ungaged areas draining into the Medina and Diversion Lake system were estimated based on measured streamflow in adjacent watersheds and watershed size. For each hydrologic data-collection site within the study area (fig. 1), the site identifier, station number, station name, latitude, longitude, drainage area, station type, and period of record are provided in table 1. Locations of the data-collection sites are shown in figures 1 and 2A.
A water budget for the Medina and Diversion Lake system was computed using daily hydrologic data collected during March 1955–August 1964 (Slattery and Miller, 2017), October 1995–September 1996 (Lambert and others, 2000), March 2001–June 2002 (Slattery and Miller, 2017), and March 2017–October 2022 (present study) (Slattery and Choi, 2024). Individual water budgets for the two lakes could not be computed from the 1955–64 data or 2017–22 data because no streamflow data were available to quantify the amount of water flowing from Medina Lake into Diversion Lake during these periods. Slattery and Miller (2017) describe how each term in the water-budget equation (eq. 1) was derived for the 1955–64 and 2001–02 periods. Data from the 1995–96 study (Lambert and others, 2000) were used as published except for some evaporation data, for which missing record was estimated as explained in the “Evaporation” section in Slattery and Miller (2017). Daily values of precipitation, evaporation, lake stage, lake storage, lake surface area, the calculated water-budget terms, the calculated residual of the water-budget equation (Seepageout), and the associated errors (ei) compiled for the current (2024) study are available in Slattery and Choi (2024).
Precipitation
Precipitation data were collected at the USGS streamgaging station 293355098560601 Medina Lake meteorological station near Riomedina, Texas (hereinafter referred to as the “Medina Lake meteorological station”) (site 6) (fig. 1; table 1) (Slattery and Choi, 2024). These data were used to estimate precipitation (P) falling on the Medina and Diversion Lake system. Precipitation was measured with an 8-inch tipping bucket rain gage (Xylem, 2024) mounted 5 ft above the land surface. Measurements were recorded every 15 minutes and transmitted hourly by the Geostationary Operational Environmental Satellites to the USGS National Water Information System (NWIS) database (U.S. Geological Survey, 2023). To maintain the accuracy of the rain gage, the instrument was periodically inspected and cleaned, and calibration checks were performed as described by the manufacturer and USGS protocols (U.S. Geological Survey, 2005; Xylem, 2024). When an instrument was determined not meeting calibration standards (if calibration values differed from expected values by more than 6 percent), it was replaced. Precipitation data were also reviewed by comparing data from sites 2, 3, and 5 (fig. 1; table 1) to better identify periods when the rain gage might have been clogged and, therefore, under-recorded precipitation. Affected data were removed from the USGS NWIS database (U.S. Geological Survey, 2023).
Daily precipitation totals were calculated from the sum of the 15-minute values for each day. Totals were not reported for days with more than 20 percent of the 15-minute values missing. Aside from removing anomalous values caused by instrumentation noise (anomalous values not corroborated by preceding and subsequent values), no further corrections were made to the precipitation data. For the nearly 6 years of data that were collected, about 16 days of precipitation data were missing. For days when measured precipitation data were not available, daily precipitation onto the Medina and Diversion Lake system was obtained from the TWDB (TWDB, 2023) and included data from 31 days before the operation of site 6 (fig. 1; table 1).
To calculate the precipitation (P) that fell on the Medina and Diversion Lake system for use in the water-budget equation, the total daily precipitation was converted from inches into feet, then multiplied by the sum of the daily mean surface areas (acres) of Medina and Diversion Lakes. The lake surface area for Medina and Diversion Lakes was computed by the TWDB stage-volume-area tables for Medina and Diversion Lakes (Sullivan and others, 2003). Daily precipitation totals and the daily mean surface areas (acres) collected during 2017–22 and used in the calculation of P are published in the USGS NWIS database (U.S. Geological Survey, 2023). Daily precipitation totals, daily mean surface areas (acres), and the calculated P terms are provided in the companion USGS data release (Slattery and Choi, 2024).
Evaporation
Evapotranspiration is the process by which water is transferred from the Earth’s surface to the atmosphere by evaporation of water from wet surfaces, soils, and open water bodies, and by transpiration from plants (Brutsaert, 1982). The evaporation component of evapotranspiration is the focus for this study, and refers in this report to the process and measurement of evaporation from the lake surface of Medina and Diversion Lakes although the actual measurements may include some evaporation from land surfaces and transpiration from plants. Evaporation from the Medina and Diversion Lake system was measured at site 6 (fig. 1; table 1) using the eddy covariance (EC) method (Swinbank, 1951; Brutsaert, 1982). The EC method measures evaporation directly by simultaneously measuring the moisture content of the atmosphere and the speed and direction of the atmosphere transporting the moisture (Baldocchi, 2003; Foken, 2008; Stannard and others, 2013). All measured values are reported in the English or metric units in which they were collected to avoid introducing errors and because the native units are needed for all calculations.
Measurement of evaporation from lakes made by using the EC method will often also include measurements of available energy to determine net radiation over the lake surface, and energy stored or released from the lake during warming or cooling, which allows for an assessment of the complete energy budget at the lake surface, commonly referred to as the “energy budget closure” (Moreo and Swancar, 2013). The instrumentation used for this study did not facilitate measuring all energy-budget components. Hence, it was not possible to compute an energy budget closure as an additional check on the measured evaporation values reported herein.
Instrumentation
To obtain the atmospheric data necessary for calculating evaporation, site 6 (fig. 1; table 1) was instrumented with the Campbell Scientific IRGASON system, consisting of an integrated infrared gas analyzer with a three-dimensional sonic anemometer (IRGASON) equipped with an interface to process atmospheric water concentrations, three-dimensional wind speed and direction, and air temperature (Campbell Scientific, Inc., 2021). These measurements were recorded by using a Campbell Scientific micrologger at a rate of 10 measurements per second (10-hertz [Hz] flux data). The micrologger was programmed (Online Corrections Flux Program version 1.1, 2015) to process the 10-Hz flux data into 30-minute means. The selected means were then output to a Sutron SatLink data logger (Veralto, 2024) to transmit hourly to the USGS NWIS database. At the end of each day, the 30-minute means processed by the Campbell Scientific Flux program, and the raw 10-Hz flux data for the previous 24 hours, were compiled and compressed to a Campbell Scientific CR3000 secure digital memory card.
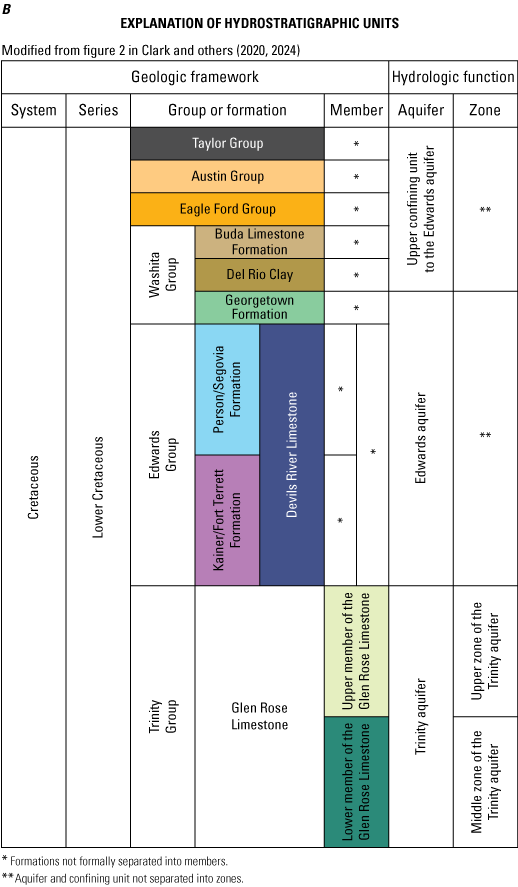
On April 4, 2017, the Medina Lake meteorological station, where a full suite of meteorological data, including EC evaporation data, was collected, was installed by mounting the Campbell Scientific IRGASON system on a 3-meter (m) tower at 3 m above the water surface on the shore of Medina Lake at site 6 (figs. 1 and 3A; table 1). The site was visited periodically to retrieve the data from the Campbell Scientific CR3000 secure digital memory card and to do routine maintenance and repairs. During site visits, the lenses of the gas analyzers were inspected, cleaned, and rinsed with deionized water. At least annually, the Campbell Scientific IRGASON system was returned to Campbell Scientific for recalibration of the gas analyzer. To prevent any data loss during this process, a spare Campbell Scientific IRGASON system was installed while the system was being recalibrated.
Photographs in A, June 2017 and B, October 2022 of the Medina Lake meteorological station, where eddy covariance evaporation data were collected on the shore of Medina Lake (U.S. Geological Survey station 293355098560601 Medina Lake meteorological station near Riomedina, Texas) (site 6) (fig. 1; table 1). Photographs by Richard Slattery, U.S. Geological Survey.
Data Processing
Evaporation-related data measured by the sensors and compiled and compressed to the Campbell Scientific CR3000 secure digital memory card were reprocessed using the Campbell Scientific EasyFlux software, version 1.0 (Campbell Scientific, Inc., 2017a). To operate correctly and to produce valid EC datasets, site-specific variables were entered into the EasyFlux software. The variables entered into the EasyFlux software included the instrument type (Campbell Scientific IRGASON system), measuring interval (10 Hz, which is equivalent to 10 sets of measurements per second), and the IRGASON orientation from magnetic north (140 degrees, set to maximize the open-water evaporation footprint). The height of the Campbell Scientific IRGASON above the water surface was periodically adjusted depending on changes in lake altitude. The height of the vegetation canopy surrounding the Medina Lake meteorological station was set to 0.01 m, a small value necessary to account for the small amount of friction between the atmosphere and the water surface, which generates waves from the wind moving over the lake (National Oceanic and Atmospheric Administration, 2023). The altitude of the Medina Lake meteorological station was entered as 324 m (equivalent to about 1,063 ft) above NGVD 29. To improve the accuracy of the flux measurements, several statistical tests were applied by using the EasyFlux software to filter and correct the raw 10-Hz flux data. These filters and corrections are used to remove implausible values, such as large values (spikes) inconsistent with the surrounding continuous data values (Vickers and Mahrt, 1997), and apply coordinate rotations to the sonic anemometer (Tanner and Thurtell, 1969). The spectral corrections were made by using a method first published by Webb and others (1980) and refined by Moncrieff and others (1997).
Quality Assurance of Evaporation and Meteorological Data
Measurements of evaporation processed by using the EasyFlux software were reviewed for erroneous sensor readings that could occur during instrument service and cleaning, and for potential outliers following recommendations of the AmeriFlux network for data archiving (Chu and others, 2023). Acceptable thresholds for evaporation were set to between −0.219 and 1.022 millimeters per hour (between −0.009 and 0.040 inch per hour), and values that were either less than or greater than these thresholds were discarded. Evaporation measurements were also discarded if the standard deviation of the measured evaporation exceeded the 2-week mean standard deviation by more than 3 times, or if the quality of the measured water vapor density was rated as poor. The measurement quality is determined by a signal measured by the IRGASON, with a value of 1.00 indicating excellent quality and values of less than 0.70 indicating poor quality (Campbell Scientific, Inc., 2017b).
For missing evaporation data intervals of 2 hours or less, the missing 30-minute values were filled by linear interpolation between the known values immediately preceding and following the data gap. Missing data for intervals of more than 2 hours were filled by using a mean diurnal variation method described in Falge and others (2001). The mean diurnal variation method is used to fill a data gap by using a mean of values for the same half-hour interval for 7 days before and after the missing values and can be used to fill data gaps of 10 days or less. Data gaps of more than 10 days were not filled by either of the methods described in this section, but instead, they were filled using the method described in the “Evaporation Data Processing” section of this report.
Source Area of Measurements
The land-surface area surrounding the Medina Lake meteorological station that affects evaporation is referred to as the “flux footprint” of the site. Fetch is the distance that wind blows over open water or land within the flux footprint (Burba, 2013). Burba (2013, p. 122 and 136) explains the terms of flux footprint and fetch as follows:
In simplest terms, the flux footprint is the area “seen” by the instrument on the tower. In other words, it is an area upwind from the tower, such that fluxes generated in this area are registered by the tower instruments. Another frequently used term, “fetch,” usually refers to the distance from the tower when describing the footprint. *** Flux footprint describes a contributing area upwind from the tower. This is the area that the instruments can “see.” Flux footprint mainly depends on measurement height, surface roughness, and atmospheric thermal stability. The size of the footprint increases with increased measurement height, with decreased surface roughness, and with changes in thermal stability from unstable to stable. The area near the tower may contribute a lot to the flux footprint, if the measurement height is low, surface roughness is high, or if conditions are very unstable.
Thus, the fetch footprint is the area “seen” by the instruments on the tower of the site, and the evaporation generated in this area is measured by the EC instruments installed at the Medina Lake meteorological station. Because Medina Lake is relatively small, the fetch footprint—especially when the lake is not full—may incorporate land features such as terrain, ground cover, vegetation types, water bodies, and structures that affect airflow patterns of the wind and moisture content of the atmosphere, thereby affecting the measured evaporation (Burba, 2013).
The distance that the fetch footprint extends from the EC instruments at the Medina Lake meteorological station for wind directions from 40 to 260 degrees from true north at the instrument tower was estimated using the EasyFlux software. This software includes two models: the Kljun model (Kljun and others, 2004) and the Kormann-Meixner model (Kormann and Meixner, 2001). When the wind direction was from 40 to 260 degrees from true north, the fetch footprint best represented open water at the site. By default, the Kljun model is used to estimate fetch distance with the EasyFlux software. When meteorological values pertaining to the measurement of evaporation are outside of predefined ranges of atmospheric conditions of stability and turbulence, the Kormann-Meixner model is used. Both models depend on the height of the instrument, the height of the vegetation canopy, surface roughness, and the stability of the atmosphere to calculate the fetch. For each processing period (about 40 days), the mean height of the Campbell Scientific IRGASON instrument above the water surface was entered into the EasyFlux software for calculating the fetch distance.
The EasyFlux software was used to estimate five fetch distances from the instrument tower, expressed as a percentage (10, 30, 50, 70, and 90 percent) of the cumulative evaporation contributions measured at the site. The percentages of the cumulative evaporation contributions by fetch distance from the instrument tower are provided in figure 4.
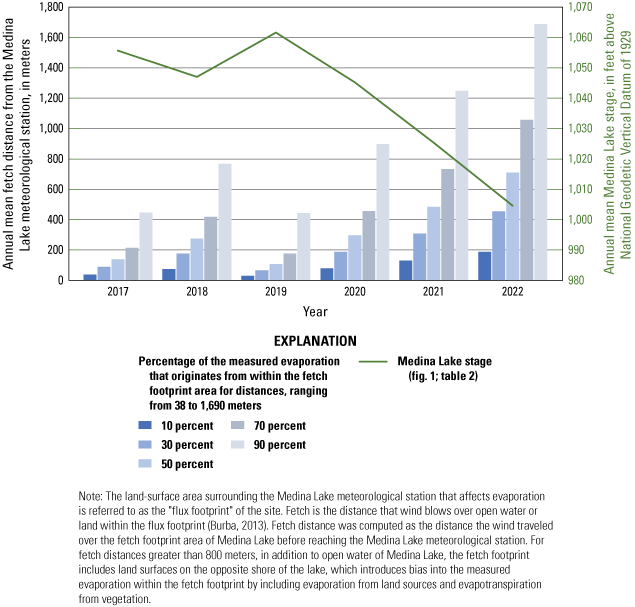
The source-area contribution of the mean annual cumulative evaporation (expressed as percentages of 10, 20, 50, 70, and 90) for the Medina Lake meteorological station near Riomedina, Texas, April 2017–October 2022.
The location of the Medina Lake meteorological station, installed by the USGS on Medina Lake, was selected to provide the EC instruments with good exposure to the open water and prevailing winds (figs. 1 and 3A). Based on the location of the site, when the wind was from the directions between 260 and 360 and 0 and 40 degrees from true north, the footprint was considered to be from a land source, and when the wind was from the directions between 40 and 260 degrees from true north, the footprint is considered to be from an open-water source. For the period of record (April 5, 2017–October 6, 2022), 33 percent of the EC measurements were made when wind directions were from the direction of land and accounted for 18 percent of the total measured evaporation. Sixty-seven percent of the EC measurements were made when the wind direction was from the direction of open water and accounted for 82 percent of the total measured evaporation. Measurements made when the wind was from the direction of land were qualified as estimated evaporation in NWIS. The greater percentage of measured evaporation coming from the direction of open water is because these directions coincide with the prevailing winds during the summer months, when evaporation rates are generally the highest. When the winds are more often from the direction of land, these wind directions most often occur in the winter months, when evaporation rates are generally the lowest.
Evaporation measured at the Medina Lake meteorological station varied with fetch distance, and increases in fetch distance corresponded to decreases in annual mean Medina Lake stage (fig. 4). During the first 4 years of the study (2017–20), it was determined by using the two models built into the EasyFlux software that an estimated 90 percent of the measured evaporation at the Medina Lake meteorological station originated from within about 900 m (about 2,953 ft) of the instrument tower, representing a fetch footprint of mostly open water. However, the Medina Lake stage declined substantially after 2020, and by 2021, the fetch footprint began to greatly expand. By 2021, 90 percent of the measured evaporation originated from an area within 1,250 m (about 4,101 ft) of the fetch distance, and by 2022, the fetch distance increased to a distance of 1,690 m (about 5,545 ft) from the EC instruments (fig. 4). For fetch distances greater than 800 m (about 2,625 ft), the expected fetch footprint includes not only the open water of Medina Lake but also the land surface on the opposite shore of the lake. When the land surface on the opposite shore of the lake is part of the fetch distance, bias is introduced into the measured evaporation within the fetch footprint because evaporation from land sources and evapotranspiration from vegetation are included in the computation of evaporation (fig. 4). Additionally, as lake levels declined, the fetch footprint included exposed lakebed near the evaporation site, potentially biasing the measured evaporation (fig. 3B). Consequently, the measured evaporation from the latter period was not used, and an alternate source of evaporation data was used, as described in the following section.
Evaporation Data Processing
To assess the accuracy of evaporation measured at the Medina Lake meteorological station, the total monthly evaporation measured at site 6 (fig. 1; table 1) was compared to the gross monthly evaporation from the TWDB (TWDB, 2023). For the period April 5, 2017–October 6, 2022, the EC evaporation data were about 36 percent lower than the published TWDB evaporation data. On an annual basis, the EC evaporation estimates were 32, 28, 36, 38, 39, and 48 percent lower during 2017, 2018, 2019, 2020, 2021, and 2022, respectively, compared to the TWDB published estimates. This consistent pattern of lower EC evaporation values compared to the TWDB published estimates is attributed to the steadily decreasing lake levels during 2017–22, resulting in increasing fetch distances and biasing the measured evaporation from open water by including evaporation from land surfaces and evapotranspiration from vegetation within the fetch footprint, respectively (fig. 4).
In a subset of the study period, from April 5, 2017, to September 30, 2020, the lake levels remained relatively high (altitudes greater than 1,040 ft above NGVD 29), and the fetch footprint was mostly open water, within a monthly mean distance of about 800 m or less from the Medina Lake meteorological station. For this same period, USGS monthly evaporation totals were 33 percent less than the TWDB evaporation. This difference is similar to the results of other studies that indicated that measurements of evaporation by the EC method may be under measured by as much as 30 percent (Twine and others, 2000; Wilson and others, 2002; Mauder and Foken, 2006; Foken, 2008).
During the period from October 1, 2020, to the last day that data were collected for the water-budget analysis equation (eq. 4) on October 6, 2022, the lake levels were relatively low (less than 1,040 ft above NGVD 29), and the fetch footprint encompassed land and plant source of evapotranspiration, with mean fetch distances between 1,020 m (3,346 ft) and 2,110 m (6,923 ft) per month from the Medina Lake meteorological station. For this same period, the USGS total monthly evaporation was 51 percent lower than the TWDB evaporation. Therefore, substantial contamination of the USGS measured evaporation was considered likely, and the evaporation data measured during this period was considered unusable.
A regression analysis was performed comparing the TWDB total monthly evaporation to the EC total monthly evaporation for the selected period between April 2017 and September 2020 to determine if the TWDB evaporation data were comparable and would provide a reasonable surrogate that could be used to correct or replace the USGS EC evaporation data. The comparison revealed a good correlation between the TWDB evaporation and the EC evaporation, with the R2 value of 0.94 and the p-value of less than 0.05. Therefore, the mean of the two datasets of daily evaporation was calculated for the period between April 5, 2017, and September 30, 2020, to produce a corrected daily total of EC evaporation (hereinafter referred to as “Eμ”), which was 20 percent more than the original EC evaporation.
For periods when the EC evaporation data were not available (March 3, 2017–April 4, 2017), or considered unusable (October 1, 2020–October 6, 2022), the monthly Eμ totals were compared with the monthly TWDB evaporation totals (slope was 0.87, R2 value was 0.99, the p-value was less than 0.05). A correction factor as a multiplier of 0.87 was then applied to the daily TWDB evaporation (ETWDB), reducing it by 15 percent (ETWDBμ=0.87×ETWDB). The corrected TWDB daily evaporation (ETWDBμ) was then merged with the available Eμ to provide a continuous dataset of daily evaporation for the period March 4, 2017–October 6, 2022, and then used in the calculation of the evaporation term (E) in equation 1.
To calculate evaporation (E) from the Medina and Diversion Lake system for use in the water-budget equation, the daily total evaporation was converted from millimeters into feet, then multiplied by the sum of the daily mean surface areas (acres) of Medina and Diversion Lakes. The lake surface area for Medina and Diversion Lakes was computed using the TWDB stage-volume-area tables for Medina and Diversion Lakes (Sullivan and others, 2003). All measured and corrected evaporation and meteorological values described in this section of the report are published in the USGS NWIS database (U.S. Geological Survey, 2023) and in the companion data release (Slattery and Choi, 2024).
Surface-Water Inflow and Outflow
During the 2017–22 study, the surface-water inflow (SWin) term to the Medina and Diversion Lake system was computed from records collected at two continuous-record streamgages upstream from Medina and Diversion Lakes, USGS streamgaging station 08178980 Medina River above English Crossing near Pipe Creek, Tex. (site 1), and USGS streamgaging station 08179110 Red Bluff Creek at Farm to Market Road 1283 near Pipe Creek, Tex. (site 2; installed on December 5, 2017) (fig. 1; table 1), and from streamflow estimates from the ungaged areas that drain into the Medina and Diversion Lake system. Prior to the installation of site 2, the drainage area upstream from site 2 was part of the ungaged contributing areas. After the installation, streamflow records from site 2 were directly included in SWin.
Streamflow for the ungaged areas was estimated using data collected from three USGS streamgaging stations: 08180586 San Geronimo Creek near Helotes, Tex. (site 3); 08181400 Helotes Creek at Helotes, Tex. (site 4); and 08200977 Middle Verde Creek at State Highway 173 near Bandera, Tex. (site 5) (fig. 1; table 1), and using the drainage-area ratio method suggested by Asquith and others (2006).
The drainage-area ratio method estimates streamflow for an ungaged area using daily streamflow information from a gaged drainage area and accounts for the difference in the drainage areas of the two areas by using the following equation:
whereQungaged
is the estimated daily streamflow for the ungaged area, in cubic feet per day;
Qgaged
is the measured daily streamflow at a gaged location, in cubic feet per day;
Φ
is a bias correction factor; and
Aungaged and Agaged
are the drainage areas for the ungaged and gaged areas, respectively, in square miles.
Before the installation of the site 2 gage on December 5, 2017, the ungaged area was 177 mi2, and it was 119.1 mi2 after the gage was installed. For the simplest drainage-ratio method, assumptions are made that the expected value of the estimated streamflow equals the true streamflow value and the exponent ϕ=1 (Asquith and others, 2006). Thus, the daily estimated streamflow of the ungaged area is directly proportional to the daily streamflow at a gaged station.
Asquith and others (2006) computed the exponent values for the 34 streamflow percentile ranges using daily mean streamflow for 712 streamgages in Texas to account for the effects of streamflow probability on the drainage-area ratio method in the State. For this study, the method was modified to only include 130 streamgages from watersheds with similar topography, geology, and streamflow characteristics compared to the streamgages that monitor inflows to Medina Lake to better represent the local hydrologic characteristics (Slattery and Choi, 2024). The selected 130 streamgages are in 17 counties: Mason, Llano, Burnet, Kimble, Gillespie, Blanco, Travis, Hays, Comal, Kendall, Kerr, Bandera, Real, Edwards, Uvalde, Medina, and Bexar, which often are identified as the Texas Hill Country area (Pegasus Planning, 2023). For this study, the exponent values were calculated for 51 streamflow percentile ranges rather than 34 to provide an exponent value for every 2 percentile increment between 0 and 100 using the daily discharge data from the selected 130 streamgages, from October 1, 1915, to October 15, 2022 (table 2).
Table 2.
Streamflow percentile ranges calculated using the daily discharge data from 130 selected streamgages, October 1, 1915, to October 15, 2022.[NA, not calculated]
Using equation 2, estimated daily streamflow of the ungaged area was calculated from the three gaged stations: site 3 (fig. 1; table 1) with a drainage area of 31.1 mi2; site 4 (fig. 1; table 1) with a drainage area of 15 mi2; and site 5 (fig. 1; table 1) with a drainage area of 38.9 mi2. The mean of the three streamflow estimates was selected as the final daily streamflow into Medina and Diversion Lakes from the ungaged areas.
Daily mean streamflow data collected during 2017–22 and used in the calculation of SWin and SWout are published in the USGS NWIS database (U.S. Geological Survey, 2023). SWout from the Medina and Diversion Lake system was computed by summing the daily streamflow values recorded at two USGS streamgaging stations: 08180000 Medina Irrigation Canal near Riomedina, Tex. (site 8), and 08180500 Medina River near Riomedina, Tex. (site 10) (fig. 1; table 1, respectively). The daily mean streamflows, the daily estimated discharge of the ungaged areas, and the calculated SWin and SWout terms are provided in Slattery and Choi (2024).
Reservoir Storage
Reservoir storage for Medina Lake was computed from continuous lake stage recorded at USGS streamgaging station 08179500 Medina Lake near San Antonio, Tex. (site 7), whereas reservoir storage for Diversion Lake was computed from continuous lake stage recorded at USGS streamgaging station 08180010 Diversion Lake near Riomedina, Tex. (site 9) (fig. 1; table 1), by using the TWDB stage-volume-area tables for each lake (Sullivan and others, 2003). The TWDB stage-volume-area tables for each lake were entered into the USGS NWIS database (U.S. Geological Survey, 2023) to produce a stage-volume relation and continuous calculation of storage from the lake stages. The daily storage is calculated as the sum of the daily mean storage values for Medina and Diversion Lakes. Daily changes in lake storage (∆S) were computed as the difference between the amount of current-day storage and the amount of previous-day storage. Positive values of ∆S represent an increasing amount of water being held in storage in the Medina and Diversion Lake system. Negative values of ∆S represent an increasing amount of water in the Medina and Diversion Lake system being released from storage.
Calculated Seepageout
The calculated Seepageout from the Medina and Diversion Lake system provides the best estimate of actual recharge to the Edwards and Trinity aquifers, and it was used as the benchmark for comparing with other methods of estimating recharge. Seepageout was computed as the residual of all other terms in the water-budget equation (eq. 1) to estimate the seepage loss to the groundwater system underlying the Medina and Diversion Lake system. Seepageout represents water that is not accounted for by all other terms of the water-budget equation, including any unrecognized errors. Positive values of Seepageout represent losses from the lake system to the groundwater system (Lambert and others, 2000). Negative Seepageout values represent gains to the lake system from the groundwater system. The daily calculated Seepageout values and the individual terms of the water-budget equation used in equation 1 are included in Slattery and Choi (2024).
Contributions From Each Term of the Water-Budget Equation
The calculated Seepageout (eq. 1) is the key result of the water-budget analysis as explained in the “Groundwater Recharge” section. For the period March 4, 2017–October 6, 2022, the daily calculated Seepageout ranged from −4,291 to 4,705 acre-ft, with a mean of 110 acre-ft/d (fig. 5; Slattery and Choi, 2024); both the minimum and the maximum values occurred during times of precipitation runoff. A lag between large inflows to the lake system and changes in the Medina Lake stage and groundwater-level altitudes cause brief periods when the Seepageout is negative; these lags result in transient periods of unaccounted lake inflows or groundwater fluxes. A comparison of the contribution of each of the terms to the water-budget equation is summarized for each year of the study (tables 3 and 4). Table 3 provides a comparison of the annually calculated sum of the individual terms of the water-budget equation, in acre-feet. The largest contributions of individual terms of the water-budget equation to the Medina and Diversion Lake system were from SWin, SWout, and Seepageout, accounting for 357,810; 309,900; and 226,300 acre-ft, respectively. P accounted for 61,280 acre-ft, E accounted for 102,320 acre-ft, and change in lake storage (ΔS) accounted for −219,200 acre-ft. Table 4 provides a summary of the annual relative contribution as a percentage of the total of each of the individual terms of the water-budget equation. For the Medina and Diversion Lake system, SWin, SWout, and ΔS were the major terms of the water-budget equation, accounting for 21.1, 22.2, and −21.9 percent, respectively. P accounted for 4.1 percent, E accounted for 7.3 percent, and Seepageout accounted for 17.5 percent.
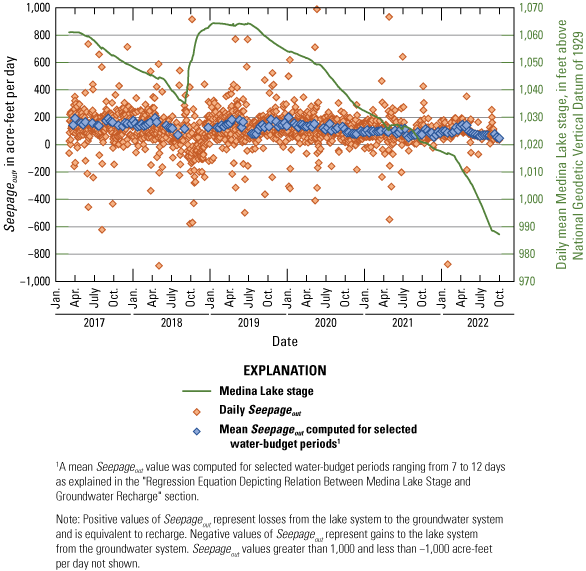
The daily calculated Seepageout values from the water-budget equation and the mean of selected water-budget periods of Seepageout from the Medina and Diversion Lake system, Bandera, Bexar, and Medina Counties, Texas, March 4, 2017–October 6, 2022.
Table 3.
Summary of the contribution of the individual terms of the water-budget equation to the Medina and Diversion Lake system, Bandera, Bexar, and Medina Counties, Texas, March 4, 2017–October 6, 2022.[N, number of days used in the water-budget calculation; P, precipitation; E, evaporation; SWin, surface-water inflow; SWout, surface-water outflow; ΔS, change in lake storage; Seepageout, seepage lost or seepage gained from the Medina and Diversion Lake system]
Table 4.
Summary of the relative contribution of the individual terms of the water-budget equation to the Medina and Diversion Lake system, Bandera, Bexar, and Medina Counties, Texas, March 4, 2017–October 6, 2022.[N, number of days used in the water-budget calculation; P, precipitation; E, evaporation; SWin, surface-water inflow; SWout, surface-water outflow; ΔS, change in reservoir storage; Seepageout, seepage lost or seepage gained from the Medina and Diversion Lake system]
Measurement Error for the Terms in the Water-Budget Equation
Water-budget terms that are calculated from more than one measured variable might reflect an accumulation of errors in the measured terms (Lee and Swancar, 1997). If a term is derived as the sum or difference of other measured terms, then the potential error is the sum of the variances in the measured terms (Winter, 1981). For the water-budget equation, each measured term used to calculate Seepageout was assigned a percentage error to define the confidence limits around the measured values. The percentage error (%ei) was assigned to each term in the water-budget equation based on the method of measurement, accuracy, precision of the instrumentation, and the presumed quality of the hydrologic record (Lee and Swancar, 1997). Records rated as good were assigned a percentage error (%ei) of plus or minus (±) 8 percent; records rated as fair were assigned a percentage error of ±10 percent, and records rated as poor were assigned a percentage error of ±15 percent (Novak, 1985, p. 65).
Records for surface-water inflows (SWin) measured at sites 1 and 2, records for surface-water outflows (SWout) measured at sites 8 and 10, and records for precipitation (P) measured at site 6 (fig. 1; table 1) were rated as good with a percentage error of ±8 percent. Records for change in lake storage (ΔS) from sites 7 and 9 were rated as fair with a percentage error of ±10 percent, and evaporation data (E) from site 6 were rated as poor with a percentage error of ±15 percent (Novak, 1985, p. 65). Incorporating the individual errors for each of the measured terms in the water-budget equation, the net error was calculated as the square root of the sum of the individual errors for each term (eq. 3):
whereeSeepageout
is the maximum probable error of the Seepageout term;
P
is the daily precipitation, in acre-feet;
%eP
is percentage error of daily P;
E
is the daily evaporation from the lakes, in acre-feet;
%eE
is percentage error of daily E;
SWin
is the daily surface-water inflow to the lakes, in acre-feet;
%eSWin
is percentage error of daily SWin;
SWout
is the daily surface-water outflow to the lakes, in acre-feet;
%eSWout
is percentage error of daily SWout;
ΔS
is the change in lake storage, in acre-feet; and
%eΔS
is percentage error of daily ΔS.
The monthly and annual standard error of the Seepageout term was also calculated. The standard error is the standard deviation of the daily calculated Seepageout values for a given month or year, divided by the square root of the number of days in the month or year. The standard error represents the standard deviation of the mean within a dataset and serves as a measure of the variation of random variables, providing a measurement of the spread in the dataset. The smaller the spread, the more accurate the dataset (Ott, 1993). Summaries of the net eSeepageout term, as well as the calculated standard error of the Seepageout term, are discussed in more detail in the “Measurement Error Associated With the Calculated Recharge” section of this report. The daily calculated net eSeepageout data are included in Slattery and Choi (2024).
Groundwater Recharge
For this study, seepage loss from the Medina and Diversion Lake system was assumed to provide recharge to the Edwards aquifer and the upper zone of the Trinity aquifer, and the recharge was calculated or estimated using three methods as described in the “Purpose and Scope” section of this report. The first method compiles the daily calculated Seepageout values from the water-budget equation (eq. 1) into monthly and annual summaries of calculated recharge to the Edwards aquifer and the upper zone of the Trinity aquifer (tables 5 and 6) during March 4, 2017–September 30, 2022, with 2017 and 2022 being partial years of record for the calculated recharge. The second method estimates recharge to the Edwards aquifer and the upper zone of the Trinity aquifer using a new log-log WLS regression equation that relates the stage of Medina Lake to seepage losses from the Medina and Diversion Lake system. Complete years of stage records are available during 2017–22. The equation was used to estimate monthly and annual recharge to the Edwards aquifer and the upper zone of the Trinity aquifer during January 2017–December 2022. The third method is the estimated recharge to the Edwards aquifer and the upper zone of the Trinity aquifer by using the Puente (1978) method, which is presented for comparison with the first and second methods described herein (Puente, 1978; Slattery and Choi, 2023).
Calculated Recharge Using a Water-Budget Approach (Method 1)
Using equation 1, the daily Seepageout was computed for each day during the study and over a range of hydrologic conditions, with Medina Lake stages ranging from 987.20 ft above NGVD 29 (7.4 percent of the conservation pool) to 1,064.43 ft above NGVD 29 (100 percent of the conservation pool) (fig. 5). When the sum of Seepageout is calculated over a span of days, and for the purpose of this study, the calculated Seepageout represents the most accurate accounting of losses from the Medina and Diversion Lake system to the Edwards aquifer and the upper zone of the Trinity aquifer. The calculated Seepageout more closely accounts for the antecedent hydrological conditions in the area surrounding the Medina and Diversion Lake system and the rate of losses affected by differences in hydrostratigraphy at different stages of Medina Lake. To minimize errors associated with disequilibrium within the system and to adequately account for the traveltime of the water through the system, the daily calculated Seepageout values from the water-budget equation are summed as a monthly and annual total of calculated recharge (tables 5 and 6).
Regression Equation Depicting Relation Between Medina Lake Stage and Groundwater Recharge (Method 2)
Results from the 2016 study (Asquith and Slattery, 2016) culminated in a log-log WLS regression equation with prediction intervals and better defined the relation between the Medina Lake stage and recharge compared to the relation between the Medina Lake stage and recharge determined using the Puente method. The study also identified periods where the relation between the Medina Lake stage and the groundwater recharge estimates were not well defined (Asquith and Slattery, 2016). For this study, water-budget periods were calculated over a wide range of stages on Medina Lake, ranging from 987.44 to 1,064.35 ft above NGVD 29, providing a range in lake stages that will better define the statistical relation between the Medina Lake stage and the groundwater recharge estimates and help validate the statistical relation published in 2016.
The selected water-budget periods were calculated from the daily Seepageout values, during which time the water-budget terms were relatively stable, and the effects of precipitation, stormwater runoff, and changes in reservoir storage were minimal. To identify the stable periods, the mean of the Seepageout term was calculated for water-budget periods of 10 days, along with the standard deviation of the Seepageout values. The coefficient of variation is defined as the ratio of the standard deviation to the mean for a given dataset (Helsel and others, 2020). The coefficient of variation was computed for Seepageout values for each water-budget period. If the coefficient of variation was greater than 0.90, then the period was excluded. Additional periods of 7–12 days where the coefficient of variation was less than or equal to 0.90 were also included from the remaining days. The selection of such periods would presumably minimize errors associated with disequilibrium within the system. Periods of less than 7 days were not evaluated. Periods of less than 7 days would not adequately account for the traveltime of the water through the system and would not provide a reasonable sample size for the computation of the daily calculated Seepageout value from the water-budget equation. A total of 144 water-budget periods were thus selected between March 15, 2017, and October 6, 2022, representing about 85 percent of the period of record (fig. 5). Data from the 144 selected water-budget periods were then appended to a dataset compiled during a similar previous study (Asquith and Slattery, 2016; Slattery and Miller, 2017) and include the statistical summaries and errors computed for each of the selected water-budget periods. The dataset is available in Slattery and Choi (2024).
For the statistical analysis, data from four time periods (1955–64, 1995–96, 2001–02, and 2017–22) were combined into one dataset (a total of 271 data points) (Asquith and Slattery, 2016; Slattery and Miller, 2017). The daily calculated Seepageout values range from 6.22 to 199.68 acre-ft/d, with the altitude of the Medina Lake stage ranging from 963.27 to 1,064.35 ft above NGVD 29.
The statistical analysis of Medina Lake stage and Seepageout data was done by using R scripts (Wood, 2006, 2016a, b; R Core Team, 2023) developed as part of the 2016 study (Asquith and Slattery, 2016; Slattery and Miller, 2017) and modified to incorporate the additional 2017–22 dataset (Slattery and Choi, 2024). A log-log WLS regression equation, including the 75-percent and 90-percent prediction intervals associated with the equation, was derived to model the relation between the Medina Lake stage and Seepageout data (Helsel and others, 2020). The resulting water-budget equation is expressed as the change in Seepageout:
whereδSeepageout
is the estimated recharge from the Medina and Diversion Lake system to the Edwards aquifer and upper zone of the Trinity aquifer, in acre-feet per day;
ML
is the Medina Lake stage, in feet above NGVD 29; and
δ
is a bias correction factor that is set to 1.000 or 1.081 during the retransformation of median and mean Seepageout values, respectively, from log units back to linear units, respectively (a bias correction factor set to 1.000 indicates no correction was applied).
The regression equation is graphically depicted in figure 6. The adjusted R2 value for the equation is 0.82, and the residual standard error (in logarithmic, base-10 scale) is 0.14. Faraway (2005, 2006) and Helsel and others (2020) provide detailed descriptions of the methods used to derive the regression equations, adjusted R2, residual standard errors, and prediction intervals for regression equations (fig. 6). The results obtained from the log-log WLS regression equation shown in figure 6 were transformed into their original units using the Duan (1983) smearing estimate method, which is explained in detail by Helsel and others (2020). The abbreviations applicable to mathematical functions and statistical terms from the R regression output are provided (fig. 7A), along with the R regression outputs of the log-log WLS regression equation (fig. 7B). The log-log WLS regression equation (eq. 4) developed for the Medina and Diversion Lake system relates the stage in Medina Lake to the seepage loss from the entire lake system (figs. 6 and 7B).
The log-log WLS regression equation (eq. 4) (figs. 6 and 7B) indicates that the estimated seepage loss (δSeepageout) increases nonlinearly as the stage in Medina Lake increases, applicable for stages between 963 and 1,059.13 ft above NGVD 29. For stages less than 963 ft above NGVD 29, there are few measured observations, and the relation between the Medina Lake stage and δSeepageout is poorly defined. Using equation 4, when the Medina Lake stage reaches 1,059.13 ft above NGVD 29, a maximum δSeepageout value of 127.32 acre-ft/d is computed; this value then begins to decline as the Medina Lake stage becomes greater than 1,059.13 ft above NGVD 29, and equation 4 is, therefore, invalid. Decreasing seepage loss occurring when the Medina Lake stage was rising was not observed in the measured data, except during unusually wet periods when the rocks that contain the Edwards and Trinity aquifers become saturated and cannot accept additional recharge (for example, from August 2018 through November 2018, a period of saturated conditions was noted).
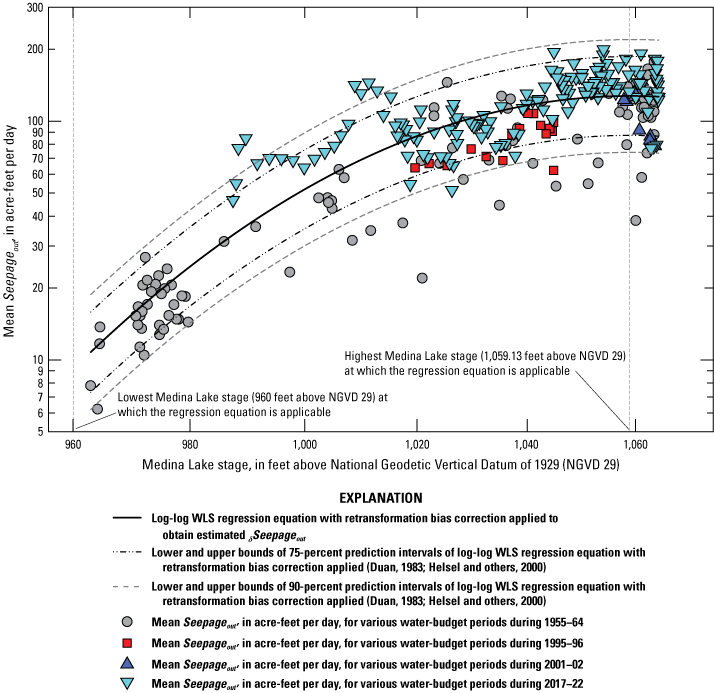
The relation between the Medina Lake stage and recharge estimated using equation 4 (δSeepageout) for selected water-budget periods during 1955–64, 1995–96, 2001–02, and 2017–22 (Slattery and Choi, 2024), when water-budget data were collected from the Medina and Diversion Lake system and modeled with a log-log weighted least-squares (WLS) regression equation with prediction intervals.
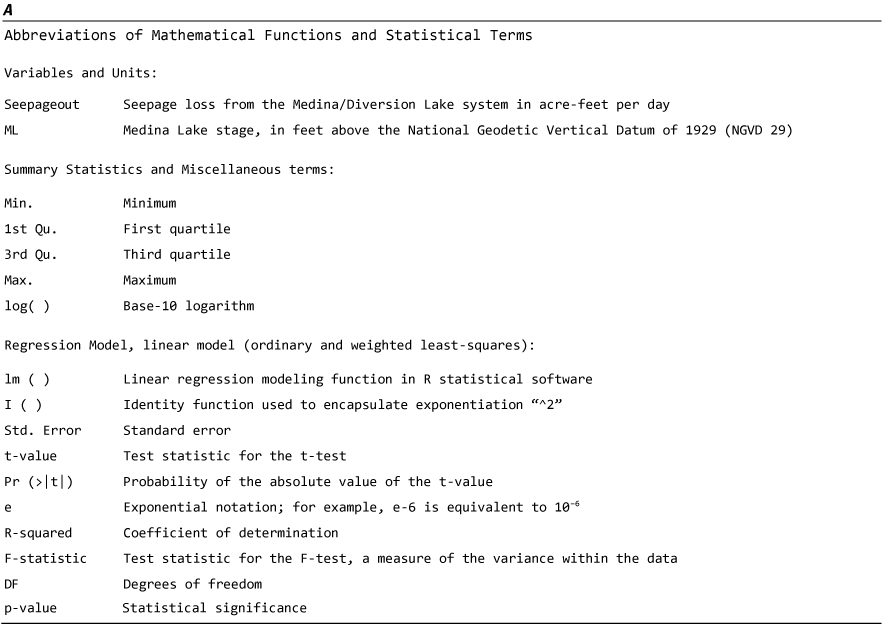
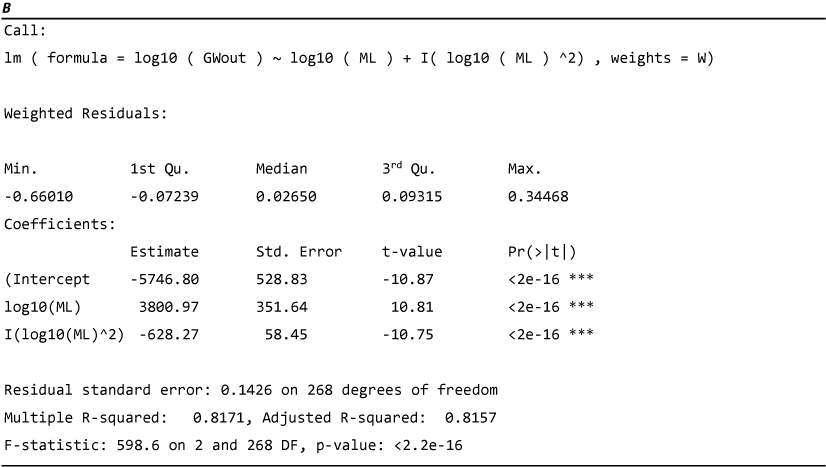
A, Abbreviations of mathematical functions and statistical terms related to B, the weighted least-squares (WLS) regression dependent on logarithmically transformed data (depicted in fig. 6) as produced in output by the R statistical software (log-log weighted least squares) (R Core Team, 2023) using data from Slattery and Choi (2024) (fig. 5); detailed discussion of these technical terms is available in Helsel and others (2020).
Uncertainties not addressed by the statistical reanalysis may be associated with the characteristics of the data themselves. For example, few data are available for certain ranges of Medina Lake stage, particularly for stages less than 970 ft above NGVD 29 and for stages between 980 and 1,015 ft above NGVD 29; the lack of data for these stage ranges is more pronounced for the data collected during 1995–96 and 2001–02, when the Medina Lake stage varied little compared to the larger ranges in stages recorded during 1955–64 and 2017–22 (fig. 6). Differences in data-collection techniques are an additional source of data uncertainty. The water-budget data from the earliest period (1955–64) were collected using different techniques compared to the more recent data, so the accuracy of the Seepageout data may have varied over time. For example, evaporation during 1955–64 was determined from published evaporation tables by the TWDB (TWDB, 2024), whereas the more recent evaporation from 1995–96, 2001–02, and 2017–22 was determined by using data obtained from USGS-operated meteorological stations temporarily installed on or near Medina Lake.
Data collected during 1995–96 and 2001–02 exhibit a similar distribution compared to data collected from 1955–64 for the same Medina Lake stages. It is reasonable, therefore, to assume that the more recent water-budget analyses, based on the more recent data, would produce results for lower stages (less than 1,030 ft above NGVD 29) that are consistent with the results produced using the data from 1955–64. However, data from 2017–22 indicate a greater mean Seepageout compared to the three earlier water-budget periods for the same Medina Lake stages, except for Medina Lake stages of about 1,000 ft above NGVD 29 and for stages between 1,020 and 1,040 ft above NGVD 29.
Additional sources of uncertainty not addressed in this regression analysis include the possibilities of serially correlated data, unaccounted for antecedent hydrological conditions, and differences in hydrostratigraphy at different Medina Lake stages that might affect Seepageout. Serial correlation is the dependence or correlation between residuals for values collected in a time series (Helsel and others, 2020). For the Medina Lake stage data, the possibility of serial correlation means that stage values collected consecutively over time might not be independent. Instead of varying independently, the data might change similarly in response to monthly and annual scale changes in hydrometeorological processes and are, therefore, not randomly distributed in time (Helsel and others, 2020). Accounting for the effects of serial correlation would be difficult and would require more data than available in this study. The antecedent hydrological conditions in the area surrounding the Medina and Diversion Lake system are also not represented in the regression equation. Also not specifically accounted for in the regression equation are differences in hydrostratigraphy that might affect Seepageout at different stages in either Medina or Diversion Lake (Lambert and others, 2000). Errors associated with the calculation of the Seepageout term, which account for the potential errors of the individual terms, are summarized in the “Measurement Error Associated With the Calculated Recharge” section of this report.
Puente Method of Estimating Annual Groundwater Recharge From Medina Lake (Method 3)
Published estimates of annual recharge to the Edwards aquifer from the Medina River drainage area during 1934–2022 range from 6,300 acre-ft (1956) to 104,000 acre-ft (1960), with a mean of 61,400 acre-ft/yr (Slattery and Choi, 2023, basin 5) and are based on methodology published by Puente (1978). This method assumes all lake losses recharge the Edwards aquifer before some of the water ultimately recharges the Trinity aquifer.
To estimate recharge to the Edwards aquifer from the Medina and Diversion Lake system, Puente (1978) used a mass-balance analysis method (inflow minus outflow) to account for all inflow to and outflow from Medina Lake and the Medina and Diversion Lake system, including evaporation from the lake surfaces. Using base flow data collected during 1930 as part of a Medina River seepage investigation, Puente (1978) published a set of correlation curves relating groundwater recharge from the Medina and Diversion Lake system to the reservoir contents (storage) in Medina Lake. Puente (1978) reported that recharge during rising lake stages (increasing storage) was greater than recharge during falling stages (decreasing storage); these differences in recharge were attributed to bank-storage losses during rising lake stages and return flows from bank storage during falling stages. Figure 8 contains two modified curves from the curves published by Puente (1978) by substituting Medina Lake stage for storage.
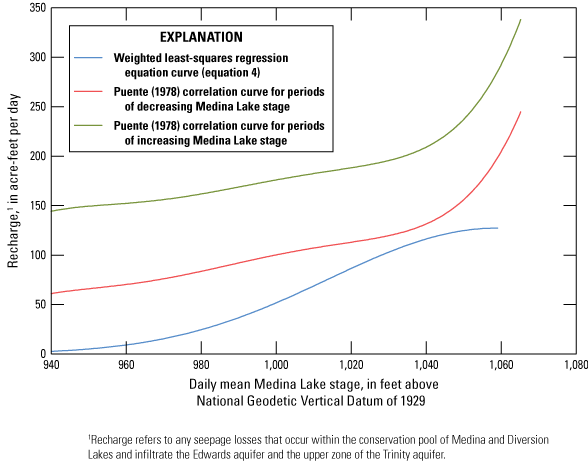
The recharge–Medina Lake stage-volume relation used to estimate recharge from the Medina and Diversion Lake system, based on the log-log weighted least-squares regression equation (eq. 4) and the Puente (1978) method.
Calculated Total Monthly and Annual Recharge From Seepageout
The total monthly recharge values calculated from Seepageout are variable, ranging from −693 acre-ft per month, representing a gain to the lake system from unaccounted for inflows of surface water or groundwater, to 5,490 acre-ft per month, representing recharge from the lake system to the Edwards aquifer and the upper zone of the Trinity aquifer. The total monthly calculated recharge values during March 2017–September 2022 are summarized in table 5 and shown in figure 9. The total annual recharge values calculated from Seepageout are also listed in tables 5 and 6 and shown in figure 10.
Some of the variability in the monthly calculated recharge values is the result of variable hydrologic conditions. For example, months when the recharge rates were relatively low often corresponded to increases in Medina Lake stage values. During August–October 2018, when the calculated monthly recharge was small, and during November 2018, when the monthly calculated Seepageout value was negative, the calculated Seepageout rates were likely affected by rejected recharge where the rocks that contain the Edwards and Trinity aquifers were saturated, as described in the “Geology and Hydrostratigraphy” section of this report. Months when the calculated recharge rates were relatively low were also common when the Medina Lake stage was less than 1,045 ft above NGVD 29 (fig. 9; tables 5 and 7). Months of higher calculated recharge rates generally coincided with hydrologically stable periods with relatively little precipitation and low base flows in the streams impounded by the lake system when the Medina Lake stage was equal to or greater than 1,045 ft above NGVD 29 (fig. 9; tables 5 and 7).
For years with complete periods of record, the calculated annual total recharge calculated from Seepageout ranged from 34,610 acre-ft in 2021 to 50,880 acre-ft in 2019. During 2019, Medina Lake was nearly full, and the stage values for Medina Lake were consistently among the highest observed for the study period (fig. 10; tables 5, 6, and 7).
Table 5.
Summary of the monthly and annual total recharge for the Medina and Diversion Lake system in Bandera, Bexar, and Medina Counties, Texas, 2017–22.[Method: Calculated, recharge values calculated using the water-budget equation (eq. 1); log-log WLS, recharge values estimated using the log-log weighted least-squares regression (eq. 4); Puente, recharge values estimated using the Puente method (Puente, 1978); in this report, recharge is any seepage losses that occur within the conservation pools of Medina and Diversion Lakes and infiltrate the Edwards aquifer and the upper zone of the Trinity aquifer. Abbreviations: --, data were not collected; NA, not calculated; log, base-10 logarithm; WLS, weighted least squares]
The log-log weighted least-squares (WLS) regression method is described in Helsel and others (2020).
Table 6.
Summary of annual total recharge, in acre-feet per year, for the Medina and Diversion Lake system in Bandera, Bexar, and Medina Counties, Texas, 2017–22.[Method: Calculated, recharge values calculated using the water-budget equation (eq. 1); log-log WLS, recharge values estimated using the log-log weighted least-squares regression (eq. 4); Puente, recharge values estimated using the Puente method (Puente, 1978); in this report, recharge is any seepage losses that occur within the conservation pools of Medina and Diversion Lakes and infiltrate the Edwards aquifer and the upper zone of the Trinity aquifer. Abbreviations: NA, not calculated; log, base-10 logarithm; WLS, weighted least squares]
| Method | Recharge, in acre-feet per year | |
|---|---|---|
| Total for years 2017–22 | Total for March 2017–September 2022 | |
| Calculated | NA | 225,400 |
| log-log WLS1 | 234,690 | 224,310 |
| Puente | 364,680 | 342,080 |
The log-log weighted least-squares (WLS) regression method is described in Helsel and others (2020).
Table 7.
Summary of the altitude of monthly and annual mean lake stage, in feet above the National Geodetic Vertical Datum of 1929, for Medina Lake at U.S. Geological Survey streamgaging station 08179500 Medina Lake near San Antonio, Texas, 2017–22.Measurement Error Associated With the Calculated Recharge
The maximum probable error (eSeepageout) (eq. 3) associated with the calculated recharge on a monthly and annual basis is summarized in table 8. The monthly maximum probable error of the calculated recharge ranged from 172 to 8,200 acre-ft. The smallest maximum probable error occurred in February 2022, representing a maximum probable error of ±11 percent of the calculated recharge for the month. The largest maximum probable error occurred in September 2018 and represented a maximum probable error of ±506 percent of the calculated recharge for the month. Smaller probable errors occurred when hydrologic conditions were relatively stable (that is, there was an absence of large storms), whereas higher probable errors occurred during periods of excess precipitation and runoff (table 8). On an annual basis, except for 2018, the maximum probable errors ranged from ±5,270 to ±11,200 acre-ft, representing a maximum probable error of approximately ±17 to ±26 percent of the calculated annual recharge. In 2018, the maximum probable error was ±17,700 acre-ft, representing a maximum probable error of ±56 percent of the calculated annual recharge.
Table 8 also lists the standard error of the monthly and annual calculated recharge values. The monthly standard errors of the calculated recharge ranged from 1.60 to 262 acre-ft. The smallest standard error occurred in July 2022, representing a standard error of less than ±1 percent in the calculated recharge. The largest standard error occurred in September 2018, representing a standard error of ±16 percent in the calculated recharge. Months where the standard errors of the calculated recharge were smaller occurred during stable hydrologic conditions, whereas months where the standard error was higher occurred during less stable hydrologic conditions when there was appreciable precipitation and runoff (table 5). The annual standard errors ranged from ±4.36 to ±23.7 acre-ft, representing a standard error of less than ±1 percent of the total annual recharge (tables 5, 6, and 8).
Table 8.
Maximum probable error and standard error of the calculated recharge on a monthly and annual basis, Medina and Diversion Lake system, Bandera, Bexar, and Medina Counties, Texas, 2017–22.[--, data were not collected]
Recharge is any seepage loss that occurs within the conservation pools of Medina and Diversion Lakes and infiltrates the Edwards aquifer and the upper zone of the Trinity aquifer.
The maximum probable error (±eSeepageout) as calculated from equation 3 (Winter, 1981; Lee and Swancar, 1997) represents the maximum probable error of the calculated recharge.
The standard error is the standard deviation of the daily calculated Seepageout values for a given month or year, divided by the square root of the number of days in the month or year (Ott, 1993) and represents the standard error of the calculated recharge.
Estimated Monthly and Annual Recharge From the Weighted Least-Squares Regression Equation
The estimated monthly and annual totals for recharge during January 2017–December 2022 were estimated using the WLS regression equation (eq. 4) (figs. 9 and 10; tables 5 and 6). The monthly and annual WLS regression estimated recharge totals are shown in figures 9 and 10, respectively.
The monthly and annual recharge totals estimated by using equation 4 (WLS estimated recharge) are less variable compared to the monthly and annual calculated recharge totals. The WLS regression equation monthly recharge rates ranged from 933 acre-ft per month in November and December 2022 to 3,950 acre-ft per month in January and June 2017 and January, March, May, July, August, and October 2019 (fig. 9; table 5). The WLS estimated recharge rates remained nearly constant when the Medina Lake stage ranged from approximately 1,040 to 1,064 ft above NGVD 29 and steadily declined to between 1,010 and 1,040 ft above NGVD 29, with a greater rate of decline observed when the Medina Lake stage decreased to less than 1,010 ft above NGVD 29 (figs. 6 and 10; tables 5 and 7).
The total annual WLS estimated recharge ranged from 19,460 acre-ft in 2022, when the annual mean Medina Lake stage was at its lowest level for the study period, to 46,460 acre-ft in 2019, when the annual mean Medina Lake stage was at its highest levels for the study period (fig. 10; tables 5 and 7). Between 2017 and 2020, WLS estimated recharge remained nearly constant, ranging from 43,940 to 46,460 acre-ft, coinciding with years when the annual mean Medina Lake stage was between 1,045 and 1,062 ft above NGVD 29. The WLS estimated annual recharge decreased by approximately 20 percent in 2021 when the annual mean Medina Lake stage was 1,025 ft above NGVD 29 and decreased again by approximately 40 percent in 2022 when the annual mean Medina Lake stage was 1,000 ft above NGVD 29 (fig. 10; tables 5 and 7).
Estimated Monthly and Annual Recharge—Puente Method
The monthly and annual recharge estimated using the Puente method, as published by the USGS (Slattery and Choi, 2023) (figs. 9 and 10; table 5), is described in the “Puente Method of Estimating Annual Groundwater Recharge From Medina Lake” section. The estimated recharge rates are reported as recharge exclusively to the Edwards aquifer, but for the purpose of this study, recharge estimated by the Puente method is considered as recharge to both the Edwards aquifer and the upper zone of the Trinity aquifer.
The monthly recharge estimated using the Puente method ranged between 2,630 and 9,410 acre-ft per month. The month with the lowest recharge rate (December 2022) (fig. 9; table 5) coincides with the month of the lowest mean Medina Lake stage and with falling lake-stage conditions. The month with the highest recharge rate coincides with the highest monthly mean Medina Lake stage (December 2018), and with rising lake stage conditions. The annually estimated recharge rates by the Puente method ranged from 37,320 acre-ft in 2022, when the lake stage was at its lowest level and declining, to 86,830 acre-ft in 2019, when the lake stage was at its highest level and rising (fig. 10; tables 5 and 6).
Comparison of Recharge Methods
The total monthly recharge estimated using the WLS and the Puente method of estimating recharge were compared to the calculated recharge during two periods: (1) when the Medina Lake stage was rising and (2) when the Medina Lake stage was steady or falling. As described in the section “Calculated Seepageout,” the calculated Seepageout is considered to represent the most accurate accounting of the seepage losses from the Medina and Diversion Lake system that provide recharge to the Edwards aquifer and the upper zone of the Trinity aquifer.
Comparisons were made between months when the mean Medina Lake stages were equal to or greater than 1,045 ft above NGVD 29 and months when the mean Medina Lake stages were less than 1,045 ft above NGVD 29. At stages equal to or greater than 1,045 ft above NGVD 29, there is contact between the waters of Medina Lake and the permeable rocks of the Edwards Group that contain the Edwards aquifer; this contact between the lake waters and the permeable rocks that contain the Edwards aquifer is conducive to seepage losses that recharge the groundwater system. As the Medina Lake stages decrease to less than 1,045 ft above NGVD 29, rates of recharge to the Edwards aquifer and the upper zone of the Trinity aquifer decrease because the lake waters are no longer in contact with the rocks that compose the Edwards Group.
Comparison of the Weighted Least-Squares Estimated Recharge and Calculated Recharge Methods
The WLS estimated total recharge was compared to the calculated total recharge for the March 2017–September 2022 period. The WLS estimated total recharge was 0.5 percent less than the calculated recharge during March 2017–September 2022. The total WLS estimated recharge during March 2017–September 2022 was 224,310 acre-ft, whereas the total calculated recharge was 225,400 acre-ft (table 6).
The largest differences between the WLS estimated recharge and the calculated recharge occurred in months with rising Medina Lake stage that coincided with higher precipitation amounts and greater discharges; during these months, the WLS estimated recharge remained relatively constant, but the calculated recharge was much lower for reasons described in the section “Calculated Total Monthly and Annual Recharge From Seepageout” (fig. 9; tables 5 and 7). The smaller differences between the WLS estimated and calculated recharge occurred during months when the stage of Medina Lake was steady or declining. Months when the stage of Medina Lake was steady or declining coincided with hydrologically stable periods with relatively small amounts of precipitation and base-flow conditions in the Medina River upstream from Medina Lake. The total WLS estimated recharge during September 2018–June 2019, when the Medina Lake stage was generally rising, was 38,250 acre-ft, which was about 24 percent more than the total calculated recharge of 30,750 acre-ft during this period. For months of steady or falling lake-stage conditions (March 2017–August 2018 and July 2019–September 2022), the total WLS estimated recharge was 185,880 acre-ft, which was about 4.5 percent less than the total calculated recharge of 194,650 acre-ft. Only a small difference was observed between the WLS estimated recharge and the calculated recharge when the Medina Lake stages were equal to or greater than 1,045 ft above NGVD 29 and at Medina Lake stages less than 1,045 ft above NGVD 29.
A large difference between the WLS estimated recharge and the calculated recharge was also observed in 2022. During 2022, the Medina Lake stage decreased to less than 1,020 ft above NGVD 29 then continued to steadily decline further (table 7). The large difference between the WLS estimated recharge and the calculated recharge when the Medina Lake stage was less than 1,020 ft above NGVD 29 might indicate a lower limit to the WLS regression equation where the relations between the Medina Lake stage and the groundwater recharge estimates are not well defined. At stages less than approximately 1,020 ft above NGVD 29, fewer water-budget periods are available for use in the statistical regression analysis compared with periods when stages are greater than 1,020 ft above NGVD 29 (fig. 6; table 5).
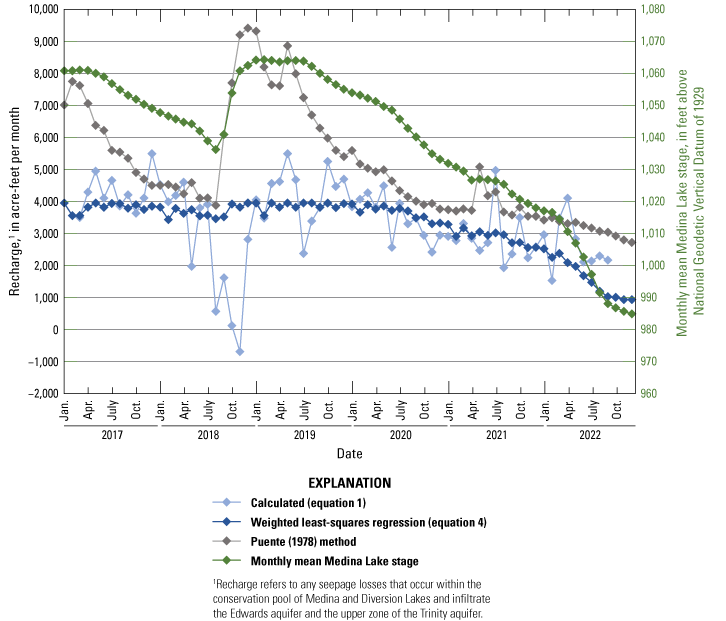
Monthly recharge from the Medina and Diversion Lake system as calculated using the residual of the water-budget equation (eq. 1) (March 2017–September 2022), as estimated using the log-log weighted least-squares regression equation (eq. 4) (January 2017–December 2022), and as estimated using the Puente (1978) method (January 2017–December 2022), and also including the altitude of monthly mean Medina Lake stage, Bandera, Bexar, and Medina Counties, Texas.
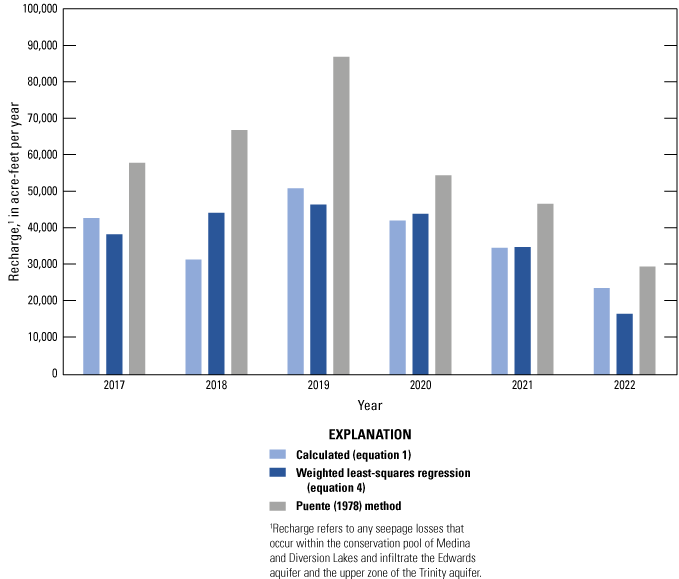
Annual recharge from the Medina and Diversion Lake system during March 2017–September 2022 as calculated using the residual of the water-budget equation (eq. 1), as estimated using the log-log weighted least-squares regression equation (eq. 4), and as estimated using the Puente (1978) method.
Comparison of the Puente Method of Estimating Recharge to the Calculated Recharge Method
The Puente method estimated total recharge was compared to the calculated total recharge for the March 2017–September 2022 period. During this period, the Puente method estimated total recharge was 342,080 acre-ft. This is about 52 percent more than the calculated recharge of 225,400 acre-ft (table 6).
The largest differences between the Puente method estimated recharge and the calculated recharge (fig. 9; tables 5 and 7) were measured in months when large amounts of stormwater runoff and the Medina Lake stage was rising. The smaller differences between the Puente method estimated recharge and the calculated recharge occurred during months of steady or declining Medina Lake stages coinciding with hydrologically stable conditions. The Puente method estimated recharge for months with rising Medina Lake stages (September 2018–June 2019) was about 82,020 acre-ft, which is about 167 percent more than the calculated total monthly recharge of 30,750 acre-ft for the same period. For months of steady or falling lake-stage conditions in Medina Lake (March 2017–August 2018 and July 2019–September 2022), the Puente method estimated total monthly recharge was 260,060 acre-ft or about 34 percent more than the calculated total monthly recharge of 194,649 acre-ft.
Weighted Least-Squares Estimated Recharge Compared With the Puente Method Estimated Recharge
The WLS estimated total recharge was compared to the Puente method estimated total recharge calculated for the January 2017–December 2022 period. The total WLS estimated recharge was 234,690 acre-ft, whereas the total Puente method estimated recharge was 364,680 acre-ft (fig. 10; table 6), representing a 43 percent difference between the two methods.
In months with large amounts of stormwater runoff and the Medina Lake stage rising (figs. 9 and 10; tables 5 and 7), the largest differences between the WLS estimated recharge and the Puente method estimated recharge were measured. The smaller differences between recharge estimated by the WLS estimated recharge and the Puente method estimated recharge occurred during months of steady or declining Medina Lake stages coinciding with hydrologically stable conditions. The total WLS estimated recharge during September 2018–June 2019, when the Medina Lake stage was generally rising, was 38,250 acre-ft, whereas the total Puente method estimated recharge was 82,020 acre-ft, which is a difference of about 73 percent between the two methods. For months of steady or falling lake-stage conditions (January 2017–August 2018 and July 2019–December 2022), the total WLS estimated recharge was 196,266 acre-ft, and the Puente method estimated recharge was 282,660 acre-ft—representing a 36 percent difference between the two methods (figs. 8 and 10; tables 5 and 7). The smallest differences between recharge estimated by the WLS and Puente methods would be expected when the Medina Lake stage was between approximately 1,030 and 1,050 ft above NGVD 29 and falling (May 2020–February 2021) (fig. 8). During the May 2020–February 2021 period, the WLS estimated recharge was 38,060 acre-ft, and the Puente method estimated recharge was 44,940 acre-ft—representing a difference of about 17 percent between the two methods (figs. 9 and 10; tables 5 and 7).
This study provides a detailed analysis and comparison of three methods for estimating seepage losses from the Medina and Diversion Lake system that enter the Edwards aquifer and the upper zone of the Trinity aquifer as recharge. The calculated recharge determined from the water-budget equation, which used continuous daily hydrologic data, provides the best estimate of actual recharge from the Medina and Diversion Lake system. Additional data collected during this study made it possible to refine the previously published WLS regression equation over a wider range of hydrologic conditions and stages of Medina Lake than were previously available. The analysis of the three methods revealed smaller differences between the WLS estimated recharge and the calculated recharge compared to the differences between the Puente method estimated recharge and the calculated recharge, indicating that the WLS estimated recharge provides a more accurate accounting of actual recharge to the Edwards aquifer and the upper zone of the Trinity aquifer, compared to using the Puente method.
Summary
The U.S. Geological Survey—in cooperation with the San Antonio Water System and the Edwards Aquifer Authority—used data collected during four different periods to refine previously derived relations between Medina Lake stage and recharge to the Edwards aquifer and the upper zone of the Trinity aquifer in the form of seepage losses from Medina Lake and the immediately downstream Diversion Lake in Bandera, Bexar, and Medina Counties, Texas. The relation between recharge to the underlying groundwater system from the Medina and Diversion Lake system has been the subject of previously published studies. Although many previous studies have focused on the seepage losses from the Medina and Diversion Lake system as providing recharge to the Edwards aquifer, other studies describe the seepage losses as providing recharge to the Edwards and Trinity aquifers because the rocks that contain the upper zone of the Trinity aquifer are also in contact with Medina and Diversion Lakes. The amount of groundwater recharge entering the Edwards aquifer and the upper zone of the Trinity aquifer as seepage losses from Medina Lake can be related to the Medina Lake stage. The relation between seepage losses from Medina Lake and the Medina Lake stage varies depending on the lake stage and depending on which hydrostratigraphic units are in contact with water impounded by Medina Lake Dam. The variation in the amount of recharge is a result of variations in the porosity and permeability of the hydrostratigraphic units underlying the lake. A water-budget approach was used to calculate recharge (method 1) for Medina and Diversion Lakes that included precipitation, evaporation, and surface-water data. The updated water budgets incorporated data collected by the U.S. Geological Survey and various agencies during four time periods (1955–64, 1995–96, 2001–02, and 2017–22). By using the updated water-budget data, a new log-log weighted least-squares (WLS) regression equation was developed to relate the Medina Lake stage to estimates of groundwater recharge (method 2). To quantify recharge to the Edwards aquifer and the upper zone of the Trinity aquifer from the Medina and Diversion Lake system, daily water budgets were computed for each day during the study from March 4, 2017, to October 6, 2022, and over a range of hydrologic conditions, with Medina Lake stage ranging from 987.44 to 1,064.35 feet (ft) above the National Geodetic Vertical Datum of 1929 (NGVD 29). The water-budget equation incorporates measurable terms of surface-water inflow and outflow to solve for unknown gains or losses, or both, from a lake or lake system. The measurable terms include precipitation, evaporation, surface-water inflow and outflow, and change in lake storage. The net effect of the unknown gains and losses is represented by the residual (Seepageout) term from the measurable terms of the water-budget equation, which is assumed to represent recharge to the Edwards aquifer and the upper zone of the Trinity aquifer. From the daily water budgets, water-budget periods were selected ranging from 7 to 12 days and with 144 water-budget periods selected between March 15, 2017, and October 6, 2022, and with the Medina Lake stage ranging from 987.44 to 1,064.35 ft above NGVD 29. The water-budget periods represented periods when the water-budget terms were relatively stable and the effects of precipitation, stormwater runoff, and changes in reservoir storage were minimal. For the statistical analysis, data from the four time periods from 1955 through 2022 are grouped into a single dataset (a total of 271 data points), and the results of the analysis are based on the entire range of data. The mean rates of groundwater recharge from these budget periods ranged from 6.22 to 199.68 acre-feet per day, with the Medina Lake stage ranging from 963.27 to 1,064.35 ft above NGVD 29. The statistical analysis of the Medina Lake stage and Seepageout data was then done by using an R script originally developed as part of a 2016 study and modified to incorporate the additional 2017–22 dataset. The new log-log WLS regression equation, including the 75- and 90-percent prediction intervals associated with the equation, was derived to model the relation between the Medina Lake stage and Seepageout.
Recharge calculated from monthly and annual water budgets (method 1) were compared to recharge obtained from the new WLS regression equation (method 2) and to recharge obtained from a mass-balance (inflow minus outflow) approach published by Puente (method 3). During March 2017–September 2022, the WLS estimated recharge was 224,310 acre-feet, 0.5 percent less than the calculated recharge from monthly and annual water budgets of 225,400 acre-feet. The Puente method estimated recharge was 342,080 acre-feet, about 52 percent more than calculated recharge. The analysis of the three methods indicates that WLS estimated recharge provides a more accurate accounting of actual recharge to the Edwards aquifer and the upper zone of the Trinity aquifer compared to the Puente method.
References Cited
Asquith, W.H., Roussel, M.C., and Vrabel, J., 2006, Statewide analysis of the drainage-area ratio method for 34 streamflow percentile ranges in Texas: U.S. Geological Survey Scientific Investigations Report 2006–5286, 34 p., 1 appendix., accessed March 24, 2022, at https://doi.org/10.3133/sir20065286.
Asquith, W.H., and Slattery, R.N., 2016, Reanalysis of the Medina/Diversion Lake system water-budget, with estimated recharge to Edwards aquifer, San Antonio area, Texas: U.S. Geological Survey data release, accessed November 1, 2022, at https://doi.org/10.5066/F7ZS2TNF.
Baldocchi, D.D., 2003, Assessing the eddy covariance technique for evaluating carbon dioxide exchange rates of ecosystems—Past, present, and future: Global Change Biology, v. 9, no. 4, p. 479–492, accessed October 7, 2022, at https://doi.org/10.1046/j.1365-2486.2003.00629.x.
Brutsaert, W., 1982, Evaporation into the atmosphere—Theory, history, and applications: Boston, Springer Dordrecht, 302 p., accessed November 4, 2019, at https://doi.org/10.1007/978-94-017-1497-6.
Burba, G., 2013, Eddy covariance method for scientific, industrial, agricultural, and regulatory application—A field book on measuring ecosystem gas exchange and areal emission rates: Lincoln, Nebr., LI-COR Biosciences, 331 p., accessed March 1, 2017, at https://doi.org/10.13140/RG.2.1.4247.8561.
Campbell Scientific, Inc., 2017a, Online corrections flux program version 1.1: Logan, Utah, Campbell Scientific, Inc., accessed April 3, 2017, at https://www.campbellsci.com/easyflux-dl.
Campbell Scientific, Inc., 2017b, Instruction manual for CR3000 and open-path eddy-covariance system product manual (revised March 2018): Logan, Utah, Campbell Scientific, Inc., 140 p., accessed October 19, 2020, at https://s.campbellsci.com/documents/us/manuals/easyflux-dl.pdf.
Campbell Scientific, Inc., 2021, Product manual for IRGASON—Integrated CO2/H2O open-path gas analyzer and 3D sonic anemometer, Revision 10/2021: Logan, Utah, Campbell Scientific, Inc., 86 p., accessed March 1, 2021, at https://www.campbellsci.com/irgason.
Chu, H., Christianson, D.S., Cheah, Y.W., Pastorello, G., O’Brien, F., Geden, J., Ngo, S., Hollowgrass, R., Leibowitz, K., Beekwilder, N.F., Sandesh, M., Dengel, S., Chan, S.W., Santos, A., Delwiche, K., Yi, K., Buechnew, C., Baldocchi, D., Papale, D., Keenan, T.F., Biraud, S.C., Agarwal, D.A., Torn, M.S., 2023, AmeriFlux BASE data pipeline to support network growth and data sharing: Scientific Data, v. 10, article 614, 13 p., accessed December 12, 2023, at https://doi.org/10.1038/s41597-023-02531-2.
Clark, A.K., 2003, Geologic framework and hydrogeologic features of the Glen Rose Limestone, Camp Bullis Training Site, Bexar County, Texas: U.S. Geological Survey Water Resources Investigations Report 03–4081, 9 p., 1 pl., scale 1:24,000, accessed December 12, 2022, at https://doi.org/10.3133/wri034081.
Clark, A.K., Golab, J.A., and Morris, R.R., 2023, Geologic framework and hydrostratigraphy of the Edwards and Trinity aquifers within northern Bexar and Comal Counties, Texas: U.S. Geological Survey Scientific Investigations Map 3510, 1 sheet, scale 1:24,000, 24-p. pamphlet, accessed December 1, 2023, at https://doi.org/10.3133/sim3510. [Supersedes USGS Scientific Investigations Map 3366.]
Clark, A.K., and Journey, C.A., 2006, Flow paths in the Edwards aquifer, northern Medina and northeastern Uvalde Counties, Texas, based on hydrologic identification and geochemical characterization and simulation: U.S. Geological Survey Scientific Investigations Report 2006–5200, 48 p., accessed December 12, 2022, at https://doi.org/10.3133/sir20065200.
Clark, A.K., Morris, R.R., and Lamberts, A.P., 2024, Geologic framework and hydrostratigraphy of the Edwards and Trinity aquifers within parts of Bandera and Kendall Counties, Texas: U.S. Geological Survey Scientific Investigations Map 3518, 1 sheet, scale 1:24,000, 11-p. pamphlet, accessed April 1, 2024, at https://doi.org/10.3133/sim3518.
Clark, A.K., Morris, R.E., and Pedraza, D.E., 2020, Geologic framework and hydrostratigraphy of the Edwards and Trinity aquifers within northern Medina County, Texas: U.S. Geological Survey Scientific Investigations Map 3461, 13 p. pamphlet, 1 pl., scale 1:24,000, accessed December 9, 2022, at https://doi.org/10.3133/sim3461.
Duan, N., 1983, Smearing Estimate—A Nonparametric Retransformation Method: Journal of the American Statistical Association, v. 78, no. 383, p. 605–610, accessed October 2019 at https://doi.org/10.1080/01621459.1983.10478017.
Falge, E., Baldocchi, D., Olson, R., Anthoni, P., Aubinet, M., Bernhofer, C., Burba, G., Ceulemans, R., Clement, R., Dolman, H., Granier, A., Gross, P., Grünwald, T., Hollinger, D., Jensen, N.-O., Katul, G., Keronen, P., Kowalski, A., Ta Lai, C., Law, B.E., Meyers, T., Moncrieff, J., Moors, E., William Munger, J., Pilegaard, K., Rannik, Ü., Rebmann, C., Suyker, A., Tenhunen, J., Tu, K., Verma, S., Vesala, T., Wilson, K., and Wofsy, S., 2001, Gap filling strategies for long term energy flux data sets: Agricultural and Forest Meteorology, v. 107, no. 1, p. 71–77, accessed November 1, 2023, at https://doi.org/10.1016/S0168-1923(00)00235-5.
Foken, T., 2008, The energy balance closure problem—An overview: Ecological Applications, v. 18, no. 6, p. 1351–1367, accessed October 19, 2022, at https://doi.org/10.1890/06-0922.1.
Gary, M.O., Veni, G., Shade, B., and Gary, R., 2011, Spatial and temporal recharge variability related to groundwater interconnection of the Edwards and Trinity aquifers, Camp Bullis, Bexar and Comal Counties, Texas, in Interconnection of the Trinity (Glen Rose) and Edwards aquifers along the Balcones Fault Zone and related topics: Karst Conservation Initiative proceedings, February 17, 2011, 46 p., accessed December 8, 2022, at https://digitalcommons.usf.edu/kip_talks/71.
George, P.G., Mace, R.E., and Petrossian, R., 2011, Aquifers of Texas: Texas Water Development Board Report 380, 172 p., accessed December 8, 2022, at https://www.twdb.texas.gov/publications/reports/numbered_reports/index.asp.
Helsel, D.R., Hirsch, R.M., Ryberg, K.R., Archfield, S.A., and Gilroy, E.J., 2020, Statistical methods in water resources: U.S. Geological Survey Techniques and Methods, book 4, chap. A3, 458 p., accessed October 10, 2021, at https://doi.org/10.3133/tm4A3. [Supersedes USGS Techniques of Water-Resources Investigations, book 4, chap. A3, version 1.1.]
Hunt, B.B., Andrews, A.G., and Smith, B.A., 2016, Hydraulic conductivity testing in the Edwards and Trinity aquifers using multiport monitor well systems, Hays County, central Texas: Barton Springs/Edwards Aquifer Conservation District, Report of Investigations 2016–0831, 39 p., accessed June 26, 2023, at https://bseacd.org/uploads/Hunt-et-al.-2016_Slug-Testing_FINAL.pdf.
Johnson, S., Schindel, G., and Veni, G., 2010, Tracing groundwater flowpaths in the Edwards aquifer recharge zone, Panther Springs Creek Basin, northern Bexar County, Texas: Edwards Aquifer Authority Report 10–01, May 2010, 112 p., accessed December 12, 2022, at https://www.edwardsaquifer.org/wp-content/uploads/2019/02/2010_Johnson-etal_PantherSpringsFlowpaths.pdf.
Kljun, N., Calanca, P., Rotach, M.W., and Schmid, H.P., 2004, A simple parameterisation for flux footprint predictions: Boundary-Layer Meteorology, v. 112, no. 3, p. 503–523, accessed August 15, 2019, at https://doi.org/10.1023/B:BOUN.0000030653.71031.96.
Kormann, R., and Meixner, F.X., 2001, An analytical footprint model for non-neutral stratification: Boundary-Layer Meteorology, v. 99, no. 2, p. 207–224, accessed November 5, 2019, at https://doi.org/10.1023/A:1018991015119.
Lambert, R.B., Grimm, K.C., and Lee, R.W., 2000, Hydrology, hydrologic budget, and water chemistry of the Medina Lake area, Texas: U.S. Geological Survey Water-Resources Investigations Report 00–4148, 53 p., accessed November 1, 2022, at https://doi.org/10.3133/wri004148.
Lamberts, A.P., Clark, A.K., Pedraza, D.E., and Morris, R.R., 2024, Geospatial dataset for the geologic framework and hydrostratigraphy of the Edwards and Trinity aquifers within parts of Bandera and Kendall Counties, Texas, at 1:24,000: U.S. Geological Survey data release, accessed April 1, 2024, at https://doi.org/10.5066/P9QKO5E1.
Lee, T.M., and Swancar, A., 1997, Influence of evaporation, ground water, and uncertainty in the hydrologic budget of Lake Lucerne, a seepage lake in Polk County, Florida: U.S. Geological Survey Water-Supply Paper 2439, 61 p., accessed November 1, 2022, at https://fl.water.usgs.gov/publications/Abstracts/wsp2439_lee.html.
Lohman, S.W., 1972, Ground-water hydraulics: U.S. Geological Survey Professional Paper 708, 70 p., accessed May 20, 2024, at https://pubs.er.usgs.gov/publication/pp708.
Mauder, M., and Foken, T., 2006, Impact of post-field data processing on eddy covariance flux estimates and energy balance closure: Meteorologische Zeitschrift (Berlin), v. 15, no. 6, p. 597–609, accessed November 8, 2019, at https://doi.org/10.1127/0941-2948/2006/0167.
Moncrieff, J.B., Massheder, J.M., de Bruin, H., Elbers, J., Friborg, T., Heusinkveld, B., Kabat, P., Scott, S., Soegaard, H., and Verhoe, A., 1997, A system to measure surface fluxes of momentum, sensible heat, water vapor and carbon dioxide: Journal of Hydrology, v. 188–189, p. 589–611, accessed April 5, 2024, at https://doi.org/10.1016/S0022-1694(96)03194-0.
Moreo, M.T., and Swancar, A., 2013, Evaporation from Lake Mead, Nevada and Arizona, March 2010 through February 2012: U.S. Geological Survey Scientific Investigations Report 2013–5229, 40 p., accessed October 19, 2022, at https://doi.org/10.3133/sir20135229.
National Geodetic Survey, 2011, NGS OPUS solution report: National Oceanic and Atmospheric Administration web page, accessed November 21, 2011, at https://www.ngs.noaa.gov/OPUS/.
National Oceanic and Atmospheric Administration, 2023, Waves: National Oceanic and Atmospheric Administration web page, accessed May 19, 2023, at https://www.noaa.gov/jetstream/ocean/waves.
Novak, C.E., 1985, WRD data reports preparation guide: U.S. Geological Survey Open-File Report 85–480, 199 p., accessed November 1, 2022, at https://doi.org/10.3133/ofr85480.
Pedraza, D.E., Clark, A.K., and Morris, R.R., 2020, Geospatial dataset of the geologic framework and hydrostratigraphy of the Edwards and Trinity aquifers within northern Medina County, Texas, at 1:24,000 scale: U.S. Geological Survey data release, accessed November 1, 2020, at https://doi.org/10.5066/P9HHMBX8.
Pedraza, D.E., Clark, A.K., Golab, J.A., and Morris, R.R., 2023. Geospatial dataset for the geologic framework and hydrostratigraphy of the Edwards and Trinity aquifers within northern Bexar and Comal Counties, Texas, at 1:24,000 scale: U.S. Geological Survey data release, accessed February 1, 2024, at https://doi.org/10.5066/P9GXJ2RS.
Pegasus Planning, 2023, A look at the Texas Hill Country—Following the path we are on today through 2030—This unique and special region will grow, but what will the Hill Country look like in 2030?: Texas Hill Country Alliance, prepared by Pegasus Planning, 24 p., accessed May 18, 2023, at https://hillcountryalliance.org/uploads/HCA/GrowthScenario2.pdf.
Puente, C., 1978, Method of estimating natural recharge to the Edwards aquifer in the San Antonio area, Texas: U.S. Geological Survey Water-Resources Investigations Report 78–10, 34 p., accessed April 4, 2022, at https://pubs.usgs.gov/wri/1978/0010/report.pdf.
R Core Team, 2023, R—A language and environment for statistical computing version 4.3.2: Vienna, Austria, R Foundation for Statistical Computing, accessed October 12, 2023, at http://www.r-project.org/.
Rose, P.R., 1972, Edwards Group, surface and subsurface, central Texas: Austin, Tex., University of Texas, Bureau of Economic Geology Report of Investigations 74, 198 p., accessed December 8, 2022, at https://doi.org/10.23867/RI0074D.
Saribudak, M., 2016, Geophysical mapping of Mount Bonnell fault of Balcones fault zone and its implications on Trinity-Edwards Aquifer interconnection, central Texas, USA: The Leading Edge, Society of Exploration Geophysicists, v. 35, no. 9, p. 752–758, accessed September 11, 2023, at https://doi.org/10.1190/tle35090752.1.
Slattery, R.N., and Choi, N., 2023, Estimated annual recharge to the Edwards Aquifer in the San Antonio Area, by stream basin or ungaged Area, 1934–2022: U.S. Geological Survey data release, accessed November 1, 2023, at https://doi.org/10.5066/P9OC5CQ7.
Slattery, R.N., and Choi, N., 2024, Datasets and R scripts used for the water-budget analysis of the Medina and Diversion Lake system, Bandera, Bexar, and Medina Counties, Texas, 1955–2022: U.S. Geological Survey data release, https://doi.org/10.5066/P14N5SNK.
Slattery, R.N., and Miller, L.D., 2017, A water-budget analysis of Medina and Diversion Lakes and the Medina/Diversion Lake system, with estimated recharge to Edwards aquifer, San Antonio area, Texas (ver. 1.1, February 2017): U.S. Geological Survey Scientific Investigations Report 2004–5209, 41 p., accessed November 1, 2023, at https://doi.org/10.3133/sir20045209.
Small, T.A., and Lambert, R.B., 1998, Geologic framework and hydrogeologic characteristics of the outcrops of the Edwards and Trinity aquifers, Medina Lake area, Texas: U.S. Geological Survey Water-Resources Investigations Report 97–4290, 17 p., accessed November 2, 2022, at https://doi.org/10.3133/wri974290.
Stannard, D.I., Gannett, M.W., Polette, D.J., Cameron, J.M., Waibel, M.S., and Spears, J.M., 2013, Evapotranspiration from wetland and open-water sites at Upper Klamath Lake, Oregon, 2008–2010: U.S. Geological Survey Scientific Investigations Report 2013–5014, 66 p., accessed November 1, 2022, at https://doi.org/10.3133/sir20135014.
Sullivan, S., Thomas, D., Segura, S., Robichaud, M., and Elliott, W., 2003, Volumetric survey of Medina Lake and Diversion Lake: Bexar-Medina-Atascosa Counties Water Control and Improvement District Number One, prepared by Texas Water Development Board, Austin, Tex., 42 p., accessed November 1, 2022, at https://www.twdb.texas.gov/hydro_survey/medina/1995-07/MedinaDiversion1995_FinalReport.pdf.
Swinbank, W.C., 1951, The measurement of vertical transfer of heat and water vapor by eddies in the lower atmosphere: Journal of Meteorology, v. 8, no. 3, p. 135–145, accessed November 1, 2022, at https://doi.org/10.1175/1520-0469(1951)008<0135:TMOVTO>2.0.CO;2.
Tanner, C.B., and Thurtell, G.W., 1969, Anemoclinometer measurements of Reynolds stress and heat transport in the atmospheric surface layer: Fort Huachuca, Ariz., United States Army Electronics Command, Research and Development [ECOM], ECOM-66-G22-F, 82 p., accessed November 1, 2022, at https://api.semanticscholar.org/CorpusID:92354158.
Texas Water Development Board [TWDB], 2023, TWDB reservoir evaporation, daily gross evaporation and precipitation for Medina Lake, 2017–2022: Texas Water Development Board database, accessed April 28, 2023, at https://dri-apps.earthengine.app/view/twdb-reservoir-evaporation.
Texas Water Development Board [TWDB], 2024, Water data for Texas—Lake evaporation and precipitation, gross evaporation, quadrangle 809, March 2, 1955, through August 15, 1964: Texas Water Development Board web page, accessed March 1, 2024, at https://waterdatafortexas.org/lake-evaporation-rainfall.
Twine, T.E., Kustas, W.P., Norman, J.M., Cook, D.R., Houser, P.R., Meyers, T.P., Prueger, J.H., Starks, P.J., and Wesely, M.L., 2000, Correcting eddy-covariance flux underestimates over a grassland: Agricultural and Forest Meteorology, v. 103, no. 3, p. 279–300, accessed November 8, 2019, at https://doi.org/10.1016/S0168-1923(00)00123-4.
U.S. Army Corps of Engineers, 2025, National inventory of dams: U.S. Army Corps of Engineers database, accessed January 16, 2025, at https://nid.sec.usace.army.mil/#/.
U.S. Geological Survey, 2005, Collection, quality assurance, and presentation of precipitation data (revised December 2009): U.S. Geological Survey Office of Surface Water Technical Memorandum 2006.01, 29 p., accessed May 19, 2023, at https://water.usgs.gov/admin/memo/SW/sw06.012_Revised_122009.pdf.
U.S. Geological Survey, 2023, USGS water data for the Nation: U.S. Geological Survey National Water Information System database, accessed July 13, 2023, at https://doi.org/10.5066/F7P55KJN.
Veralto, 2024, Operations & maintenance manual—Sutron SatLink 3: Ott Hydromet, 271 p., accessed October 16, 2024, at https://cdn.hach.com/1XMCM0ZF/at/9kvcqv4x6b53fxgtq8j3pwt4/sl3_O_M.pdf.
Vickers, D., and Mahrt, L., 1997, Quality control and flux sampling problems for tower and aircraft data: Journal of Atmospheric and Oceanic Technology, v. 14, no. 3, p. 512–526, accessed November 1, 2022, at https://doi.org/10.1175/1520-0426(1997)014<0512:QCAFSP>2.0.CO;2.
Webb, E.K., Pearman, E.G., and Leuning, R., 1980, Correction of flux measurements for density effects due to heat and water vapor transfer: Quarterly Journal of the Royal Meteorological Society, v. 106, no. 447, p. 85–100, accessed November 1, 2022, at https://doi.org/10.1002/qj.49710644707.
Wilson, K., Goldstein, A., Falge, E., Aubinet, M., Baldocchi, D., Berbigier, P., Bernhofer, C., Ceulemans, R., Dolman, H., Field, C., Grelle, A., Ibrom, A., Law, B., Kowalski, A., Meyers, T., Moncrieff, J., Monson, R., Oechel, W., Tenhunen, J., Valentini, R., and Verma, S., 2002, Energy balance closure at FLUXNET sites: Agricultural and Forest Meteorology, v. 113, no. 1–4, p. 223–243, accessed November 1, 2022, at https://doi.org/10.1016/S0168-1923(02)00109-0.
Winter, T.C., 1981, Uncertainties in estimating the water balance of lakes: Journal of the American Water Resources Association, v. 17, no. 1, p. 82–115, accessed October 25, 2022, at https://doi.org/10.1111/j.1752-1688.1981.tb02593.x.
Winter, T., Harvey, J.W., Franke, O.L., and Alley, W.M., 1998, Ground water and surface water—A single resource: U.S. Geological Survey Circular 1139, 88 p., accessed April 2, 2024, at https://doi.org/10.3133/cir1139.
Wood, S.N., 2016a, Mixed GAM computation vehicle with GCV/AIC/REML smoothness estimation: R package version 1.8-12, accessed November 4, 2016, at http://cran.r-project.org/package=mgcv.
Wood, S.N., 2016b, Mixed GAM computation vehicle with GCV/AIC/REML smoothness estimation: R package version 1.9-1, accessed November 4, 2016, at https://cran.r-project.org/web/packages/mgcv/mgcv.pdf.
Xylem, 2024, H-3401 SDI rain gauge—Getting started guide: Yellow Springs, Ohio, YSI Incorporated, 9 p., accessed April 15, 2024, at https://www.ysi.com/File%20Library/Documents/Manuals/WaterLOG-Rain-Gauge-User-Manual.pdf.
Conversion Factors
U.S. customary units to International System of Units
International System of Units to U.S. customary units
Datums
Vertical coordinate information is referenced to the National Geodetic Vertical Datum of 1929 (NGVD 29).
Horizontal coordinate information is referenced to the North American Datum of 1983 (NAD 83).
Abbreviations
±
plus or minus
ΔS
change in lake storage
E
evaporation
Eμ
corrected daily total of eddy covariance evaporation
EC
eddy covariance
IRGASON
infrared gas analyzer and sonic anemometer
NGVD 29
National Geodetic Vertical Datum of 1929
NWIS
National Water Information System
P
precipitation
p
probability
R2
coefficient of determination
TWDB
Texas Water Development Board
USGS
U.S. Geological Survey
WLS
weighted least squares
For more information about this publication, contact
Director, Oklahoma-Texas Water Science Center
U.S. Geological Survey
1505 Ferguson Lane
Austin, TX 78754–4501
For additional information, visit
https://www.usgs.gov/centers/ot-water
Publishing support provided by the Baltimore and Lafayette Publishing Service Centers
Disclaimers
Any use of trade, firm, or product names is for descriptive purposes only and does not imply endorsement by the U.S. Government.
Although this information product, for the most part, is in the public domain, it also may contain copyrighted materials as noted in the text. Permission to reproduce copyrighted items must be secured from the copyright owner.
Suggested Citation
Slattery, R.N., Choi, N., and Clark, A.K., 2025, Water-budget analysis of the Medina and Diversion Lake system, with estimated recharge to the Edwards aquifer and the upper zone of the Trinity aquifer, Bandera, Bexar, and Medina Counties, Texas, 1955–2022: U.S. Geological Survey Scientific Investigations Report 2024–5112, 35 p., https://doi.org/10.3133/sir20245112.
ISSN: 2328-0328 (online)
Study Area
| Publication type | Report |
|---|---|
| Publication Subtype | USGS Numbered Series |
| Title | Water-budget analysis of the Medina and Diversion Lake system, with estimated recharge to the Edwards aquifer and the upper zone of the Trinity aquifer, Bandera, Bexar, and Medina Counties, Texas, 1955–2022 |
| Series title | Scientific Investigations Report |
| Series number | 2024-5112 |
| DOI | 10.3133/sir20245112 |
| Publication Date | February 14, 2025 |
| Year Published | 2025 |
| Language | English |
| Publisher | U.S. Geological Survey |
| Publisher location | Reston, VA |
| Contributing office(s) | Oklahoma-Texas Water Science Center |
| Description | Report: viii, 35 p.; Data Release |
| Country | United States |
| State | Texas |
| County | Bandera County, Bexar County, Medina County |
| Online Only (Y/N) | Y |