

Hydrogeomorphic History, Hydrodynamic Conditions, and Simulations of Water Levels and Velocities from Varying Lake Levels and Streamflow for the Sheboygan Rivermouth and Area of Concern, Wisconsin
Links
- Document: Report (14 MB pdf) , HTML , XML
- Dataset: USGS National Water Information System database - USGS water data for the Nation
- Data Releases:
- USGS data release - Core descriptions, survey transects, bathymetry, and velocity data for the Sheboygan River mouth and Wildwood Islands complex, 2011–12
- USGS data release - FaSTMECH model water surface elevation and velocities for the Lower Sheboygan River, Wisconsin
- NGMDB Index Page: National Geologic Map Database Index Page (html)
- Download citation as: RIS | Dublin Core
Acknowledgments
This study greatly benefited from the technical assistance of Professor James Knox (retired, University of Wisconsin-Madison, Geography Department) who passed away unexpectedly in October 2013. Professor Knox assisted in the study design, coring, and interpretation of the glacial setting and island history of the Sheboygan River. Our coring work went faster and more smoothly with the assistance of Julia Ferguson (former student of Professor Knox) and Derek Strohl (Bureau of Land Management). Professor Robert Pavlowsky (Missouri State University) provided the idea for calculating trends in flood frequency statistics. Laura Nelson (formerly of the U.S. Geological Survey) assisted with illustrations. Assistance in river navigation and reconnaissance was provided by Matthew Holmes (Wisconsin Department of Natural Resources). Andrew Selle and Beth Wentzel, both formerly from Inter-Fluve, Inc., provided topographic survey data for the Wildwood Islands complex. Special thanks to Stacy Hron and Vic Pappas (Wisconsin Department of Natural Resources) for their ideas, support, and collaboration with this study. Funding was provided by the Wisconsin Department of Natural Resources in cooperation with the U.S. Geological Survey.
We are indebted to the technical assistance Paul Kinzel (U.S. Geological Survey) who provided expertise in the collection of bathymetry data. Herb Garn (retired, U.S. Geological Survey) computed streamflow trend statistics.
Colleague reviews were provided by Jessica LeRoy and Paul Kinzel (U.S. Geological Survey). The model archive of simulations of river flows and lake-level combinations was reviewed by Julia Prokopec (U.S. Geological Survey).
Abstract
In 2011–13, the U.S. Geological Survey (USGS) studied the hydrogeomorphic setting and hydrodynamic conditions of the lower Sheboygan River and island complex within the backwater zone of Lake Michigan. Analyses of historical aerial photographs from 1938 to 2010 indicated that an island complex, locally known as the Wildwood Islands complex, had been mainly 1 island in 1938 and had eroded into about 10 smaller islands and bars by 2010. Water levels, velocity, and sedimentation patterns in the Sheboygan River mouth are affected by Lake Michigan water levels and seiche-related flow reversals for a potential river length of more than 7 kilometers. During the summer of 2012, when water levels in Lake Michigan were below the low water datum, seiche-related water-level fluctuations had a general range of 0.2 meter (m) and extended to just upstream from the Wildwood Islands complex, with greater variability in amplitude and frequency in the spring and fall months than in the summer. The low water level associated with the trough of a 60–90-minute seiche-related oscillation was sometimes 0.6 m lower than the low water datum. Runoff events produced river water levels during spring melt or storms that were 0.6 m above coincident Lake Michigan water levels. Frequent ice jams in the winter and early spring of 2012–13 raised river water levels to near the Lake Michigan ordinary high-water mark even though Lake Michigan water levels were at near-record lows. Results from trend analyses from 1916 through 2008 indicated average annual streamflow and low flows were increasing in the Sheboygan River, but floods with an annual exceedance probability of 1 percent did not change. Simulations of a range of combinations of Lake Michigan water levels with river flows indicated that a variety of velocity patterns and water levels are possible near the Wildwood Islands complex. Simulated velocities ranged from 0 meter per second during high lake levels and small river flows to 2 meters per second during high lake levels and floods, with an annual exceedance probability of 0.01. Silt deposition recorded in sediment cores matched locations of flow divergence in the model simulations. Time-lapse photography confirmed flow reversals in the vicinity of the Wildwood Islands complex from frequent seiche oscillations. The study illustrates the large range in variability in water levels and velocities during short periods of time, and that the lake-effect zone can be greatly extended upstream during high lake levels for low-gradient rivermouth environments.
Introduction
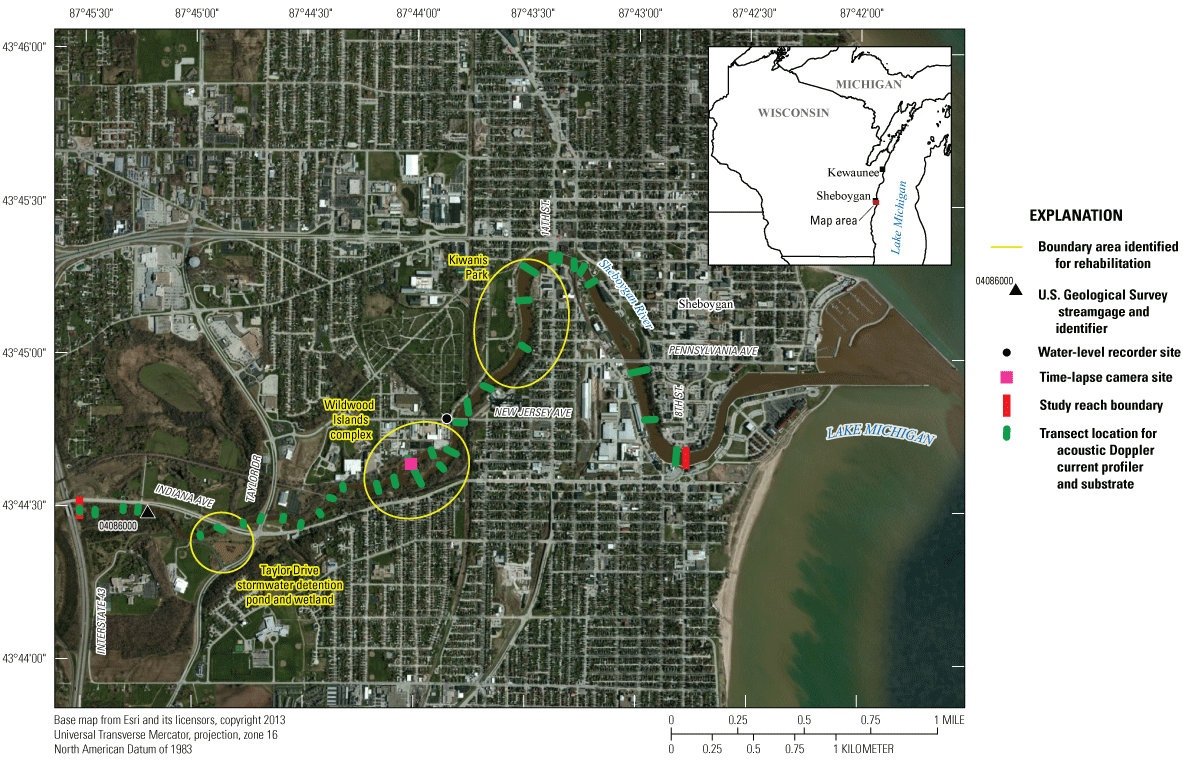
The mouth of the Sheboygan River and its harbor at Lake Michigan (fig. 1) is 1 of 43 Great Lakes areas of concern (AOCs) that were identified primarily from persistent contamination of river sediment with legacy chemicals related to historical industrial waste (Wisconsin Department of Natural Resources, 1989). The first remedial action plan for the river was written in 1986 and had the following goals: (1) provide a fishery and ecosystem that is free from the effects of toxic contamination, (2) maintain a diverse community of aquatic and terrestrial life, (3) control eutrophication, and (4) enhance recreational uses of the harbor (Wisconsin Department of Natural Resources, 1989).
Hydrogeomorphic history and hydrodynamic characteristics of the Sheboygan River area of concern, Sheboygan, Wisconsin.
One of the goals of the U.S. Environmental Protection Agency (EPA) Great Lakes Restoration Initiative is to delist AOCs (Government of Canada and Government of the United States of America, 2015). Through the combined cleanup efforts of Great Lakes Restoration Initiative, the EPA Legacy Act and Superfund Programs, Wisconsin Department of Natural Resources, Sheboygan County, and City of Sheboygan, the Sheboygan River AOC was moved closer to delisting in June 2013 and put into the category of “area in recovery” (U.S. Environmental Protection Agency, 2013). Habitat conservation and rehabilitation, as well as contaminated-sediment removal, were necessary to eliminate the fish and wildlife-related beneficial use impairments. The lower Sheboygan River within the AOC has exceptional habitat characteristics and is home to more than 30 rare animal species and 10 rare plant species (Wisconsin Department of Natural Resources, 2012). In addition, the lower Sheboygan River is a major migratory bird stopover that contains surrogate grassland habitat and multiple river corridor habitats including seeps, ephemeral ponds, and floodplain forest in a warm water river setting (Wisconsin Department of Natural Resources, 2012).
For the Sheboygan River reach affected by the backwater effects of Lake Michigan, three rehabilitation projects were planned along a 5-kilometer (km) stretch of the Sheboygan River in the vicinity of Kiwanis Park, an island complex (locally known as the “Wildwoods Islands”), and Taylor Drive (fig. 1). Important habitats that were considered included migratory bird stopover, shorebird stopover, bird breeding, herptiles, warm water fish community, and emergent wetlands (National Oceanic and Atmospheric Administration and others, 2012). Of special note were forage fish and spawning habitat in the vicinity of the Wildwood Islands complex.
Baseline hydrogeomorphic and hydrodynamic data were collected by the U.S. Geological Survey (USGS) in 2011–13 to assist the Wisconsin Department of Natural Resources in the design and implementation of three large rehabilitation projects (fig. 1). This study had two main objectives:
-
• provide the Wisconsin Department of Natural Resources with hydrogeomorphic history and hydrodynamic conditions for three main rehabilitation projects in the lower Sheboygan River, with special emphasis for the Wildwood Islands complex; and
-
• evaluate a USGS two-dimensional (2D) hydraulics model as a tool for assisting water resources and fisheries managers with rehabilitation designs in backwater- and seiche-affected Great Lakes rivermouths under a variety of historically relevant lake-level and river flow combinations.
The study reach is a geomorphologically complex mixing zone between river flows and Lake Michigan lake water. The mixing patterns are affected by short-term and long-term lake-level fluctuations of various frequencies, durations, magnitudes, and causes (Wilcox and others, 2007). River flows vary depending on rainfall and snowmelt patterns, with generally high flows in the spring from a combination of rainfall and snowmelt and generally lower flows in summer and fall between storms. The west to east direction of the river enhances and funnels the lake-related seiches. A seiche is “a standing wave oscillating in a body of water” caused by rapid changes in atmospheric pressure and strong winds that push water from one side of Lake Michigan to the other (National Oceanic and Atmospheric Administration, 2016a, p. 1). When the pressure changes or the winds stop, the water rebounds to the other side of the lake and continues to oscillate back and forth. In Lake Michigan, the weather-related lake-level changes and water oscillations can last from less than an hour to multiple days. The Great Lakes are generally higher in the spring and early summer than late summer and fall. Long-term lake-level fluctuations range from multiyear, decadal, and millennial and represent basinwide climate patterns.
The lower Sheboygan River contains a mix of diverse aquatic, riparian, and terrestrial habitat environments (figs. 1 and 2). The Wildwood Islands are in a section of the river where there are some remnant woodlands along the riparian corridor. Understanding the hydrogeomorphic history of the islands required more detailed surveying and collection of erosion and sedimentation data (fig. 2). Fluctuating river flows combined with oscillating lake levels provide the framework for providing the diversity of habitats along the islands complex. Water-level fluctuations near the island complex from lake-derived seiches are further complicated by changing river flows from storm runoff, snowmelt, and ice jams. The fluctuations happen on many time scales from millennial climate shifts to seasonal floods caused by precipitation or snowmelt, to hourly seiche-driven oscillations. It was important to understand the history and spatial extent of fluctuations (flow and water-level combinations) and how the fluctuations affected the hydrodynamics and considerations for rehabilitation designs.
Core locations and surveyed transects for Wildwood Islands complex, Sheboygan, Wisconsin.
Purpose and Scope
The purpose of this report is to describe the hydrogeomorphic setting, hydrodynamic conditions, and results from the hydrodynamic simulations of the Sheboygan River mouth as they relate to rehabilitation associated with cleanup of the AOC. Field data were collected primarily in 2011 through 2013 during a particularly low water-level period for Lake Michigan. For the hydrogeomorphic history, the report describes the postglacial geomorphic setting, historical Lake Michigan water-level fluctuations, the interaction of lake levels with river flows, trends in Sheboygan River streamflow, and changes in the planform and sedimentation history of Wildwood Islands complex. The report includes velocity patterns and water-surface elevations from 2D simulations of interacting river flows and Lake Michigan water levels, including average water levels and river flows, high water levels and varying river flows, low water levels and varying river flows, and typical summer low and high seiche conditions for July 2012.
Description of the Study Area
The Sheboygan River empties into western Lake Michigan at the city of Sheboygan in Sheboygan County, Wisconsin. The river drains 1,603 square kilometers (619 square miles) of mainly agricultural land including pasture land, cropland, and vacant fields (Wisconsin Department of Natural Resources, 1995), with secondary land cover of nonagricultural lands consisting of open water, woodlands, wetlands, and parks. Small amounts of the drainage area have urban land cover. The topography is determined by the surrounding glacial setting of flat moraine and kettle moraine with about 30 meters (m) of relief. Clayey soils are dominant in the drainage basin and contribute to flashy runoff characteristics. The river has six impoundments greater than 4 hectares (Wisconsin Department of Natural Resources, 2001). Polychlorinated biphenyls contaminated the lower 22 km of the river and contributed to the poor water quality status in the lower Sheboygan River (Wisconsin Department of Natural Resources, 2001). The study area encompassed a 5-km reach of the lower Sheboygan River located 1.8 km upstream from Lake Michigan. The well-developed river valley at the Sheboygan River through this reach contained terraces that related to relict shorelines associated with pre-Holocene stands of glacially affected Lake Michigan (Richardson, 1991; Carlson and others, 2011).
Methods
A variety of data types were compiled and collected for this study, including existing and new data, to help describe the hydrogeomorphic history and hydrodynamic conditions of the lower Sheboygan River. A subset of the hydrodynamic-related data was used for the hydrodynamic simulations of varying lake levels and river flows in the Wildwood Islands complex.
Hydrogeomorphic History
Data used in the description of the hydrogeomorphic history of the Sheboygan River mouth included Lake Michigan water levels, previously reconstructed paleolake levels, Sheboygan River streamflows and streamflow trends analyses, analyses of overlays of historical aerial photographs to quantify planform changes in the Wildwood Islands complex, and sediment cores along transects in the Wildwood Islands complex for describing depositional history of the islands.
Lake Michigan Water Levels and Paleolake Levels
Data for water levels of Lake Michigan were gathered from available literature and the National Oceanic and Atmospheric Administration’s online datasets. Data from the National Oceanic and Atmospheric Administration Great Lakes Water Level Dashboard (National Oceanic and Atmospheric Administration, 2016b) were used to track historical average monthly lake levels into the early 1900s. Hourly data from the National Oceanic and Atmospheric Administration’s Lake Michigan Kewaunee water-level gage (National Oceanic and Atmospheric Administration identification number 9087068; hereafter referred to as “Kewaunee lake gage”) were used (National Oceanic and Atmospheric Administration, 2024). The vertical datum for the International Great Lakes Datum 1985 (IGLD 85) is 0.14 m lower than the North American Vertical Datum of 1988 (NAVD 88) in the vicinity of the lower Sheboygan River and Wildwood Islands complex (National Oceanic and Atmospheric Administration, 2018). Data from the Kewaunee lake gage were converted to NAVD 88 for consistent comparison among lake and river water levels and land surfaces near the Wildwood Islands complex.
Elevations of paleolake levels of Lake Michigan, following the last glaciation and during the Holocene (Thompson and Baedke, 1999), were overlaid onto 1:24,000-scale USGS topographic maps, and the resulting paleoshorelines in the vicinity of the Sheboygan River were digitized in a geographic information system. These maps are in the National Geodetic Vertical Datum of 1929 (NGVD 29). For comparison, the NGVD 29 is 0.03 m higher than the NAVD 88 near the Wildwood Islands complex (National Oceanic and Atmospheric Administration, 2018).
Sheboygan River Streamflow Data and Trends Analyses
A previously established USGS streamgage (Sheboygan River at Sheboygan, Wisconsin; USGS station number 04086000; hereafter referred to as the “Sheboygan River streamgage”), 300 m downstream from Interstate Highway 43, has been collecting streamflow data for the Sheboygan River since 1950 (U.S. Geological Survey, 2024; fig. 1). The streamgage was also operated for a short period from 1916 through 1924. The elevation for the streamgage is 176.91 m (580.41 ft) above the NAVD 88. Diurnal fluctuations in streamflow at the streamgage are caused by flow control structures and discharges at numerous upstream power plants.
Streamflow trends were computed for the Sheboygan River streamgage using methods similar in Gebert and others (2016) including the annual 7-day low flow, average annual flow, and annual flood peak discharge. The Kendall tau coefficient (Kendall, 1970; Conover, 1971) was calculated using online software (Wessa, 2012). The Kendall tau calculation is a nonparametric test that measures the strength and direction of trends in datasets that are typically right skewed like streamflow. The tau values can range from −1 to +1. Tau values closer to plus or minus (±) 1 are more likely to be statistically significant. A probability value (p-value) of less than or equal to 0.05 was considered significant for the Sheboygan River calculations.
Another approach was used to examine historical changes in flood-frequency variability, ranging from very small frequent floods with an annual exceedance probability (AEP) of 0.99 to a large infrequent flood with an AEP of 0.01 typically used for flood hazard planning. These methods were like methods used for Ozark Missouri streams by Foreman (2014). The annual instantaneous peak flood record, dating back to 1916, was grouped into multiple 30-year periods by increments of 5 years. The AEPs for each 30-year period were computed using USGS techniques and the PEAKFQ program (Interagency Advisory Committee on Water Data, 1982; Flynn and others, 2006; Veilleux and others, 2014). In addition to floods with an AEP of 0.95 and 0.01, floods with an AEP of 0.67 were also examined because of possible relations to bankfull flows and an estimate of the geomorphologically effective flood (Wolman and Miller, 1960; Leopold and others, 1964).
Historical Aerial Photograph Comparisons
A set of historical orthorectified aerial photographs were examined to track areal changes in the planform of the Wildwood Islands complex. Stantec Consulting (written commun., 2016) provided geographic information system files of the photographs to Wisconsin DNR, which had the 1938 shoreline of the main Wildwood Island digitized. Photographs were available for the following years: 1938, 1941, 1950, 1961, 1974, 1992, 2005, and 2010. Stantec used the 2010 National Agricultural Imagery Program orthophotographs as a reference and base layer (U.S. Department of Agriculture, 2022).
Wildwood Islands Complex Transect Surveys and Sediment Coring
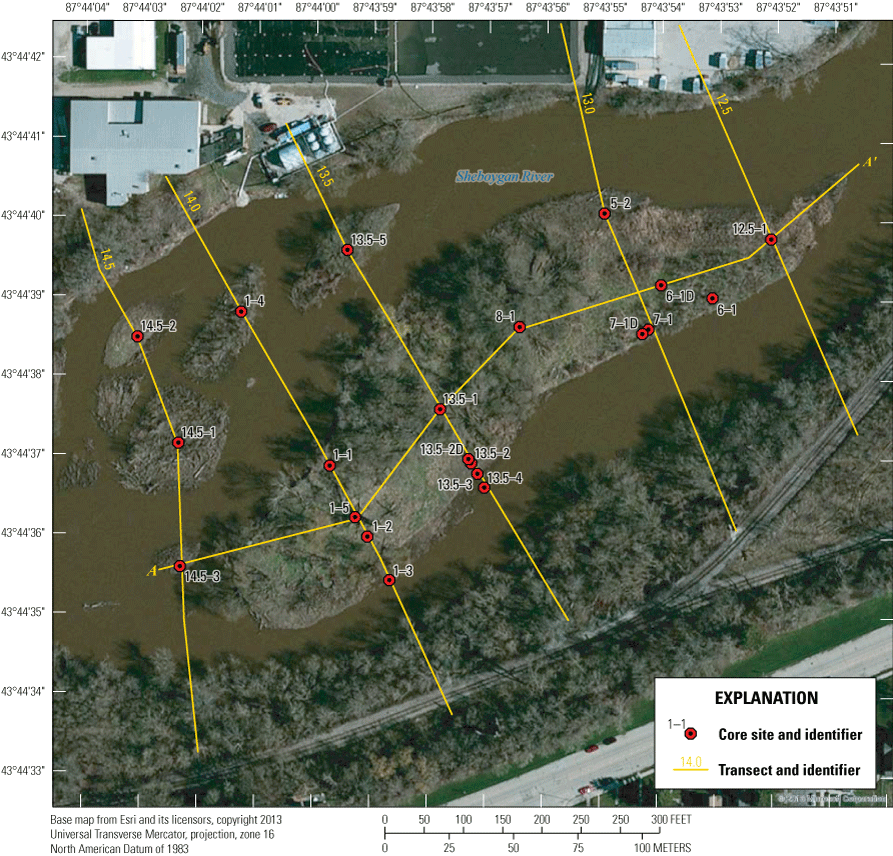
In 2011–12, hand cores of fluvial sediment were collected along six surveyed transects on the main island and smaller surrounding islands in the Wildwood Islands complex (figs. 1, 2). Five of the transect lines run perpendicular to the general flow of the Sheboygan River, and one transect line runs parallel to the longitudinal direction of the river flow and the long axis of the main island (fig. 2). The transect lines were surveyed with an autolevel by InterFluve, Inc. and tied into semipermanent benchmarks surveyed by the USGS with a real-time kinematic–global positioning system (RTK–GPS) Topcon GR-5 unit running TopSurv software (Rydlund and Densmore, 2012).
Hand cores were collected from 21 locations within the island complex (fig. 2). Because the islands are surrounded by water, a hand-held 2-centimeter (cm) diameter soil probe and 5-cm diameter auger were used to collect cores. Samples and descriptions of the core texture and sedimentary features were used to help determine sedimentation rates and origin of the island complex. Core locations were selected based on the geomorphic setting, surficial evidence of fresh sediment deposition, and relative age of geomorphic surfaces determined from analyses of historical aerial photographs (Fitzpatrick and others, 2003, 200711; Fitzpatrick and Peppler, 2003; Fitzpatrick, 2005).
Cores were logged and described in the field. Data included latitude/longitude (collected with a nonsurvey grade GPS), water depth, penetration depth, length of core recovered, date, and time. Field determinations were done for sediment color (Munsell Color, 1975), for texture by rubbing sediment between the fingers (Soil Survey Staff, Soil Conservation Service, 1951), and for major stratigraphic units by use of visual indicators. Photographs were taken of the cores. Field duplicate cores were collected at sites 13.5–2 and 13.5–2D. Core descriptions and transect survey data are provided in a USGS data release (Fitzpatrick and others, 2025).
A subset of samples was saved after completion of the field logging for laboratory analyses of particle size, organic carbon content, and radiocarbon-based age determination. Particle size distribution analysis and loss on ignition (ASTM D7348-08e1, American Society for Testing and Materials, 2008) were completed. If present, wood was collected from the cores for potential radiocarbon age determinations. These data were used to help determine age of the islands and sedimentation history. Wood was carefully subsampled from the surrounding sediment in the core tube and placed in a resealable plastic bag. The samples were stored on ice until return to the USGS. In the preparatory laboratory, the wood was rinsed with deionized water and checked under a Nikon macroscope for rootlets or other vegetation that was removed with forceps. The wood samples were dried at 105 degrees Celsius, repackaged in foil, and placed inside a sealed plastic bag prior to shipment to Beta Analytic, Inc. (ISO 17025 accredited and 9001 conformant). Four wood samples were submitted for analyses. Radiocarbon age determinations were reported for the 2-sigma (95-percent probability) results.
Conventional radiocarbon ages were reported for analyzed wood samples by Beta Analytic Radiocarbon Dating Laboratory (Bowman, 1990; Stuvier and Braziunas, 1993; Reimer and others, 2009). The conventional radiocarbon age includes the following conventions: (1) usage of the Libby half-life; (2) usage of oxalic acid I or II or any appropriate secondary standard as the modern radiocarbon standard; (3) correction for sample isotopic fractionation to a normalized or base value of −25.0 per mille relative to the ratio of carbon 12/carbon 13 in the carbonate standard; (4) zero before present (BP) is defined as 1950 CE (comma era); and (5) the assumption that global radiocarbon levels are constant (Beta Analytic, written commun., 2016). Standard errors were reported in the radiocarbon dating result, hence the plus or minus values (Talma and Vogel, 1993).
Hydrodynamic Conditions, 2011–13
Hydrodynamic conditions for 2011 through 2013 were examined through water-level monitoring with stage recorders and time lapse cameras. Topographic and water surface profiles were constructed. Bathymetry and velocity data were collected, along with streambed substrate particle size.
Rivermouth Water-Level Fluctuations
Water levels in the lake-affected part of the lower Sheboygan River were measured by the USGS from March 2012 through June 2013 with a continuous stage recorder placed near the New Jersey Avenue bridge between Kiwanis Park and the Wildwood Islands complex (USGS identification number 040860034; U.S. Geological Survey, 2024; fig. 1). The stage recorder was surveyed in the NAVD 88. The time interval for measurements was 5 minutes.
A time-lapse camera was installed in the winter of 2011 overlooking the Wildwood Islands complex (fig. 1), and the photographs were used to document inundation and drying of island and bar surfaces associated with varying river water levels and current directions caused by Lake Michigan seiches and changing river flows, as well as ice damming. Photographs were taken at 15-minute intervals through summer 2013. The photographic period spanned rehabilitation work on Wildwood Island. The photographs also show how wildfowl utilized the frequently exposed and quickly inundated bars. Three sets of time-lapse photographs were compiled into videos to illustrate water-level fluctuations during different seasons, including March 30, 2012 (Reneau, 2012a); June 30, 2012 (Reneau, 2012b); and March 31, 2013 (Reneau, 2013).
Topography and Water-Surface Profile
Existing and new topographic data were gathered to create a topobathy digital elevation model (DEM) for the Sheboygan River mouth. Existing topographic data used in the study consisted of a bare earth DEM with a 1.8-m resolution and a 0.6-m interval contour map generated from airborne light detection and ranging (lidar) flown on November 6, 2004, by Ayres Associates (Sheboygan County, 2004). The detailed elevation data were used to define the topography of the land surrounding the river including the floodplain, islands, terraces, valley side-slopes, and nearby uplands. Accuracy was analyzed by the Sheboygan County surveyor in 2006 by comparing the lidar data to 115 known points (E. Harvey, Sheboygan County, written commun., 2006). The vertical errors in the DEM data ranged from −0.36 to 1.02 m, with a standard deviation of 0.16 m and a 90-percent confidence level of 0.19 m.
Field-based topographic and river water-surface profile data were collected from September 2011 through fall 2013, using RTK–GPS to fill in gaps between the lidar data and the bathymetry, and were concentrated along banks and some island surfaces in the Wildwood Islands complex. Some survey points were collected along the river shorelines in wadable areas too shallow for the boat-based acoustic depth sondes (generally less than 0.6 m). A rover, within radio distance, collected raw location and elevation coordinates by way of multiple Navigation Satellite Time and Ranging System and Russian Federation Global Navigation Satellite System satellites. Following the survey, the Online Positioning User Service (National Oceanic and Atmospheric Administration, 2014) was used to compute adjusted and more accurate coordinate data. The resulting survey data provide horizontal coordinates relative to North American Datum of 1983 and vertical elevations relative to NAVD 88; 95 percent of the orthometric height determinations were within ±0.07 m or 0.23 foot of the “true” elevation value. River water surfaces were surveyed at the beginning and end of the acoustic bathymetric and velocity surveys. Known control points were surveyed at the beginning and end of the day. A base station was set up in Kiwanis Park.
Bathymetry and Velocity
Bathymetry and velocity data were collected from the lower Sheboygan River from September 2011 through November 2011 with a down looking multibeam sonar and Rio Grande acoustic Doppler current profiler (ADCP) (table 1). The multibeam sonar, mounted to the side of a boat, was used to collect bathymetry data from the 8th Street bridge to the Wildwood Islands complex on September 7–8, 2011, in areas that had water depths greater than about 0.6 m. A “painting” style of closely spaced track lines was used, which achieved close to 100-percent coverage with technical assistance from Paul Kinzel from the USGS Sediment Transport and Geomorphology Laboratory in Denver, Colorado. A 1,200-kilohertz Rio Grande ADCP was deployed simultaneously with the multibeam sonar unit.
Table 1.
Collection of bathymetry and velocity data relative to Sheboygan River flows and Lake Michigan water levels.[Dates in month/day/year format. m3/s, cubic meter per second; IGLD 85, International Great Lakes Datum of 1985; kHz, kilohertz; ADCP, acoustic Doppler current profiler]
Upstream from the Wildwood Islands complex and where depths were less than 0.6 m, an ADCP towed by a kayak was used to collect bathymetry data. Pathways included a zig-zag pattern and cross-stream transects (fig. 1). The cross-stream transects were 150 to 300 m apart with closer spacing surrounding the islands. The ADCP data were collected in October and November 2011 during low flow and during a small runoff event when higher water levels allowed more coverage in shallow areas by the kayak and ADCP setup (table 1). Boat-mounted RTK–GPS was used in the multibeam and ADCP surveys.
The RTK–GPS was used to collect survey-grade water-surface elevations during the multibeam and ADCP surveys. The water-surface elevations were used to convert water depths to elevations. The converted bathymetry data were combined with the survey-grade GPS elevations along the shorelines and banks and the 2004 Sheboygan County lidar (Sheboygan County, 2004) to create a seamless dataset of topography and bathymetry. These elevation data were used in the FaSTMECH model, and the data file is available in Westenbroek and others (2023).
A stream-wise longitudinal profile of average velocity, water level, and interpreted streambed elevation was constructed by fitting the water levels from the ADCP with simultaneous elevation measurements made with the RTK–GPS. The data for the longitudinal profile, which extends from Interstate Highway 43 to Pennsylvania Avenue, are in Fitzpatrick and others (2025).
Streambed Substrate
Bed substrate data were collected at five points along the cross-stream transects (fig. 1) using a ponar dredge in unwadable areas and a shovel in wadable areas. Locations were recorded with a nonsurvey-grade handheld GPS with a horizontal accuracy of approximately 3 to 4 m. Percentages of major size classes visually were estimated to the nearest 10 percent. In addition, presence of decomposing algae/sludge or mats of leaves were noted. A gravelometer was used for gravel and cobble sizes and a sand card was used for sand categories of very fine (greater than or equal to 0.063 millimeter [mm] to less than 0.125 mm), fine (greater than or equal to 0.125 mm to less than 0.250 mm), medium (greater than or equal to 0.250 mm to less than 0.500 mm), coarse (greater than or equal to 0.500 mm to less than 1.00 mm), and very coarse (greater than or equal to 1.000 mm to less than 2.000 mm). Data for substrate are in Fitzpatrick and others (2025).
Hydrodynamic Simulations of Varying River Flows and Water Levels
Spatial variations in river velocity and water levels for the Sheboygan River in the vicinity of the Wildwood Islands complex under a range of river flows and lake levels were simulated with the USGS FaSTMECH 2D quasi-steady-state hydrodynamic model and the iRIC (International River Interface Cooperative) graphical user interface tool, version 2.3 (Nelson and others, 2006, 201634; International River Interface Cooperative, 2016). Data used for hydrodynamic simulations came from multiple sources and included the topography, bathymetry, river discharge, river water levels, and lake water levels compiled and collected for this study. Model-related data and outputs are published in Westenbroek and others (2023).
The 2D hydrodynamic model FaSTMECH was run for multiple scenarios of combinations of river discharge and lake levels. The selected combinations are examples of how lake levels, seiche magnitude, and river discharge interact to affect river currents. Like most numerical hydrodynamics models, FaSTMECH requires elevation data to define a computational grid. Data used in the elevation grid development were derived from a combination of sources discussed previously:
-
1. USGS ADCP deployment on transects along the river, and on longitudinal surveys made from a kayak and multibeam sonar;
-
2. RTK–GPS surveys, in which the survey antenna rod was placed directly on the river bottom to make a measurement of the bed elevation; and
-
3. Sheboygan County 2004 lidar data ( Sheboygan County, 2004).
Despite the large number of bottom elevation measurements obtained during ADCP, RTK–GPS, and multibeam sonar surveys, the bathymetry had to be interpolated in some crucial areas (such as near the Wildwood Islands complex). In some cases, aerial photographs were used along with measured bottom elevations to estimate bottom elevations in areas of low data density. The gridding process supported within the iRIC software creates a continuous curvilinear grid of bottom elevations suitable for use with FaSTMECH; “templates” are used to control the amount of averaging, with separate rules for selecting data points depending on their location (upstream/downstream, side-to-side) relative to the point for which bottom elevation is to be estimated. The template interpolation method is based on a nearest neighbor approach that utilizes a template with a user-defined width and length, where the length follows the local curvature of the grid. Interpolated values are assigned the inverse distance weighted average of all measured points in the template. The template can be set to expand in size until points are determined.
The grid used in this work was created by defining a “grid creating condition,” which is essentially a line following the river centerline, extending from the Interstate Highway 43 bridge upstream to the 14th Street bridge downstream (fig. 1). The grid was defined by specifying a 100-m buffer on either side of the river centerline; this meandering area was then subdivided into 101 elements cross-stream and 1,602 elements stream-wise. This division made the grid resolution approximately 2 m in the cross-stream and 2.5 m in the stream-wise directions.
In addition to the computation grid, hydrodynamic models require definition of upstream and downstream boundary conditions. For this modeling effort, upstream discharge boundary conditions were generated from the discharge record at the Sheboygan River streamgage (fig. 1). Downstream boundary elevations were derived from interpolations from National Oceanic and Atmospheric Administration stage data at Kewaunee, Wis. (National Oceanic and Atmospheric Administration, 2024), water-level data at the New Jersey Avenue, and statistics associated with historical Lake Michigan water levels.
FaSTMECH allows the user to specify the hydraulic roughness in the channel by either providing a roughness length or a drag coefficient. Additionally, the roughness can be spatially distributed or assigned a constant value across the modeling domain. Streambed substrate size descriptions were initially used to calculate a spatially distributed roughness length. Because the model proved unstable with a variable roughness length, this approach was abandoned. Alternatively, the roughness was specified with a constant drag coefficient value. Varying model parameters like the drag coefficient allows the user to evaluate the sensitivity of the hydrodynamic model. The model was run for a range of drag coefficient values. Ultimately, a constant drag coefficient value of 0.0035 provided the best fit between modeled and observed water levels at the stage recorder at New Jersey Avenue downstream from the Wildwood Islands complex and was used in the subsequent model runs.
The FaSTMECH manual gives a rule-of-thumb for selection of the initial lateral eddy viscosity (LEV) using the following equation:
where,For the Sheboygan River, reasonable values are 0.5 meter per second (m/s) and 1 m, respectively, or an LEV of 0.005. To achieve model stability, iRIC was allowed to start the solution with an LEV value of 0.05; starting with iteration 20, this value was ramped down to a final value of 0.005 at iteration 1,000. Because the maximum number of iterations was capped at the default of 600, this amounts to use of an LEV value of about 0.023. Spot-checking of velocity magnitude and water-surface elevation at key locations for a range of LEV values indicates minimal local changes (less than 0.1 m/s and less than 0.03 m).
Similarly, modeled convergence was generally between 8 and 14 percent. Lower convergence values (on the order of 4 to 7 percent) could be obtained by increasing the number of model iterations to 2,000. However, spot-checking results at key model grid cells did not indicate significant differences, so the number of iterations was capped at the iRIC default of 600.
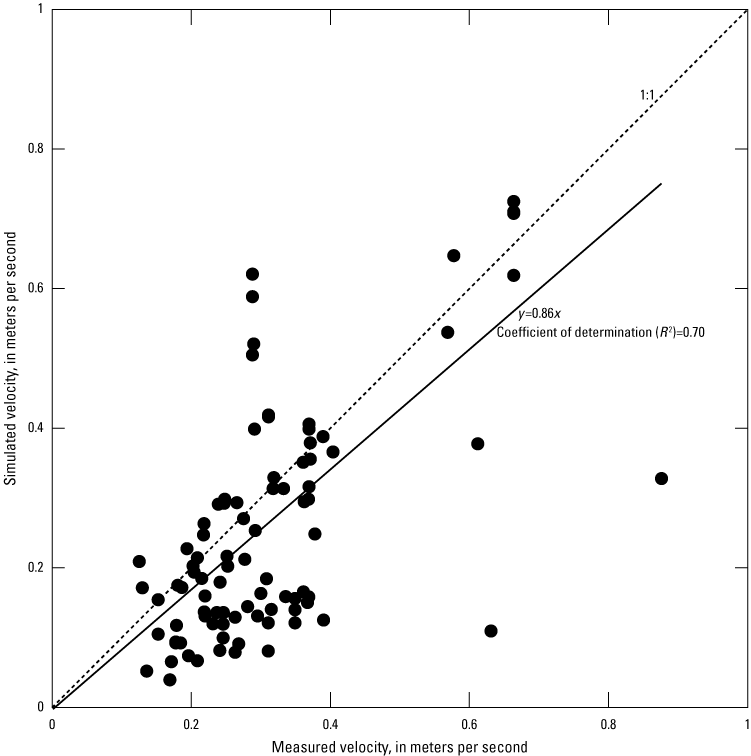
The modeled velocity magnitudes were validated with ADCP-measured velocities collected on October 24, 2011, during low flow, low lake-level conditions (fig. 3; Fitzpatrick and others, 2025). A mean daily value of 2.12 cubic meters per second (m3/s) at the Sheboygan River streamgage and a Lake Michigan mean daily water level of 175.1 m above IGLD 85 at the Kewaunee lake gage were used. A subset of 90 measured velocity data points was chosen for the comparison when the ADCP bottom tracking setting was used. These data have the most reliable location information. For each simulated velocity for the center point of each grid, the nearest three measured velocities were selected using an R script. If there were no ADCP matches for a grid, the simulated velocity point was dropped. Additionally, if there were widely different flow directions for the simulated compared to the measured data point, the simulated data point was dropped. Measured and simulated velocities in the comparison dataset ranged from greater than 0.1 to less than 1 m/s. The simulated velocities were generally less than the measured velocities. Velocity reversals happened quickly in the vicinity of the Wildwood Islands complex and downstream, making it difficult to compare one-on-one simulated to measured velocity data.
Comparison of measured velocity data from October 24, 2011, with simulated velocity from a low flow, low lake-level simulation.
A combination of steady-state Sheboygan River streamflows and Lake Michigan water levels was used to simulate water levels and velocities through the Wildwood Islands complex reach for nine scenarios, with upstream and downstream boundary conditions derived from significant minimum, mean, and maximum values. Observed velocity data from July 2012 indicated frequent changes in flow velocity (on the order of 15 minutes or so) as well as frequent stage changes. Two of the nine scenarios focused on the minimum and maximum downstream boundary conditions experienced during a sequence of seiche events captured during July 2012.
Hydrogeomorphic History
The hydrogeomorphic history of the Sheboygan River mouth reflects the long-term connection of flows in the Sheboygan River with Lake Michigan water levels. The combination of flows and lake levels in turn affect seiches, sedimentation patterns, and landforms in the mouth of the Sheboygan River. This section contains a summary of the post-glacial geomorphic setting, and short descriptions of qualitative and quantitative changes in water levels and river flows. Landform changes relative to water-level changes were highlighted for the Wildwood Islands complex. The study took place during a particularly low water-level period for Lake Michigan, with water levels below the low water datum (LWD) in the Sheboygan River downstream from the Wildwood Islands complex. The winter and early spring of 2013 were also especially noteworthy for frequent ice jams in the vicinity of the Wildwood Islands complex (example video from Reneau, 2013).
Post-Glacial Geomorphic Setting
The terraces, valley character, and meanders of the Sheboygan River reflect the post-glacial drainage history and Holocene lake-level variations more so than modern alluvial processes. Understanding the extent and timing of the postglacial landforms relative to the modern river helps to describe the hydrogeomorphic history and resulting hydrodynamic and habitat features of the modern river. These landforms resulted from the interaction of retreating glacial ice with glacial meltwater and paleolake fluctuations (Richardson, 1991; Carlson and others, 2011; figs. 4 and 5). When glacial ice covered what is now the valley of the Sheboygan River, flow of meltwater off the glacier was to the south and southwest, noted by the sand and gravel outwash deposits along the valley side at the west edge of the study area. Wave-cut terraces and paleo lacustrine deposits associated with the Glenwood, Calumet, Algonquin, and Nipissing paleolakes are present along the length of the valley in the study reach. Near the Ozaukee diamicton, the ancestral Sheboygan River had a large meander to the north. This meander likely formed after the Valders readvance and before the Calumet high lake stage (Richardson, 1991). The valley narrows where it intersects the western side of the Valders diamicton but then widens downstream before entering the large expanse of glaciolacustrine deposits associated with the Glenwood high stage. The small patches of late Holocene sand and silt in the middle of the modern Sheboygan River in the vicinity of the Valders diamicton are the Wildwood Islands complex.
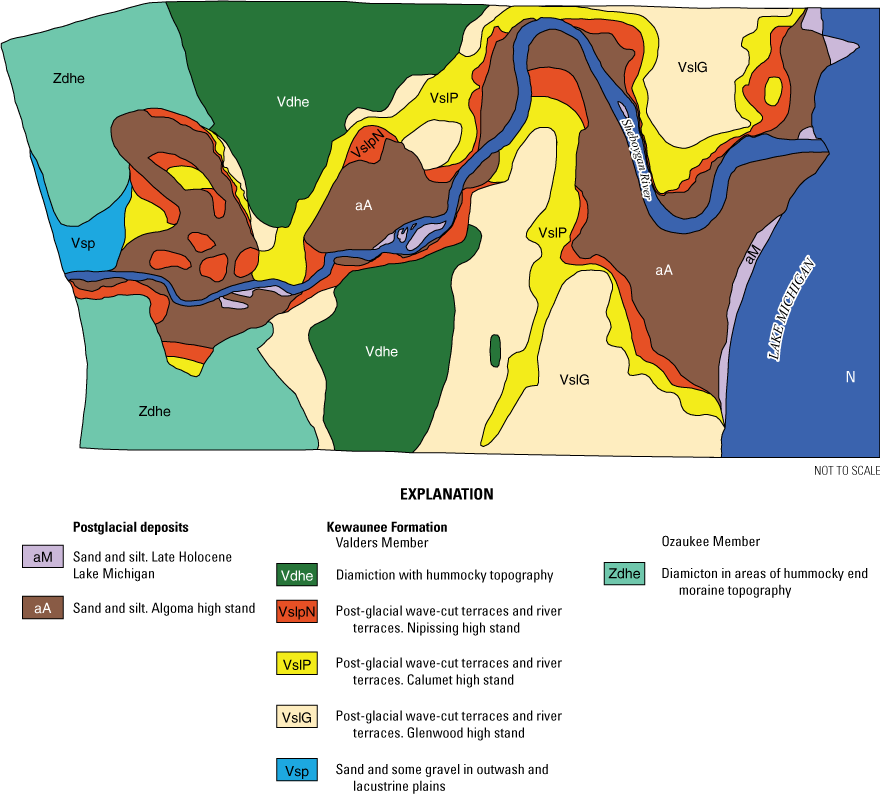
Glacial and post-glacial surficial deposits and landforms in the vicinity of the lower Sheboygan River (adapted from Richardson, 1991; Carlson and others, 2011).
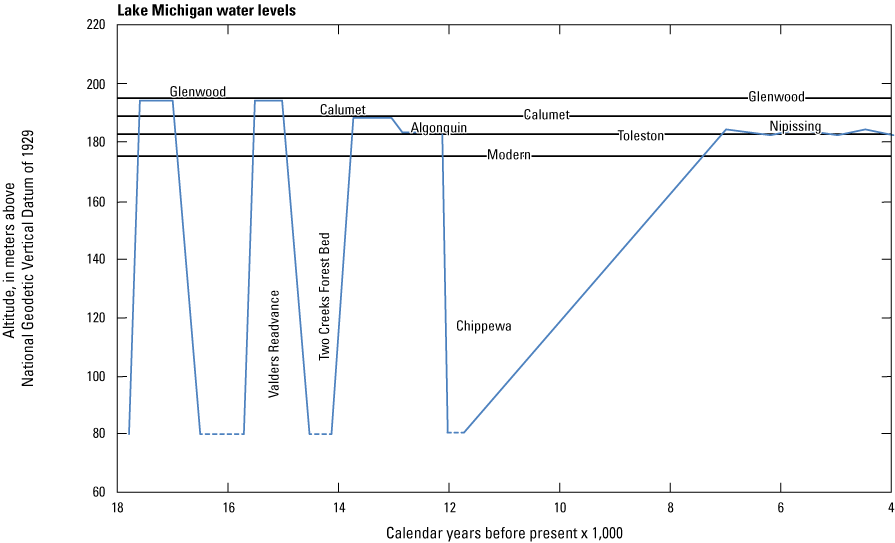
Paleo water levels of Lake Michigan in the vicinity of the lower Sheboygan River (adapted from Richardson, 1991; Carlson and others, 2011).
During successive drops in Lake Michigan water levels below 80 m above the NGVD 29 (equal to the NAVD 88 in this vicinity), at about 16,000; 14,000; and 11,500 years BP (fig. 5), the valley of the Sheboygan River would have likely been much deeper than its modern level (Kiesel, 1998; Carlson and others, 20115). After the Chippewa low stand, the lake level rose to the Nipissing level of about 184 m above NGVD 29 from 7,500 to 5,000 years BP. The lake level decreased until about 3,200 years BP, during which time the valley likely eroded (Kiesel, 1998; Kiesel and Mickelson, 2005). Following about 3,200 years BP, lake levels have varied but have been somewhat like modern levels of about 177 m. However, between about 3,000 and 2,200 years BP, a higher stand of the lake called the Algoma level (not shown) was at about 180 m (Thompson and Baedke, 1999). Deposits associated with the Algoma level blanket the valley bottom throughout most of the study reach (fig. 4). Another slightly higher stand peaked at 177.7 m about 1,600 years BP (not shown).
Historical Lake Michigan Water-Level Fluctuations
Historical Lake Michigan water-level elevations were converted from the vertical datum of IGLD 85 to NAVD 88 for this report to provide a common datum for describing relations among lake levels and Sheboygan River landforms described in later sections. Elevations with the vertical datum of NAVD 88 are 0.14 m higher than elevations with a vertical datum of IGLD 85 in the vicinity of the Sheboygan River mouth. A variety of Lake Michigan water levels, along with summary data from the Sheboygan River stage recorder at New Jersey Avenue, are shown for comparison in table 2.
Table 2.
Selected water levels for Lake Michigan and lake-affected Sheboygan River (U.S. Army Corps of Engineers, 1988; National Oceanic and Atmospheric Administration, 2016b).[IGLD 85, International Great Lakes Datum of 1985; NAVD 88, North American Vertical Datum of 1988]
From about 100 to 1800 A.D., water levels in Lake Michigan fluctuated by more than 1 m, ranging from a low of 176.7 m to a high of 178 m above the NAVD 88 (Baedke and Thompson, 2000). During the last 200 years or so, lake levels have fluctuated from the record high of 178 m in 1838 to a record low of 175.7 m in 2013 (Gronewold and others, 2013). During 1918 to 2012, the monthly average Lake Michigan water level was 176.6 m. The AEP for 0.01 for Lake Michigan was 177.9 m and the AEP for 0.10 was 177.4 m (U.S. Army Corps of Engineers, 1988). The ordinary high-water mark (OHWM) was also 177.4 m, and the LWD was 176.2 m.
Interaction of Lake Levels and River Flows
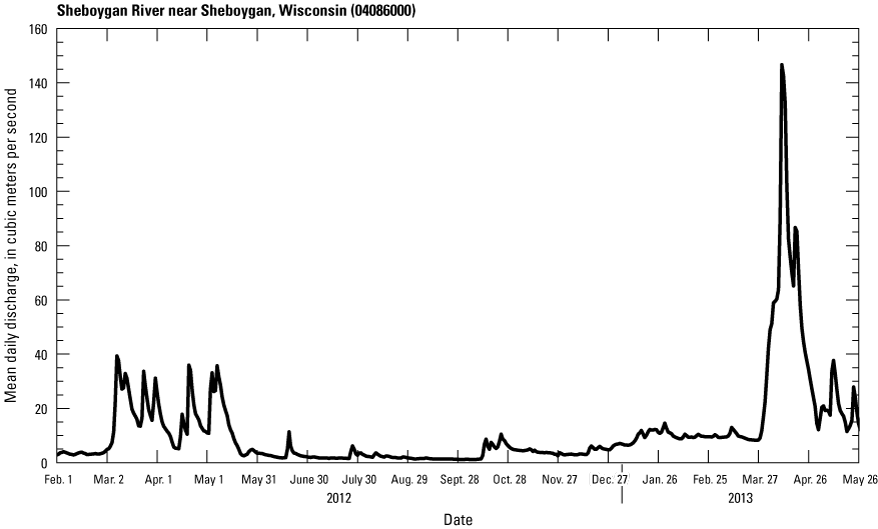
The hydrogeomorphology and hydrodynamic characteristics of the Sheboygan River AOC are affected by Lake Michigan water levels, river flows, and seiches. Comparison of water levels in the rivermouth with those in Lake Michigan (fig. 6, table 2) provided information about how the river flows and short term and seasonal lake-level variations interacted. The Kewaunee lake gage is the closest lake gage to the study area and is located 100 km north of the Sheboygan River. From March through June 2012, water levels generally climbed about 0.1 m but then fell by about 0.5 m through December 2012 (fig. 6A). Water levels rapidly varied from seiches on about 60 to 90 minutes cycle on the order of ±0.1 m; however, the magnitude of some of the fluctuations was sometimes closer to ±0.3 m, especially during November and December months.
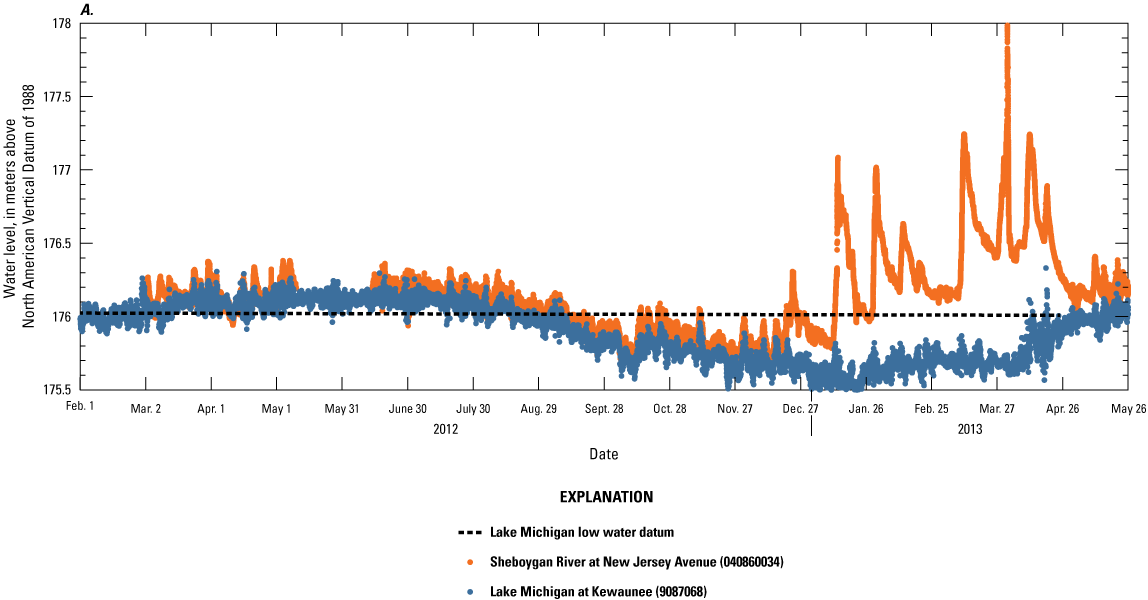
Variations in water levels for Lake Michigan at Kewaunee (National Oceanic and Atmospheric Administration identification number 9087068) and Sheboygan River at New Jersey Avenue (U.S. Geological Survey identification number 040860034). A, February 2012 through May 2013. B, March through April 2012.
Water levels at the Sheboygan River stage recorder at New Jersey Avenue (U.S. Geological Survey, 2024) showed similar variations in 2012 water levels in comparison with the Kewaunee lake gage except when river flows were high (figs. 6 and 7). Water levels were less than the Lake Michigan LWD of 176.2 m in the lake and the Sheboygan River for much of the time. Seiche minimums at the Sheboygan River at New Jersey Avenue were commonly 0.6 m less than the LWD in October through December 2012. Water levels in the Sheboygan Rivermouth ranged from a minimum of 175.6 to more than 176.4, including the seiche minimums and maximums from 5-minute data, which is a total range of more than 0.8 m during the summer and fall 2012 low flows.
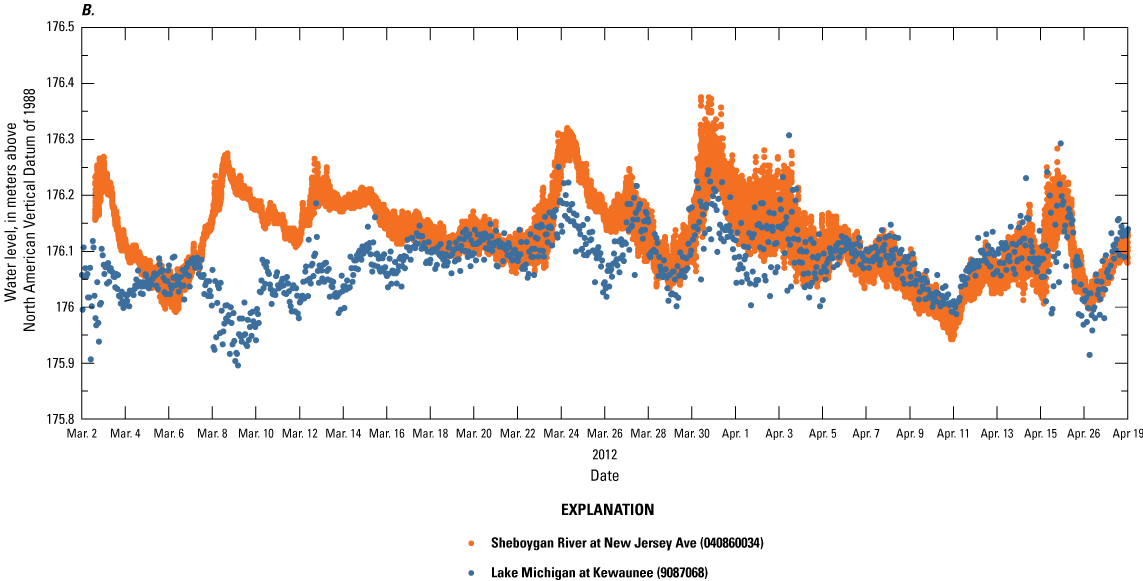
Streamflow (mean daily discharge) from March 2012 through May 2013 at the Sheboygan River at Sheboygan, Wisconsin, streamgage (U.S. Geological Survey identification number 04086000).
Water-level increases at the Sheboygan River at New Jersey Avenue not mirrored at the Kewaunee lake gage were from increased river flows (figs. 6 and 7). Spring high flows in 2012 were relatively small compared to 2013 (fig. 6A) and were reflected by higher river stages at the New Jersey Ave stage recorder than the Kewaunee lake gage (fig. 6B). The summer of 2012 was droughty and river levels generally mirrored lake levels (Scott, 2012; fig. 6A).
The ever-varying combination of flows and seiches in the lower Sheboygan River result in highly fluctuating water levels that change the type and areal extent of local aquatic and shoreline habitat over very short time intervals. The result of this combination is multiple overlapping habitats within the same areal footprint. This result is observable in three example sets of time-lapse photographs from the Wildwood Islands complex when water levels varied more than 0.3 m within less than 24 hours during an early spring high flow (March 30, 2012), summer low flow (June 30, 2012), and ice jam and high spring flow (March 30 and April 1, 2013) (fig. 8; Reneau, 2012a, 2012b, 2013). At the end of March and beginning of April 2012, a high frequency seiche of about 0.2 m and with an interval of less than 60 minutes dominated the pattern of water-level variations, especially leading up to a rainfall event as a low-pressure system moved in from the west. As river flows increased during the March 30, 2012, event, water levels increased and seiche-related variation decreased (fig. 6B). During summer low flow, sand and gravel bars exposed near the islands go through several cycles of inundation and exposure. Bar areas exposed near the islands are popular for feeding birds in all seasons (figs. 8A, E).
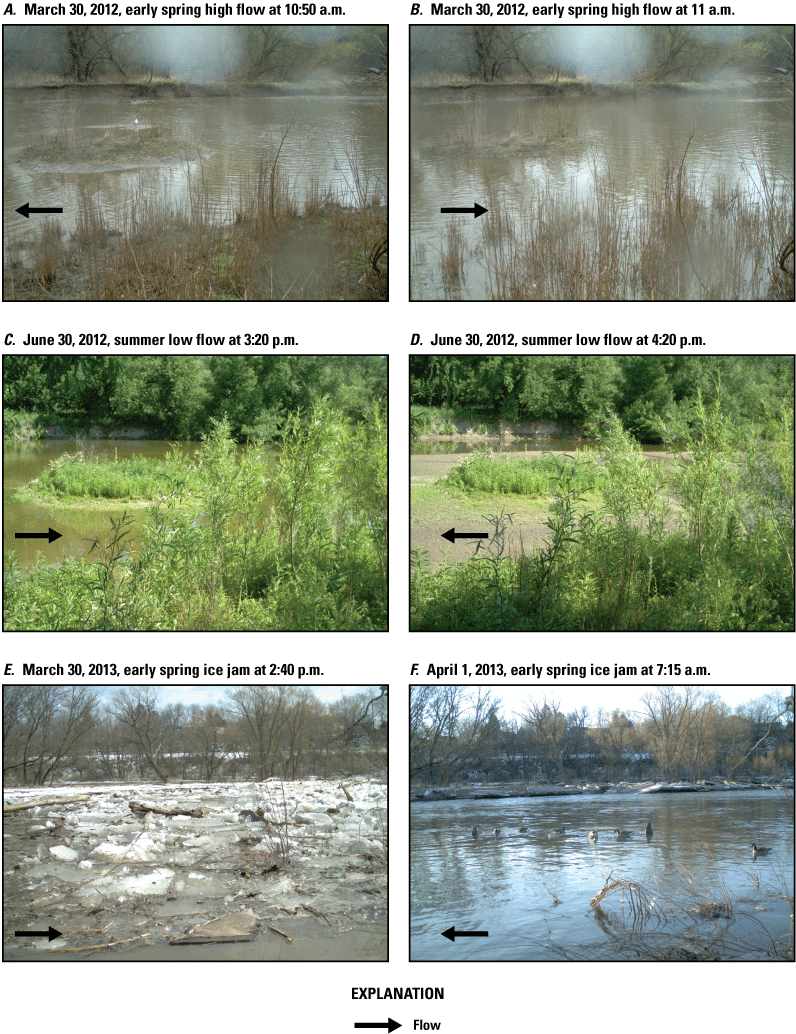
The interaction of fast changing water-level fluctuations (greater than 0.3 meter) and landform exposure and rewetting. Photographs from the time lapse camera. A, March 30, 2012, early spring high flow at 10:50 a.m. B, March 30, 2012, early spring high flow at 11:00 a.m. C, June 30, 2012, summer low flow at 3:20 p.m. D, June 30, 2012, summer low flow at 4:20 p.m. E, March 30, 2013, early spring ice jam (post island rehabilitation) at 2:40 p.m. F, April 1, 2013, early spring ice jam (post island rehabilitation) at 7:15 a.m. River flows are from right to left when not affected by backwater. (Photographs from Reneau, 2012a, 2012b, 20133839).
Ice jams are common along the study reach and can quickly raise and lower water levels in the Sheboygan River near the island complex, as shown in a March 31, 2013, video (Reneau, 2013). The ice jams, combined with varying upstream and downstream river currents, transport and deposit large wood, brush, and organic debris on the islands and banks at stages not possible with one-directional downstream-only flow. The ice jams and their vegetative debris were attractive to migrating wildfowl during the 2013 spring melt (fig. 8E, F).
In the winter of 2012 and into spring of 2013, the flows and stages of the Sheboygan River were relatively high compared to most of 2012. The spikes in stage at New Jersey Avenue starting in the winter 2012–13 reflect build up and release of several ice jams that lasted through the end of April 2013, with five jams causing water levels in the vicinity of 177.2 m above NAVD 88 or near the Lake Michigan OHWM (fig. 6A, table 2). A combination of high flow and ice jams in early April resulted in a stage of 178 m above NAVD 88 at New Jersey Avenue. This stage is similar to the stage associated with the 1-percent AEP streamflow and to the record high water level for Lake Michigan (table 2). In contrast, the flows in the Sheboygan River had an AEP of about 20 percent. A time-lapse video documented the water levels nearing and exceeding most of the surface of the main island (Reneau, 2013).
Sheboygan River Streamflow Trends
The Sheboygan River had statistically significant increases in average annual and annual 7-day low flows, but significant trends in annual flood peaks were not observed during the period of record for the streamgage from 1916 to 2008 (fig. 9A). The flow at the Sheboygan River streamgage is affected by an upstream dam and is missing records from 1924 to 1950, but the trends in average annual flow and low flow still mirror trends at other agricultural rivers in southern Wisconsin for similar streamflow characteristics (Gebert and others, 2016). Gebert and others (2016) determined that increasing average annual flow and low flow were from a combination of increased annual precipitation and agricultural conservation practices. The adoption of agricultural management practices that reduce runoff and increase infiltration in the 1960s–70s helped to increase groundwater recharge and stream baseflow. Juckem and others (2008) had similar findings for the causes of increased baseflow in southwest Wisconsin streams. These same agricultural practices may have been responsible for mitigating expected increases in annual peak flows from increased precipitation and frequency of large rainfall events (Nelson Institute for Environmental Studies, 2011). The average annual flow rose from about 6 to 9 m3/s, and the average 7-day low flow from about 0.5 to 1.5 m3/s. The threefold increase in the size of low flows in the Sheboygan River likely helped to sustain aquatic organisms during dry periods, such as those experienced in 2012.
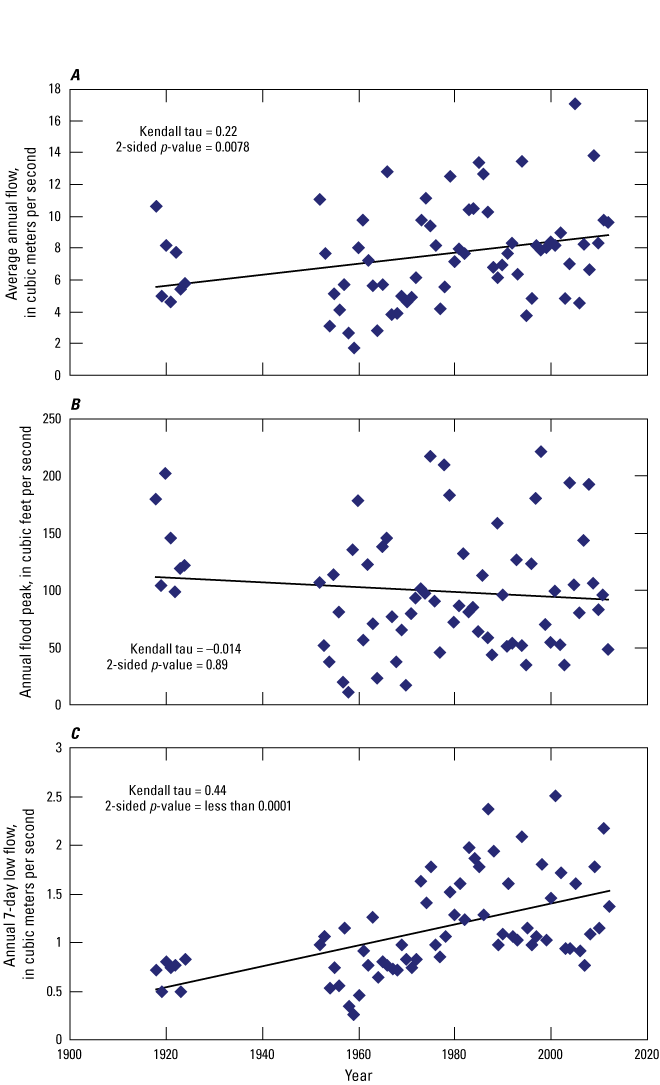
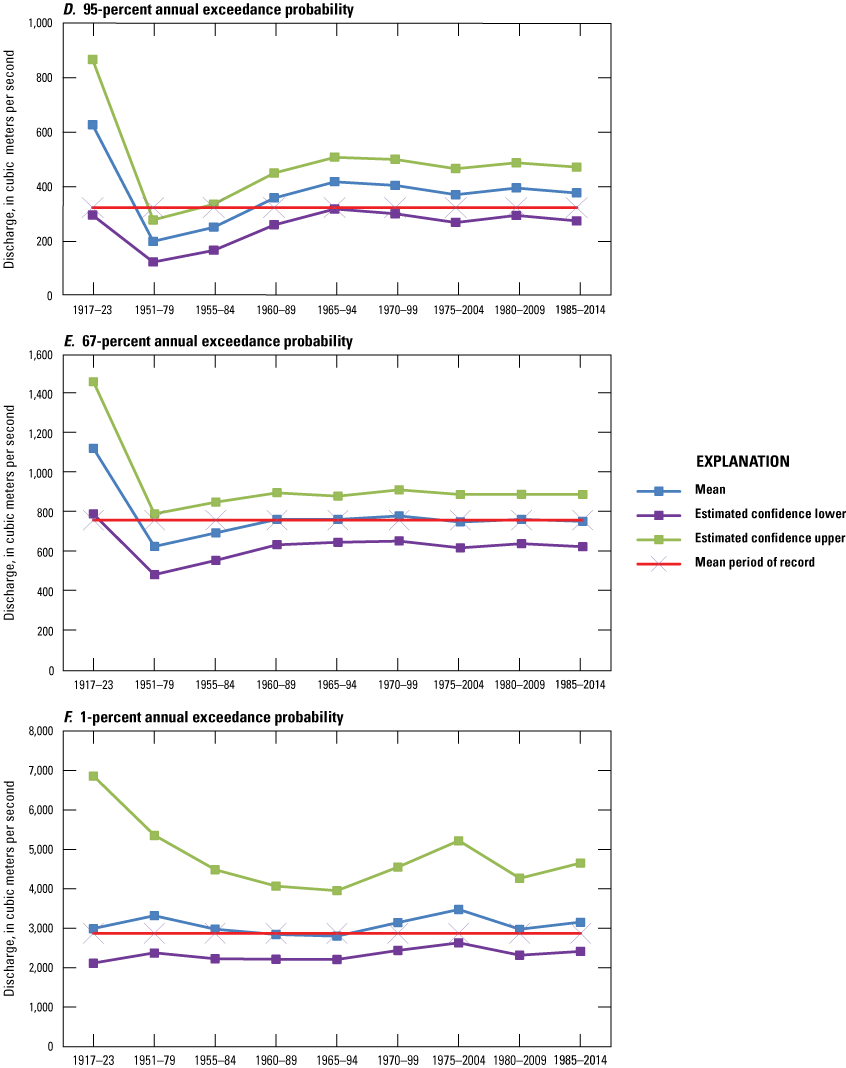
Trends for the Sheboygan River at Sheboygan, Wisconsin (U.S. Geological Survey identification number 04086000). A, Average annual flow. B, Annual flood peak. C, Annual 7-day low flow. D, Annual exceedance probability of 0.95. E, Annual exceedance probability of 0.67. F, Annual exceedance probability of 0.01.
Results from the analyses of trends in AEPs for annual peak floods are supportive of the results from the Kendal tau analyses (fig. 9D–F). Low magnitude, high frequency floods with streamflows associated with an AEP of 95 percent are approximately 50 m3/s higher for 1985–2014 compared to the mean for 1916–2014. Streamflows associated with an AEP of 67 percent remained similar during most of the period of record. Streamflows associated with an AEP of 67 percent are commonly used as a surrogate for bankfull or channel-forming flows for channel design. The flood with an AEP of 1 percent, which is used for flood planning and zoning, was 280 m3/s larger for 1985–2014 period than for 1916–2014. Increases in streamflows associated with an AEP of 1 percent could affect decisions related to the design of rehabilitation features, such as additions of large wood, which would add roughness, slow velocities, and increase water levels.
Wildwood Island Planform Changes, 1938–2010
The areal extents of Wildwood Island and other smaller, nearby islands have changed with time, mainly through erosion of what used to be a much larger single island into a main island with approximately 10 adjacent islands and bars (fig. 10). River flows around the islands have changed from being mainly on the north side of the main island in 1938 to almost equal flow going around both sides of the island in 2010 (fig. 10). A second island was located to the west of the main island in 1938, but between 1938 and 1941 it became attached to the adjacent northern shoreline (fig. 10).
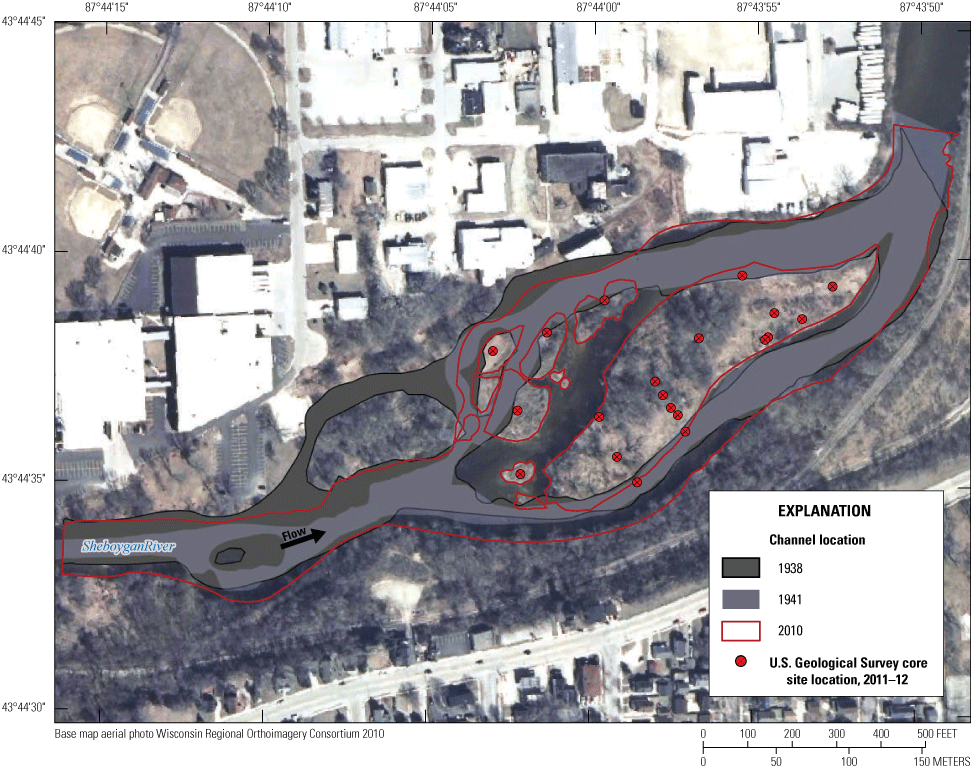
Changes in the planform of the Sheboygan River and Wildwood Islands complex, Sheboygan, Wisconsin, 1938–2010.
About 35 percent of area of the main island, mostly on the western upstream side, was eroded between 1938 and 2010 (fig. 10) The main island surface area decreased from 2.4 to 1.6 hectares. The five smaller islands or bars to the west of Wildwood island are remnants of what used to be the western side of the main island. The eastern, downstream side of the island has been growing slowly. Lake Michigan water levels in 1938 and 1941 (National Oceanic and Atmospheric Administration, 2016b) were like those in 2010 at about an average of 176.1 to 176.2 m above the NAVD 88. From 1938 to 1974, the presence of at least one structure on the main island is observable on the orthophotographs. It also appeared that woody vegetation was kept down and clearings on the island may have been mowed or farmed. By 1992, the clearings were gone, and trees had grown in over most of the upstream half of the island (fig. 10).
Wildwood Islands Complex Geomorphology and Sedimentation History
The erosion and sedimentation of bars and islands in the Wildwood Islands complex are closely linked to paleolake and modern water-level fluctuations and interactions with river flows. This relation is illustrated in the landform topography of the islands and cross-valley transects of island landforms and sedimentation patterns relative to water levels (fig. 11). Most of the sediment cores collected for this study were located on the main island, with five cores located on smaller islands and bars (fig. 2). The transects are described in the following paragraphs from upstream to downstream. Core and transect survey data are published in a USGS data release (Fitzpatrick and others, 2025).
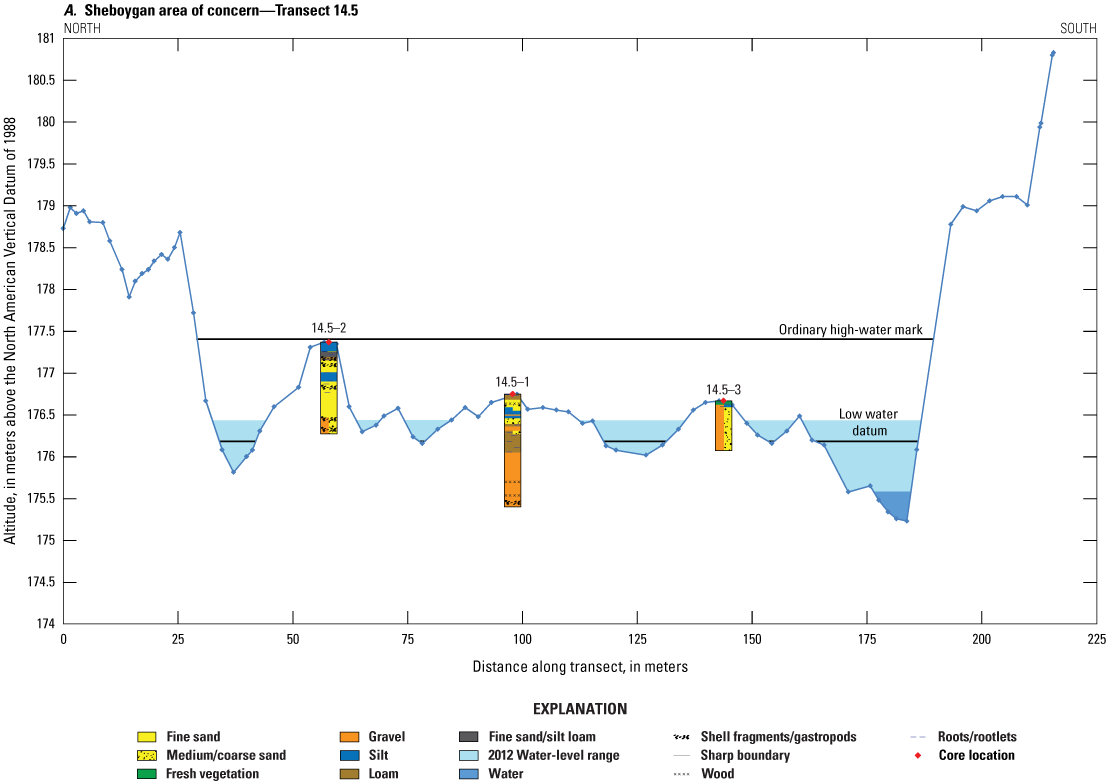
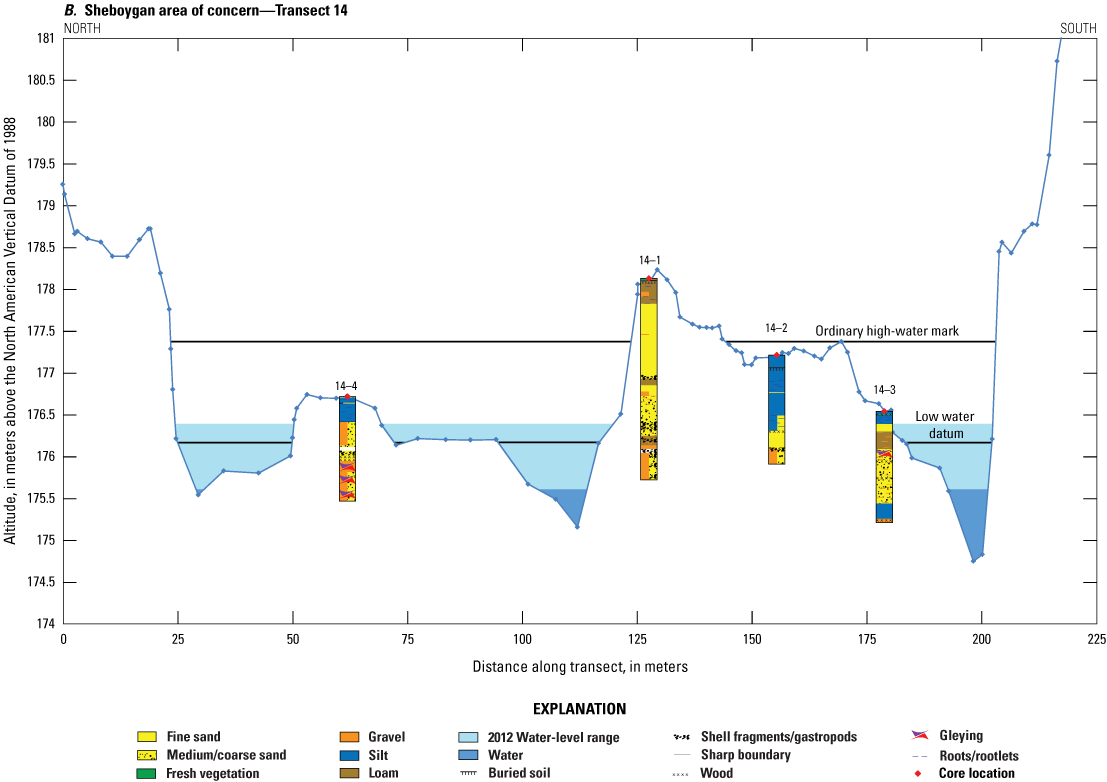
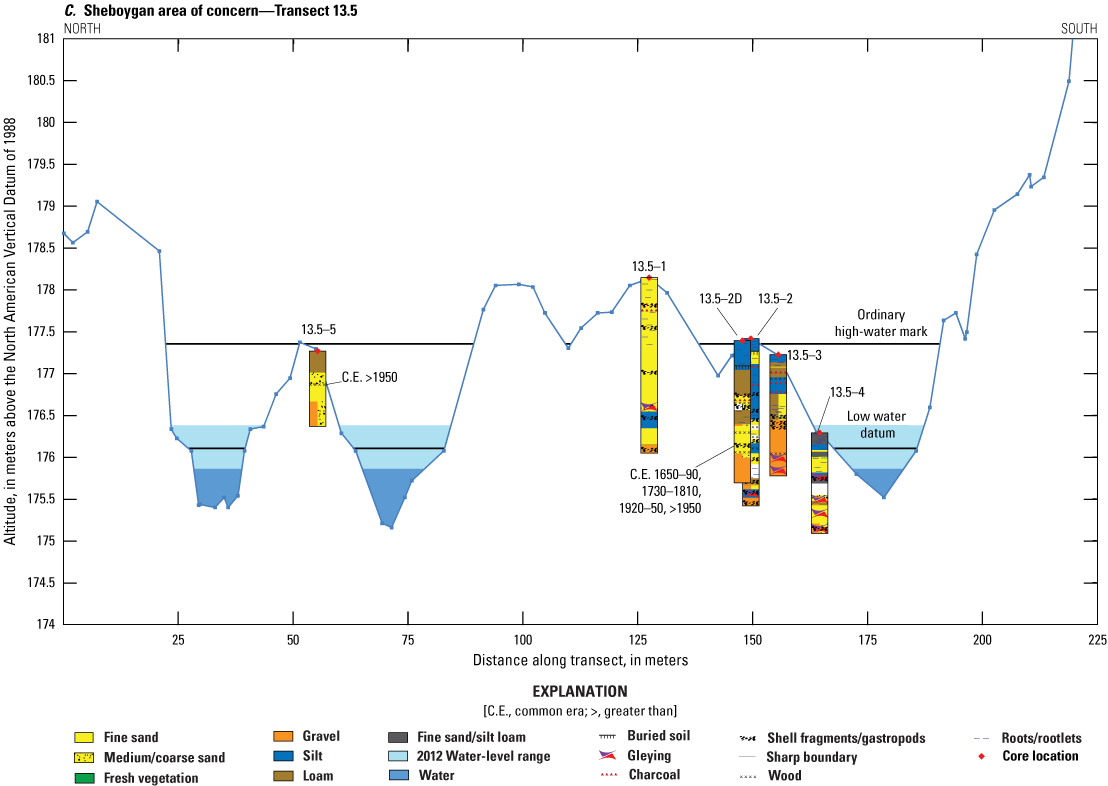
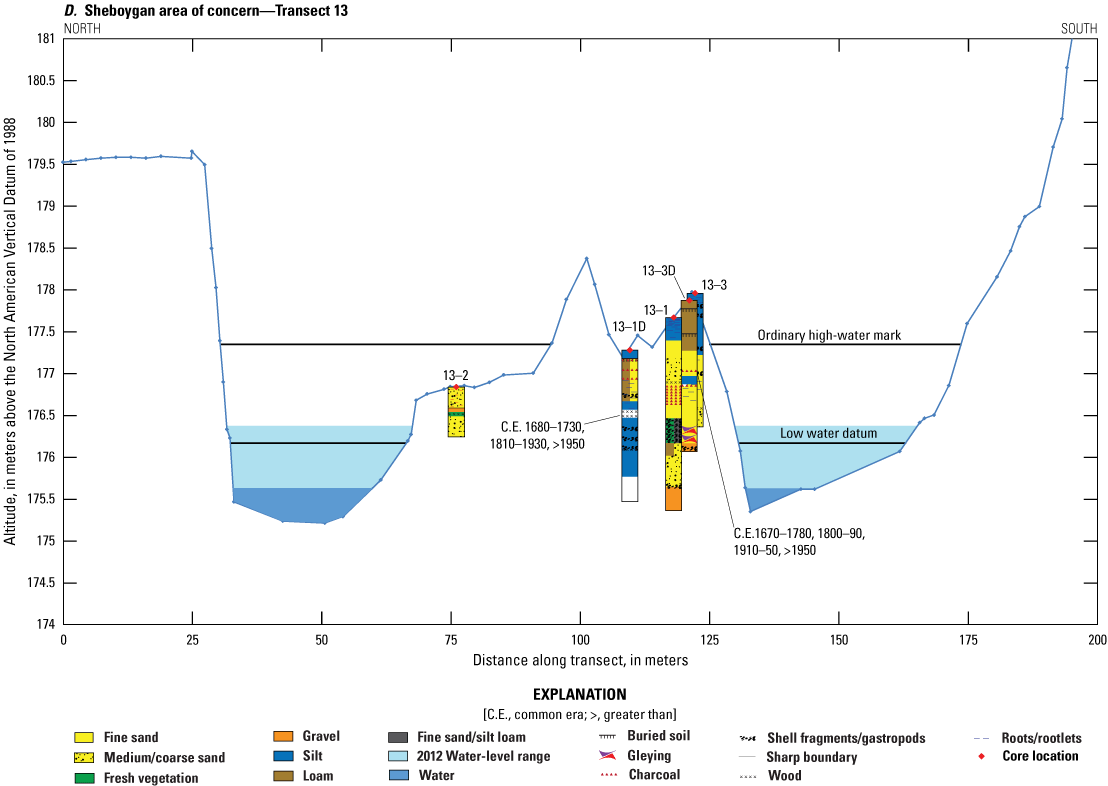
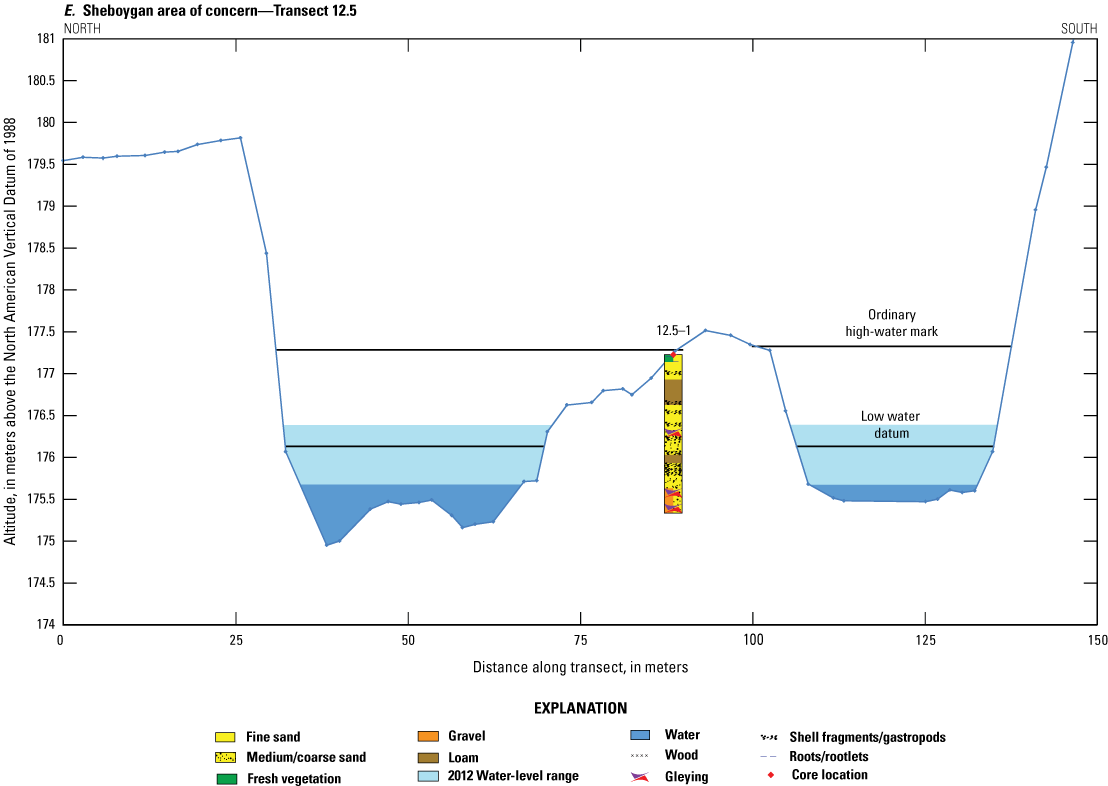
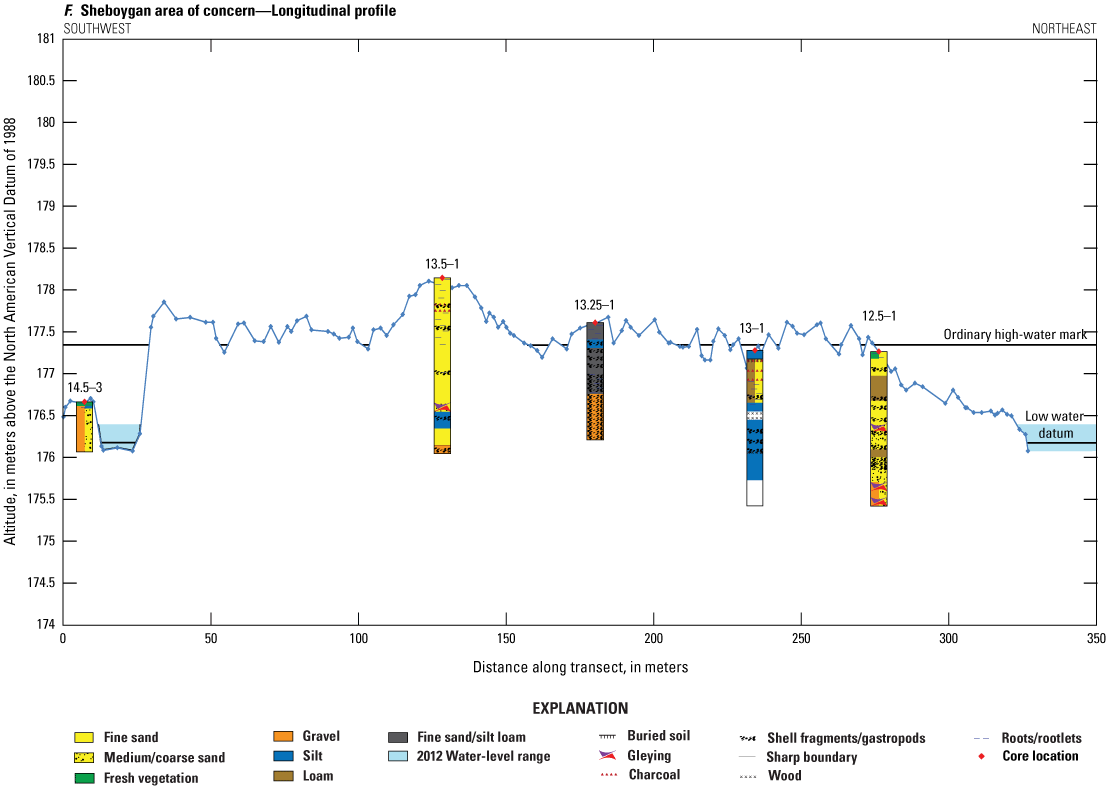
Landform topography and sediment cores of the Wildwood Islands complex in the Sheboygan River. A, Transect 14.5. B, Transect 14.0. C, Transect 13.5. D, Transect 13.0. E, Transect 12.5. F, longitudinal streamwise transect from upstream to downstream ends of the Wildwood Island. Location map for the transects and cores is in figure 2.
Transect 14.5 crosses one small island and two bars on the upstream side of the main island (figs. 2, 11A). Core 14.5–2 was collected from a separate island that has been present since at least 1938 (fig. 10), whereas cores 14.5–1 and 14.5–3 are from the erosional remnant of the main island (fig. 10). The surface elevation of the small, most northwest island is about 177.4 m, which is the same as the 10-percent AEP and the OHWM for Lake Michigan. This island has a core of sand and gravel covered with about 0.8 m of layered silt and fine sand. The surface elevations of the other two bars are about 176.7 m, which are about 0.1 to 0.2 m higher than the mean lake level and the highest measured water levels in 2012. During summer low flows and minimum seiche-related levels, the river water level at this transect was 0.2 m lower than the LWD. The two north channels were dry temporarily, and the southern channel had approximately 0.3 m of water depth. The time-lapse photography documented deer and humans frequently crossing the dry and near-dry channels during low seiche water levels. The gravel on the bar near 14.5–3 is similar in size to the buried 1.5-cm diameter gravel overlain by silt and sand deposits in the cores (figs. 12A–B).
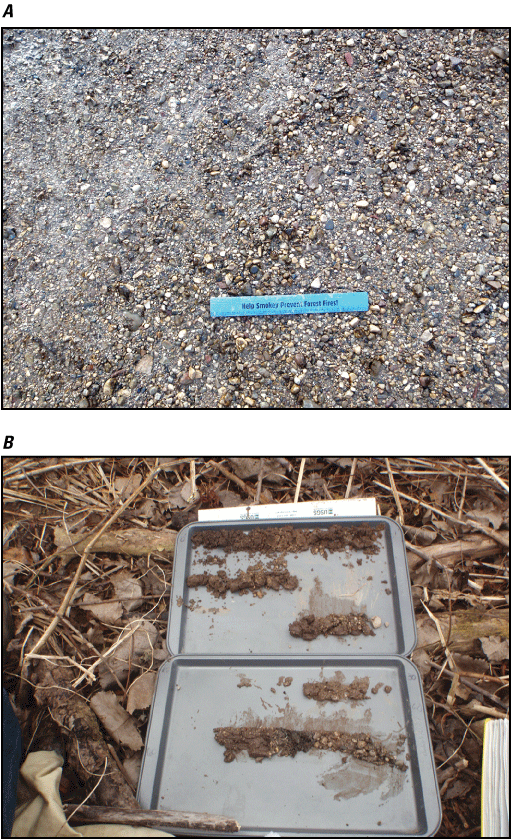
Photographs of gravel found on Sheboygan River bars and in cores from the Wildwood Islands complex. A, Gravel substrate on the bar near core 14.5–3. B, Gravel in core 14.5–1 with similar size to channel bar gravel of about 1.5 centimeters. Core increments on tins represent consecutive 0.3-meter increments, starting with 0 (surface) at the upper left.
Transect 14.0 bisects one bar and the main island (fig. 11B). The bar has a similar elevation to those shown in transect 14.5, with modern silt and sand deposits overlaying alternating sand and gravel deposits. The bar is a remnant of the main island and was cut off between 1941 and 1950, and core 14–4 is located along the previous edge of the island like core 14.5–1. The two north channels went dry during the low seiches in 2012, with about 0.5 m of water depth in the south channel.
The three cores on the main island along transect 14 illustrate varying sedimentary records associated with erosion and deposition during flood flows (fig. 11B). The north side of the island is the highest and likely the oldest. Core 14–1 contained loam and sand deposits overlying a more gravelly layer at about 176 m, which is similar to the remnant deposit on the bar at core 14.5–1. Core 14–1 had abundant 2- to 4-mm ground shells interlayered with gravel from about 175.7 to 176.1 m. Core 14–2 is on a younger side of the island, near the lee side of the erosive flows. The island surfaces for the southern two-thirds of the island would have been covered by water during the 1986 high stand of Lake Michigan. The slower river flow velocities on the lee side of the island allow silt deposition. Core 14–3 is in a slight lateral build out of the island toward the south (fig. 10), as well as having vertical accretion of silt, fine sand, and loam.
Along transect 13.5 (fig. 11C), cores were taken on an island remnant of the main island (core 13.5–5) and across the highest elevations of the main island. Silt deposition on the island remnant is relatively recent (greater than 1950), likely representative of flow changes after the meander cutoff happened upstream. The high surface of the north side of the main island continues but widens and splits with erosional flood chutes. The high surface of the main island is above the water level of 177.9 m and the flood with an AEP of 0.01. Surfaces below this level and on the lee side of the island have recent silt and loam deposits. A radiocarbon age from a wood sample 1.2 m below the surface in core 13.5–2D indicated that most of the fine sand and silt above the gravel was deposited during the last 300 years or less, such as core 14.4 along transect 14 (fig. 11B).
Transect 13.5 has a somewhat continuous shell-rich zone overlying gravel at an elevation of 176 m, and a similar layer was observed in transect 14.0 (figs. 11B, C). The shell layer consisted of well-sorted rounded fragments of about 2–5 mm in diameter with little mineral matter. The gravel unit beneath is at a slightly higher elevation on the remnant of the main island to the north and about 1 m higher in general than the modern channel bed. The gravel may coincide with a coarse facies of a delta or fan when water levels in Lake Michigan were consistently higher. This gravel layer may have been deposited during the higher level of Lake Michigan between 2,200 and 1,600 years BP.
Along transects 13 and 12.5 (figs. 11D and 11E), on the downstream half of the island, the channel on the south is dry during low seiche, whereas the channel on the north has about 0.5 m of water depth. The north side of the island along the downstream portion eroded in the 1940s to 1970s but then deposited in the 1980s and 1990s to return to the 1938 form. Meanwhile, the south side of the lower portion of the island has been eroding near core 12.5–1. The surface of the downstream side of the island along transect 13 shows areas of the island that have been aggrading with silt deposition. The lee side of the island, especially when vegetated, was prone to sedimentation of silt and sand. This area of the island had a large thick growth of Phragmites sp. during the 2011–13 study. The top 1.0 to 1.5 m of sediment on the main island along transect 13 is less than 300 years old (fig. 11D). Shell-rich zones overlying gravels at 175–176 m indicate there is a continuous shell-rich gravel layer beneath the main island. In core 12.5–1, the gravel is at about 175.5 m, which is similar to the elevation of the bed of the south channel.
The longitudinal profile running lengthwise along the main island (fig. 11F) illustrates the variable sedimentary environments and different ages of the deposits. The undulating surface varies by 0.2 m and indicates local scour or narrow flood chutes that frequently cross the island from high flows. The core on the highest part of the island contained mainly sand, indicating a higher energy environment than the younger surface downstream with silty deposits.
The location of the Wildwood Islands complex suggests that it could be a remnant coarse facies of delta deposit for the Sheboygan River when the lake level was dropping from the Algoma level to more modern levels between 2,200 and 1,600 years ago. The gravels have a high abundance of ground shells, as well as gastropod and bivalve fragments. The abundance and roundness of the shell bits indicate a large somewhat local upstream source of mussels and an energy environment, such as a beach, that could sort and grind shells.
An archeological survey conducted in the area in 2011–12 found no archeological remains on the main island (Kubicek, 2012), which is not surprising because the island surface is mainly depositional, and a large part of the island has had about 1 m of sediment deposited during the last 300 years. It is possible that remnants of the older Early and Middle Woodland cultures might be present in sediment near the shell-rich zone, which would be at or in the sedimentary layers above about 176.0 m.
Hydrodynamic Conditions, 2011–13
Velocity magnitudes and patterns in the lower Sheboygan River reflect the interaction of river flows and lake levels at hourly, daily, seasonal, annual, and multi-annual time periods. Flow reversals were common along the Sheboygan River to the upstream end of the Wildwood Islands complex, even though lake levels were below the low water datum and nearing record lows (fig. 6A) (Reneau, 2012b).
A longitudinal profile of the river bed, water surface, and velocity along the 5-km study reach indicates that historical Lake Michigan water levels have affected water depths and velocities in the Sheboygan River for a distance of 7 km upstream from the mouth at Lake Michigan (fig. 13). The downstream end of the fall 2011 longitudinal profile was the Pennsylvania Avenue bridge, which is 1.8 km upstream from Lake Michigan. Water levels in Lake Michigan in the fall of 2011 were at elevations of about 176.0–176.2 m above NAVD 88 and generally below the LWD (table 1), and the upstream end of the seiche-effected zone was in the vicinity of the Wildwood Islands complex. However, during high water levels in Lake Michigan, the seiche-affected zone would extend another 1.0 to 1.5 km farther upstream almost to Interstate Highway 43 (fig. 13). The riffle at about 300 m along the longitudinal profile (about 7 km upstream from Lake Michigan) has an elevation like the Lake Michigan water level with an AEP of 0.01 and the historic record high of 177.9–178.0 in 1838. Coincidentally, backwater effects of Lake Michigan water levels near the OHWM of 177.4 m will affect stage/discharge relations at the Sheboygan River streamgage. For the lower Sheboygan River, the elevation range of 1.2 m between the LWD and OHWM of Lake Michigan equals a river longitudinal distance of about 2 km.
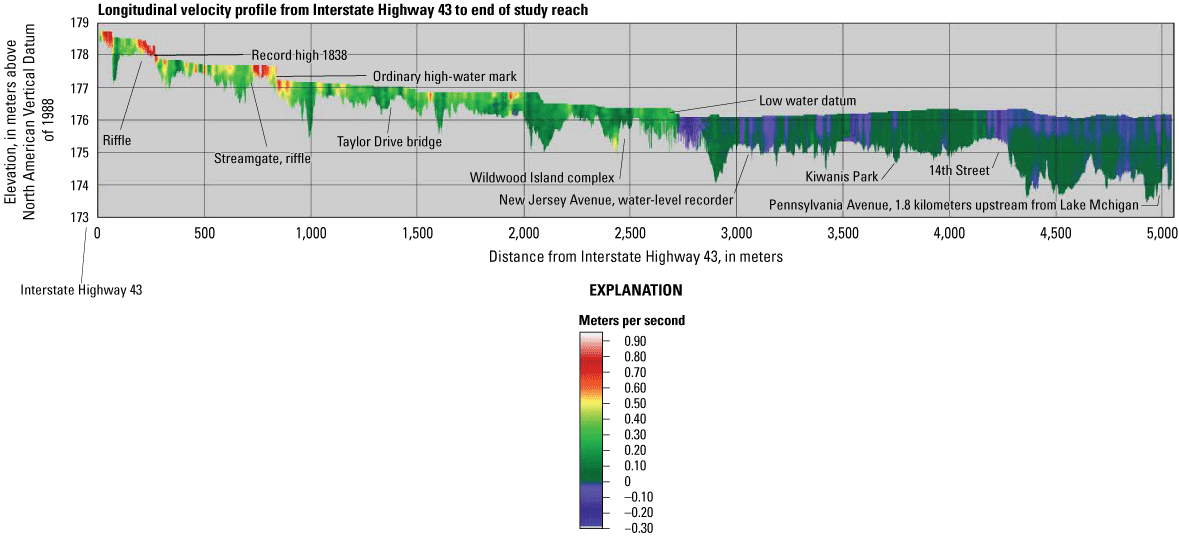
Longitudinal profile of velocity, water surface, and river bed elevation of the Sheboygan River, measured with an acoustic Doppler current profiler in fall 2011.
Water depths in the study area during the fall 2011 surveys ranged from less than 1 m to greater than 2 m during the field surveys (fig. 13). The rivermouth was deepest downstream between 14th Street and Pennsylvania Avenue where water depths were generally more than 1.5 m and exceeded 2 m in some places. This reach was dredged as part of the AOC cleanup to remove contaminated sediment. Dredging was in progress in the reach at the lower end of the study area in the fall 2011 during the bathymetry data collection. Adjacent to Kiwanis Park, water depths were generally 1 m or less, with a few short pools approaching 1.5 m. The river shoaled considerably in the vicinity of Wildwood Island, with water depths generally less than 1 m continuing upstream to Interstate Highway 43. Exceptions were scour pools in the vicinity of bridges with depths of about 1.5 m and a 2-m deep pool upstream from New Jersey Avenue.
Sheboygan River velocities during the fall 2011 surveys ranged from −0.3 to 0.9 m/s (fig. 13). Water-surface variations and velocity reversals in the backwater affected areas of the Sheboygan River from about 2,700 m to the downstream end of the profile reflect the seiche variations during the surveys. Velocity reversals of as much as 0.3 m/s were common along the lower 2.5 km. Velocities through the Wildwood Islands complex were as much as 0.3 m/s in the riffles. As noted earlier, reversals of flow through the island area were common and can be viewed in the time-lapse camera videos (Reneau, 2012a, 2012b, 2013). Proceeding upstream into lengths not affected by Lake Michigan backwater at the time of the measurements, velocities were in the range of 0 to 0.3 m/s in runs and pools but approached 0.9 m/s in riffles.
Streambed substrate in the Sheboygan River ranged from a mix of soft fine-grained silt, clay, and organic matter in the deep downstream portions of the study reach to sand, gravel, and cobble in riffles in upstream reaches, and rock up to medium boulder size, likely coming from artificial bank stabilization (Fitzpatrick and others, 2025).
Effects of Varying Lake Levels and River Flows on Rivermouth Water Levels and Velocities
A wide range of river flows and Lake Michigan water levels were simulated to illustrate the variation in water levels and velocities in the vicinity of the Wildwood Islands complex (table 3). The modeled reach extends from an upstream boundary near the Interstate Highway 43 bridge to the downstream boundary near the 14th Street bridge (figs. 1, 13). Special emphasis was placed on the Wildwood Islands complex where rehabilitation focused on bank erosion control and removal of invasive vegetation. Simulation outputs for the nine scenarios are available in Westenbroek and others (2023). Simulation results in the vicinity of the Wildwood Islands complex are shown in figures 14–17.
Table 3.
Example model simulations for various combinations of lake levels and river flows for the Sheboygan River area of concern.[NAVD 88, North American Vertical Datum of 1988; m, meter; m3/s, cubic meter per second; AEP, annual exceedance probability]
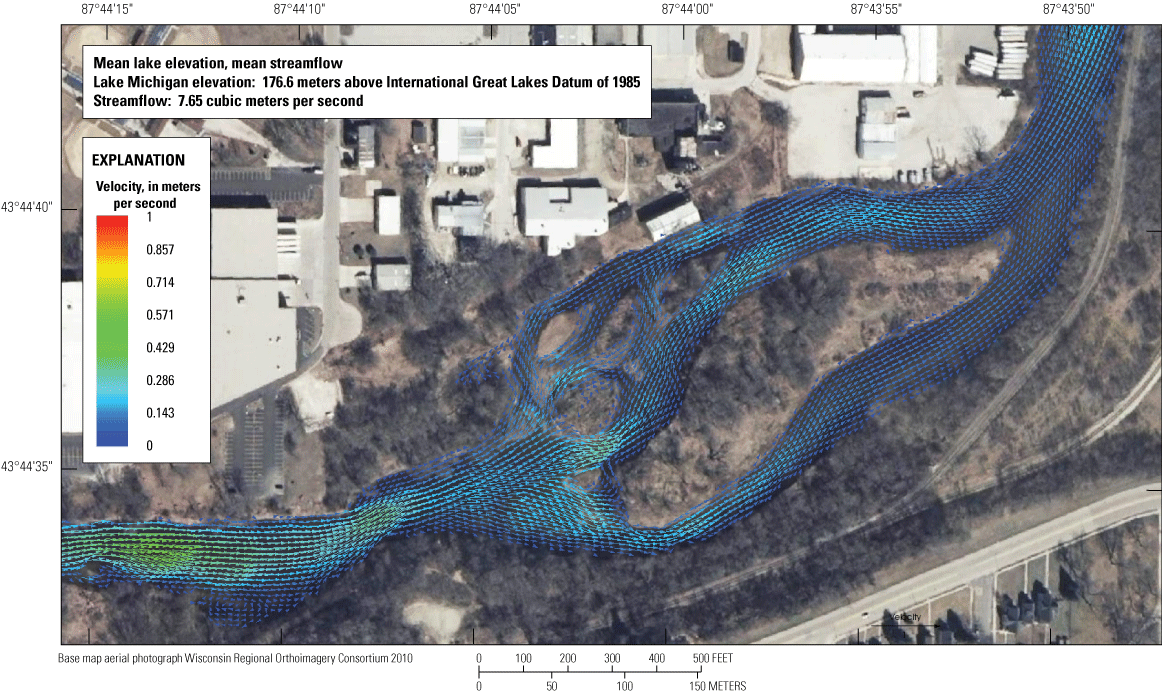
Velocity vectors near the Wildwood Islands complex for average water levels and average river flows.
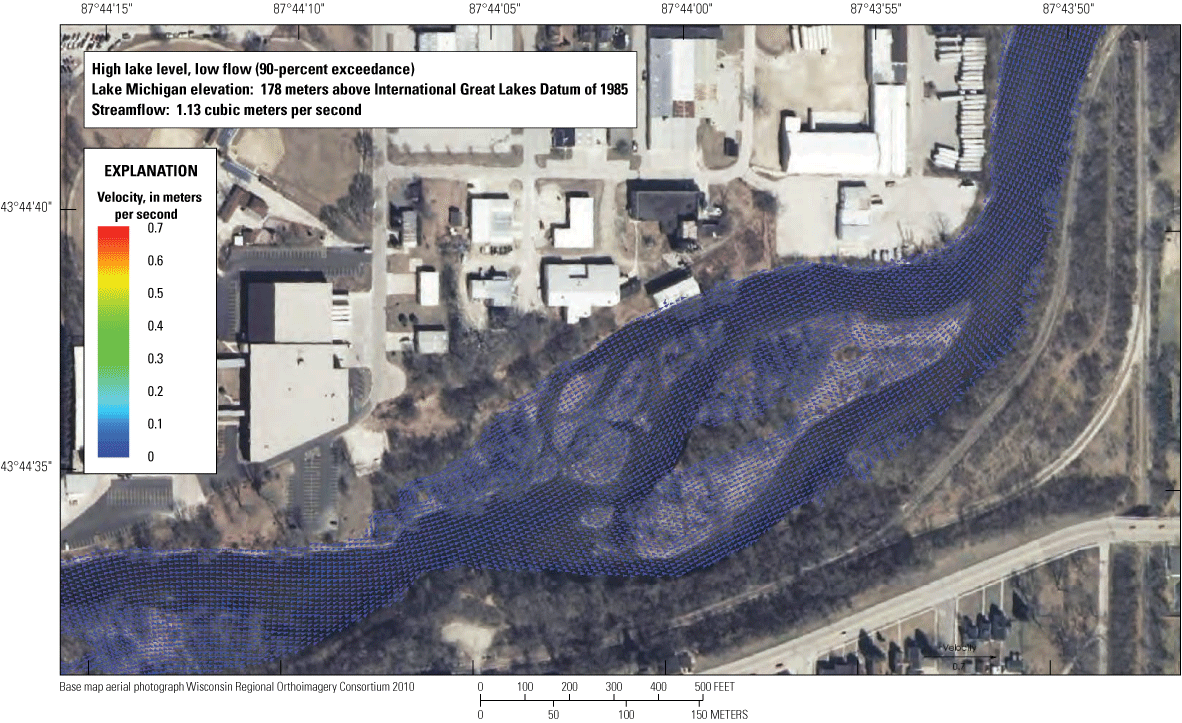
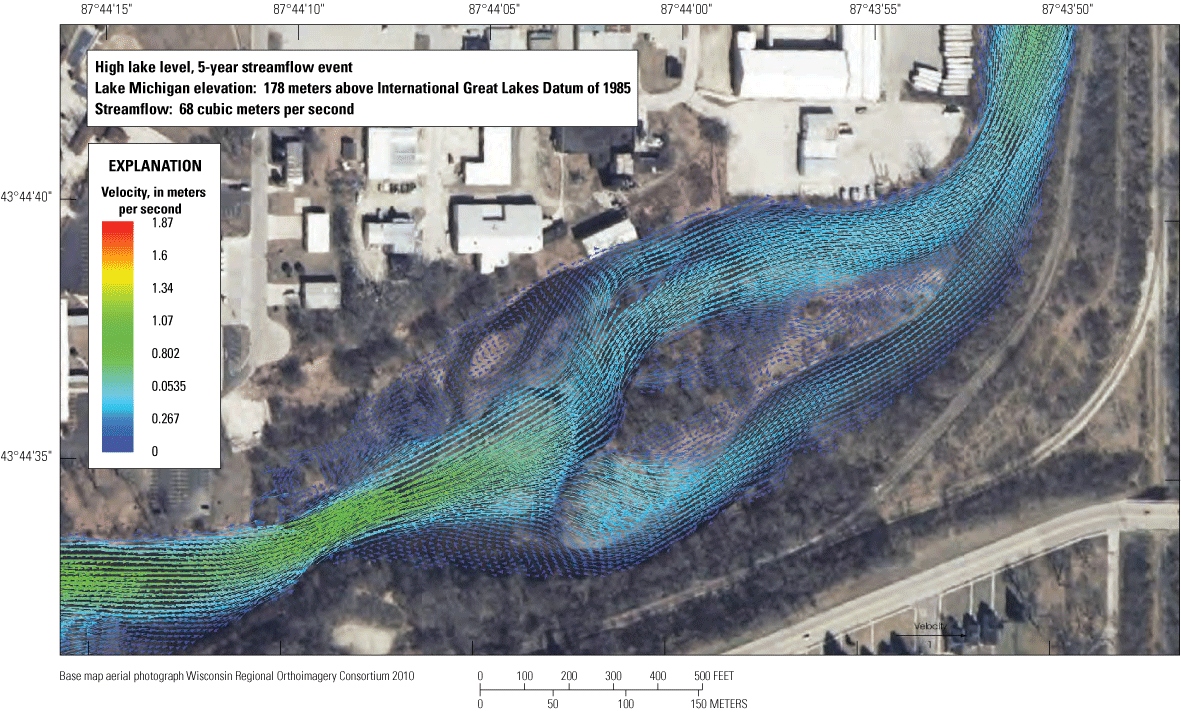
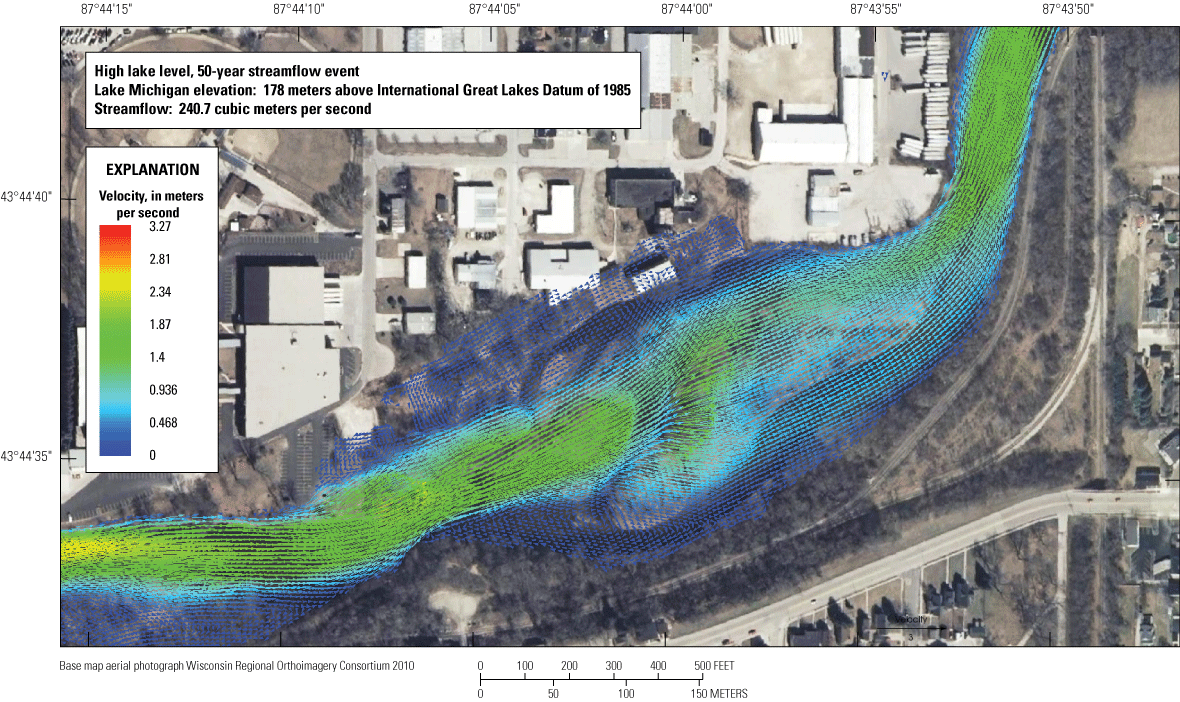
Velocity vectors near the Wildwood Islands complex for high Lake Michigan water levels varying Sheboygan River flows. A, Low flow. B, Medium flood. C, Large flood.
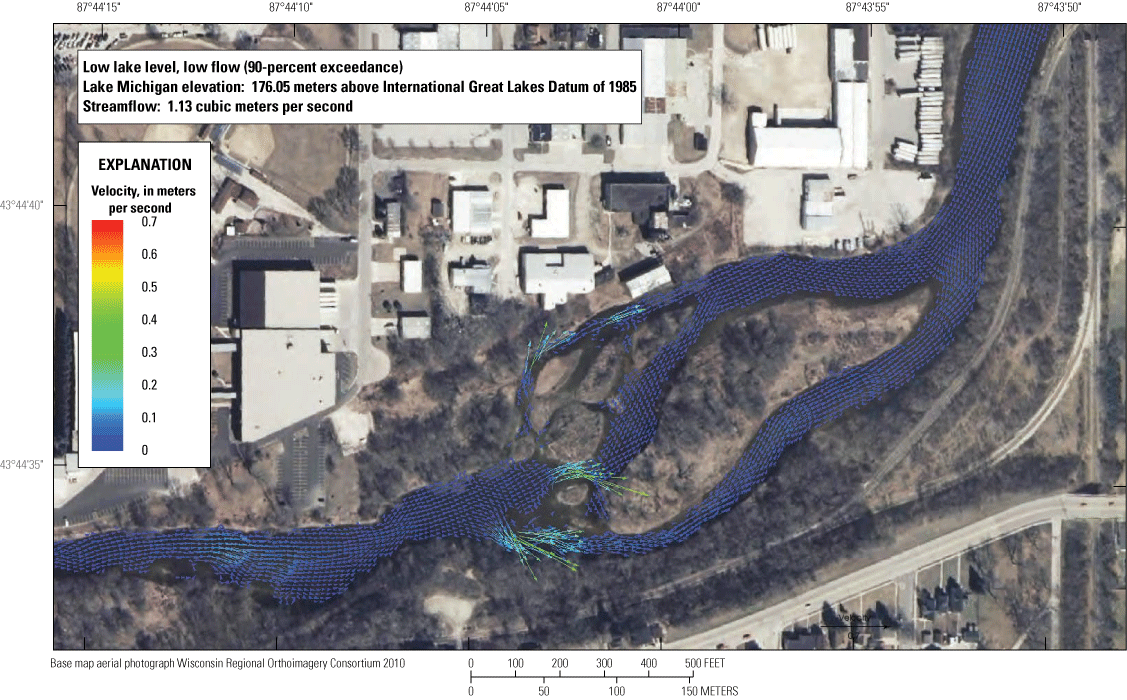
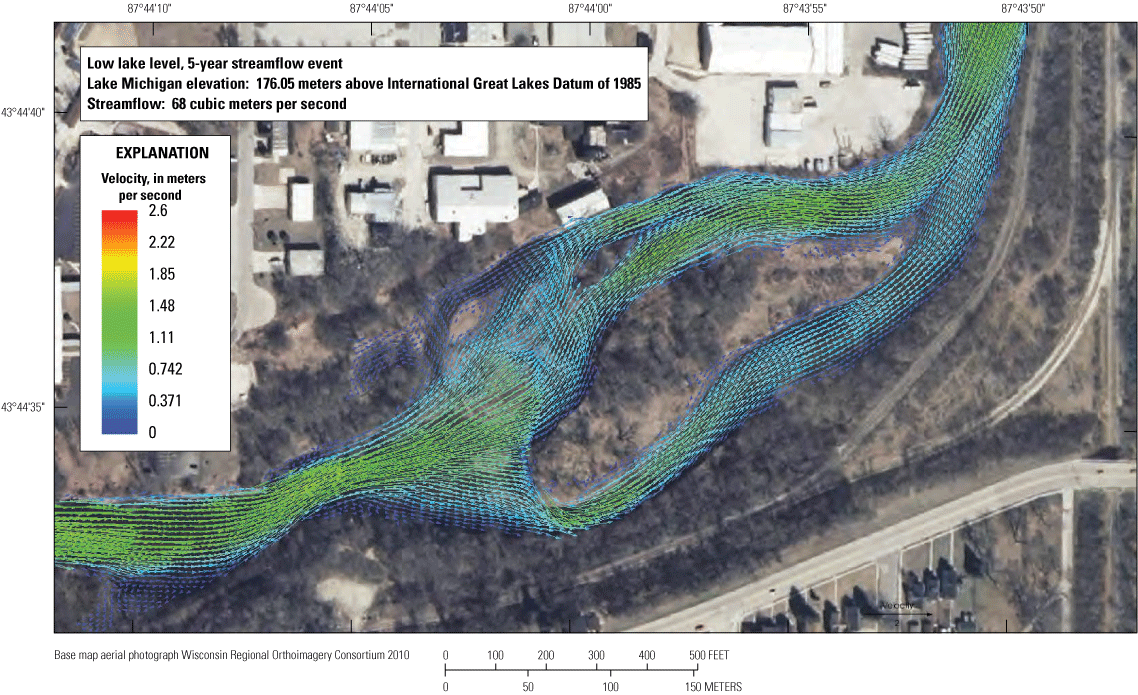
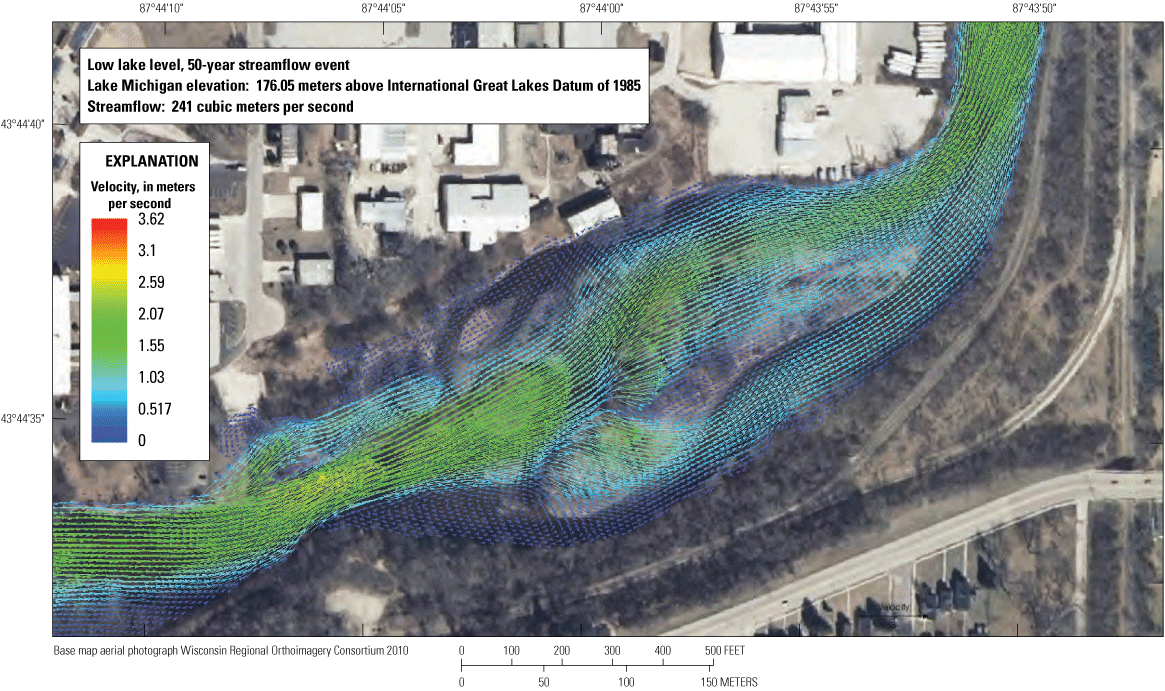
Velocity vectors near the Wildwood Islands complex for low Lake Michigan water levels varying Sheboygan River flows. A, Low flow. B, Medium flood. C, Large flood.
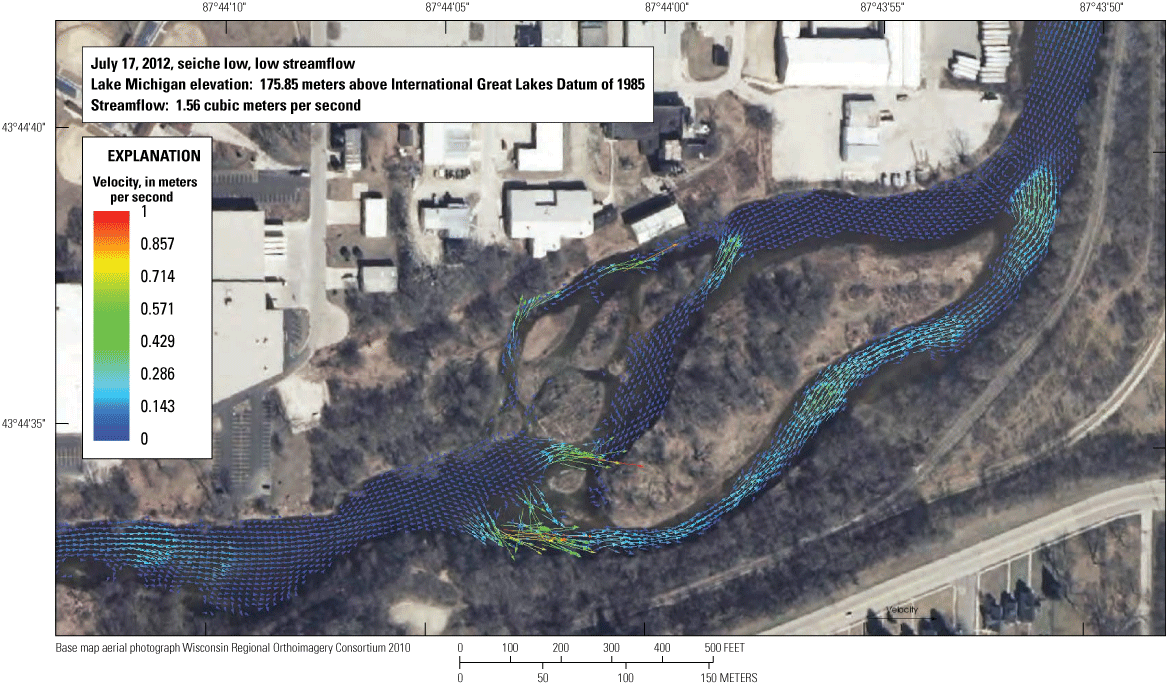
Velocity vectors near the Wildwood Islands complex for low Lake Michigan water levels varying Sheboygan River flows. A, Low seiche. B, High seiche.
Velocity reversals happened quickly in the vicinity of the Wildwood Islands complex and downstream, complicating efforts to compare modeled and measured velocity data. Low velocities in simulations 8 and 9 (fig. 17A and B) most closely matched velocities measured in October 2011 (fig. 13). Downstream from the complex in the Lake Michigan affected zone, the steady state model does not include the details of the seiche effects; thus, velocities and water levels are going to vary depending on the timing of the velocity measurement with the peak and trough of the seiche oscillation. Velocities are low in the lake-affected zone and approach 0 m/s when flow direction reverses.
Model sensitivity tests indicate that velocity and water levels are sensitive to small changes in bottom elevation in the vicinity of Wildwood Island. Changes in bottom elevation as small as 0.1 m, if focused on one of the main branches of flow around the island, result in noticeable simulated changes in flow patterns and the balance of flow between the two branches. The ice-jam prone nature of the river in the vicinity of the Wildwood Islands complex may cause locally high-water levels with unpredictable temporal variability in velocity patterns.
Average Lake Level and Average River Flow
A mean Lake Michigan elevation of 176.6 m above IGLD 85 and a Sheboygan River streamflow of 7.65 m3/s were used to simulate average river and lake interactions (table 3). Simulated velocities in the Sheboygan River through the Wildwood Islands complex ranged from 0 to about 0.5 m/s (fig. 14). Velocities generally were around 0.3 m/s at the upstream end of the riffles and bars, which were similar to velocities observed in ADCP measurements and longitudinal profiles. The surface of the smaller islands and bars were exposed, and three additional side channels had flows between the smaller islands.
High Lake Level and Varying River Flows
The record high Lake Michigan level of 178.0 m was used to illustrate a high level of Lake Michigan at the 0.01 AEP of 177.9 with the addition of a seiche of 0.1 m. The high water levels were simulated for a low flow of 1.13 m3/s (90-percent AEP for flow duration), a medium-sized flood of 68 m3/s (peak flood with an AEP of 20 percent, or a 1 out of 5 chance of happening in any given year), and a large flood of 241 m3/s (peak flood with an AEP of 2 percent, or a 1 out of 50 chance of happening in any given year) (fig. 15A–C). The river water levels and velocities in the vicinity of the Wildwood Islands complex is affected by backwater from the lake. The backwater zone for this lake level continues to upstream from the streamgage, which is almost to Interstate highway 43 and 7 km upstream from Lake Michigan (fig. 13).
For high water levels and low flows, all but the top center of the main Wildwood Island was submerged, including all the smaller islands and bars and the small floodplain area to the west of the small islands (fig. 15A). The riffle upstream from Wildwood Island was submerged. Velocities were near or less than 0.1 m/s throughout the entire reach, indicating lake-affected backwater extended up through the Wildwood Islands complex.
For high water levels with a medium flood (fig. 15B), the same areal footprint was submerged as with the low flow simulation (fig. 15A). However, there was a large difference in the velocity pattern and magnitude between the two simulations; instead of being close to 0, the upstream riffle had velocities of 0.8 m/s, and velocities in the two channels were about 0.3 m/s for the medium flood. Flows across the upstream side of the main island had velocities of about 0.3 m/s but were reduced to close to 0 m/s on the downstream side of the island. Velocities across the smaller islands and bars approached 1 m/s in direct line with upstream flow direction to near 0 m/s outside of the main flows toward the northwest side of the river. This simulation resulted in a divergence of flow patterns and quick changes in velocity across the flooded margins on both sides of the channel at the upstream end of the island. These flow divergence patterns likely are accentuated by the backwater condition. In addition, the high velocities centered on the northeast upstream side of the island match the location where the island has been actively eroding. Relatively low velocities in the vicinity of the 1938 side channel (fig. 10) indicate potential sedimentation. Low velocities, mid-island along the south channel, match areas silt deposition shown in the cores 13.5–2, 13.5–3, and 13.5–4 (fig. 11C).
For high water levels with a large flood (fig. 15C), the water levels in the vicinity of the Wildwood Islands complex were above the terrace height on the north side of the river, indicating a potential for flooding adjacent buildings, especially if the high water and large flood happened during late winter or spring during ice out. The entire island complex was completely submerged. Velocities at the upstream end and across the islands were near 2 m/s. Measured velocities of about 0.5 m/s on the southeast side of the main island and the south channel are similar to simulated velocities for the medium flood. The varying velocity distribution on the main island were supported by core data from areas of known historical silt deposition or known areas of island growth from the analyses of historical aerial photographs (fig. 11). As described for the medium flood, the high velocities on the upstream and northeast side of the main island overlay with the zone of bank erosion and loss of island area over time.
Low Lake Level and Varying River Flows
A water level of 176.05 m for the 2012 season at the Sheboygan River at New Jersey Ave was used to represent a low Lake Michigan water-level scenario. This level is about 0.1 m lower than the LWD and is representative of the low side of a summer seiche when Lake Michigan water levels were at the LWD. The low water levels were simulated with a low river flow of 1.13 m3/s (90-percent exceedance probability for flow duration), a medium-sized flood of 68 m3/s (peak flood with an AEP of 20 percent, or 1 out of 5 chances of happening in any given year), and a large flood of 241 m3/s (peak flood with an AEP of 2 percent, or 1 out of 50 chances of happening in any given year) (fig. 16A–C).
At the simulated low lake level of 176.05 m, the upstream extent of the backwater affected zone is in the vicinity of the Wildwood Islands Complex (fig. 13), and thus the water levels and velocity magnitudes and directions are expected to be highly variable depending on the timing of the seiche cycle and its strength. These variations were not possible to simulate with the steady-state model. The draining and flooding of the bar complex several times a day has similar habitat benefits for this small riverine marsh similar to that present in Great Lakes coastal wetlands, where certain collector/gatherer and detritivore crustaceans are present in high densities (Burton and others, 2002; Cooper and Uzarski, 2016). The water mixing can also distribute nutrients along the bars and low-lying margins of the island, like lakeshore wetlands (Trebitz, 2006).
Velocities for the low lake level of 176.05 m and low river flow of 1.13 m3/s were 0.1 m/s or less in the vicinity of the Wildwood Islands complex, except for the riffle areas at the upstream end of the main and smaller islands (fig. 16A). The northwesternmost side channel had velocities in the range of 0.3 m/s. Other side channels between the smaller islands were dry. This kind of condition would be conducive to velocities switching direction from positive to negative at the complex during the common 60–90-minute seiche cycles.
For the medium flood scenario of 68 m3/s, the main island was above the water surface except for narrow zones around the south and downstream sides (fig. 16B). Parts of two of the small islands remained above the water surface. Velocities upstream from, around, and downstream from the main island were in the range of 1 to 1.5 m/s. With the low lake level, the diverging flow patterns were not present, and velocities remained high along both side channels and along the island margins. The pattern of relatively high velocities along the island margins is likely because there is still an adequate water-surface slope before the river flows meets the backwater-affected area downstream from the island complex.
For a large flood of 241 m3/s, even with the low lake levels, all the island surfaces were inundated (fig. 16C). However, unlike during high lake levels, the northern shoreline along the terrace is above the water level. The upstream and northern side of the main island have noticeably erosive flows with velocities as much as 2 m/s. Deposition of fine-grained sediment might be expected on the southeastern side of the island with 0.3 m/s or less flows. During the large flood, divergence of flow lines is present on both sides of the channel at the upstream end of the complex where the channel widens.
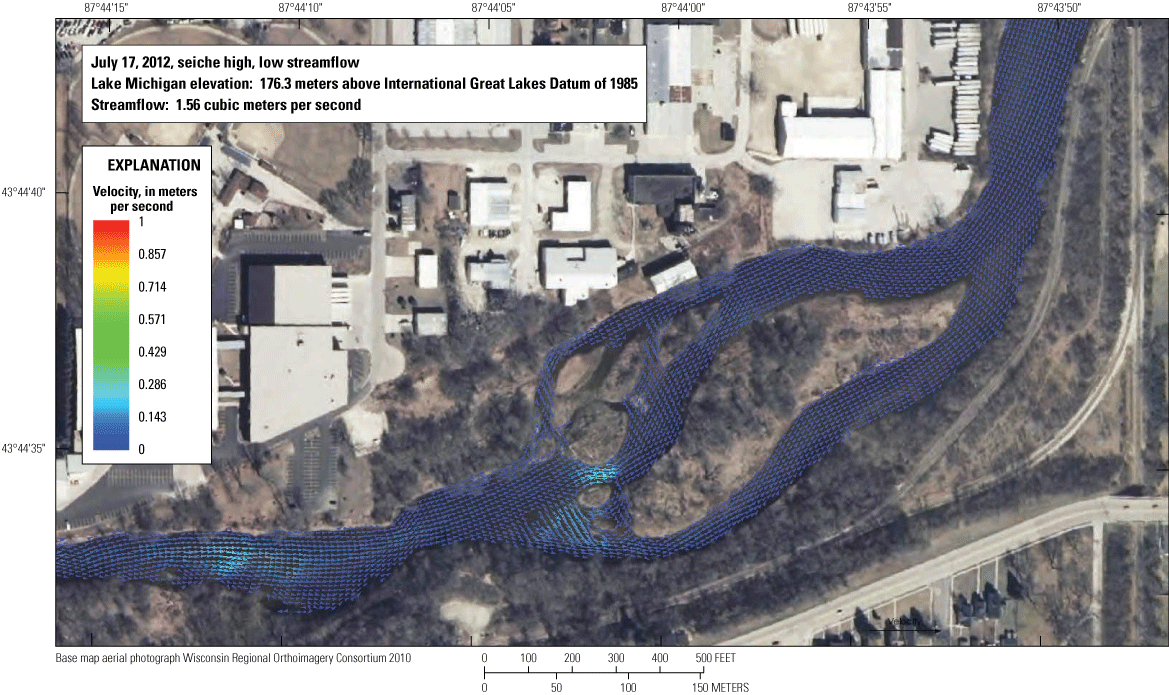
Low Lake Level and Low River Flow with Seiche Oscillation
Example velocity patterns for a seiche oscillation were simulated for July 17, 2012, during a low river flow of 1.54 m3/s and low lake level by running the simulation with a lake level of 175.85 m (trough of the seiche oscillation) and 176.3 m (peak of the seiche oscillation) (fig. 17A–B). Representative photographs of Wildwood Island for a similar event on June 30, 2012, are shown in figure 8C–D and Reneau (2012b). During low seiche (fig. 17A), velocities were strongest in the riffles at the head of the main island and were generally 0.3–0.4 m/s, with a few possibly anomalously high points reaching 1 m/s. Simulated velocities were 0.2–0.3 m/s in the south channel and close to 0 in the north channel, indicating that the north channel may be prone to more sedimentation than the south channel. Some flow was present in the northwestern side channel but not in the side channels between the small islands and bars. With a high seiche, the velocities were near 0 m/s throughout except for the riffles at the head of the main island with velocities of 0.1–0.2 m/s. The side channels between the small islands remained dry. These simple high and low seiche simulations represent the almost hourly fluctuations in water levels and velocities, and even though they miss the velocity reversals on the rise of an oscillation, they illustrate the dynamic nature of the diverse and beneficial habitat conditions within this complex.
Implications for Rivermouth Rehabilitation
The hydrogeomorphic history and characterization of the hydrodynamics of the lower Sheboygan River illustrate the highly diverse aquatic and riparian habitats in Great Lakes rivermouths because of the spatial and temporal complexity in water levels, velocities, and related patterns of erosion and sedimentation. The Sheboygan River demonstrates the importance of dynamic and diverse habitats defined by highly fluctuating water levels and flow reversals that can extend 7 km inland. For the Sheboygan River, 2.5 km of the river from Pennsylvania Avenue to the Wildwood Islands complex is always affected by flow reversals because it is within the Lake Michigan LWD and seiche-related water-level oscillations (fig. 13). The 1.2 m of elevation difference between the LWD and OHWM equates to a streamwise length of approximately 2.9 km that extends from the Wildwood Islands complex upstream. The streamwise length between the OHWM and the record lake level high extends for another 0.5 km almost to Interstate Highway 43 (fig. 13). The zone spanning the Wildwood Islands complex is also prone to winter and spring ice jams, which cause additional high-water levels that can fluctuate rapidly. Rehabilitation designs could include features that fit this dynamic zone of water-level fluctuations, flow reversals, and changing sedimentation patterns.
Analysis of trends in the Sheboygan River’s streamflow from 1916 to 2008 was similar to other agricultural streams in Wisconsin, with increases in mean annual flows and low flows but no increase in peak flows, presumably from increases in annual precipitation offset by agricultural conservation practices that reduced runoff (Gebert and others, 2016). During low lake levels and low seiche troughs there is likely more river flows that would benefit habitat in the Wildwood Islands complex.
The hydrodynamic model simulations provide snapshots of the range in variability in water levels and velocities and can be used to determine the resiliency of hydraulic, geomorphic, and habitat features for existing and possible future climate patterns. Understanding patterns in velocity magnitude and direction can help resource managers determine effects of past erosion and plan for future potential erosion and sedimentation patterns, such as where fine-grained silt and clays have a potential to accumulate or where bank erosion will be expected. The hydrodynamic model can be used to design rehabilitation plans and simulate potential future changes in the frequency and magnitude of Lake Michigan water levels, the intensity and frequency of seiches, and the timing and intensity of floods. If rehabilitation is planned in the future, AEPs for river flows and lake levels should be calculated based on the most recent data available.
Invasive vegetation on the Wildwood Islands complex was most pronounced on areas that had accumulations of silty deposits during the last 50 or so years. Areas with recent silty deposits were associated island surfaces with somewhat slow velocities and diverging flows during floods when the river would be carrying sediment in suspension. Resource managers could improve success rates of native vegetation rehabilitation efforts by examining the effect of very subtle differences in land surface altitudes on expected frequency of inundation. Changing the land surface by only 0.1 or 0.2 m could result in a different hydrologic regime that could benefit some species of native vegetation over others.
Rehabilitation projects generally require an archeological survey, which could benefit by knowing how much erosion and sedimentation has happened on adjacent lands and islands in the vicinity of a rivermouth. For example, some land surfaces on an island may be covered with more than 1 m of recently deposited sediment next to a surface with no recent deposition at the same elevation.
Summary and Conclusions
In 2011–13, the U.S. Geological Survey studied the hydrogeomorphic history and hydrodynamic simulations of 7 kilometers of the Sheboygan River mouth at Lake Michigan in eastern Wisconsin. These data and results were assembled and collected to assist the Wisconsin Department of Natural Resources in the design and baseline assessment of rehabilitation projects related to cleanup of the area of concern in the Sheboygan River mouth. The integration of sedimentology; relative elevation difference of the island surfaces; radiocarbon age determinations; and historical changes in channel planform with time, floods, and ultimately water levels in Lake Michigan helped to explain the diverse and dynamic geomorphic history and habitat potential of the Wildwood Islands complex.
A variety of historical and new data were collected and compiled to be able to integrate river flows with Lake Michigan levels. The paleo history of landform development was needed to tie flows and water levels to different land surfaces and to evaluate how those land surfaces changed with time.
Analyses of historical aerial photographs from 1938 to 2010 indicated that the Wildwood Islands complex had experienced mainly erosion. After a cutoff of an upstream side channel, what was mainly one island in 1938 was eroded on the upstream side into about 10 smaller islands and bars by 2010. The surface area of the main island decreased from 2.4 to 1.6 hectares. The core of the island complex is gravel, likely related to deltaic deposits from an ancient Sheboygan River during a higher stand of Lake Michigan during the Holocene. A narrow central section of the main island is above the modern Lake Michigan ordinary high-water mark and most of the island and bar surfaces are above the low water datum.
Velocity and sedimentation patterns in the Sheboygan River mouth are potentially affected by Lake Michigan water levels and seiche oscillations over a river length of 7 kilometers. The upstream end of lake effect is at the elevation of the historical lake high-water level near Interstate Highway 43. In the fall of 2011, during somewhat low Lake Michigan levels, velocity reversals with magnitudes of as much as 0.3 meter per second were measured in lower 4.5 kilometers of the river. During the summer of 2012, when Lake Michigan water levels were below the low water datum, seiche-related oscillations of about 0.2 meter extended just upstream from the Wildwood Islands complex, with greater variability in amplitude and frequency in the spring and fall months than in the summer. A trough of a large seiche was sometimes 0.6 meter lower than the Lake Michigan low water datum. Runoff produced river water levels during spring melt or storms that were 0.6 meter above Lake Michigan water levels.
From 1916 to 2008, Sheboygan River average annual streamflow and low flows increased, whereas peak floods did not change, which was similar to other streams in southern Wisconsin during a similar period. These trends are also helpful for rehabilitation designs that consider the range of variability in lake levels.
Hydrodynamic data collected for this study included georeferenced bathymetry, velocity, bank, substrate measurements, and continuous water-level measurements. A two-dimensional hydrodynamic model was used for simulating the interaction of riverine flows with varying lake levels and seiche effects. The model was used to determine the resiliency of hydraulic, geomorphic, and habitat conditions for existing and possible future habitat conditions. The two-dimensional model can be used to simulate potential future effects on velocity and sedimentation patterns for the rivermouth caused by decreases and increases in Lake Michigan water levels, changes in the intensity and frequency of seiches, and the timing and intensity of flood events in the Sheboygan River.
Simulations of a range of combinations of Lake Michigan water levels with river flows indicated that a variety of velocity patterns and water levels are possible near the Wildwood Islands complex where rehabilitation plans related to areas of concern were concentrated. Simulated velocities ranged from 0 meter per second during high lake levels and small river flows to 2 meters per second during high lake levels and floods with an annual exceedance probability of 0.01. In general, the downstream side of the main island had slower velocities than the upstream side, enhancing deposition during overbank flows. Time-lapse photography confirmed the common negative velocities and flow reversals near the Wildwood Islands complex from the rise of water levels between a trough and peak of a seiche oscillation. Additionally, the hydrodynamic simulations were helpful for visualizing how changes in the river planform affected historical sedimentation records.
Results from the Sheboygan River’s hydrogeomorphic history, combined with the hydrodynamic simulations, can be applied to planned rehabilitation efforts for other tributaries to Lake Michigan. Relations between water levels; velocities; surface elevations of islands and bars; sediment and sedimentation characteristics; wetland communities; and fish, reptile, and waterfowl use could be particularly important for planning rehabilitation efforts.
References Cited
American Society for Testing and Materials, 2008, Standard test methods for loss on ignition (LOI) of solid combustion residues, Designation D 7348-08, accessed September 2024 at https://cdn.standards.iteh.ai/samples/64765/542f3bc299c54f36a1e5e20791de1c67/ASTM-D7348-08.pdf.
Baedke, S.J., and Thompson, T.A., 2000, A 4,700-year record of lake level and isostasy for Lake Michigan: Journal of Great Lakes Research, v. 26, no. 4, p. 416–426. [Also available at https://doi.org/10.1016/S0380-1330(00)70705-2.]
Burton, T.M., Stricker, C.A., and Uzarski, D.G., 2002, Effects of plant community composition and exposure to wave action on invertebrate habitat use of Lake Huron coastal wetlands: Lakes and Reservoirs Research and Management, v. 7, no. 3, p. 255–269. [Also available at https://doi.org/10.1046/j.1440-1770.2002.00202.x.]
Carlson, A.E., Principato, S.M., Chapel, D.M., and Mickelson, D.M., 2011, Quaternary geology of Sheboygan County, Wisconsin: Wisconsin Geological and Natural History Survey Bulletin 106, 32 p. [Also available at https://wgnhs.wisc.edu/catalog/publication/000129/resource/b106.]
Fitzpatrick, F.A., Garrison, P.J., Fitzgerald, S.A., and Elder, J.F., 2003, Nutrient, trace-element, and ecological history of Musky Bay, Lac Courte Oreilles, Wisconsin, as inferred from sediment cores: U.S. Geological Survey Water-Resources Investigations Report 02–4225, 141 p. [Also available at https://doi.org/10.3133/wri024225.]
Fitzpatrick, F.A., and Peppler, M.C., 2003, Sedimentation and sediment chemistry, Neopit Mill Pond, Menominee Indian Reservation, Wisconsin, 2001: U.S. Geological Survey Open-File Report 03–23, 58 p. [Also available at https://doi.org/10.3133/ofr0323.]
Fitzpatrick, F.A., 2005, Trends in streamflow, sedimentation, and sediment chemistry for the Wolf River, Menominee Indian Reservation, Wisconsin, 1850–1999: U.S. Geological Survey Scientific Investigations Report 2005–5030, 47 p. [Also available at https://doi.org/10.3133/sir20055030.]
Fitzpatrick, F.A., Knox, J.C., and Schubauer-Berigan, J.P., 2007, Sedimentation history of Halfway Creek Marsh, Upper Mississippi River National Wildlife and Fish Refuge, Wisconsin, 1846–2006: U.S. Geological Survey Scientific Investigations Report 2007–5209, 40 p. [Also available at https://doi.org/10.3133/sir20075209.]
Fitzpatrick, F.A., Blount, J.D., Reneau, P.C., Westenbroek, S.M., and Roland, C.J., 2025, Core descriptions, survey transects, bathymetry, and velocity data for the Sheboygan River mouth and Wildwood Islands complex, 2011–12: U.S. Geological Survey data release, accessed January 2025 at https://doi.org/10.5066/P9GPMR1J.
Flynn, K.M., Kirby, W.H., and Hummel, P.R., 2006, User's manual for program PeakFQ, annual flood frequency analysis using Bulletin 17B guidelines: U.S. Geological Survey Techniques and Methods, book 4, chap. B4, 42 p. [Also available at https://doi.org/10.3133/tm4B4.]
Foreman, A.T., 2014, Climate change influence on historical flood variability in Ozark Highland rivers: Master’s Thesis, Missouri State University, Geospatial Science with Physical Geography, 100 p. [Also available at https://bearworks.missouristate.edu/theses/2172/.]
Gebert, W.A., Garn, H.S., and Rose, W.J., 2016, Changes in streamflow characteristics in Wisconsin as related to precipitation and land use (version 1.1, January 2016): U.S. Geological Survey Scientific Investigations Report 2015–5140, 25 p. [Also available at https://doi.org/10.3133/sir20155140.]
Government of Canada and Government of the United States of America, 2015, Great Lakes Water Quality Agreement—Protocol amending the agreement between Canada and the United States of America on the Great Lakes water quality, 1978, as amended on October 16, 1983, and on November 18, 1987; signed September 7, 2012, and entered into force February 12, 2013: 54 p. [Also available at https://binational.net/agreement/full-text-the-2012-great-lakes-water-quality-agreement/.]
Gronewold, A.D., Clites, A.H., Smith, J.P., and Hunter, T.S., 2013, A dynamic graphical interface for visualizing projected, measured, and reconstructed surface water elevations on the earth’s largest lakes: Environmental Modelling & Software, v. 49, p. 34–39, accessed September 2024 at https://doi.org/10.1016/j.envsoft.2013.07.003.
International River Interface Cooperative, 2016, iRIC version 2.3: International River Interface Cooperative software, accessed November 18, 2016, at https://i-ric.org/en/.
Interagency Advisory Committee on Water Data, 1982, Guidelines for determining flood-flow frequency: Reston, Va., Bulletin 17B of the Hydrology Subcommittee, Office of Water Data Coordination, U.S. Geological Survey, 183 p. [Also available at https://water.usgs.gov/osw/bulletin17b/dl_flow.pdf.]
Juckem, P.F., Hunt, R.J., Anderson, M.P., and Robertson, D.M., 2008, Effects of climate and land management change on streamflow in the driftless area of Wisconsin: Journal of Hydrology, v. 355, no. 1–4, p. 123–130. [Also available at https://doi.org/10.1016/j.jhydrol.2008.03.010.]
Kiesel, D.S., and Mickelson, D.M., 2005, Influence of Lake Michigan Holocene lake levels on fluvial sediments of the lower Pigeon River, Wisconsin: Journal of Great Lakes Research, v. 31, no. 3, p. 343–359. [Also available at https://doi.org/10.1016/S0380-1330(05)70265-3.]
National Oceanic and Atmospheric Administration, U.S. Fish and Wildlife Service, and Wisconsin Department of Natural Resources, 2012, Preassessment screen for the Sheboygan River and Harbor, 30 pl, accessed September 24, 2024, at https://www.cerc.usgs.gov/orda_docs/DocHandler.ashx?task=get&ID=1228.
National Oceanic and Atmospheric Administration, 2014, OPUS: Online Positioning User Service: National Geodetic Survey website, accessed September 2024 at https://www.ngs.noaa.gov/OPUS/.
National Oceanic and Atmospheric Administration, 2016a, What is a seiche?: Center for Operational Oceanographic Products and Services website, accessed January 26, 2017, at https://oceanservice.noaa.gov/facts/seiche.html.
National Oceanic and Atmospheric Administration, 2016b, Great Lakes water level dashboard: Great Lakes Environmental Research Laboratory website, accessed September 23, 2024, at https://www.glerl.noaa.gov/data/dashboard/GLWLD.html.
National Oceanic and Atmospheric Administration, 2018, National Geodetic Survey geodetic tool kit: National Oceanic and Atmospheric Administration, accessed September 23, 2024, at https://geodesy.noaa.gov/TOOLS/.
National Oceanic and Atmospheric Administration, 2024, Tides and currents: Center for Operational Oceanographic Products and Services, accessed July 2024 at https://tidesandcurrents.noaa.gov/.
Nelson, J.M., Shimizu, Y., Abe, T., Asahi, K., Gamou, M., Inoue, T., Iwasaki, T., Kakinuma, T., Kawamura, S., Kimura, I., Kyuka, T., McDonald, R.R., Nabi, M., Nakatsugawa, M., Simões, F.R., Takebayashi, H., and Watanabe, Y., 2016, The international river interface cooperative: Public domain flow and morphodynamics software for education and applications: Advances in Water Resources, v. 93, part A, p. 62–74, accessed December 2024 at https://doi.org/10.1016/j.advwatres.2015.09.017.
Nelson Institute for Environmental Studies, 2011, Wisconsin’s changing climate—Impacts and adaptation: Madison, Wis., Wisconsin Initiative on Climate Change Impacts, University of Wisconsin-Madison and the Wisconsin Department of Natural Resources, accessed September 2024 at https://nelson.wisc.edu/wp-content/uploads/Wisconsins_Changing_Climate_Impacts_and_Adaptation.pdf.
Reimer, P.J., Baillie, M.G.L., Bard, E., Bayliss, A., Beck, J.W., Blackwell, P.G., Bronk Ramsey, C., Buck, C.E., Burr, G.S., Edwards, R.L., Friedrich, M., Grootes, P.M., Guilderson, T.P., Hajdas, I., Heaton, T.J., Hogg, A.G., Hughen, K.A., Kaiser, K.F., Kromer, B., McCormac, F.G., Manning, S.W., Reimer, R.W., Richards, D.A., Southon, J.R., Talamo, S., Turney, C.S.M., van der Plicht, J., and Weyhenmeyer, C.E., 2009, IntCal09 and Marine09 radiocarbon age calibration curves, 0-50,000 years CAL BP: Radiocarbon, v. 51, no. 4, p. 1111–1150
Reneau, P.C., 2012a, Water-level fluctuations at Sheboygan River mouth, Sheboygan, WI: U.S. Geological Survey video, 00:01:37, accessed September 2024 at https://www.usgs.gov/media/videos/water-level-fluctuations-sheboygan-river-mouth-sheboygan-wi.
Reneau, P.C., 2012b, Water-level fluctuations at Sheboygan River mouth, Sheboygan, WI: U.S. Geological Survey video, 00:01:51, accessed September 2024 at https://www.usgs.gov/media/videos/water-level-fluctuations-sheboygan-river-mouth-sheboygan-wi-0.
Reneau, P.C., 2013, Water-level fluctuations at Sheboygan River mouth, Sheboygan, WI: U.S. Geological Survey video, 00:02:01, accessed September 2024 at https://www.usgs.gov/media/videos/water-level-fluctuations-sheboygan-river-mouth-sheboygan-wi-1.
Rydlund, P.H., Jr., and Densmore, B.K., 2012, Methods of practice and guidelines for using survey-grade Global Navigation Satellite Systems (GNSS) to establish vertical datum in the United States Geological Survey: U.S. Geological Survey Techniques and Methods, book 11, chap. D1, 102 p. with appendixes. [Also available at https://doi.org/10.3133/tm11D1.]
Scott, M., 2012, Few states spared from drought in U.S.: National Oceanic and Atmospheric Administration web page, accessed September 2024 at https://www.climate.gov/news-features/featured-images/few-states-spared-drought-us.
Sheboygan County, 2004, LiDAR-derived countywide DEM for Sheboygan County, WI 2004: accessed September 2024 at https://geodata.wisc.edu/catalog/5cdee874-6792-4a28-921e-d75ae1a55347.
Thompson, T.A., and Baedke, S.J., 1999, Strandplain evidence for reconstructing late Holocene lake level in the Lake Michigan basin, in Sellinger, C.E., and Quinn, F.H., eds., Proceedings for the Great Lakes Paleo-levels workshop—The last 4,000 years: National Oceanic and Atmospheric Administration Technical Memorandum ERL GLERL-113, p. 30–34.
Trebitz, A.S., 2006, Characterizing seiche and tide-driven daily water-level fluctuations affecting coastal ecosystems of the Great Lakes: Journal of Great Lakes Research, v. 32, no. 1, p. 102–116. [Also available at https://doi.org/10.3394/0380-1330(2006)32[102:CSATDW]2.0.CO;2.]
U.S. Army Corps of Engineers, 1988, Phase I revised report on Great Lakes open coast flood levels: U.S. Army Corps of Engineers, 26 p. [Also available at https://www.michigan.gov/-/media/Project/Websites/egle/Documents/Programs/WRD/NFIP/great-lakes-flood-levels-part1.pdf?rev=1bcf77e8ca734b7d951424dc9ef4 697f.]
U.S. Department of Agriculture, 2022, National Agriculture Imagery Program GeoHub: accessed September 2024 at https://naip-usdaonline.hub.arcgis.com/.
U.S. Geological Survey, 2024, USGS water data for the Nation: U.S. Geological Survey National Water Information System database, accessed September 2024 at https://doi.org/10.5066/F7P55KJN.
U.S. Environmental Protection Agency, 2013, EPA announces “cleanup complete” at Sheboygan River area of concern: U.S. Environmental Protection Agency news release, accessed September 2024 at https://yosemite.epa.gov/opa/admpress.nsf/a5792a626c8dac098525735900400c2d/5f4a7804d70b628b85257b8a0060b1f2!OpenDocument.
Veilleux, A.G., Cohn, T.A., Flynn, K.M., Mason, R.R., Jr., and Hummel, P.R., 2014, Estimating magnitude and frequency of floods using the PeakFQ 7.0 program: U.S. Geological Survey Fact Sheet 2013–3108, 2 p., accessed September 2024 at https://doi.org/10.3133/fs20133108.
Wessa, P., 2012, Kendall tau rank correlation (v. 1.0.11), in Free Statistics Software (v. 1.1.23-r7): Office for Research Development and Education, accessed September 2024 at http://www.wessa.net/rwasp_kendall.wasp/.
Westenbroek, S., Reneau, P.C., and Fitzpatrick, F.A., 2023, FaSTMECH model water surface elevation and velocities for the Lower Sheboygan River, Wisconsin: U.S. Geological Survey data release, accessed September 2024 at https://doi.org/10.5066/P9K44ALR.
Wilcox, D.A., Thompson, T.A., Booth, R.K., and Nicholas, J.R., 2007, Lake-level variability and water availability in the Great Lakes: U.S. Geological Survey Circular 1311, 25 p. [Also available at https://doi.org/10.3133/cir1311.]
Wolman, M.G., and Miller, J.P., 1960, Magnitude and frequency of forces in geomorphic processes: The Journal of Geology, v. 68, no. 1, p. 54–74. [Also available at https://doi.org/10.1086/626637.]
Conversion Factors
International System of Units to U.S. customary units
Temperature in degrees Celsius (°C) may be converted to degrees Fahrenheit (°F) as follows:
°F= (1.8×°C) +32
Datum
Vertical coordinate information is referenced to the North American Vertical Datum of 1988 (NAVD 88) and the International Great Lakes Datum of 1985 (IGLD 85).
Horizontal coordinate information is referenced to the North American Datum of 1983 (NAD 83).
Elevation, as used in this report, refers to the vertical distance of the land or a water surface above global sea level.
Abbreviations
±
plus or minus
2D
two dimensional
ADCP
acoustic Doppler current profiler
AEP
annual exceedance probability
AOC
area of concern
BP
before present
DEM
digital elevation model
EPA
U.S. Environmental Protection Agency
GPS
global positioning system
IGLD 85
International Great Lakes Datum of 1985
iRIC
International River Interface Cooperative
LEV
lateral eddy viscosity
lidar
light detection and ranging
LWD
low water datum
NAVD 88
North American Vertical Datum of 1988
NGVD 29
National Geodetic Vertical Datum of 1929
OHWM
ordinary high-water mark
RTK–GPS
real-time kinematic–global positioning system
USGS
U.S. Geological Survey
For more information about this publication, contact:
Director, USGS Upper Midwest Water Science Center
8505 Research Way
Middleton, WI 53562
608–828–9901
For additional information, visit: https://www.usgs.gov/centers/umidwater
Publishing support provided by the
Rolla Publishing Service Center
Disclaimers
Any use of trade, firm, or product names is for descriptive purposes only and does not imply endorsement by the U.S. Government.
Although this information product, for the most part, is in the public domain, it also may contain copyrighted materials as noted in the text. Permission to reproduce copyrighted items must be secured from the copyright owner.
Suggested Citation
Fitzpatrick, F.A., Westenbroek, S.M., Reneau, P.C., and Blount, J.D., 2025, Hydrogeomorphic history, hydrodynamic conditions, and simulations of water levels and velocities from varying lake levels and streamflow for the Sheboygan Rivermouth and area of concern, Wisconsin: U.S. Geological Survey Scientific Investigations Report 2024–5125, 48 p., https://doi.org/10.3133/sir20245125.
ISSN: 2328-0328 (online)
Study Area
| Publication type | Report |
|---|---|
| Publication Subtype | USGS Numbered Series |
| Title | Hydrogeomorphic history, hydrodynamic conditions, and simulations of water levels and velocities from varying lake levels and streamflow for the Sheboygan Rivermouth and area of concern, Wisconsin |
| Series title | Scientific Investigations Report |
| Series number | 2024-5125 |
| DOI | 10.3133/sir20245125 |
| Publication Date | February 05, 2025 |
| Year Published | 2025 |
| Language | English |
| Publisher | U.S. Geological Survey |
| Publisher location | Reston, VA |
| Contributing office(s) | Upper Midwest Water Science Center |
| Description | Report: viii, 48 p.; Dataset; 2 Data Releases |
| Country | United States |
| State | Wisconsin |
| Other Geospatial | Sheboygan Rivermouth |
| Online Only (Y/N) | Y |
| Additional Online Files (Y/N) | N |