

Sediment Nutrient Dynamics in Selected Milwaukee Metropolitan Area Streams, Wisconsin, 2022
Links
- Document: Report (24 MB pdf) , HTML , XML
- Dataset: USGS National Water Information System database - USGS water data for the Nation
- Data Release: USGS data release - Milwaukee Metropolitan Sewerage District nutrient connections project—In-stream nutrient cycling, 2022 data
- Download citation as: RIS | Dublin Core
Abstract
The U.S. Geological Survey and Milwaukee Metropolitan Sewerage District in Wisconsin have an ongoing partnership to monitor water quality in streams in the Milwaukee metropolitan area and to assess the effects of stream restoration on habitat and water quality. Because sediment nutrient dynamics can improve or further impair water quality, we measured sediment nitrogen and phosphorus concentrations, potential nitrogen removal, and potential phosphorus retention at 32 streams sites in the Milwaukee metropolitan area in summer 2022. Four of the sites were in rehabilitated stream reaches. Based on the results from this project, we provided a rating of good, fair, or poor for the sediment nutrient dynamics at each site.
Sediment nitrogen removal and phosphorus retention in stream reaches increased as the proportion of fine particles increased. Bioavailable nitrogen and phosphorus concentrations increased in stream reaches as particle size decreased, especially at locations with more silt and clay. Particle size typically decreased from upstream to downstream, and several of the sites with finer particles were in downstream parts of the study area, especially in the Milwaukee Estuary sites. The sites that had more fine sediment and higher bioavailable nutrients also had elevated rates of nitrification and denitrification enzyme activity, which is a measurement of the potential nitrogen removal when nitrogen and carbon do not limit the denitrifying bacteria. Additionally, sites with fine sediment typically had the highest potential to retain phosphorus as fine sediment provides many binding sites for phosphorus. The binding sites can become saturated with phosphorus, however, increasing the potential for the phosphorus to be released to stream water. Five of the 32 sampled sites were potentially saturated with phosphorus. Sites that contained more agricultural land in their drainage areas were at higher risk of having sediment that was saturated or near-saturation; however, the sites that had more agricultural land in their drainage areas also had higher nitrification rates. Results from this study indicate that stream rehabilitation projects that promote sediment deposition and accumulation of organic matter in the stream channel can increase nitrogen removal and phosphorus retention.
Introduction
The water quality of streams and rivers draining mainly agricultural and urban areas is commonly impaired because of increased inputs of nitrogen (N), phosphorus (P), and sediment from the landscape. Suspended sediment reduces light penetration into the water column, changes water temperature, fills in channels and reservoirs, clogs feeding structures of filter-feeding invertebrates, and stresses fish (Bilotta and Brazier, 2008). Elevated nutrient concentrations stimulate the production of phytoplankton (Wurtsbaugh and others, 2019), which can further increase turbidity, increase light attenuation, and cause large shifts in diurnal oxygen patterns (Hilton and others, 2006). When excess nutrients are available, phytoplankton can grow out of control and form harmful algal blooms. Some phytoplankton (for example, cyanobacteria) produce toxins that are detrimental to aquatic biota and can harm humans if they are in recreational waters or the drinking water supply (Carey and others, 2013; Miller and others, 2017). When the algae die, they become part of the organic material on the floor of the stream, estuary, or lake, and decomposition of this material can lead to low oxygen concentrations in the water column (Tellier and others, 2022). If low oxygen concentrations persist, hypoxic zones form, which kill or drive away aquatic organisms in the hypoxic area, affect drinking water taste and odor, and ultimately degrade the ecosystem (Diaz and Rosenberg, 2008; Tellier and others, 2022).
Nutrient cycling is an important ecosystem process in rivers that can reduce nutrient concentrations. Rivers temporarily remove nutrients from the water column through sediment burial and biotic uptake (Birgand and others, 2007; Withers and Jarvie, 2008). Rivers permanently remove N through microbially mediated denitrification, which is the microbial conversion of nitrate (NO3) to nitrogen gas (Mulholland and others, 2008; Kreiling and others, 2019a), and through coupled nitrification-denitrification where nitrification, which is the microbial conversion of ammonium (NH4) to NO3, supplies the NO3 for denitrification (Richardson and others, 2004; Kreiling and others, 2021; Kreiling and others, 2024). Macrophytes, phytoplankton, and heterotrophs assimilate nutrients throughout the growing season, temporarily removing nutrients from the sediment and water column and then rereleasing them during decomposition (Reddy and others, 1999; Birgand and others, 2007). Drainage basin geology has a strong effect on the mineralogy and geochemistry of the streambed sediment, which in turn affects the P retention capacity of the sediment (Withers and Jarvie, 2008). Dissolved P in the water column can adsorb to cations present in the sediment and be biologically unavailable for days to years depending on sediment pH and reduction–oxidation conditions (Reddy and others, 1999; Withers and Jarvie, 2008). The number of cation-binding sites is determined by the sediment composition, with more sites typically available in clay-sized particles (Evans and others, 2004; Withers and Jarvie, 2008). Sediment burial of P can be a permanent P removal mechanism if P is bound to a calcium (Ca) salt or if P is in a refractory organic form (Records and others, 2016).
Chronic loading of nutrients in rivers can overwhelm these sediment nutrient processes (Wollheim and others, 2018). Denitrifying bacteria can become saturated with NO3, causing the N removal efficiency in the stream to decline (Mulholland and others, 2008). All the cation-binding sites on sediment particles can be filled with P, reducing the capacity to bind additional P (Kreiling and others, 2019b). Eventually the sediment can begin releasing P to the water column instead of storing it (Hamilton, 2012). One index used to measure the capacity of the stream sediment to adsorb or release P is the equilibrium P concentration (EPC0; Froelich, 1988). The EPC0 is the concentration of soluble reactive P (SRP) in the water column when there is no net uptake or release of P from the sediment (Froelich, 1988; Simpson and others, 2021). When the EPC0 is greater than the ambient SRP concentration, the sediment is a potential P source (Simpson and others, 2021). The EPC0 is strongly affected by sediment physicochemical characteristics, SRP concentrations, and how saturated the sediment is with P (Simpson and others, 2021; Kreiling and others, 2023); thus, the sediment can play a key role in regulating stream water nutrient concentrations and downstream transport.
The Milwaukee River Basin has an area of 2,241 square kilometers (km2) and consists of the Menomonee River, Kinnickinnic River, and Milwaukee River subbasins, and the Milwaukee Estuary (site 28; fig. 1). The Milwaukee River is a tributary to Lake Michigan, and land cover in the basin is predominantly agriculture and urban. More than 1 million people in the basin get their drinking water from Lake Michigan (CDM Smith, 2018). Urban and agricultural runoff in the basin is linked to elevated loads of nutrients, sediment, and bacteria in the river, which have led to low dissolved oxygen concentrations, degraded habitat, excessive algal growth, high turbidity, and recreational impairments (CDM Smith, 2018). In basin areas near airports, airport deicing chemicals have caused elevated stream water P concentrations (Stefaniak and others, 2023). Most of the stream reaches in the basin are listed as impaired and are under a total maximum daily load plan to reduce bacteria (fecal coliform and Escherichia coli [E. coli] indicator bacteria), total P, and total suspended solids concentrations (CDM Smith, 2018). Cyanobacteria are present in the streams (Scudder Eikenberry and others, 2020), although cyanotoxins have not been documented. Recent sediment fingerprinting studies in the Kinnickinnic River subbasin identified that the sources of sediment-bound P were primarily roadways in residential areas and secondarily stream banks (Blount and others, 2023). Phosphorus concentrations were highest in suspended sediment (Blount and others, 2023), indicating that instream sediment is further enriched in P while being transported through the channel network, which has been observed in other Great Lakes agricultural basins (for example, Fitzpatrick and others, 2019; Williamson and others, 2020; Blount and others, 2022).
Stream rehabilitation projects are occurring in the Milwaukee Metropolitan Sewerage District’s (MMSD) planning area (fig. 1) to restore aquatic ecological processes and habitat, improve water quality, and reduce flooding. The Milwaukee Metropolitan Sewerage District has invested hundreds of millions of dollars on restoration projects that typically involve replacing concrete lining with a more natural streambed and installing riparian buffer strips and other natural features to improve water quality (CDM Smith, 2018). Restoration actions such as concrete removal and floodplain reconnection have occurred in parts of the Menomonee River, Kinnickinnic River, Underwood Creek and Honey Creek (tributaries to the Menomonee River), and Lincoln Creek (tributary to the Milwaukee River; fig. 1). Removing concrete and reconnecting the stream to its floodplain permits the streams to meander, hydraulic retention times to increase, and more sediment to be retained in stream reaches, all of which are conducive for P burial and increased N loss through denitrification (Kaushal and others, 2008; Kreiling and others, 2013; McMillan and Noe, 2017; Tschikof and others, 2022). Conversely, changes in stream hydrology can also enhance the release of legacy P from fine-grained sediment if the sediment is resuspended from already deposited sediment in the streambank and streambed in the river network or the Milwaukee Estuary (Records and others, 2016; Kusmer and others, 2019). Little research has been done on sediment nutrient dynamics in the basin. Without this baseline information, our understanding of how restoration actions are influencing key ecosystem processes to improve water quality and habitat conditions is limited.
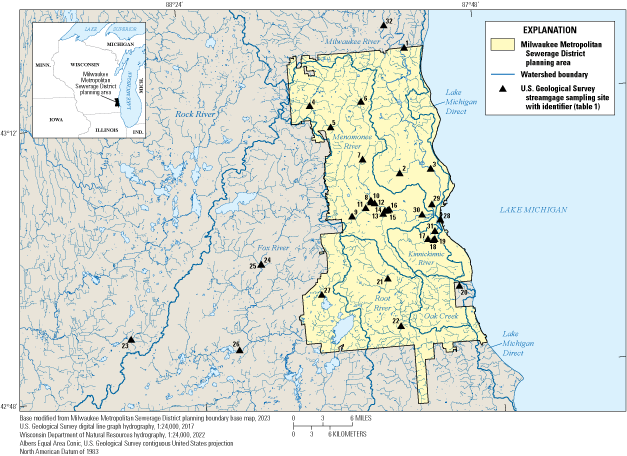
Sites where sediment samples were collected in and near the Milwaukee Metropolitan Sewerage District planning area in Wisconsin in summer 2022.
Purpose and Scope
The purpose of this report is to summarize U.S. Geological Survey (USGS) assessments of streambed sediment nutrient dynamics at 32 sites in or near the MMSD planning area in southeastern Wisconsin (fig. 1). Understanding sediment nutrient dynamics in Milwaukee metropolitan area streams is important for assessing water quality and stream habitat and evaluating downstream nutrient contributions to the Milwaukee Estuary and nearshore areas of Lake Michigan. Specifically, the purpose of this report is to (1) complete a baseline study of indicators of sediment P and N availability in stream and rivermouth sediments; (2) identify hot spots for N removal from the streams; (3) identify locations for storage and potential release of P from the streambed sediment; and (4) provide an assessment rating of good, fair, or poor at each site for the amount of bioavailable nutrients that can potentially be released to the stream water, for the N cycling potential, and for the P storage capacity indices.
Description of Study Area and Sites
A total of 32 sites were sampled during summer low flow conditions in August 2022 (table 1; fig. 1). Sampled sites include 25 sites within the MMSD planning area and 7 sites outside the MMSD planning area but still in the Milwaukee metropolitan area (fig. 1). Land cover in the Milwaukee River Basin consists of 29 percent row crops, 31 percent developed, 16 percent wetlands, 11 percent pasture, 11 percent forest, and less than 2 percent of other land cover types (Dewitz and USGS, 2021; fig. 2). The 24 study sites in the Milwaukee River Basin are mainly in the developed, southern part of the basin. The three sites outside the Milwaukee River Basin but still in the Lake Michigan Basin are in the Oak Creek (site 20) and Root River (sites 21 and 22) Basins, which are heavily developed (fig. 2). Four sites are in the Fox River Basin (sites 24, 25, 26, and 27), and one site is in the Rock River Basin (site 23). The Rock River flows into the upper Mississippi River, and the Fox River flows into the Illinois River before entering the upper Mississippi River. The five sites in the upper Mississippi River Basin have a mixed land use with 24–64 percent forest and wetland, 18–41 percent row crops and pasture, and 5–53 percent developed (fig. 2). Some of the streams in the Milwaukee metropolitan area are channelized and (or) lined with concrete to improve stormwater flow. Recent restoration projects in the basin have removed concrete, stabilized banks, and added riffles and pools to improve aquatic habitat, provide wetland mitigation, and improve fish passage (Scudder Eikenberry and others, 2020). Sites sampled for this study (fig. 1) that are in rehabilitated areas are two separate reaches in Underwood Creek at Wauwatosa, Wisconsin (USGS station 04087088–Reach A, site 10; and USGS station 04087088–Reach B, site 11); Lincoln Creek at 47th Street at Milwaukee, Wis. (USGS station 40869415, site 2); and Kinnickinnic River at 6th Street at Milwaukee, Wis. (USGS station 040871602–Reach A, site 18).
Table 1.
U.S. Geological Survey site information on surface water and sediment data-collection sites near and in the Milwaukee Metropolitan Sewerage District planning area, southeastern Wisconsin, 2022.[Data can be accessed from U.S. Geological Survey (2025) using the station number. USGS, U.S. Geological Survey; km2, square kilometer]
| Site number (fig. 1) | USGS station name | USGS station number and reach | Latitude | Longitude | Drainage area (km2) |
|---|---|---|---|---|---|
| 1 | Milwaukee River near Cedarburg, Wisconsin | 04086600 | 43.280302 | −87.941849 | 1,554.76 |
| 2 | Lincoln Creek at 47th Street at Milwaukee, Wisconsin1 | 040869415 | 43.097184 | −87.972298 | 33.31 |
| 3 | Milwaukee River at Milwaukee, Wisconsin | 04087000 | 43.100012 | −87.908974 | 1,781.98 |
| 4 | Willow Creek at Maple Road near Germantown, Wisconsin | 040870195 | 43.206673 | −88.14287 | 16.69 |
| 5 | Menomonee River at Menomonee Falls, Wisconsin | 04087030 | 43.172786 | −88.10398 | 87.22 |
| 6 | Little Menomonee River near Freistadt, Wisconsin | 04087050 | 43.206674 | −88.038423 | 19.97 |
| 7 | Little Menomonee River at Milwaukee, Wisconsin | 04087070 | 43.121821 | −88.044938 | 53.24 |
| 8 | Menomonee River at North Avenue at Wauwatosa, Wisconsin | 04087084 | 43.060743 | −88.035098 | 234.42 |
| 9 | Underwood Creek at Wall Street at Elm Grove, Wisconsin | 0408708562 | 43.03976 | −88.075656 | 24.49 |
| 10 | Underwood Creek at Wauwatosa, Wisconsin1 | 04087088–A | 43.058346 | −88.035016 | 47.53 |
| 11 | Underwood Creek at Wauwatosa, Wisconsin1 | 04087088–B | 43.050271 | −88.046457 | 26.71 |
| 12 | Menomonee River at Hoyt Park at Wauwatosa, Wisconsin | 04087092 | 43.056245 | −88.027951 | 286.70 |
| 13 | Honey Creek near Portland Avenue at Wauwatosa, Wisconsin | 04087118–B | 43.039898 | −88.012548 | 26.71 |
| 14 | Honey Creek at Wauwatosa, Wisconsin | 04087119–A | 43.044147 | −88.008657 | 27.46 |
| 15 | Honey Creek at Wauwatosa, Wisconsin | 04087119–B | 43.044063 | −88.003054 | 27.68 |
| 16 | Menomonee River at Wauwatosa, Wisconsin | 04087120 | 43.045498 | −88.000093 | 318.58 |
| 17 | Kinnickinnic River at South 11th Street at Milwaukee, Wisconsin | 04087159 | 42.997363 | −87.926108 | 48.10 |
| 18 | Kinnickinnic River at 6th Street at Milwaukee, Wisconsin1 | 040871602–A | 42.99522 | −87.915985 | 55.63 |
| 19 | Kinnickinnic River at 6th Street at Milwaukee, Wisconsin | 040871602–B | 42.996404 | −87.912887 | 56.01 |
| 20 | Oak Creek at South Milwaukee, Wisconsin | 04087204 | 42.923434 | −87.868239 | 65.41 |
| 21 | Root River at Grange Avenue at Greenfield, Wisconsin | 04087214 | 42.943402 | −88.014302 | 38.14 |
| 22 | Root River near Franklin, Wisconsin | 04087220 | 42.873092 | −87.994898 | 127.78 |
| 23 | Scuppernong River near Palmyra, Wisconsin | 05426400 | 42.885234 | −88.537975 | 67.73 |
| 24 | Fox River at Fox River Parkway North at Waukesha, Wisconsin | 05543839 | 42.980104 | −88.266754 | 334.72 |
| 25 | Pebble Creek at mouth near Waukesha, Wisconsin | 05543855 | 42.980269 | −88.267237 | 47.27 |
| 26 | Mukwonago River at Mukwonago, Wisconsin | 05544200 | 42.857539 | −88.324311 | 196.87 |
| 27 | Jewel Creek at Muskego, Wisconsin | 05544371 | 42.928662 | −88.14933 | 21.03 |
| 28 | Milwaukee River at mouth at Milwaukee, Wisconsin2 | 04087170 | 43.024444 | −87.898333 | 2,239.65 |
| 29 | Milwaukee River downstream East Cherry Street at Milwaukee, Wisconsin2 | 040870115 | 43.047694 | −87.912639 | 1,803.71 |
| 30 | Menomonee River at 16th Street at Milwaukee, Wisconsin2 | 04087142 | 43.033889 | −87.934167 | 358.28 |
| 31 | Kinnickinnic River at South 1st Street at Milwaukee, Wisconsin2 | 04087161 | 43.008333 | −87.911111 | 63.20 |
| 32 | Cedar Creek near Cedarburg, Wisconsin | 04086500 | 43.315573 | −87.979327 | 311.41 |

Land cover in and near the Milwaukee Metropolitan Sewerage District planning area in Wisconsin.
Methods
Stream water and streambed sediment samples were collected at each of the 32 sites in the Milwaukee metropolitan area. Stream water samples were analyzed for nutrient concentrations. Sediment samples were analyzed for sediment physical and chemical properties, rates of denitrification and nitrification, and P retention potential.
Water Quality
At each site, stream water samples were collected at 0.2 meter (m) below the water surface and analyzed for turbidity, specific conductance, total P, soluble reactive P, total N, nitrate as N, and ammonium as N. Samples for SRP, NO3, and NH4 were filtered through a 0.45-micron (μm) filter in the field. The SRP samples were frozen until analysis, and all other samples were acidified with concentrated sulfuric acid to pH less than 2. Samples were analyzed at the USGS Upper Midwest Environmental Sciences Center (UMESC) in La Crosse, Wis. The total N and total P samples were digested with potassium persulfate and then analyzed on a discrete autoanalyzer. Samples for NO3 and NH4 were analyzed on a continuous-flow autoanalyzer, and SRP was analyzed on a discrete autoanalyzer. Total N and NO3 were determined by the automated cadmium reduction method, and NH4 was determined using the automated phenate method (American Public Health Association and others, 2017). Total P and SRP were determined using the ascorbic acid method (American Public Health Association and others, 2017). Detection limits were as follows: SRP, 0.001 milligram per liter (mg/L) as P; TP, 0.001 mg/L as P; NO3, 0.007 mg/L as N; NH4, 0.004 mg/L as N; and total N, 0.006 mg/L as N. Approximately 10 percent of the water samples were analyzed in duplicate to measure precision, and standard reference material samples were analyzed with each batch of samples to determine accuracy of measured concentrations.
Sediment Nutrient and Physical Properties
Four sediment cores (5-centimeter [cm] depth by 7.6-cm diameter) were collected at each site and extruded into a zipper storage bag. Ambient sediment temperature and pH were measured on one core. Samples were transported on ice to UMESC where all four cores were combined into one sample and homogenized. Samples were analyzed for potassium chloride (KCl)-exchangeable NH4 and porewater NO3, which is a measure of the pool of bioavailable N, and magnesium chloride (MgCl2)-exchangeable SRP, which is a measure of the pool of bioavailable P. Higher concentrations of KCl-exchangeable NH4 and MgCl2-exchangeable SRP indicate a great potential for the sediment to release these nutrients to stream water. Samples also were analyzed for bulk density, percentage volatile solids, percentage water-filled pore space, and percentage water following Robertson and others (1999). Percentage sediment total carbon (C), total organic C, and total N were determined with an Elementar vario cube (Langenselbold, Germany), and molar ratios of total C to total N were calculated based on these results. Total sediment P was determined by inductively couple plasma mass spectrometry (Kreiling and others, 2019b). Particle size distribution was measured with the integral suspension pressure method (Durner and Iden, 2021) and used to estimate median particle size.
Sediment Nitrification and Denitrification
Sediment nitrification and denitrification assays were initiated within 24 hours of sample collection in the laboratory at UMESC. Potential nitrification rate was determined by the ammonium oxidation method (International Organization for Standardization, 2012). Sediment was incubated under oxic conditions at ambient sediment temperatures with 79 milliliters (mL) of sample waters and 0.8 mL of 1.5 molar chlorate (Kreiling and others, 2024). Denitrification rate was determined using the acetylene block method (Groffman and others, 1999; Richardson and others, 2004). Homogenized sediment slurries were incubated under anoxic conditions at ambient sediment temperatures with acetylene inhibition techniques to determine denitrification enzyme activity (DEA; with added NO3 [14 mg/L as NO3-N] and C [12 mg/L as glucose-C]) and potential denitrification rates (DEN; no additions).
Sediment Phosphorus Retention Potential
Sediment cation composition was determined at the University of Minnesota Research Analytical Laboratory using the Mehlich-3 method on dried sediment that had passed through a 2-millimeter (mm) sieve (Mehlich, 1984). Cations measured were aluminum (Al), Ca, iron (Fe), Mehlich 3 extractable phosphorus (M3P), magnesium, and manganese. M3P is commonly used in soils as an index of P availability. From the Mehlich-3 data, P saturation ratios (PSRs) were calculated (PSR=M3P/(Fe+Al); Sims and others, 2002). The PSR is an index of retention potential of sediment where values less than 0.10 indicate potential P binding to the sediment and values greater than 0.15 indicate potential P release (Nair, 2014).
The EPC0 (Froelich, 1988; Simpson and others, 2021) was determined within 24 hours of sample collection. To determine EPC0, 1.5 grams (g) of sediment was added to six 50-mL centrifuge tubes along with a series of 30 mL of 0.01 molar KCl solutions with P concentrations of 2.0, 1.0, 0.5, 0.1, 0.05, or 0 mg/L as P. The samples were shaken for 24 hours at room temperature, centrifuged, and the aliquot was filtered and analyzed for SRP. A linear regression of the amount of P sorbed (milligrams per kilogram as P per dry sediment) against the final SRP concentration (milligrams per liter as P) in the centrifuge tube was used to determine EPC0, with the x-intercept representing EPC0 (Pant and Reddy, 2001). We also calculated the phosphate exchange potential (PEP), which is a measurement of the relative difference between EPC0 and SRP (Simpson and others, 2021). Negative PEP values indicate a potential for P sorption to the sediment, and positive values indicate a potential for P desorption. Values close to zero imply equilibrium (Simpson and others, 2021; Kreiling and others, 2023).
Statistical Analyses and Site Assessments
Statistical analyses were run in R version 4.3.2 (R Core Team, 2023). Summary statistics were calculated for all variables. The concentrations of Al and porewater NO3 were below the detection limit at more than half of the sites, so the Kaplan-Meier method in the NADA R package (Lee, 2022) was used to generate the mean Al and KCl-exchangeable NO3 concentrations. Spearman’s rank correlation coefficients (ρ) were run to determine correlations among all measured sediment properties and nutrient dynamics. To account for the data with nondetects, Kendall’s rank correlation coefficients (τ) were run to determine correlations between Al and the sediment nutrient dynamics and to determine correlations between KCl-exchangeable NO3 and the sediment nutrient dynamics. Hot spots for N cycling (nitrification and denitrification) were identified as sites with measured rates above the 75th percentile of all measurable rates (Palta and others, 2014; Kreiling and others, 2019a). All data generated during this study are available as a USGS data release (Kreiling and others, 2025).
Each site was given a ranking of good, fair, or poor based on the amount of bioavailable nutrients present in the streambed sediment, the capacity of the sediment to store additional P, and the potential for N cycling at the site. These assessments were made for bioavailable N, bioavailable P, nitrification potential, denitrification potential, and the P retention indices of EPC0, PEP, and PSR. The criteria for ranking of good, fair, or poor are listed in table 2.
Table 2.
Ranking criteria to assess the amount of bioavailable nutrients, the potential for nitrogen cycling, and the potential phosphorus storage capacity in the streambed sediment at stream sites in and near the Milwaukee Metropolitan Sewerage District planning area of Wisconsin.[mg/kg, milligram per kilogram; >, greater than; <, less than; [μg N/cm2]/hr, microgram of nitrogen per square centimeter per hour; mg/L, milligram per liter;]
Nitrogen and Phosphorus Bioavailability in Streambed Sediment
Concentrations of bioavailable N (that is, KCl-exchangeable NH4) varied substantially across the sites (fig. 3), with a median value of 12.0 mg/kg as N (table 3) and highest concentrations downstream in or near the estuary (site 28; fig. 3). Porewater NO3 was only measurable at nine of the sites, with the maximum observed concentration of only 0.60 mg/kg as N (table 3). Concentrations of bioavailable P (that is, MgCl2-exchangeable SRP) also varied across the sites (fig. 4), with a median concentration of 5.5 mg/kg as P (table 3) and highest concentrations downstream in or near the estuary. Concentrations of bioavailable N and P in the streambed sediment increased as particle size decreased (fig. 5A,B). Three of the four estuary sites (sites 28, 30, and 31) had streambed particles with very low median diameters and had some of the greatest concentrations of bioavailable nutrients (figs. 3 and 4). The lowest concentrations of bioavailable nutrients were in sites in the Menomonee River and its tributaries (figs. 3 and 4). Much of the urban area in the basin contains impervious surfaces like roads, which cause flashy peak flows of water during storms (Julian and Gardner, 2014) that quickly transport sediment through the stream network (Fitzpatrick and Peppler, 2010); moreover, several of the streams are concrete-lined, especially in the Menomonee River subbasin (Southeastern Wisconsin Regional Planning Commission, 2007), which also speeds water and sediment transport (Fitzpatrick and Peppler, 2010). Instead of fine sediment depositing in the streambed, it is deposited farther downstream in the rivermouth (Larson and others, 2013). Flow in Great Lakes rivermouths are a combination of river flow and lake level where water flowing upstream from the lake can mix with the river water, slowing streamflow and increasing water retention times (House, 1987; Larson and others, 2013). The increase in water retention time causes high deposition rates in the estuary (Larson and others, 2013).
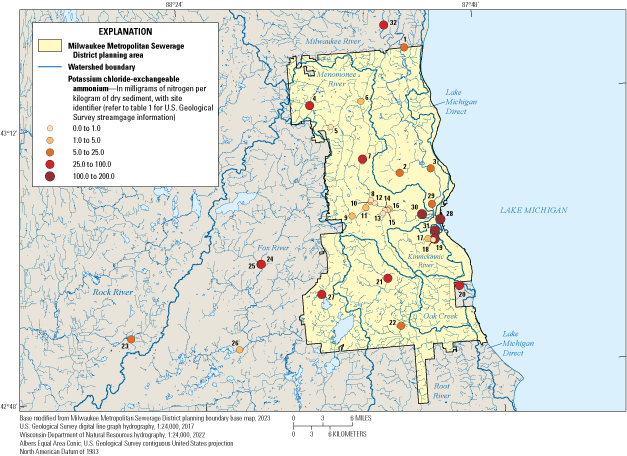
Potassium-exchangeable ammonium concentration at each of the 32 sites sampled in and near the Milwaukee Metropolitan Sewerage District planning area in Wisconsin in summer 2022. Data from Kreiling and others (2025).
Table 3.
Statistical summaries for streambed sediment physical and chemical properties from samples collected in and near the Milwaukee Metropolitan Sewerage District planning area of Wisconsin, summer 2022. Data summarized from Kreiling and others (2025).[°C, degree Celsius; mg/kg, milligram per kilogram; --, not available; <, less than; g/cm3, gram per cubic centimeter; g/kg, gram per kilogram; mm, millimeter]
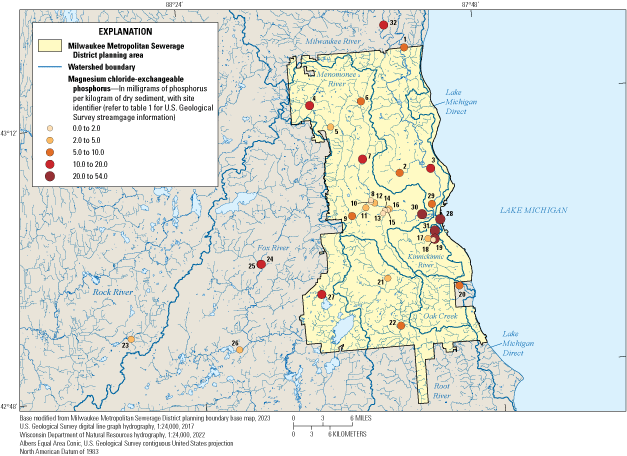
Magnesium chloride-exchangeable phosphorus concentration at each of the 32 sites sampled in and near the Milwaukee Metropolitan Sewerage District planning area in Wisconsin in summer 2022. Data from Kreiling and others (2025).

Plots of relation of median particle size with sediment nutrient dynamics in samples collected in and near the Milwaukee Metropolitan Sewerage District planning area in Wisconsin in summer 2022. A, Potassium chloride-exchangeable ammonium. B, Magnesium chloride-exchangeable phosphorus. C, Nitrification rate. D, Equilibrium phosphorus concentration. E, Denitrification enzyme activity. F, Phosphate exchange potential. Data summarized from Kreiling and others (2025).
Streambed sediment that was high in bioavailable nutrients also contained higher concentrations of other nutrients. The KCl-exchangeable NH4 concentrations were positively related to sediment total organic C concentrations (Spearman rank order correlation [ρ] =0.72, probability value (p)<0.0001) and sediment total N concentrations (ρ=0.88, p<0.0001). Similarly, MgCl2-exchangeable SRP concentrations were positively related to sediment total organic C concentrations (ρ=0.70, p<0.0001) and sediment total P concentrations (ρ= 0.86, p<0.0001). Mineralization of organic material causes an increase in the pool of available NH4 and SRP (Noe and others, 2013); thus, streambed sites with higher concentrations of organic C and finer sediment tend to have higher concentrations of bioavailable N and P (Johnston and others, 2001; Records and others, 2016).
Nitrification and Denitrification Hot Spots
The median potential nitrification rate was 1.0 microgram of N per square centimeter per hour [(μg N/cm2)/hr]; the potential nitrification rate ranged from 0.1 to 4.2 (μg N/cm2)/hr. Eight locations were nitrification hot spots (that is, measured rates above the 75th percentile of all rates) with rates greater than 2.0 (μg N/cm2)/hr (fig. 6). The highest nitrification rate was observed at the Fox River at Waukesha site (site 24) and the lowest rate was at the Mukwonago River at Mukwonago site (site 26). Both sites are in the upper Mississippi River Basin outside of the MMSD planning area (fig. 6), but are included in this study to increase the number of sites with agricultural land use (fig. 2). The Mukwonago River site (site 26) is downstream from a dam, which can prevent deposition of fine sediment and thus the accumulation of bioavailable nutrients, including the NH4 needed for nitrification. The rehabilitated Underwood Creek site (USGS 04087088–Reach B, site 11) also had relatively high nitrification rates. In general, rates were greater in the more upstream locations of the Menomonee and Milwaukee River subbasins (fig. 6), which typically contain less urban land and more agricultural land (fig. 2). One nitrification hot spot at the Milwaukee River at Milwaukee site (site 3) was in a more urban area. The sediment at the Milwaukee River at Milwaukee site (site 3) had a relatively high concentration of bioavailable N, which likely drove nitrification.

Nitrification rate at each of the 32 sites sampled in and near the Milwaukee Metropolitan Sewerage District planning area in Wisconsin in summer 2022. Data from Kreiling and others (2025).
Nitrification rates generally decreased with more urban land use in the basin (fig. 7A) and increased at sites with more agricultural land use in the basin (fig. 7B). Other studies also have observed increased nitrification rates with increasing agricultural land use (Arango and Tank, 2008; Kreiling and others, 2024). The potential nitrification rate range of 0.1–4.2 (μg N/cm2)/hr was much lower than the range measured in the agricultural Maumee River Basin (0–65.7 [μg N/cm2]/hr; Kreiling and others, 2024), which is another Great Lakes Basin, indicating that nitrification rates are not very high in Milwaukee metropolitan area streams.

Plots of relation of land cover in the basin with sediment nutrient dynamics in samples collected in and near the Milwaukee Metropolitan Sewerage District planning area in Wisconsin in summer 2022. A, Urban area versus nitrification rate. B, Agricultural area versus nitrification rate. C, Urban area versus phosphorus saturation ratio. D, Agricultural area versus phosphorus saturation ratio. Land use area from Dewitz and U.S. Geological Survey (2021); sediment nutrient dynamics from Kreiling and others (2025).
Nitrification rates were positively related to sediment total N (ρ=0.58, p=0.0005), KCl-exchangeable NH4 (ρ=0.53, p=0.0016), and total organic C concentrations (ρ=0.52, p=0.0024) and negatively related to particle size (fig. 5C); thus, nitrification rates were higher at stream sites that contained fine sediment with greater concentrations of N (Bernot and Dodds, 2005; Arango and Tank, 2008). Rates also were negatively related to the molar ratio of C to N (ρ=−0.62, p=0.0002) likely because of competition for N between nitrifying bacteria and heterotrophic bacteria (Strauss and others, 2002).
Potential denitrification rates were only measurable at 11 of the 32 sites (range of 0–2.95 [μg N/cm2]/hr) with only four sites (Menomonee River at Menomonee Falls [site 5], Menomonee River at North Ave. at Wauwatosa [site 8], and two Honey Creek sites [sites 13 and 15]) having rates more than 1.0 (μg N/cm2)/hr. Our criterion for a DEN hot spot was a site that was in the 75th percentile of sites with measurable rates. Because only 11 sites had measurable rates, only 3 sites could be considered hot spots. The highest potential DEN rate was observed at the Menomonee River at Menomonee Falls site (site 5), with the two Honey Creek sites having the second (USGS 04087119–Reach B, site 15) and third (USGS 04087118–Reach B, site 13) highest rates. Most of the sites that had measurable DEN rates were in the Menomonee River subbasin near Wauwatosa.
The DEN range of 2.67–2.95 (μg N/cm2)/hr for hot spots was much lower than the DEN range for hot spots observed in other Great Lakes Basins, particularly the Fox River Basin in northeastern Wisconsin, which drains to Green Bay in Lake Michigan (4.65–57.83 [μg N/cm2]/hr; Kreiling and others, 2019a) and the Maumee River Basin (9.00–24.74 [μg N/cm2]/hr; Kreiling and others, 2024). The reported range of NO3 concentrations was much greater in the Fox River Basin (less than 0.01–15.8 mg/L as N; Kreiling and others, 2019a) and Maumee River Basin (0.01–15.9 mg/L as N; Kreiling and others, 2024) compared to the Milwaukee River Basin (less than 0.01–5.6 mg/L as N; table 4), which likely led to lower DEN rates at hot spots in the Milwaukee River Basin.
Table 4.
Statistical summaries for water quality samples collected from streams in and near the Milwaukee Metropolitan Sewerage District planning area of Wisconsin, 2022. Data summarized from Kreiling and others (2025).[μS/cm, microsiemen per centimeter; NTU, nephelometric turbidity unit; mg/L, milligram per liter; <, less than]
Denitrification rates were positively correlated with porewater-exchangeable NO3 (τ=0.43, p<0.0001). Of the 11 sites that had measurable DEN, 9 of them were the sites that also had measurable porewater NO3. The other two sites with measurable DEN were the only sites with stream water NO3 above 1.5 mg/L as N (Fox River at Waukesha, site 24: 5.6 mg/L as N; and Pebble Creek near Waukesha, site 25: 2.0 mg/L as N). The median stream water NO3 concentration was 0.40 mg/L as N (table 4), which is high compared to the median concentration of 0.17 mg/L as N that was measured in other urban streams across North America (Mulholland and others, 2008). As stream water NO3 concentrations were theoretically high enough at half of the sites to not limit denitrification (approximately 0.4 mg/L as N; Inwood and others, 2005), DEN at these sites likely was limited by some other factor like C. Also, the stream water NO3 may have been unable to diffuse into the sediment during the sample incubation. Additionally, oxygen, which blocks the anerobic process of denitrification (Seitzinger and others, 2006; Böhlke and others, 2009), may have still been present in the sediment even though we evacuated the sample jars before analysis.
Denitrification enzyme activity was measurable at all the sites (fig. 8). Denitrification enzyme activity is the potential denitrification rate where NO3 and C are provided to the denitrifying bacteria at concentrations that will not limit the rate. Rates were much greater than rates of DEN (DEA range 2.89–46.64 [μg N/cm2]/hr), indicating that C, NO3, or a combination of both nutrients was limiting denitrification at all sites. The DEA hot spot locations had rates greater than 25.0 (μg N/cm2)/hr. The median DEA of 16.78 (μg N/cm2)/hr was greater than the median DEA observed in other Great Lakes Basins, particularly the Fox River Basin in northeastern Wisconsin (8.4 [μg N/cm2]/hr; Kreiling and others, 2019a) and the Maumee River Basin (9.96 [μg N/cm2]/hr; Kreiling and others, 2024), indicating a high potential for denitrification in the Milwaukee metropolitan area streams if ample NO3 and C are available in the sediment for the denitrifying bacteria. The highest DEA in the study streams was measured at the Fox River at Waukesha site (site 24). Rates were high in Oak Creek (site 20), Cedar Creek (site 32), Pebble Creek (site 25), and some of the estuary sites (sites 30 and 31; fig. 8). The rehabilitated Underwood Creek (USGS 04087088–Reach B, site 11) and Lincoln Creek (site 2) sites also had relatively high DEA. The lowest DEA rates were observed at the Mukwonago River (site 26), Menomonee River at Menomonee Falls (site 5), Menomonee River at North Ave. (site 8), and other sites in the Menomonee River subbasin (fig. 8).

Denitrification enzyme activity at each of the 32 sites sampled in and near the Milwaukee Metropolitan Sewerage District planning area in Wisconsin in summer 2022. Data from Kreiling and others (2025).
Just like the nitrification rates, DEA was positively correlated with sediment total N (ρ=0.71, p<0.0001), KCl-exchangeable NH4 (ρ=0.75, p<0.0001), and total organic C concentrations (ρ=0.68, p<0.0001) and negatively related to particle size (fig. 5E). In urban streams, denitrification can be limited by C (Waters and others, 2014) and N (Inwood and others, 2005). By removing the N and C limitation in the DEA assay, we observed much higher DEA compared to DEN, which was not amended with any nutrients. In addition, DEA was highly correlated with nitrification (ρ=0.74, p<0.0001), indicating that coupled nitrification-denitrification was likely occurring (Seitzinger and others, 2006). The acetylene block method used to measure DEN inhibits nitrification (Seitzinger and others, 1993), which can underestimate the actual rate of denitrification occurring at a site. The high rates of DEA observed at the site indicate that much of the NO3 used for denitrification likely is supplied from nitrification (Seitzinger and others, 2006). Nitrification is an aerobic process, whereas denitrification is an anaerobic process. Typically, the aerobic layer in stream sediment is only millimeters to a few centimeters thick; thus, denitrification likely only occurs at the interface of the oxic/anoxic zone where ample oxygen is present for nitrification to occur which supplies NO3 for denitrification (Seitzinger and others, 2006).
Phosphorus Retention Potential in Streambed Sediment
The capacity of sediment to be a source or sink for P was measured with the EPC0, which is the concentration of dissolved P in the water column where there is no net uptake or release of P from the sediment (Froelich, 1988; Simpson and others, 2021). A lower EPC0 indicates that the sediment has a higher likelihood of retaining additional P (Froelich, 1988). The median EPC0 concentration of the sediment was 0.019 mg/L as P (range of 0.001–0.250 mg/L as P), which is lower than the median EPC0 concentration of 0.023 mg/L as P measured in the Fox River Basin in northeastern Wisconsin (Kreiling and others, 2019b) and the median EPC0 concentration of 0.052 mg/L as P measured in the Maumee River Basin (Kreiling and others, 2023); thus, the sites in the Milwaukee metropolitan area have higher potential retention capacities than other Great Lakes tributaries which suffer from harmful algal blooms. Low EPC0 was observed at the Oak Creek (site 20), Lincoln Creek (site 2), both Root River (sites 21 and 22), Jewel Creek (site 27), and Underwood Creek (site 10) sites (fig. 9). The highest EPC0 was observed at the Menomonee River at Menomonee Falls site (site 5) and the next two highest EPC0 were in the two concrete-lined stream sites in Honey Creek (site 13) and the Kinnickinnic River at South 11th Street (site 17). The estuary sites had intermediate EPC0 (range of 0.008–0.029 mg/L as P) compared to the stream sites.

Equilibrium phosphorus concentration at each of the 32 sites sampled in and near the Milwaukee Metropolitan Sewerage District planning area in Wisconsin in summer 2022. Data from Kreiling and others, 2025.
The EPC0 was positively related to the median particle size (fig. 5D), meaning coarse sediments are generally less likely to retain additional P. The EPC0 was negatively related to MgCl2-exchangeable SRP (ρ=–0.42, p=0.015), sediment total P (ρ=–0.60, p=0.0003), total organic C concentrations (ρ=–0.60, p=0.0003), and Al concentrations (τ=–0.42, p=0.0003). Sediment physicochemical characteristics were the main drivers of EPC0 in other Great Lakes Basins (Kreiling and others, 2019b; Kreiling and others, 2023), with EPC0 increasing with increasing particle size (Kreiling and others, 2021).
Most of the sites had a phosphate exchange potential less than 0, indicating that they were acting as potential P sinks when sampled (fig. 10). The median SRP concentration was 0.043 mg/L as P (table 4) and much greater than the median EPC0, resulting in the potential binding of the dissolved P to the sediment at several sites (Simpson and others, 2021). Sites that were potential P sinks include both Root River (sites 21 and 22), Cedar Creek (site 32), Oak Creek (site 20), and all the estuary sites except the Kinnickinnic River at South 1st Street site (site 31), which was at P equilibrium with the water column (fig. 10). Two of the rehabilitated sites, Lincoln Creek (site 2) and Underwood Creek (site 11), were potential P sinks, whereas only one of the rehabilitated sites, Kinnickinnic River at 6th Street (site 18), was a potential P source (fig. 10). All the sites in the upper Mississippi River Basin except the Jewel Creek site (site 27) were potential P sources. These upper Mississippi River sites had relatively low SRP concentrations (<0.02 mg/L as P) which resulted in potential P release from the sediment. The SRP concentrations could have been low because of increased biological P uptake in the stream during summer low flow conditions (Reddy and others, 1999).

Phosphate exchange potential at each of the 32 sites sampled in and near the Milwaukee Metropolitan Sewerage District planning area in Wisconsin in summer 2022. Data from Kreiling and others (2025).
The PEP was positively correlated with particle size (fig. 5F) and negatively correlated with Fe (ρ=−0.73, p<0.0001), Al (τ=−0.35, p=0.0020), sediment total P (ρ=−0.53, p=0.0016), and total organic C concentrations (ρ=−0.48, p=0.0058). Fine sediment has a greater specific surface area for P sorption (McDowell and others, 2002; Withers and Jarvie, 2008) and could contain numerous Al and Fe binding sites for P (House and others, 1998; Evans and others, 2004). Additionally, organic matter has metal oxyhydroxides that bind P (Evans and others, 2004); thus, P sinks were in areas that contained fine sediment and higher concentrations of organic C. In other urban streams, the sediment also can be a P sink in areas downstream from wastewater treatment plants because of extremely high SRP concentrations discharged from the plants (Jarvie and others, 2005). Milwaukee Metropolitan Sewerage District’s wastewater treatment plants discharge directly into Lake Michigan and likely do not affect the SRP concentrations in the Milwaukee metropolitan area streams but could be affecting SRP concentrations in the estuary.
Five of the stream sites were saturated with P based on P saturation ratios above 0.15 (fig. 11). These sites were in Pebble Creek (site 25), Cedar Creek (site 32), Milwaukee River at the mouth (site 28), Mukwonago River (site 26), and Willow Creek (site 4). All these sites except the Milwaukee River at the mouth (site 28) are in areas with more agricultural land cover (fig. 2). Also, only one (Mukwonago River [site 26]) of the five sites had a relatively high EPC0 value, whereas the other four sites had EPC0 values close to the median EPC0 for all the sites. Ten sites had PSRs that ranged between 0.1 and 0.15, which indicates that the site is becoming close to being saturated with P. Several of these sites were in the upstream parts of the Milwaukee and Menomonee River subbasins (fig. 11) where there is a higher percentage of agricultural land (fig. 2). In general, PSR decreased with increasing urban cover (fig. 7C) and increased with increasing agricultural land cover (fig. 7D). Across the United States, agricultural land use is strongly related to total P concentrations in stream water (Sabo and others, 2023), and exposure to continuously high P concentrations can eventually overwhelm the P buffering capacity of the streambed sediment (Simpson and others, 2021). Increasing agricultural land cover directly increased the PSR of the sediment in causal models developed for the Fox River Basin in northeastern Wisconsin (Kreiling and others, 2020) and the Maumee River Basin (Kreiling and others, 2023), and PSR values increased as agricultural land cover increased in other basins across the midcontinental United States (Haggard and others, 2007; Trentman and others, 2021). Unlike the other sediment nutrient dynamics, PSR was not strongly related to particle size (ρ=−0.03, p=0.8624), sediment total P concentration (ρ=0.15, p=0.4186), or sediment total organic C concentration (ρ=0.25, p=0.1708); thus, the degree of P saturation in the sediment was likely driven by the level of historical and existing exposure to P loading and not by sediment physical and chemical properties.

Phosphorus saturation ratio at each of the 32 sites sampled in and near the Milwaukee Metropolitan Sewerage District planning area in Wisconsin in summer 2022. Data from Kreiling and others (2025).
Sediment phosphorus retention potential was measured with three different indices: EPC0, PEP, and PSR, which can sometimes provide what appears to be contradictory results. The EPC0 and PEP are strongly related, as EPC0 is used to calculate PEP. In the Milwaukee metropolitan area streams, PSR was weakly correlated to EPC0 (ρ=0.34, p=0.055). Yet, some of the sites that appeared to be saturated with P were potential P sinks based on the PEP measured at the site. The Willow Creek (site 4), Milwaukee River at the mouth (site 28), and Cedar Creek (site 32) sites had a high PSR (fig. 11) but a negative PEP (fig. 10). The SRP concentrations were relatively high and the particle size at these sites was small, resulting in the capacity of the sediment to bind additional P. An assessment of short- and long-term P buffering capacity in the subbasins of the Saint Lawrence River Basin determined that as agricultural land cover increased, the short-term (annual) P buffering capacity of subbasins also increased likely because of the input of fine sediment and P to the subbasin (Kusmer and others, 2019); however, as streambed sediment in a basin is exposed to more P loading, the P buffering capacity of the sediment can decrease and the flux of bioavailable P to downstream waterbodies can increase (Simpson and others, 2021). Additionally, PSR is based on the ratio of Mehlich-3 P to Al and Fe in the sediment (Mehlich, 1984), which does not account for the potential binding of P to Ca in more alkaline soils (Kleinman, 2017); thus, the sediment at some these sites could have additional P binding sites that were not identified in the PSR index.
Sediment Nutrient Dynamics at Rehabilitated Stream Sites
Four of the stream sites were in rehabilitated stream reaches that have been restored at different times. Stream restoration was completed in Lincoln Creek (site 2) in 2003, in the Kinnickinnic River at 6th Street (site 18) in 2012, in Underwood Creek (USGS 04087088–Reach B, site 11) in 2012, and in Underwood Creek (USGS 04087088–Reach A, site 10) in 2018. Particle size, which was one of the main drivers of N removal rates and P retention capacity, varied across the restoration sites. Lincoln Creek (site 2) had very fine sediment, which resulted in low EPC0 (fig. 9) and DEA rates above the median for the study (fig. 8). Underwood Creek (USGS 04087088–Reach B, site 11) had a sandy substrate and was the restored site with the best sediment nutrient dynamics to improve water quality based on having relatively low bioavailable nutrient concentrations, high rates of nitrification and denitrification, a low equilibrium P concentration, and a low P saturation ratio (table 1.1). Nitrification (fig. 6) and DEA rates were relatively high, the site (site 11) was a potential P sink (fig. 10), and the sediment was not saturated with P (fig. 11). The Kinnickinnic River at 6th Street (site 18) and Underwood Creek (USGS 04087088–Reach A, site 10) sites had very low bioavailable nutrients (figs. 3 and 4). Yet, EPC0 and PSR were low in Underwood Creek (USGS 04087088–Reach A, site 10), but relatively high at the Kinnickinnic River site (site 18), which could reflect the recent restoration work completed in 2018 at the Underwood Creek site (USGS 04087088–Reach A, site 10). Additionally, rip rap, which is used for bank stabilization, was used in the restored sections of Underwood Creek (USGS 04087088–Reach A, site 10) and Lincoln Creek (site 2). By preventing erosion, bank stabilization can also reduce P loads in the streams (Lammers and Bledsoe, 2017).
Even in rehabilitated stream reaches where measured DEA was relatively high, substantial N removal could not occur if other conditions for denitrification are not met. Other studies that have measured N removal in restored urban stream reaches have determined that one of the main factors affecting N removal rates was hydraulic retention time (Kaushal and others, 2008; Filoso and Palmer, 2011). Increased hydraulic retention time allowed for more in-channel processing of nutrients (Filoso and Palmer, 2011); moreover, restored streams that had a strong hydraulic connection to the riparian area had higher rates of N removal through infiltration of groundwater and stream water into the floodplains soils (Kaushal and others, 2008). Increased connection to the riparian area also promoted sediment and particulate nutrient deposition, reducing transport downstream (McMillan and Noe, 2017). Both Underwood Creek restoration sites (sites 10 and 11) and the Kinnickinnic River site (site 18) are downstream from concrete-lined stream reaches, which can decrease hydraulic retention time in the restored reaches. Floodplain connectivity was restored in the Underwood Creek site (USGS 04087088–Reach B, site 11) to allow for the floodplain to get inundated more frequently (Bell and others, 2021), which could be the reason that the site had the highest potential to improve water quality of the four restored reaches.
Summary
Several of the streams in the Milwaukee metropolitan area in Wisconsin are impaired because of high concentrations of suspended solids and total phosphorus (P). To improve conditions in these streams, total maximum daily loads have been developed and sections of the streams have been restored. The U.S. Geological Survey and Milwaukee Metropolitan Sewerage District have an ongoing partnership to monitor stream water quality and assess the effects of stream restoration on habitat and water quality. Sediment nutrient dynamics can affect water quality by improving or further impairing conditions; thus, streambed sediment was collected at 32 sites in the Milwaukee metropolitan area in summer 2022 to assess the sediment nutrient dynamics in these streams. The objectives were to determine indicators of sediment nutrient availability, identify hot spots of nitrogen (N) removal, identify locations of P storage and potential P release, and provide an assessment of the sediment nutrient dynamics at each site.
The strongest indicator of sediment nutrient availability was the presence of fine sediment. Concentrations of both bioavailable N and P increased as particle size decreased. Several of the sites with finer particles were in downstream parts of the study area, especially in the Milwaukee Estuary sites. Sites that contained a higher portion of fine sediment also had more organic material, which could have supplied the bioavailable nutrients through decomposition.
Several of the sites that had more fine sediment with high concentrations of bioavailable N also were hot spots of nitrification and denitrification enzyme activity. In these locations, the fine sediment was supplying ample N and carbon for microbial activity. Potential denitrification rates were low at most sites, however, indicating that denitrification potential was limited by some other factor, potentially the inability for nitrate to diffuse into the sediment or the presence of oxygen. As the method used to measure potential denitrification rates inhibits nitrification, much of the denitrification activity likely is fueled by coupled nitrification-denitrification. This was further evidenced by the high correlation of denitrification enzyme activity with nitrification and bioavailable ammonium, which is the main N source for nitrification. In addition to the stream water nitrate that is denitrified, ammonium from the sediment and stream water is first nitrified to nitrate and then denitrified; thus, coupled nitrification-denitrification increases the total amount of N removed.
Sites with fine sediment also retained more P than sites that had coarser substrates. Fine sediment provides many binding sites for P, and can be a long-term sink of P. Yet, through time, the binding sites can become saturated and the potential for the P to be released back into the stream water increases. Only 5 of the 32 sampled sites had phosphorous saturation ratio values that indicated that the sediment was saturated, but 10 sites were in the phosphorous saturation ratio range where saturation is a potential concern. Sites that contained more agricultural land in their drainage areas were at higher risk of having sediment that was saturated or near-saturation. Typically, P concentrations are higher in agricultural streams, which can eventually overwhelm the P buffering capacity of the sediment as all the P-binding sites become filled. Additionally, whereas the anoxic state that is created by organic matter decomposition and nitrification is conducive for N removal via denitrification, it can also accelerate P release from the sediment presenting a trade-off between site conditions that are optimal for N removal but simultaneously promote P release.
Because sediment nutrient dynamics can affect water quality, measuring sediment nutrient concentrations and nutrient cycling rates, especially in stream reaches that are being or have been restored, provides valuable information. Results from this study indicate that stream rehabilitation projects that promote in-channel sediment deposition and accumulation of organic matter can increase N removal and instream P retention. Although not assessed in this study, water quality could be further improved by increasing the hydraulic connectivity to the riparian zone in these restored reaches.
Acknowledgments
We thank Sean Bailey, Brad Morris, Lauren Brochtrup, John Manier, Derek Craig, Shirley Yuan, Vanessa Czeszynski, Sam Baumgartner, and Hayes Pribus from the U.S. Geological Survey Upper Midwest Environmental Sciences Center who helped do sediment assays and analyzed water quality samples. We thank Justin Peschman and James Romano from the U.S. Geological Survey Upper Midwest Water Science Center who collected the sediment and water samples. Anna Baker and James Larson provided reviews that improved the report.
References Cited
Arango, C.P., and Tank, J.L., 2008, Land use influences the spatiotemporal controls on nitrification and denitrification in headwater streams: Journal of the North American Benthological Society, v. 27, no. 1, p. 90–107. [Also available at https://doi.org/10.1899/07-024.1.]
Bell, A.H., Sullivan, D.J., and Scudder Eikenberry, B.C., 2021, Summary of fish communities along Underwood Creek, Milwaukee, Wisconsin, 2004–2019: U.S. Geological Survey Open-File Report 2020–1112, 14 p. [Also available at https://doi.org/10.3133/ofr20201112.]
Bernot, M.J., and Dodds, W.K., 2005, Nitrogen retention, removal, and saturation in lotic ecosystems: Ecosystems (New York, N.Y.), v. 8, no. 4, p. 442–453. [Also available at https://doi.org/10.1007/s10021-003-0143-y.]
Bilotta, G.S., and Brazier, R.E., 2008, Understanding the influence of suspended solids on water quality and aquatic biota: Water Research, v. 42, no. 12, p. 2849–2861. [Also available at https://doi.org/10.1016/j.watres.2008.03.018.]
Birgand, F., Skaggs, R.W., Chescheir, G.M., and Gilliam, J.W., 2007, Nitrogen removal in streams of agricultural catchments—A literature review: Critical Reviews in Environmental Science and Technology, v. 37, no. 5, p. 381–487. [Also available at https://doi.org/10.1080/10643380600966426.]
Blount, J.D., Lenoch, L.E.K., and Fitzpatrick, F.A., 2022, Stream corridor and upland sources of fluvial sediment and phosphorus from a mixed urban-agricultural tributary to the Great Lakes: Journal of Great Lakes Research, v. 48, no. 6, p. 1536–1549. [Also available at https://doi.org/10.1016/j.jglr.2022.08.024.]
Blount, J.D., Lenoch, L.E.K., and Fitzpatrick, F.A., 2023, Stream corridor sources of suspended sediment and sediment-bound phosphorus from an urban tributary to the Great Lakes in Proceedings of SEDHYD 2023, St. Louis, Mo., May 8–12, 2023: St. Louis, Mo., SEDHYD, 15 p. [Also available at https://pubs.usgs.gov/publication/70242719.]
Böhlke, J.K., Antweiler, R.C., Harvey, J.W., Laursen, A.E., Smith, L.K., Smith, R.L., and Voytek, M.A., 2009, Multi-scale measurements and modeling of denitrification in streams with varying flow and nitrate concentration in the upper Mississippi River basin, USA: Biogeochemistry, v. 93, nos. 1–2, p. 117–141. [Also available at https://doi.org/10.1007/s10533-008-9282-8.]
Carey, R.O., Hochmuth, G.J., Martinez, C.J., Boyer, T.H., Dukes, M.D., Toor, G.S., and Cisar, J.L., 2013, Evaluating nutrient impacts in urban watersheds—Challenges and research opportunities: Environmental Pollution, v. 173, p. 138–149. [Also available at https://doi.org/10.1016/j.envpol.2012.10.004.]
CDM Smith, 2018, Total maximum daily loads for total phosphorus, total suspended solids, and fecal coliform—Milwaukee River Basin, Wisconsin [Final Report]: Wisconsin Department of Natural Resources web page, accessed January 25, 2024, at https://dnr.wisconsin.gov/topic/TMDLs/Milwaukee/index.html.
Dewitz, J., and U.S. Geological Survey [USGS], 2021, National Land Cover Database (NLCD) 2019 Products (ver. 3.0, February 2024): U.S. Geological Survey data release, accessed March 2024 at https://doi.org/10.5066/P9KZCM54.
Diaz, R.J., and Rosenberg, R., 2008, Spreading dead zones and consequences for marine ecosystems: Science, v. 321, no. 5891, p. 926–929. [Also available at https://doi.org/10.1126/science.1156401.]
Durner, W., and Iden, S.C., 2021, The improved integral suspension pressure method (ISP+) for precise particle size analysis of soil and sedimentary materials: Soil and Tillage Research, v. 213, article 105086. [Also available at https://doi.org/10.1016/j.still.2021.105086.]
Evans, D.J., Johnes, P.J., and Lawrence, D.S., 2004, Physico-chemical controls on phosphorus cycling in two lowland streams. Part 2—The sediment phase: Science of the Total Environment, v. 329, nos. 1–3, p. 165–182. [Also available at https://doi.org/10.1016/j.scitotenv.2004.02.023.]
Filoso, S., and Palmer, M.A., 2011, Assessing stream restoration effectiveness at reducing nitrogen export to downstream waters: Ecological Applications, v. 21, no. 6, p. 1989–2006. [Also available at https://doi.org/10.1890/10-0854.1.]
Fitzpatrick, F.A., Blount, J.D., Kammel, L.E., Hoover, D.L., Gellis, A.C., and Eikenberry, B.C., 2019, Stream corridor sources of suspended sediment and phosphorus from an agricultural tributary to the Great Lakes in Proceedings of SEDHYD 2019, Reno, Nev., June 24–28, 2019: Reno Nev., SEDHYD, v. 4, p. 189–204, accessed January 25, 2024, at https://www.sedhyd.org/2019/proceedings/SEDHYD_Proceedings_2019_Volume4.pdf.
Fitzpatrick, F.A., and Peppler, M.C., 2010, Relation of urbanization to stream habitat and geomorphic characteristics in nine metropolitan areas of the United States: U.S. Geological Survey Scientific Investigations Report 2010–5056, 29 p., accessed March 2024 at https://doi.org/10.3133/sir20105056.
Froelich, P.N., 1988, Kinetic control of dissolved phosphate in natural rivers and estuaries—A primer on the phosphate buffer mechanism: Limnology and Oceanography, v. 33, no. 4, p. 649–668. [Also available at https://doi.org/10.4319/lo.1988.33.4part2.0649.]
Groffman, P.M., Holland, E.A., Myrold, D.D., Robertson, G.P., and Zou, X., 1999, Denitrification, in Robertson, G.P., Coleman, D.C., Bledsoe, C.S., and Sollins, P., eds., Standard methods for long-term ecological research: Oxford, Oxford University Press, p. 272–288. [Also available at https://doi.org/10.1093/oso/9780195120837.003.0014.]
Haggard, B.E., Smith, D.R., and Brye, K.R., 2007, Variations in stream water and sediment phosphorus among select Ozark catchments: Journal of Environmental Quality, v. 36, no. 6, p. 1725–1734. [Also available at https://doi.org/10.2134/jeq2006.0517.]
Hamilton, S.K., 2012, Biogeochemical time lags may delay responses of streams to ecological restoration: Freshwater Biology, v. 57, no. s1, no. S1, p. 43–57. [Also available at https://doi.org/10.1111/j.1365-2427.2011.02685.x.]
Hilton, J., O’Hare, M., Bowes, M.J., and Jones, J.I., 2006, How green is my river? A new paradigm of eutrophication in rivers: Science of the Total Environment, v. 365, nos. 1–3, p. 66–83. [Also available at https://doi.org/10.1016/j.scitotenv.2006.02.055.]
House, L.B., 1987, Simulation of unsteady flow in the Milwaukee Harbor Estuary at Milwaukee, Wisconsin: U.S. Geological Survey Water-Resources Investigations Report 86–4050, 25 p., accessed March 2024, at https://doi.org/10.3133/wri864050.
House, W.A., Jickells, T.D., Edwards, A.C., Praska, K.E., and Denison, F.H., 1998, Reactions of phosphorus with sediments in fresh and marine waters: Soil Use and Management, v. 14, no. s4, p. 139–146. [Also available at https://doi.org/10.1111/j.1475-2743.1998.tb00632.x.]
Inwood, S.E., Tank, J.L., and Bernot, M.J., 2005, Patterns of denitrification associated with land use in 9 midwestern headwater streams: Journal of the North American Benthological Society, v. 24, no. 2, p. 227–245. [Also available at https://doi.org/10.1899/04-032.1.]
Jarvie, H.P., Jürgens, M.D., Williams, R.J., Neal, C., Davies, J.J.L., Barrett, C., and White, J., 2005, Role of river bed sediments as sources and sinks of phosphorus across two major eutrophic UK river basins—The Hampshire Avon and Herefordshire Wye: Journal of Hydrology, v. 304, nos. 1–4, p. 51–74. [Also available at https://doi.org/10.1016/j.jhydrol.2004.10.002.]
Johnston, C.A., Bridgham, S.D., and Schubauer-Berigan, J.P., 2001, Nutrient dynamics in relation to geomorphology of riverine wetlands: Soil Science Society of America Journal, v. 65, no. 2, p. 557–577. [Also available at https://doi.org/10.2136/sssaj2001.652557x.]
Julian, J.P., and Gardner, R.H., 2014, Land cover effects on runoff patterns in eastern Piedmont (USA) watersheds: Hydrological Processes, v. 28, no. 3, p. 1525–1538. [Also available at https://doi.org/10.1002/hyp.9692.]
Kaushal, S.S., Groffman, P.M., Mayer, P.M., Striz, E., and Gold, A.J., 2008, Effects of stream restoration on denitrification in an urbanizing watershed: Ecological Applications, v. 18, no. 3, p. 789–804. [Also available at https://doi.org/10.1890/07-1159.1.]
Kleinman, P.J.A., 2017, The persistent environmental relevance of soil phosphorus sorption saturation: Current Pollution Reports, v. 3, no. 2, p. 141–150. [Also available at https://doi.org/10.1007/s40726-017-0058-4.]
Kreiling, R.M., Bartsch, L.A., Perner, P.M., Gierke, K.J., Williamson, T.N., Hood, J.M., Manning, N.F., and Johnson, L.T., 2024, Controls on in-stream nitrogen loss in western Lake Erie tributaries: Journal of Great Lakes Research, v. 50, no. 2, article 102284. [Also available at https://doi.org/10.1016/j.jglr.2024.102284.]
Kreiling, R.M., Bartsch, L.A., Perner, P.M., Hlavacek, E.J., and Christensen, V.G., 2021, Riparian forest cover modulates phosphorus storage and nitrogen cycling in agricultural stream sediments: Environmental Management, v. 68, no. 2, p. 279–293. [Also available at https://doi.org/10.1007/s00267-021-01484-9.]
Kreiling, R.M., Gierke, K.J., Perner, P.M., and Bartsch, L.A., 2025, Milwaukee Metropolitan Sewerage District nutrient connections project—In-stream nutrient cycling, 2022 data: U.S. Geological Survey data release, accessed January 2025 at https://doi.org/10.5066/P14KFDFC.
Kreiling, R.M., Perner, P.M., Breckner, K.J., Williamson, T.N., Bartsch, L.A., Hood, J.M., Manning, N.F., and Johnson, L.T., 2023, Watershed- and reach-scale drivers of phosphorus retention and release by streambed sediment in a western Lake Erie watershed during summer: Science of the Total Environment, v. 863, article 160804. [Also available at https://doi.org/10.1016/j.scitotenv.2022.160804.]
Kreiling, R.M., Richardson, W.B., Bartsch, L.A., Thoms, M.C., and Christensen, V.G., 2019a, Denitrification in the river network of a mixed land use watershed—Unpacking the complexities: Biogeochemistry, v. 143, no. 3, p. 327–346. [Also available at https://doi.org/10.1007/s10533-019-00565-6.]
Kreiling, R.M., Schubauer-Berigan, J.P., Richardson, W.B., Bartsch, L.A., Hughes, P.E., Cavanaugh, J.C., and Strauss, E.A., 2013, Wetland management reduces sediment and nutrient loading to the upper Mississippi River: Journal of Environmental Quality, v. 42, no. 2, p. 573–583. [Also available at https://doi.org/10.2134/jeq2012.0248.]
Kreiling, R.M., Thoms, M.C., Bartsch, L.A., Larson, J.H., and Christensen, V.G., 2020, Land use effects on sediment nutrient processes in a heavily modified watershed using structural equation models: Water Resources Research v. 56, no. 7, article e2019WR026655. [Also available at https://doi.org/10.1029/2019WR026655.]
Kreiling, R.M., Thoms, M.C., Bartsch, L.A., Richardson, W.B., and Christensen, V.G., 2019b, Complex response of sediment phosphorus to land use and management within a river network: Journal of Geophysical Research Biogeosciences, v. 124, no. 7, p. 1764–1780. [Also available at https://doi.org/10.1029/2019JG005171.]
Kusmer, A.S., Goyette, J.-O., MacDonald, G.K., Bennett, E.M., Maranger, R., and Withers, P.J.A., 2019, Watershed buffering of legacy phosphorus pressure at a regional scale—A comparison across space and time: Ecosystems (New York, N.Y.), v. 22, no. 1, p. 91–109. [Also available at https://doi.org/10.1007/s10021-018-0255-z.]
Lammers, R.W., and Bledsoe, B.P., 2017, What role does stream restoration play in nutrient management?: Critical Reviews in Environmental Science and Technology, v. 47, no. 6, p. 335–371. [Also available at https://doi.org/10.1080/10643389.2017.1318618.]
Larson, J.H., Trebitz, A.S., Steinman, A.D., Wiley, M.J., Mazur, M.C., Pebbles, V., Braun, H.A., and Seelbach, P.W., 2013, Great Lakes rivermouth ecosystems—Scientific synthesis and management implications: Journal of Great Lakes Research, v. 39, no. 3, p. 513–524. [Also available at https://doi.org/10.1016/j.jglr.2013.06.002.]
Lee, L., 2022, Nondetects and data analysis for environmental data package: R package version 1.6–1.1, accessed March 2024 at https://cran.r-project.org/package=NADA.
McDowell, R.W., Condron, L.M., Mahieu, N., Brookes, P.C., Poulton, P.R., and Sharpley, A.N., 2002, Analysis of potentially mobile phosphorus in arable soils using solid state nuclear magnetic resonance: Journal of Environmental Quality, v. 31, no. 2, p. 450–456. [Also available at https://doi.org/10.2134/jeq2002.4500.]
McMillan, S.K., and Noe, G.B., 2017, Increasing floodplain connectivity through urban stream restoration increases nutrient and sediment retention: Ecological Engineering, v. 108, pt. A, p. 284–295. [Also available at https://doi.org/10.1016/j.ecoleng.2017.08.006.]
Mehlich, A., 1984, Mehlich 3 soil test extractant—A modification of Mehlich 2 extractant: Communications in Soil Science and Plant Analysis, v. 15, no. 12, p. 1409–1416. [Also available at https://doi.org/10.1080/00103628409367568.]
Miller, T.R., Beversdorf, L.J., Weirich, C.A., and Bartlett, S.L., 2017, Cyanobacterial toxins of the Laurentian Great Lakes, their toxicological effects, and numerical limits in drinking water: Marine Drugs, v. 15, no. 6, article 160. [Also available at https://doi.org/10.3390/md15060160.]
Mulholland, P.J., Helton, A.M., Poole, G.C., Hall, R.O., Jr., Hamilton, S.K., Peterson, B.J., Tank, J.L., Ashkenas, L.R., Cooper, L.W., Dahm, C.N., Dodds, W.K., Findlay, S.E.G., Gregory, S.V., Grimm, N.B., Johnson, S.L., McDowell, W.H., Meyer, J.L., Valett, H.M., Webster, J.R., Arango, C.P., Beaulieu, J.J., Bernot, M.J., Burgin, A.J., Crenshaw, C.L., Johnson, L.T., Niederlehner, B.R., O’Brien, J.M., Potter, J.D., Shiebley, R.B., Sobota, D.J., and Thomas, S.M., 2008, Stream denitrification across biomes and its response to anthropogenic nitrate loading: Nature, v. 452, no. 7184, p. 202–205. [Also available at https://doi.org/10.1038/nature06686.]
Nair, V.D., 2014, Soil phosphorus saturation ratio for risk assessment in land use systems: Frontiers in Environmental Science, v. 2, no. 6. [Also available at https://doi.org/10.3389/fenvs.2014.00006.]
Noe, G.B., Hupp, C.R., and Rybicki, N.B., 2013, Hydrogeomorphology influences soil nitrogen and phosphorus mineralization in floodplain wetlands: Ecosystems (New York, N.Y.), v. 16, no. 1, p. 75–94, accessed March 2024 at https://doi.org/10.1007/s10021-012-9597-0.
Palta, M.M., Ehrenfeld, J.G., and Groffman, P.M., 2014, “Hotspots” and “hot moments” of denitrification in urban brownfield wetlands: Ecosystems (New York, N.Y.), v. 17, no. 7, p. 1121–1137. [Also available at https://doi.org/10.1007/s10021-014-9778-0.]
Pant, H.K., and Reddy, K.R., 2001, Phosphorus sorption characteristics of estuarine sediments under different redox conditions: Journal of Environmental Quality, v. 30, no. 4, p. 1474–1480. [Also available at https://doi.org/10.2134/jeq2001.3041474x.]
R Core Team, 2023, R—A language and environment for statistical computing: Vienna, Austria, R Foundation for Statistical Computing, accessed March 2024 at https://www.R-project.org/.
Records, R.M., Wohl, E., and Arabi, M., 2016, Phosphorus in the river corridor: Earth-Science Reviews, v. 158, p. 65–88. [Also available at https://doi.org/10.1016/j.earscirev.2016.04.010.]
Reddy, K.R., Kadlec, R.H., Flaig, E., and Gale, P.M., 1999, Phosphorus retention in streams and wetlands—A review: Critical Reviews in Environmental Science and Technology, v. 29, no. 1, p. 83–146. [Also available at https://doi.org/10.1080/10643389991259182.]
Richardson, W.B., Strauss, E.A., Bartsch, L.A., Monroe, E.M., Cavanaugh, J.C., Vingum, L., and Soballe, D.M., 2004, Denitrification in the Upper Mississippi River—Rates, controls, and contribution to nitrate flux: Canadian Journal of Fisheries and Aquatic Sciences, v. 61, no. 7, p. 1102–1112. [Also available at https://doi.org/10.1139/f04-062.]
Robertson, G.P., Coleman, D.C., Bledsoe, C.S., and Sollins, P., eds., 1999, Standard soil methods for long-term ecological research: Oxford, England, Oxford University Press, 462 p. [Also available at https://doi.org/10.1093/oso/9780195120837.001.0001.]
Sabo, R.D., Pickard, B., Lin, J., Washington, B., Clark, C.M., Compton, J.E., Pennino, M., Bierwagen, B., LeDuc, S.D., Carleton, J.N., Weber, M., Fry, M., Hill, R., Paulsen, S., Herlihy, A., and Stoddard, J.L., 2023, Comparing drivers of spatial variability in U.S. lake and stream phosphorus concentrations: Journal of Geophysical Research: Biogeosciences, v. 128, no. 8, article e2022JG007227. [Also available at https://doi.org/10.1029/2022JG007227.]
Scudder Eikenberry, B.C., Nott, M.A., Stewart, J.S., Sullivan, D.J., Alvarez, D.A., Bell, A.H., and Fitzpatrick, F.A., 2020, Ecological status of selected streams in the Milwaukee Metropolitan Sewerage District Planning Area of Wisconsin, 2004–13: U.S. Geological Survey Scientific Investigations Report 2020–5053, 84 p., accessed March 2024 at https://doi.org/10.3133/sir20205035.
Seitzinger, S., Harrison, J.A., Böhlke, J.K., Bouwman, A.F., Lowrance, R., Peterson, B., Tobias, C., and Van Drecht, G., 2006, Denitrification across landscapes and waterscapes—A synthesis: Ecological Applications, v. 16, no. 6, p. 2064–2090. [Also available at https://doi.org/10.1890/1051-0761(2006)016[2064:DALAWA]2.0.CO;2.]
Seitzinger, S.P., Nielsen, L.P., Caffrey, J., and Christensen, P.B., 1993, Denitrification measurements in aquatic sediments—A comparison of three methods: Biogeochemistry, v. 23, no. 3, p. 147–167. [Also available at https://doi.org/10.1007/BF00023750.]
Simpson, Z.P., McDowell, R.W., Condron, L.M., McDaniel, M.D., Jarvie, H.P., and Abell, J.M., 2021, Sediment phosphorus buffering in streams at baseflow—A meta-analysis: Journal of Environmental Quality, v. 50, no. 2, p. 287–311. [Also available at https://doi.org/10.1002/jeq2.20202.]
Sims, J.T., Maguire, R.O., Leytem, A.B., Gartley, K.L., and Pautler, M.C., 2002, Evaluation of Mehlich 3 as an agri-environmental soil phosphorus test for the Mid-Atlantic United States of America: Soil Science Society of America Journal, v. 66, p. 2016–2032 [Also available at https://doi.org/10.2136/sssaj2002.2016.]
Southeastern Wisconsin Regional Planning Commission, 2007, Water quality conditions and sources of pollution in the Greater Milwaukee watersheds—Part Two of Three: Southeastern Wisconsin Regional Planning Commission Technical Report 39, prepared by Southeastern Regional Planning Commission, 1,117 p., accessed March 2024 at https://www.sewrpc.org/SEWRPCFiles/Publications/TechRep/tr-039-part-02-water-quality-greater-mke-watersheds.pdf.
Stefaniak, O.M., Corsi, S.R., Rutter, T.D., and Failey, G.G., 2023, Airport deicers—An unrecognized source of phosphorus loading in receiving waters: Environmental Science & Technology, v. 57, no. 44, p. 17051–17060. [Also available at https://doi.org/10.1021/acs.est.3c03417.]
Strauss, E.A., Mitchell, N.L., and Lamberti, G.A., 2002, Factors regulating nitrification in aquatic sediments—Effects of organic carbon, nitrogen availability, and pH: Canadian Journal of Fisheries and Aquatic Sciences, v. 59, no. 3, p. 554–563. [Also available at https://doi.org/10.1139/f02-032.]
Tellier, J.M., Kalejs, N.I., Leonhardt, B.S., Cannon, D., Höök, T.O., and Collingsworth, P.D., 2022, Widespread prevalence of hypoxia and the classification of hypoxic conditions in the Laurentian Great Lakes: Journal of Great Lakes Research, v. 48, no. 1, p. 13–23. [Also available at https://doi.org/10.1016/j.jglr.2021.11.004.]
Trentman, M.T., Tank, J.L., Braund, D., and Entrekin, S.A., 2021, Agricultural layering explains variation in sediment P dynamics in streams draining two distinct agricultural basins: Aquatic Sciences, v. 83, no. 7, article 7, 11 p., accessed March 2024 at https://doi.org/10.1007/s00027-020-00764-6.
Tschikof, M., Gericke, A., Venohr, M., Weigelhofer, G., Bondar-Kunze, E., Kaden, U.S., and Hein, T., 2022, The potential of large floodplains to remove nitrate in river basins—The Danube case: Science of the Total Environment, v. 843, article 156879, 11 p. [Also available at https://doi.org/10.1016/j.scitotenv.2022.156879.]
U.S. Geological Survey, 2025, USGS water data for the Nation: U.S. Geological Survey National Water Information System database, accessed February 19, 2025, at https://doi.org/10.5066/F7P55KJN.
Waters, E.R., Morse, J.L., Bettez, N.D., and Groffman, P.M., 2014, Differential carbon and nitrogen controls of denitrification in riparian zones and streams along an urban to exurban gradient: Journal of Environmental Quality, v. 43, no. 3, p. 955–963. [Also available at https://doi.org/10.2134/jeq2013.12.0504.]
Williamson, T.N., Dobrowolski, E.G., Gellis, A.C., Sabitov, T., and Gorman Sanisaca, L., 2020, Monthly suspended-sediment apportionment for a western Lake Erie agricultural tributary: Journal of Great Lakes Research, v. 46, no. 5, p. 1307–1320. [Also available at https://doi.org/10.1016/j.jglr.2020.06.011.]
Withers, P.J.A., and Jarvie, H.P., 2008, Delivery and cycling of phosphorus in rivers—A review: Science of the Total Environment, v. 400, nos. 1–3, p. 379–395. [Also available at https://doi.org/10.1016/j.scitotenv.2008.08.002.]
Wollheim, W.M., Bernal, S., Burns, D.A., Czuba, J.A., Driscoll, C.T., Hansen, A.T., Hensley, R.T., Hosen, J.D., Inamdar, S., Kaushal, S.S., Koenig, L.E., Lu, Y.H., Marzadri, A., Raymond, P.A., Scott, D., Stewart, R.J., Vidon, P.G., and Wohl, E., 2018, River network saturation concept—Factors influencing the balance of biogeochemical supply and demand of river networks: Biogeochemistry, v. 141, no. 3, p. 503–521. [Also available at https://doi.org/10.1007/s10533-018-0488-0.]
Wurtsbaugh, W.A., Paerl, H.W., and Dodds, W.K., 2019, Nutrients, eutrophication, and harmful algal blooms along the freshwater to marine continuum: WIREs Water, v. 6, no. 5, article e1373, 27 p., accessed March 2024 at https://doi.org/10.1002/wat2.1373.
Appendix 1. Assessment of Sediment Nutrient Dynamics at Each Site
Table 1.1.
Assessment at each site of the potential nitrogen removal and phosphorus storage capacity in the streambed sediment and the potential for release of streambed sediment bioavailable nutrients to stream water. The criteria for ranking of poor, fair, and good are listed in table 2.[Table is available for download as a comma separated values (csv) format file at https://doi.org/10.3133/sir20255012]
| Site number (table 1) | Site name | Nitrogen | Phosphorus | |||||
|---|---|---|---|---|---|---|---|---|
| Bioavailable nitrogen | Nitrification | Denitrification | Bioavailable phosphorus | Equilibrium phosphorus concentration | Phosphate exchange potential | Phosphorus saturation ratio | ||
| 1 | Milwaukee River near Cedarburg, Wisconsin | Fair2 | Good1 | Good1 | Fair2 | Fair2 | Good1 | Fair2 |
| 2 | Lincoln Creek at 47th Street at Milwaukee, Wisconsin | Fair2 | Fair2 | Good1 | Fair2 | Good1 | Good1 | Fair2 |
| 3 | Milwaukee River at Milwaukee, Wisconsin | Fair2 | Good1 | Good1 | Poor3 | Fair2 | Good1 | Fair2 |
| 4 | Willow Creek at Maple Road near Germantown, Wisconsin | Poor3 | Good1 | Good1 | Poor3 | Good1 | Good1 | Poor3 |
| 5 | Menomonee River at Menomonee Falls, Wisconsin | Good1 | Poor3 | Fair2 | Fair2 | Poor3 | Poor3 | Fair2 |
| 6 | Little Menomonee River near Freistadt, Wisconsin | Good1 | Good1 | Good1 | Fair2 | Good1 | Good1 | Fair2 |
| 7 | Little Menomonee River at Milwaukee, Wisconsin | Poor3 | Good1 | Good1 | Poor3 | Good1 | Good1 | Fair2 |
| 8 | Menomonee River at North Avenue at Wauwatosa, Wisconsin | Good1 | Fair2 | Fair2 | Good1 | Fair2 | Fair2 | Good1 |
| 9 | Underwood Creek at Wall Street at Elm Grove, Wisconsin | Good1 | Poor3 | Good1 | Fair2 | Poor3 | Poor3 | Good1 |
| 10 | Underwood Creek at Wauwatosa, Wisconsin | Good1 | Poor3 | Fair2 | Good1 | Good1 | Fair2 | Good1 |
| 11 | Underwood Creek at Wauwatosa, Wisconsin | Good1 | Good1 | Good1 | Fair2 | Good1 | Good1 | Good1 |
| 12 | Menomonee River at Hoyt Park at Wauwatosa, Wisconsin | Good1 | Good1 | Fair2 | Fair2 | Poor3 | Poor3 | Fair2 |
| 13 | Honey Creek near Portland Avenue at Wauwatosa, Wisconsin | Good1 | Poor3 | Good1 | Good1 | Poor3 | Poor3 | Fair2 |
| 14 | Honey Creek at Wauwatosa, Wisconsin | Good1 | Poor3 | Fair2 | Good1 | Fair2 | Poor3 | Good1 |
| 15 | Honey Creek at Wauwatosa, Wisconsin | Good1 | Poor3 | Fair2 | Good1 | Fair2 | Poor3 | Good1 |
| 16 | Menomonee River at Wauwatosa, Wisconsin | Good1 | Fair2 | Good1 | Fair2 | Good1 | Good1 | Good1 |
| 17 | Kinnickinnic River at South 11th Street at Milwaukee, Wisconsin | Good1 | Poor3 | Fair2 | Fair2 | Poor3 | Poor3 | Good1 |
| 18 | Kinnickinnic River at 6th Street at Milwaukee, Wisconsin | Good1 | Good1 | Good1 | Good1 | Fair2 | Poor3 | Fair2 |
| 19 | Kinnickinnic River at 6th Street at Milwaukee, Wisconsin | Poor3 | Fair2 | Good1 | Poor3 | Good (1) | Good1 | Good1 |
| 20 | Oak Creek at South Milwaukee, Wisconsin | Poor3 | Good1 | Good1 | Fair2 | Good1 | Good1 | Good1 |
| 21 | Root River at Grange Avenue at Greenfield, Wisconsin | Poor3 | Good1 | Good1 | Fair2 | Good1 | Good1 | Good1 |
| 22 | Root River near Franklin, Wisconsin | Fair2 | Good1 | Good1 | Fair2 | Good1 | Good1 | Good1 |
| 23 | Scuppernong River near Palmyra, Wisconsin | Fair2 | Fair2 | Good1 | Fair2 | Good1 | Poor3 | Good1 |
| 24 | Fox River at Fox River Parkway at Waukesha, Wisconsin | Poor3 | Good1 | Good1 | Poor3 | Fair2 | Poor3 | Fair2 |
| 25 | Pebble Creek at mouth near Waukesha, Wisconsin | Poor3 | Good1 | Good1 | Poor3 | Good1 | Poor3 | Poor3 |
| 26 | Mukwonago River at Mukwonago, Wisconsin | Good1 | Poor3 | Fair2 | Fair2 | Poor3 | Poor3 | Poor3 |
| 27 | Jewel Creek at Muskego, Wisconsin | Poor3 | Good1 | Good1 | Poor3 | Good1 | Fair2 | Good1 |
| 28 | Milwaukee River at mouth at Milwaukee, Wisconsin | Poor3 | Good1 | Good1 | Poor3 | Fair2 | Good1 | Poor3 |
| 29 | Milwaukee River downstream East Cherry Street at Milwaukee, Wisconsin | Fair2 | Fair2 | Fair2 | Fair2 | Fair2 | Good1 | Good1 |
| 30 | Menomonee River at 16th Street at Milwaukee, Wisconsin | Poor3 | Good1 | Good1 | Poor3 | Good1 | Good1 | Good1 |
| 31 | Kinnickinnic River at South 1st Street at Milwaukee, Wisconsin | Poor3 | Good1 | Good1 | Poor3 | Good1 | Fair2 | Good1 |
| 32 | Cedar Creek near Cedarburg, Wisconsin | Poor3 | Good1 | Good1 | Poor3 | Good1 | Good1 | Poor3 |
Conversion Factors
International System of Units to U.S. customary units
Temperature in degrees Celsius (°C) may be converted to degrees Fahrenheit (°F) as follows:
°F = (1.8 × °C) + 32.
Supplemental Information
Concentrations of chemical constituents in water are in either milligrams per liter (mg/L) or micrograms per liter (µg/L).
Abbreviations
Al
aluminum
C
carbon
Ca
calcium
DEA
denitrification enzyme activity
DEN
potential denitrification rates
EPC0
equilibrium phosphorus concentration
Fe
iron
KCl
potassium chloride
M3P
Mehlich 3 extractable phosphorus
MgCl2
magnesium chloride
MMSD
Milwaukee Metropolitan Sewerage District
N
nitrogen
NH4
ammonium
NO3
nitrate
ρ
Spearman rank order correlation
p
probability value
P
phosphorus
PEP
phosphate exchange potential
PSR
phosphorus saturation ratio
SRP
soluble reactive phosphorus
USGS
U.S. Geological Survey
For more information about this publication, contact:
Director, USGS Upper Midwest Environmental Sciences Center
2630 Fanta Reed Road
La Crosse, Wisconsin 54603
For additional information, visit: https://www.usgs.gov/centers/umesc
Publishing support provided by the
Rolla and Reston Publishing Service Centers
Disclaimers
Any use of trade, firm, or product names is for descriptive purposes only and does not imply endorsement by the U.S. Government.
Although this information product, for the most part, is in the public domain, it also may contain copyrighted materials as noted in the text. Permission to reproduce copyrighted items must be secured from the copyright owner.
Suggested Citation
Kreiling, R.M., Bartsch, L.A., Gierke, K.J., Perner, P.M., Fitzpatrick, F.A., and Olds, H.T., 2025, Sediment nutrient dynamics in selected Milwaukee metropolitan area streams, Wisconsin, 2022: U.S. Geological Survey Scientific Investigations Report 2025–5012, 34 p., https://doi.org/10.3133/sir20255012.
ISSN: 2328-0328 (online)
Study Area
| Publication type | Report |
|---|---|
| Publication Subtype | USGS Numbered Series |
| Title | Sediment nutrient dynamics in selected Milwaukee metropolitan area streams, Wisconsin, 2022 |
| Series title | Scientific Investigations Report |
| Series number | 2025-5012 |
| DOI | 10.3133/sir20255012 |
| Publication Date | April 07, 2025 |
| Year Published | 2025 |
| Language | English |
| Publisher | U.S. Geological Survey |
| Publisher location | Reston, VA |
| Contributing office(s) | Upper Midwest Water Science Center |
| Description | Report: vi, 34 p.; Data Release; Dataset |
| Country | United States |
| State | Wisconsin |
| City | Milwaukee |
| Online Only (Y/N) | Y |
| Additional Online Files (Y/N) | N |