

Flood of July 2023 in Vermont
Links
- Document: Report (10.2 MB pdf) , HTML , XML
- Application Site: USGS web page - Vermont high-water mark data viewer
- Data Releases:
- USGS data release - Vermont Flood of July 2023 Data
- USGS data release - Peak Streamflow, Peak Stage, and Annual Exceedance Probability Data of the July 2023 Flood in Vermont, with attached data tables 1.1 to 1.4 in Vermont_Flood_2023_tables.xlsx
- Version History: Version History (879 B txt)
- NGMDB Index Page: National Geologic Map Database Index Page (html)
- Download citation as: RIS | Dublin Core
Acknowledgments
The authors would like to thank the Federal Emergency Management Agency for the cooperative funding with the U.S. Geological Survey to complete this study. The authors would also like to acknowledge the National Oceanic and Atmospheric Administration and the National Weather Service for providing data included in the report.
The authors would also like to extend our thanks to U.S. Geological Survey staff with the New England Water Science Center who were involved in collecting and analyzing these data for this report. This report would not be possible without the dedication and tireless effort produced by these staff members during and after the flood to collect the critical information that went into this report.
Abstract
A major storm caused catastrophic flooding in many parts of Vermont on July 9–12, 2023, resulting in millions of dollars in damages. The high amount of rainfall caused several rivers to peak at record levels, in some cases exceeding records set during Tropical Storm Irene in 2011. The U.S. Geological Survey, in cooperation with the Federal Emergency Management Agency, collected and analyzed data that characterized the flood in Vermont. The data collected included peak water-surface elevations, taken from high-water marks at bridges, dams, and roads, and peak streamflow and annual exceedance probabilities (AEPs) at streamgages, lake gages, and selected ungaged locations. At 11 of the 80 streamgages with 12 to 94 years of record, the July 2023 peak streamflow was the peak of record. Ten streamgages recorded a peak streamflow with an AEP of less than or equal to 1 percent (greater than or equal to a 100-year recurrence interval).
The July 2023 flood affected many of the same communities as the historical flood caused by Tropical Storm Irene in 2011. Twenty of the 45 continuous-recording streamgages running during both events recorded greater peak streamflows during the July 2023 flood than during Tropical Storm Irene in 2011. Four of the 11 U.S. Geological Survey streamgages with period-of-record maximum peak streamflows observed during the July 2023 flood had previously recorded their maximum period-of-record peak streamflows during Tropical Storm Irene. There were 17 rivers in Vermont that were surveyed for high-water marks during both Tropical Storm Irene and the July 2023 flood. On those 17 rivers, a total of 103 sites contained surveyed high-water marks for both events. Thirty-two of these sites had higher surveyed elevations for the July 2023 flood than Tropical Storm Irene, including Black River in Newport, Black River in Springfield, Jewell Brook, Middlebury River, Missisquoi River, Ottauquechee River, Otter Creek, Wells River, Whetstone Brook, and Winooski River. Peak water-surface elevations were not collected on the Lamoille River in 2011.
Federal Emergency Management Agency flood insurance studies were evaluated in the context of the July 2023 flood. Peak streamflows at streamgages and nearby locations were assessed to determine the influence of the July 2023 flood on the AEPs used in past studies. Overall, 21 of 26 streamflow-computation locations in the flood insurance studies had more than a 10 percent difference in the 1-percent AEP streamflow. A hydraulic evaluation of surveyed water-surface elevations following the July 2023 flood was compared with the AEP profiles from past studies. Four of the 10 streamgages analyzed had poor alignment between the AEPs of the observed streamflows and the AEPs of the observed peak water-surface elevations as computed from flood insurance studies.
Plain Language Summary
A major storm caused catastrophic flooding in many parts of Vermont on July 9–12, 2023, resulting in millions of dollars in damages. The high amount of rainfall caused several rivers to peak at record levels, in some cases surpassing records set during Tropical Storm Irene in 2011. The U.S. Geological Survey, in cooperation with the Federal Emergency Management Agency, collected and analyzed data on peak water-surface elevations, peak streamflow, and annual exceedance probabilities at streamgages, lake gages, and selected ungaged locations. Of the 80 streamgages with records ranging from 12 to 94 years, 11 streamgages recorded peak streamflows during the July 2023 flood that were the highest on record, whereas 10 streamgages had peak streamflows with a recurrence interval of 100 years or more. The July 2023 flood affected many of the same communities as Tropical Storm Irene in 2011, but 20 of the 45 monitored streamgages recorded higher peak flows in the July 2023 flood. Seventeen rivers were surveyed for high-water marks during both Tropical Storm Irene and the July 2023 flood, and 32 of the 103 sites had higher water levels during the July 2023 flood compared with Tropical Storm Irene. Flood insurance studies by the Federal Emergency Management Agency were evaluated against the July 2023 flood data. Twenty-one of the 26 locations analyzed had more than a 10 percent difference in the 1-percent annual exceedance probability streamflow.
Introduction
Prolonged heavy rainfall on July 9–11, 2023, resulted in peak flooding along rivers across Vermont on July 9–12. The flooding caused substantial damage to public and personal property. On July 11, 2023, President Joseph R. Biden, Jr., declared a state of emergency in Vermont, authorizing the Department of Homeland Security and the Federal Emergency Management Agency (FEMA) to provide disaster assistance (White House, 2023). Following the flooding, the Federal disaster declaration for the State resulted in more than $54.7 million in Federal assistance to aid in flood recovery (FEMA, 2024). All 14 Vermont counties were designated to receive public assistance, and residents of nine counties (Caledonia, Chittenden, Lamoille, Orange, Orleans, Rutland, Washington, Windham, and Windsor Counties) were eligible to apply for individual assistance. Major flooding from the Winooski River occurred in the State capital of Montpelier. In response to the Federal disaster declaration, the U.S. Geological Survey (USGS), in cooperation with FEMA, initiated a study to document the July 2023 flood.
Major floods have been documented in Vermont in 1927, 1936, 1938, 1973, 1996, 1998, 2002, 2011, and 2019. Floods in Vermont are typically caused by intense precipitation, springtime storms combined with snowmelt, tropical storms, and ice jams. The great flood of November 1927 is the largest in recorded history and still has the peak of record at eight USGS streamgages with 90 to 108 years of record. In response to extensive damage caused by the floods of 1927, 1936, and 1938, flood-control dams and reservoirs were built by the U.S. Army Corps of Engineers in the Winooski River and Connecticut River Basins to decrease damages caused by the flooding of major rivers. However, flooding has continued to cause catastrophic damage. Through water year 2023, the flood of June 1973 holds the peak of record at 10 USGS streamgages with 30 to 94 years of record, and Tropical Storm Irene in 2011 holds the peak of record at 25 USGS streamgages in Vermont with 12 to 110 years of record. Peak water-surface elevations, streamflow, and annual exceedance probabilities (AEPs) from Tropical Storm Irene are documented in Olson and Bent (2013) and Medalie and Olson (2013). Currently [2025], the July 2023 flood has the peak of record at 11 streamgages with 12 to 96 years of record, none of which were in operation in 1927 (Olson and Bent, 2013).
The documentation of peak water-surface elevations and peak streamflow magnitudes and frequencies associated with extreme flood events provides water-resource managers and emergency management professionals with essential data for delineating floodplains necessary for accurate land-use planning and flood-mitigation decisions. These data are important for calibrating models used to establish and assess 1- and 0.2-percent AEP floodplain limits and water-surface profiles. The magnitude and frequency of flooding are critical engineering information used by road engineers and local public works officials to accurately size new bridges and culverts. Flood analyses guide improvements to emergency-action plans for affected communities. Updated flood documentation in a disaster area is crucial for developing mitigation measures to prevent future flood losses and appropriately allocating disaster-assistance funding when the next extreme event occurs.
In the past, flood frequencies have been expressed as recurrence intervals for selected flood quantiles, such as a 100-year flood. Recurrence-interval terminology is sometimes interpreted to imply that there is a set time interval between floods of a particular magnitude (for example, that a 100-year flood will happen every 100 years) when, in fact, floods are random processes that are best understood by using probabilistic terms. The USGS now uses AEPs because, as described in Lombard (2010), AEPs convey “the probability, or odds, of a flood of a given magnitude being equaled or exceeded in any given year. The exceedance probability is equivalent to the reciprocal of the recurrence interval and is expressed as a percent. For example, a flood with an AEP of 1 percent corresponds to a 100-year flood. This does not imply that flooding will happen at regular intervals.” Two streamflows with AEPs of 1 percent could occur in the same year, in 2 consecutive years, or separated by more than 100 years.
Purpose and Scope
The purpose of this report is to document and study the July 9–12, 2023, flood in Vermont. The flood was widespread across Vermont and affected many of the same communities as Tropical Storm Irene in 2011. This report provides a summary of peak water-surface elevations and the magnitude and AEP of peak streamflows at 80 USGS streamgages and 6 ungaged locations, as well as the peak water-surface elevations at 2 lake gages. These data are used to put the flood into historical context in comparison to Tropical Storm Irene and to evaluate the accuracy of the hydrology and hydraulic models of published FEMA flood insurance studies.
Study Area
The study area encompasses the State of Vermont, from the Canadian border to the borders of New York, Massachusetts, and New Hampshire (fig. 1). The study area is largely forested with rolling hills. The more mountainous terrain of the Appalachian Mountains runs through much of the center of the State. Land-surface elevations range from approximately 100 feet (ft) along the shoreline of Lake Champlain and 200 ft along the Connecticut River at the southernmost end of the State to greater than 3,000 ft at numerous mountain peaks. The climate of the region is humid, and precipitation is distributed fairly evenly across the region, with statewide averages of about 42 inches per year. The annual mean temperature is 41 degrees Fahrenheit (National Oceanic and Atmospheric Administration, 2023a).
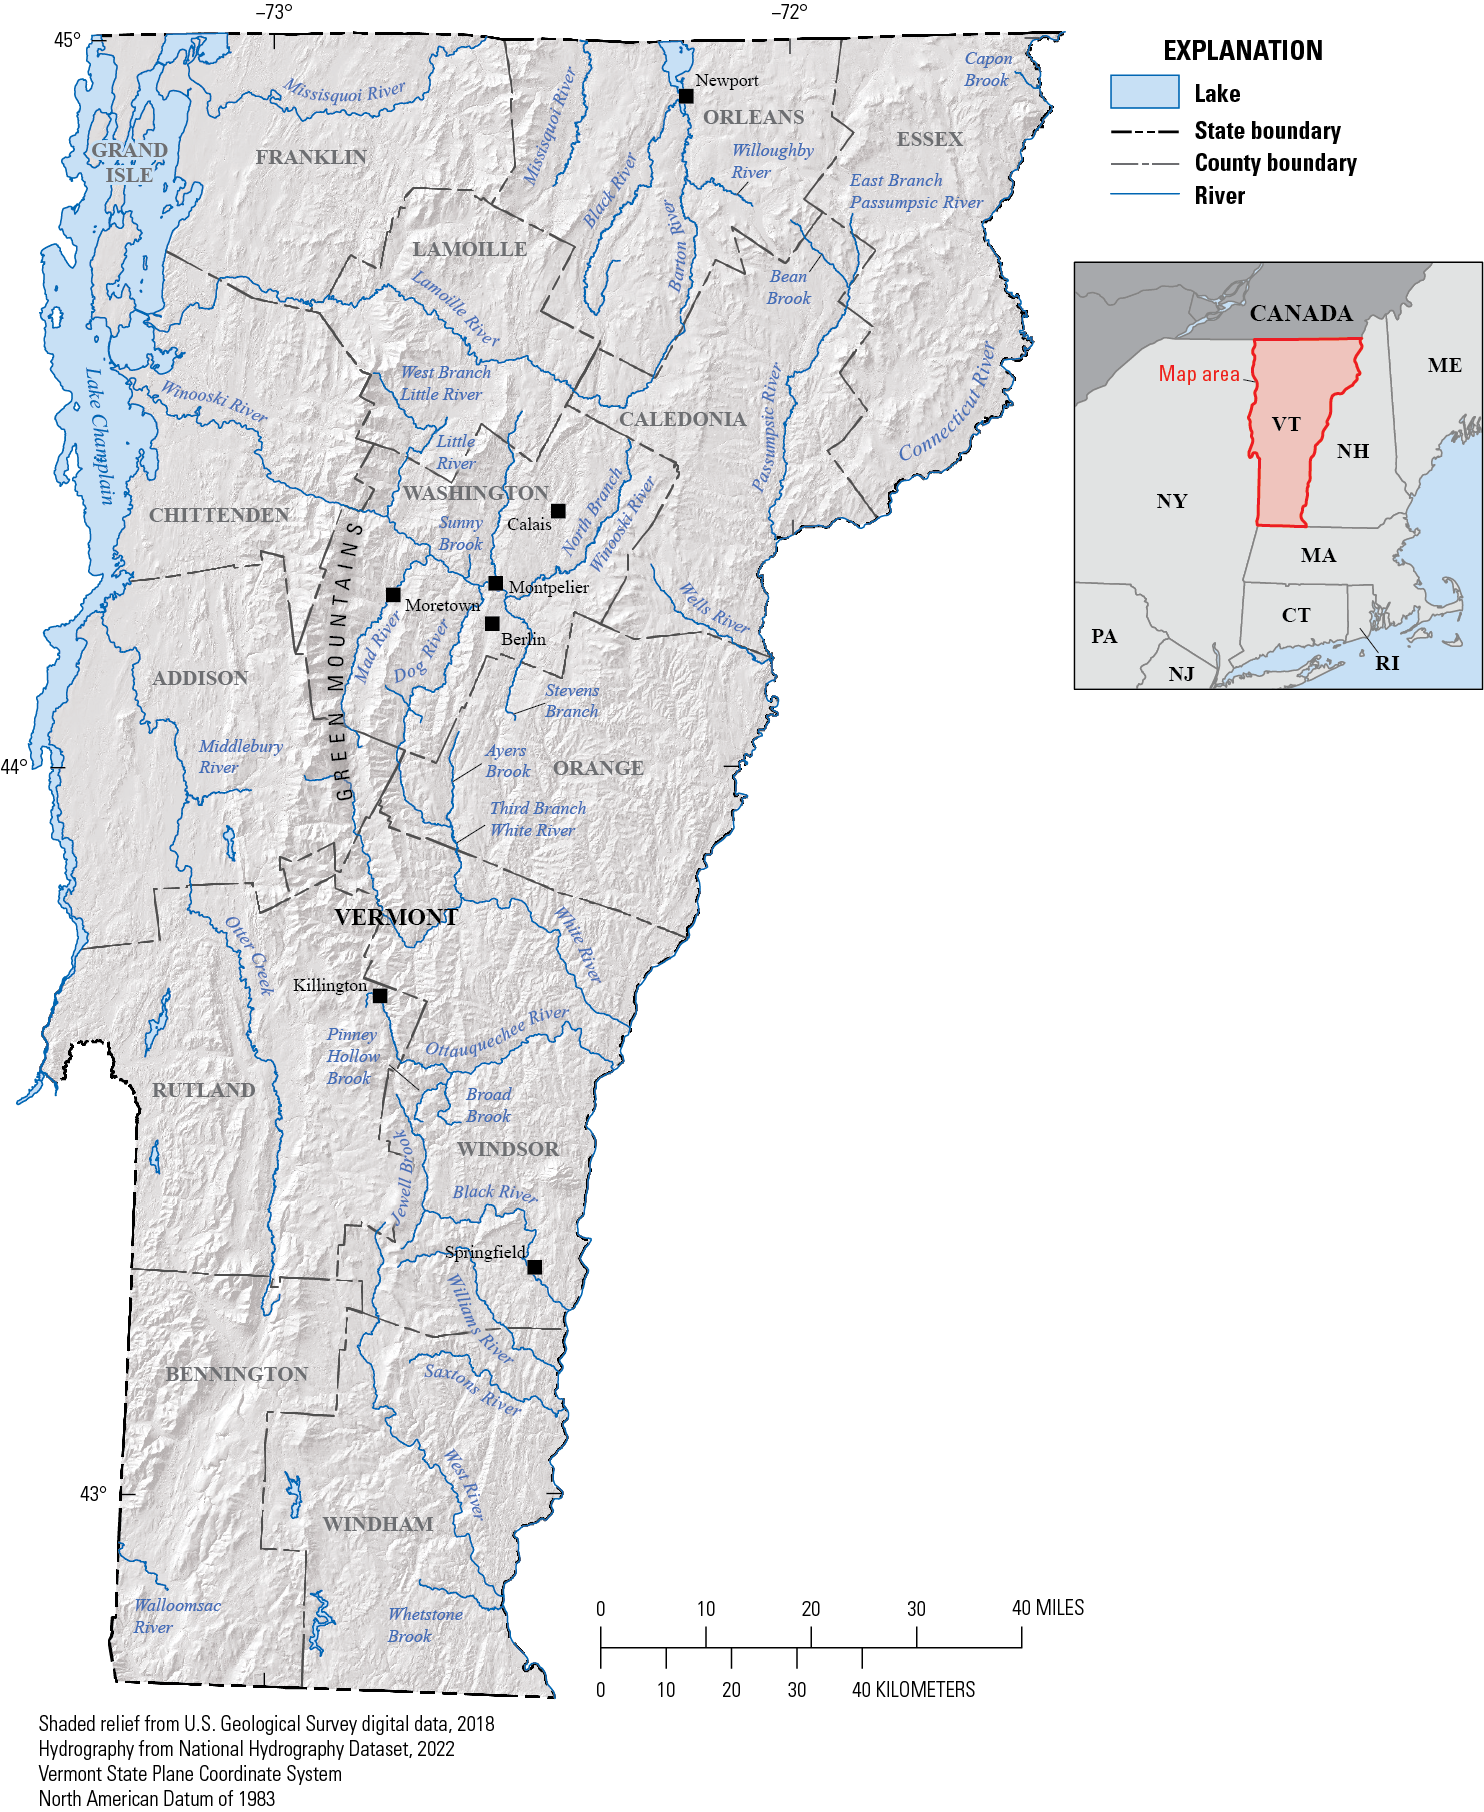
Map showing rivers and lakes in Vermont.
Antecedent Conditions
The July 9–12, 2023, flood resulted from a combination of a storm with extreme rainfall that followed above-average rainfall in June and early July, abnormally high antecedent soil moisture, and several flash floods in central and southern Vermont (Banacos, 2023). Three days before the storm, on July 7, flash flooding near Killington, Vermont, in Rutland County, where local rainfall totals exceeded 4 inches (in.), caused damage to several miles of roads (Banacos, 2023). On July 8, soil moisture was above the 98th percentile, at 2 in. (reported as 5 centimeters of available water per foot of soil) along the spine of the Green Mountains (National Soil Moisture Network, 2023).
Streamflows in Vermont were above normal (daily streamflow between the 25th and 75th percentiles are considered normal) before the July 9–12 storm. Daily streamflows at the USGS streamgages at Lamoille River at Johnson, Vt., (station 04292000); Winooski River at Montpelier, Vt., (station 04286000); and Williams River near Rockingham, Vt., (station 01153550) during July 1–9, 2023, were representative of antecedent flow conditions in the heavily flooded areas before the July 9–12 flood (fig. 2; USGS, 2024b). Daily streamflow at these three streamgages was above or near the 90th percentile beginning on July 7 and continuing throughout the storm.
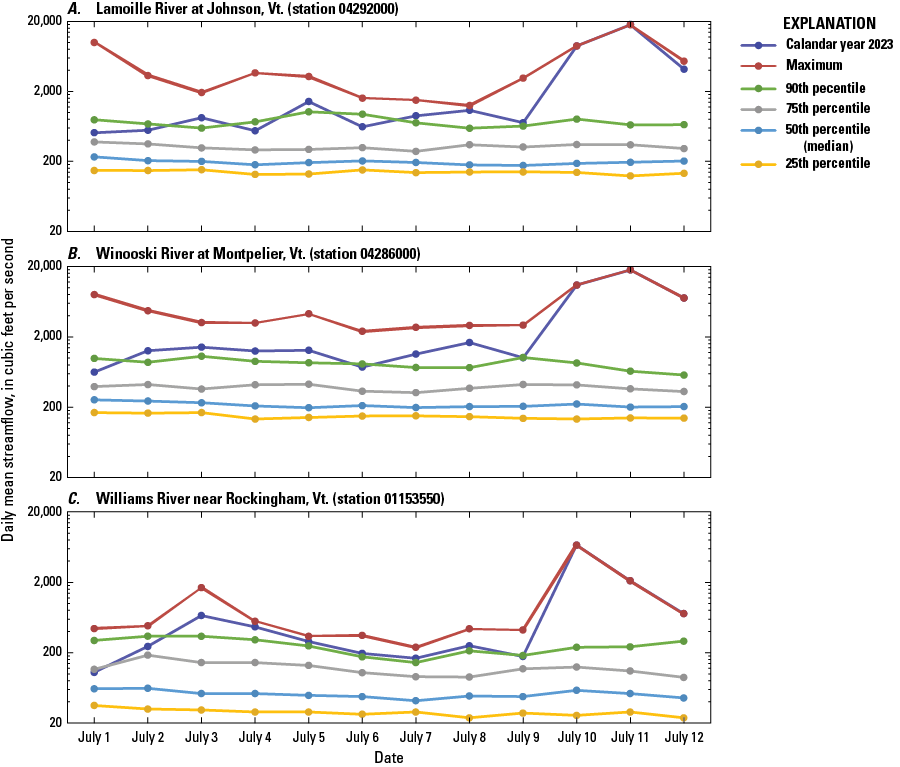
Graphs showing the streamflow for calendar year 2023 and the 25th, 50th (median), 75th, 90th percentiles, and maximum daily mean streamflow from July 1–12, 2023, for the A, Lamoille River at Johnson, Vt. (station 0429200); B, Williams River near Rockingham (station 01153550); and C, Winooski River at Montpelier, Vt. (station 04286000), U.S. Geological Survey streamgages. Data are from U.S. Geological Survey (2024b).
Storm Characteristics
July 2023 was the second wettest month on record (from 1985 to 2023) throughout Vermont. The average total rainfall was 9.72 in. across the State, with a deviation of 5.91 in. from the monthly mean (National Oceanic and Atmospheric Administration, 2023a). Heavy precipitation fell along the spine of the Green Mountains in Vermont from July 9 to 11, 2023, with most of the rain falling on July 10 and 11; the 48-hour rainfall throughout the State primarily ranged from about 3 to 9 in. (fig. 3). Heavy precipitation along the spine of the Green Mountains accumulated the greatest totals (Banacos, 2023), with locations in Washington and Windsor Counties receiving more than 9 in. (National Oceanic and Atmospheric Administration, 2023b). The record 48-hour total of 9.2 in. was recorded in Calais, Vt., north of Montpelier in Washington County (Banacos, 2023). The airport in Montpelier recorded the greatest calendar day rainfall since recording began in 1948, at 5.28 in., beating the previous record of 5.27 in. set by Tropical Storm Irene.
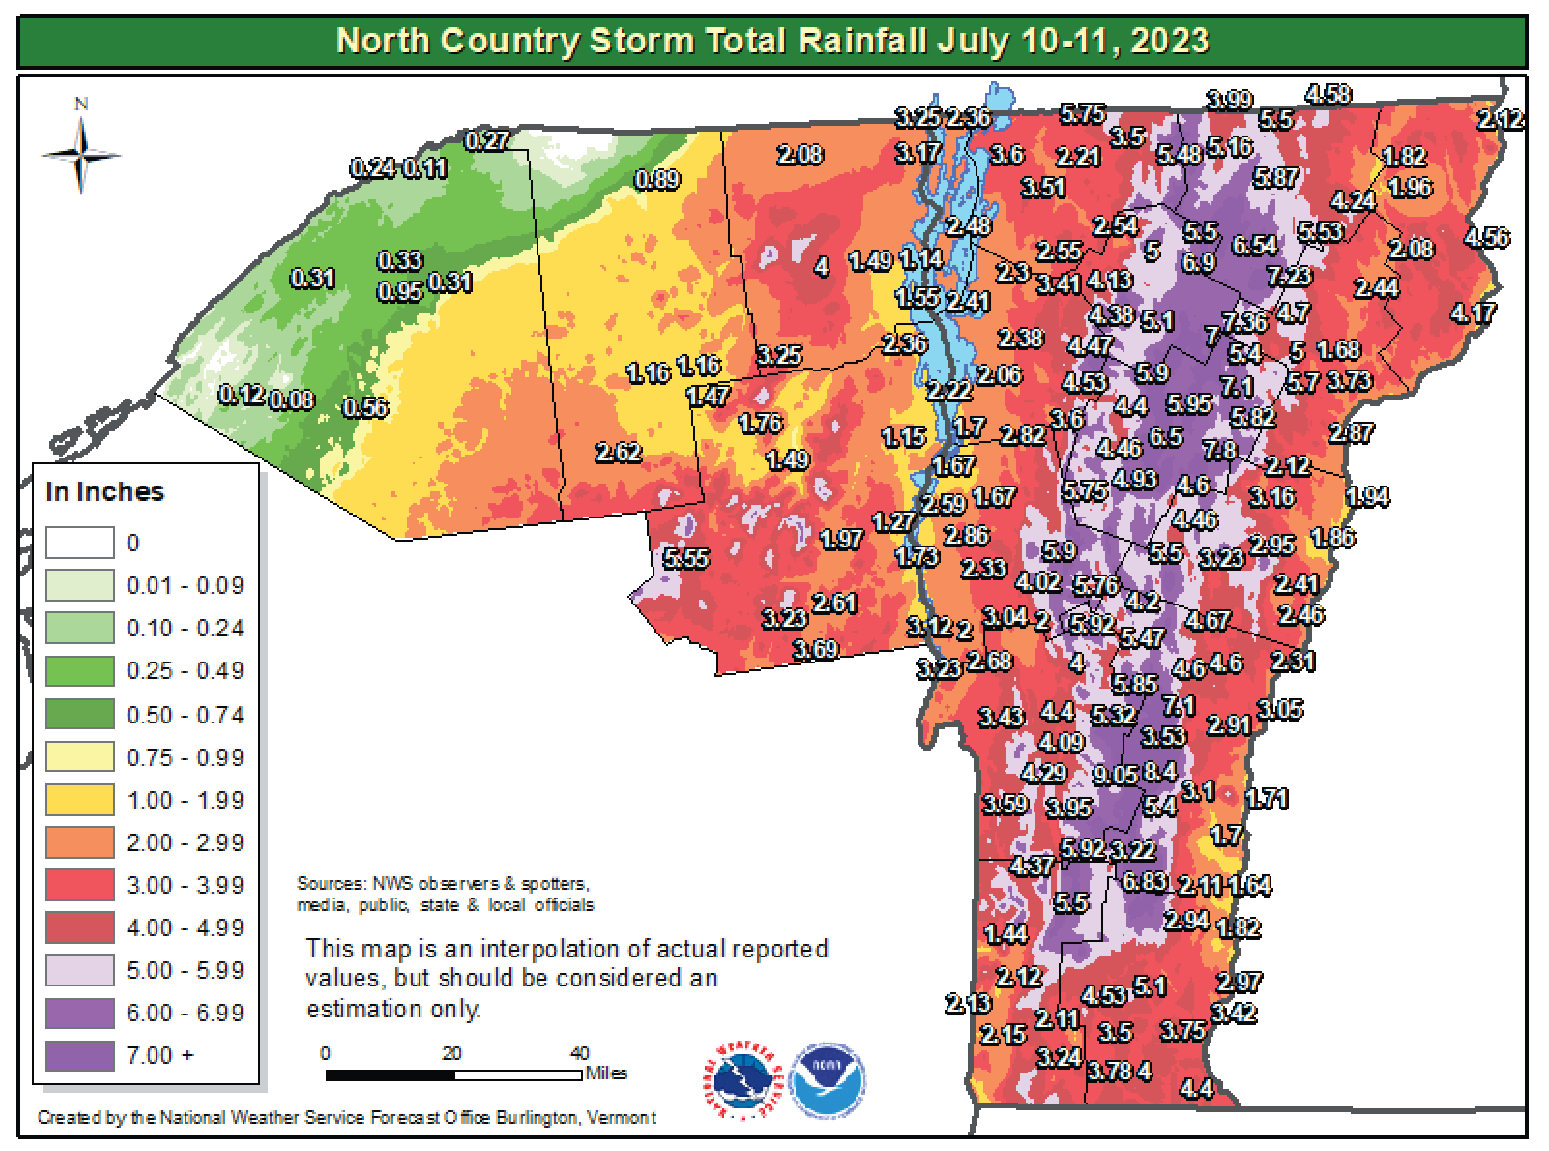
Map from the National Oceanic and Atmospheric Administration webpage showing the 48-hour rainfall totals (in inches) from July 10–11, when most of the rainfall occurred, in Vermont and northern New York; from Banacos (2023).
The 48-hour rainfall totals recorded during the storm were provided by the National Weather Service (National Oceanic and Atmospheric Administration, 2023b). Multiple organizations and individuals recorded these rainfall totals. In some of the hardest-hit towns in Vermont, 48-hour totals were evaluated to determine the annual recurrence interval using the North Regional Climate Center extreme precipitation tables (Northeast Regional Climate Center and Natural Resources Conservation Service, 2024).
The recurrence interval is the average period between rainfalls that is greater than or equal to a specified magnitude. For example, a 100-year rainfall is the rainfall amount that would be equaled or exceeded, on average, once every 100 years. This means there is a 1 percent chance that rainfall of this magnitude will be equaled or exceeded in any given year. The largest 48-hour rainfall total for July 10–11 was recorded in Calais, resulting in a recurrence interval of more than 500 years. Many other locations in communities along the Green Mountains experienced 48-hour rainfall totals that resulted in recurrence intervals of more than 200 years (National Oceanic and Atmospheric Administration, 2023a).
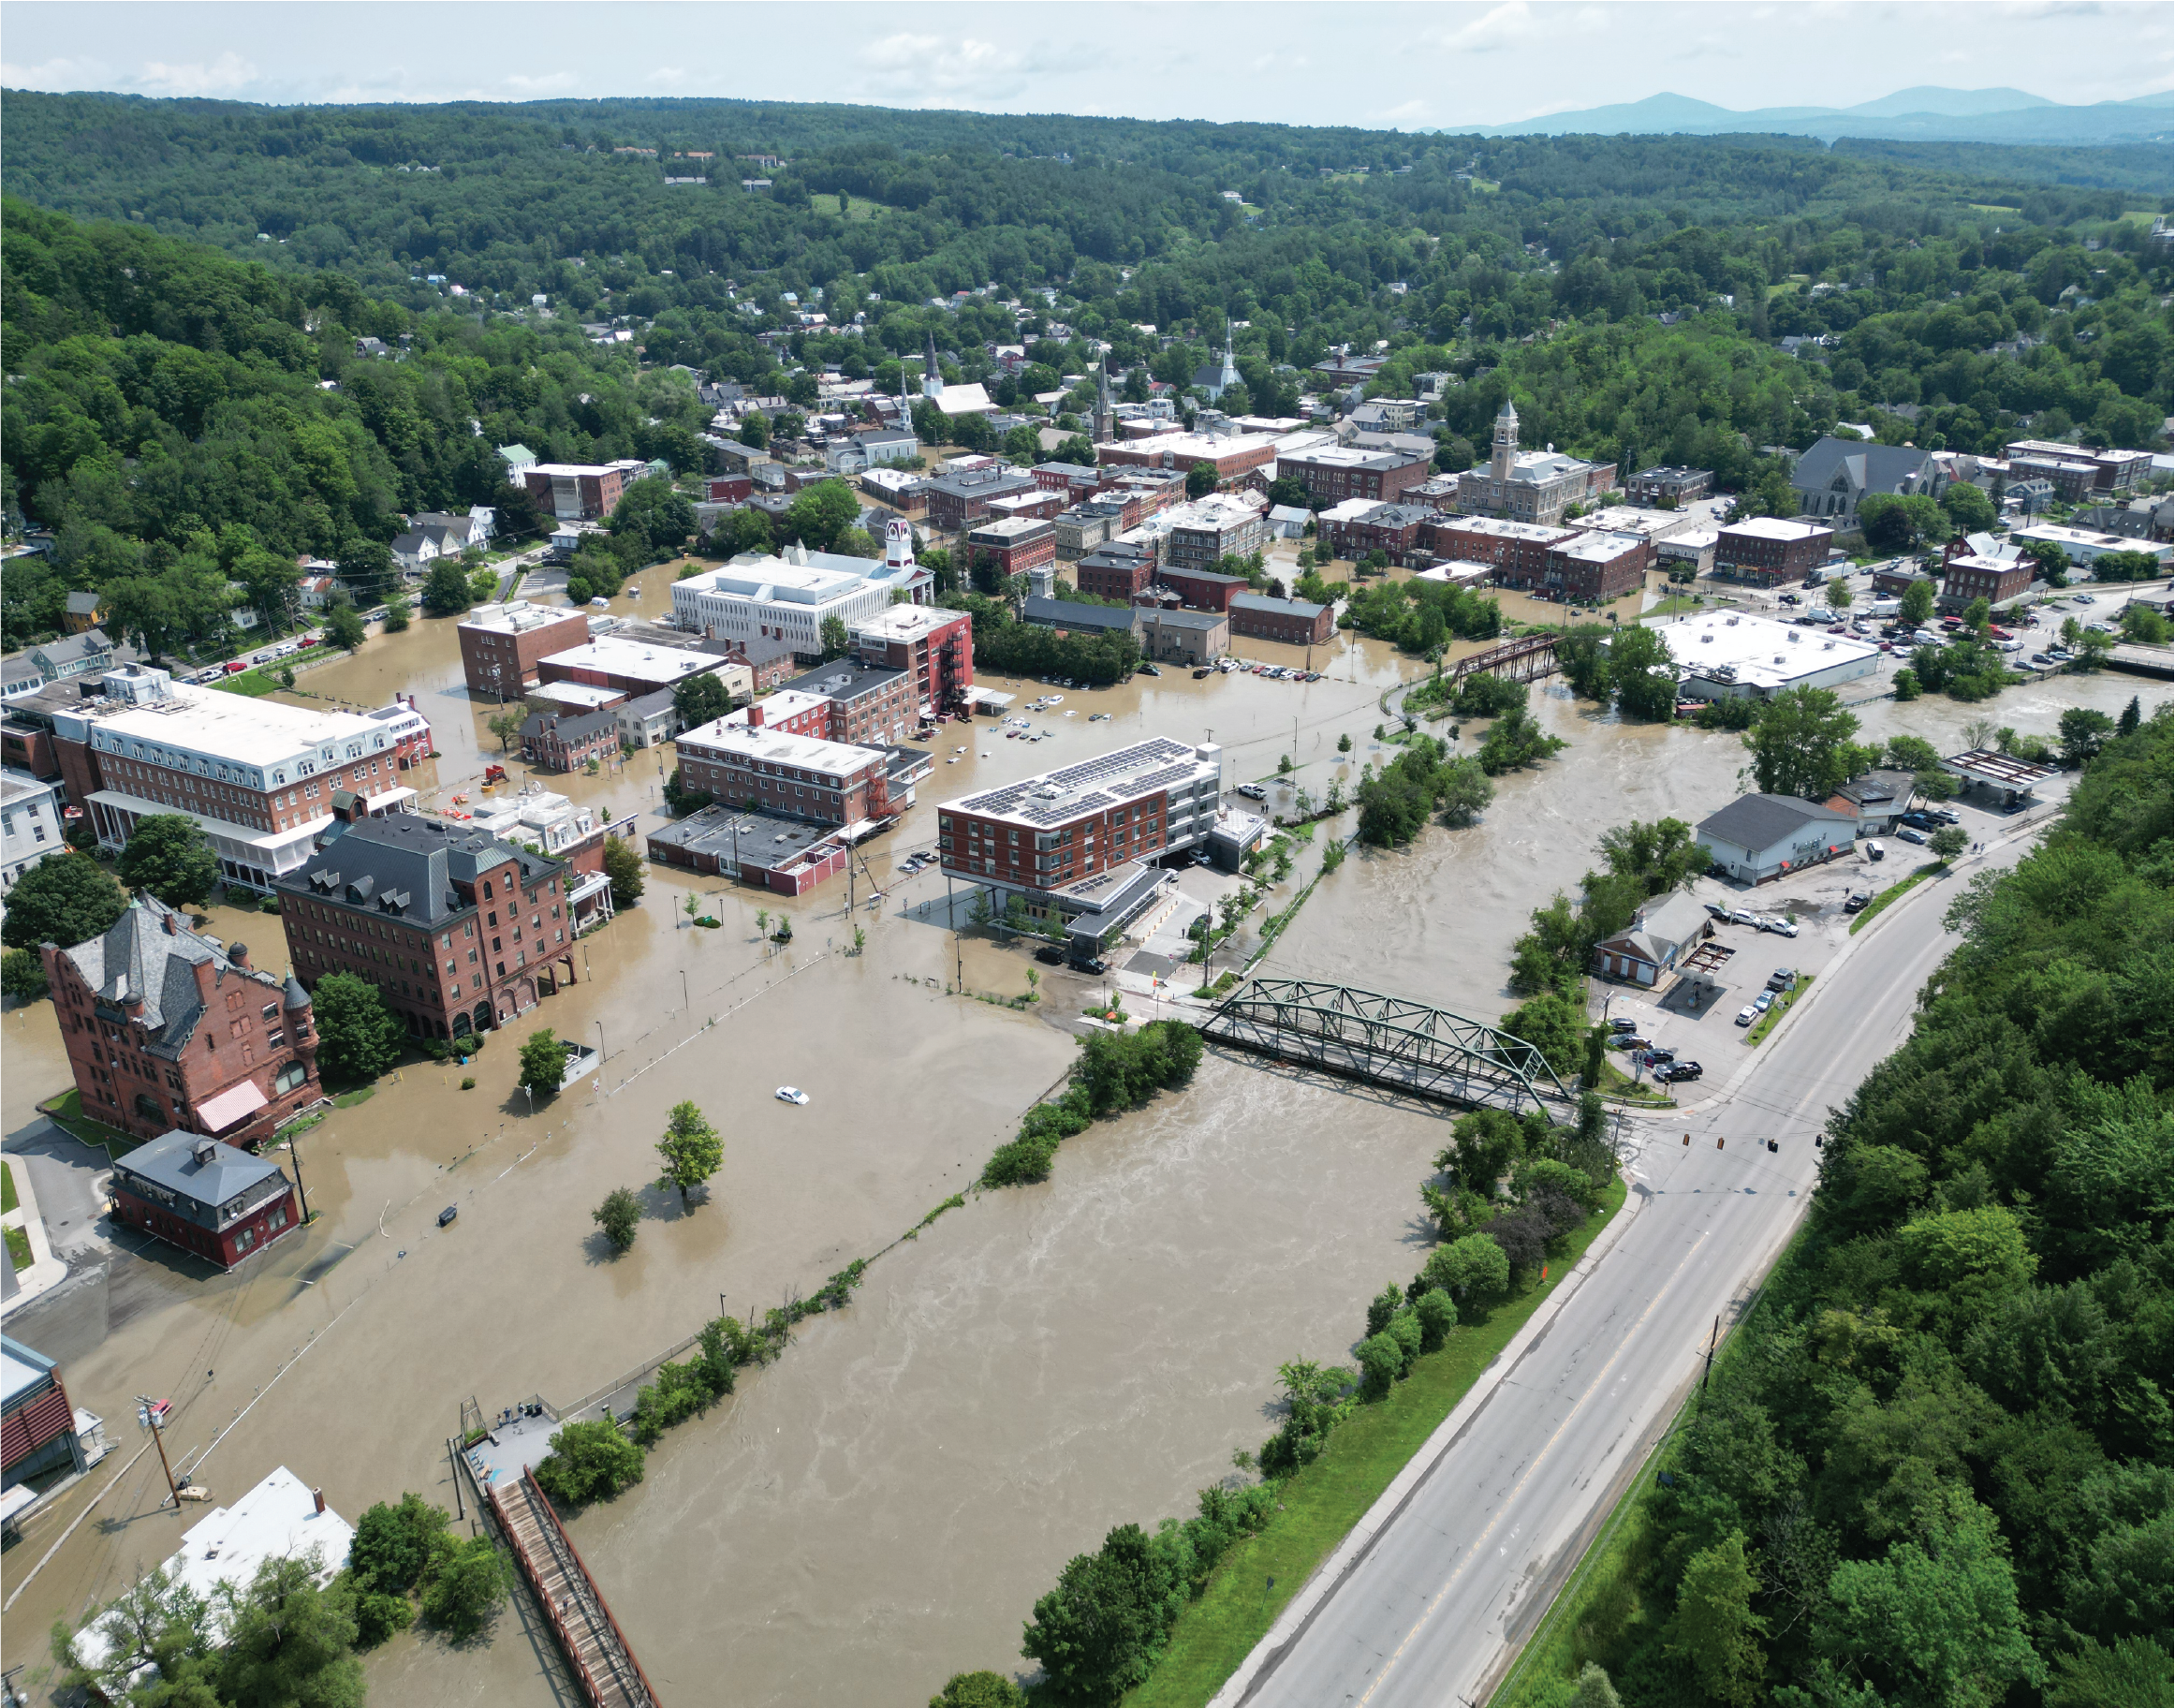
Flooding in the capital city of Montpelier, Vermont, from the Winooski River on July 11, 2023. Photograph by the University of Vermont Spatial Analysis Laboratory.
Description of the Flood
The July 2023 flood was surveyed and documented by the USGS. Peak water-surface elevations were recorded at streamgages and estimated from high-water marks (HWMs) at ungaged locations along streams. Peak streamflows were computed by analyzing streamflows and water-surface elevations (rating curves) at streamgages or by using hydraulic models at ungaged locations. AEPs of streamflows were computed through flow frequency analyses (England and others, 2018).
Peak Water-Surface Elevations
The USGS identified and flagged 578 HWMs in the 2 weeks following the July 2023 flood to record peak water-surface elevations. The areas targeted for HWM identification include points upstream and downstream from structures on rivers that experienced substantial flooding and are without a USGS streamgage. HWMs were identified and rated according to USGS guidelines (Koenig and others, 2016).
The USGS surveyed 547 of the 578 flagged HWMs from August 7 through November 9, 2023. Some HWMs could not be surveyed because the area had since been destroyed or vegetation coverage made surveying impossible. HWMs were surveyed to the North American Vertical Datum of 1988 by using Sokkia, Topcon, and Trimble global navigation satellite systems with campaigns of a level II quality (Rydlund and Densmore, 2012; Noll and Rydlund, 2020). The USGS surveyed HWMs on 31 rivers in Vermont in Addison, Bennington, Caledonia, Chittenden, Franklin, Lamoille, Orange, Orleans, Rutland, Washington, Windham, and Windsor Counties (fig. 4). The surveyed HWM data, including detailed location information, photographs, and ratings, are publicly available at the USGS Flood Event Viewer (USGS, 2024a) under the event titled “2023 July MA NY VT Flood.”
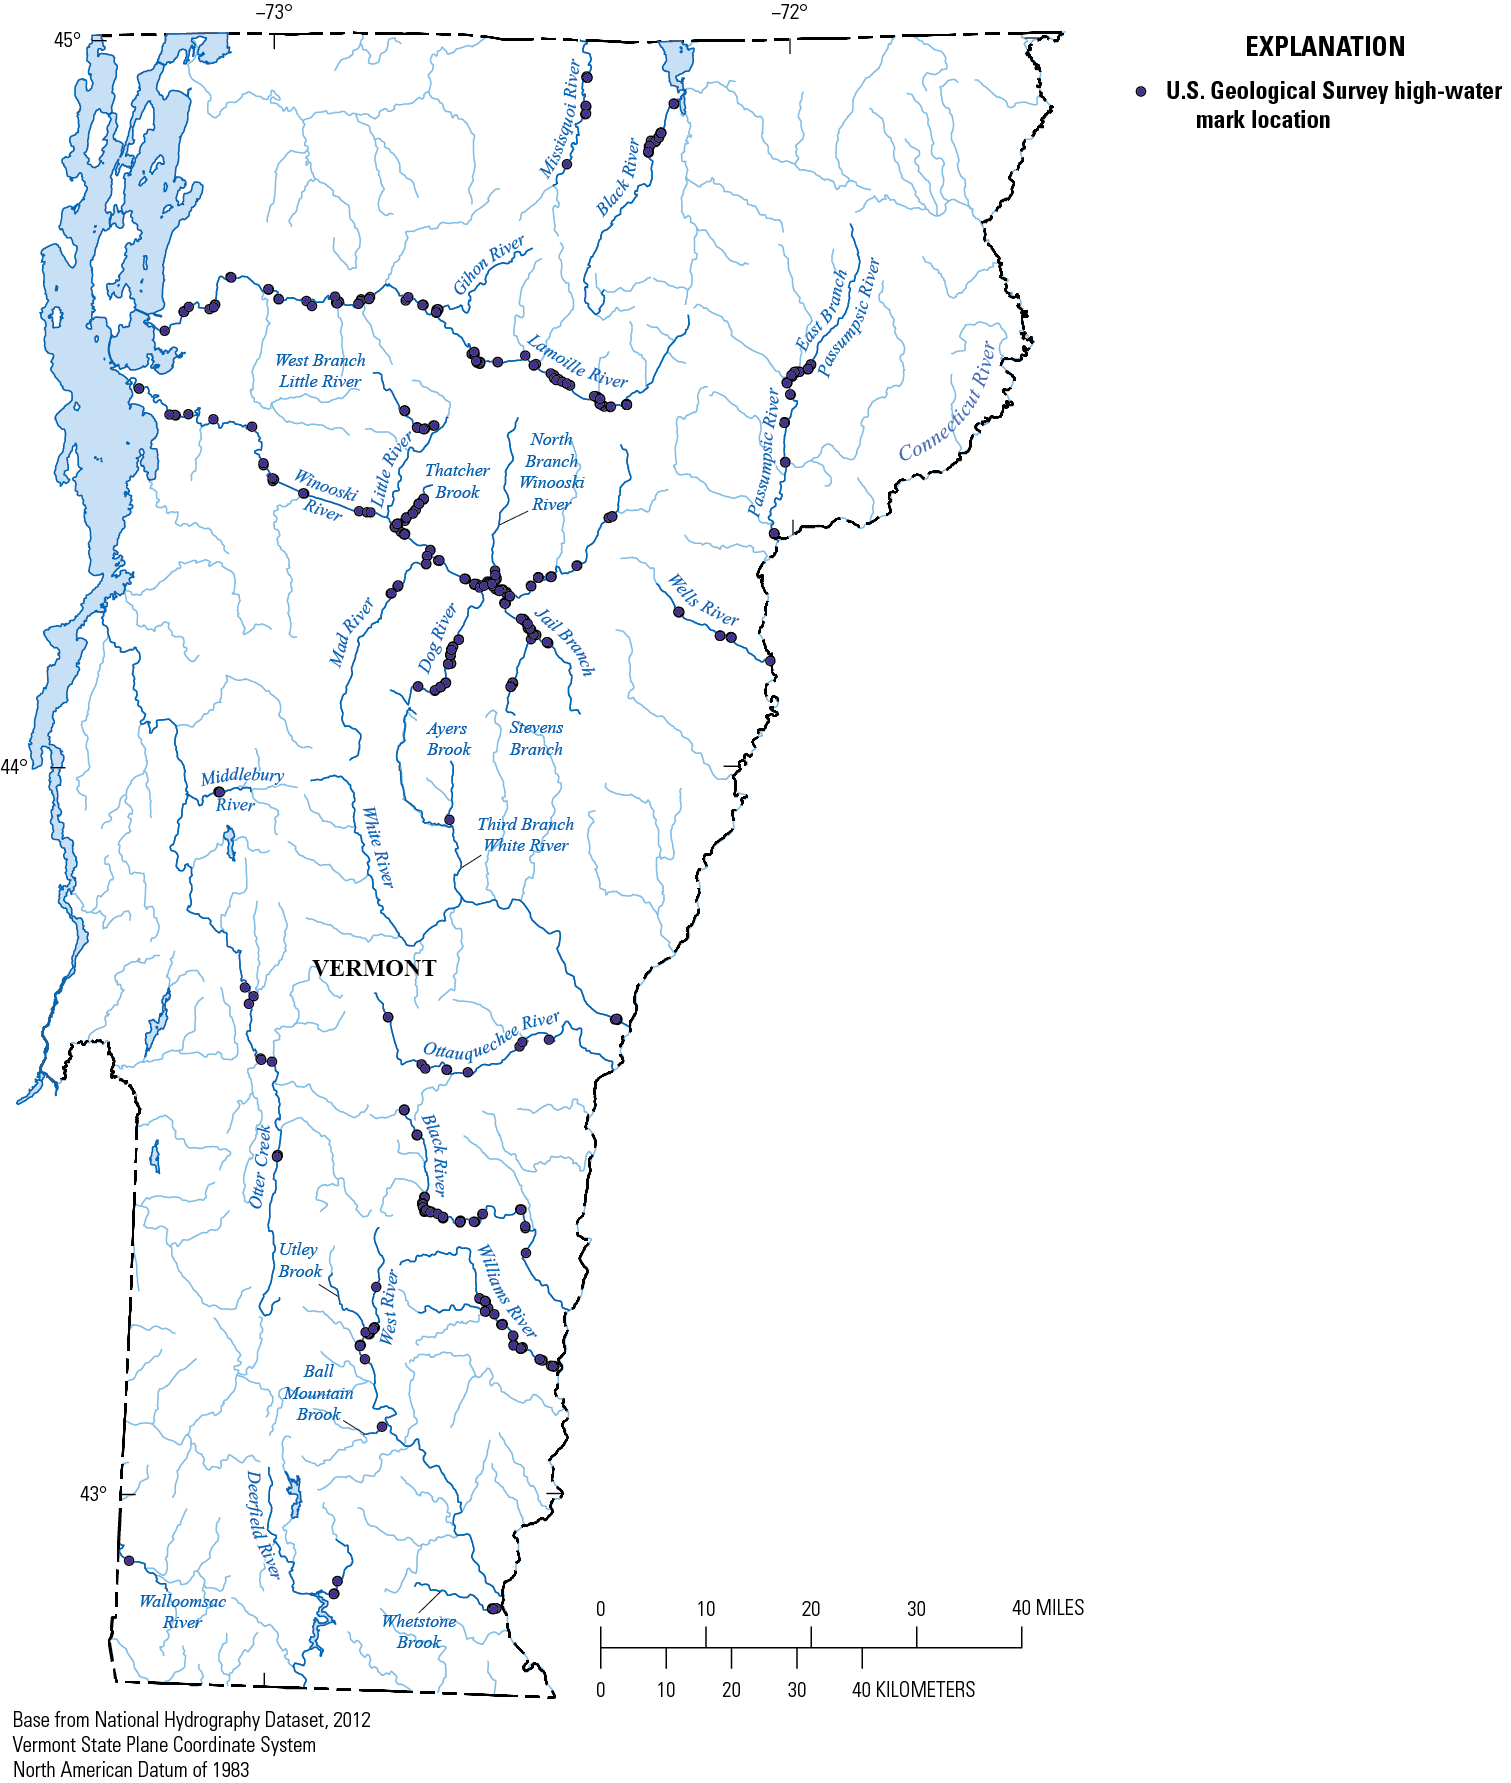
Map showing the high-water marks identified and surveyed for the flood of July 9–12, 2023, in Vermont.
Peak Streamflows
The July 2023 flood was recorded at 80 streamgages: 52 continuous-recording streamgages, 27 crest-stage streamgages, and 1 discontinued streamgage. In addition, two continuous-recording lake gages were active during the flood event (fig. 5). Continuous-recording streamgages record gage height and streamflow every 5 to 15 minutes. Crest-stage streamgages record the maximum water-surface elevation of an event, which is used to compute peak streamflow. Discontinued streamgages are no longer in operation; however, one streamgage where the maximum water-surface elevation and streamflow were recorded was discontinued in 2022. The Saxton River at Saxton, Vt. (station 01154000), USGS streamgage was discontinued on October 1, 2022, but the peak from the July 2023 flood was recorded by the crest-stage streamgage. Lake gages record water-surface elevations of still or contained waterbodies. The peak gage height and streamflow data from the Vermont gages for the July 2023 flood are compiled in Olson and others (2025). Data for the USGS gages in operation during the July flood can also be found on the National Water Information System (USGS, 2024b). At 56 of the 80 streamgages, the July 9–12, 2023, peak streamflow was the maximum for water year 2023. At 11 of these streamgages with 12 to 94 years of record, the July 2023 peak streamflow was the peak of record (fig. 5).
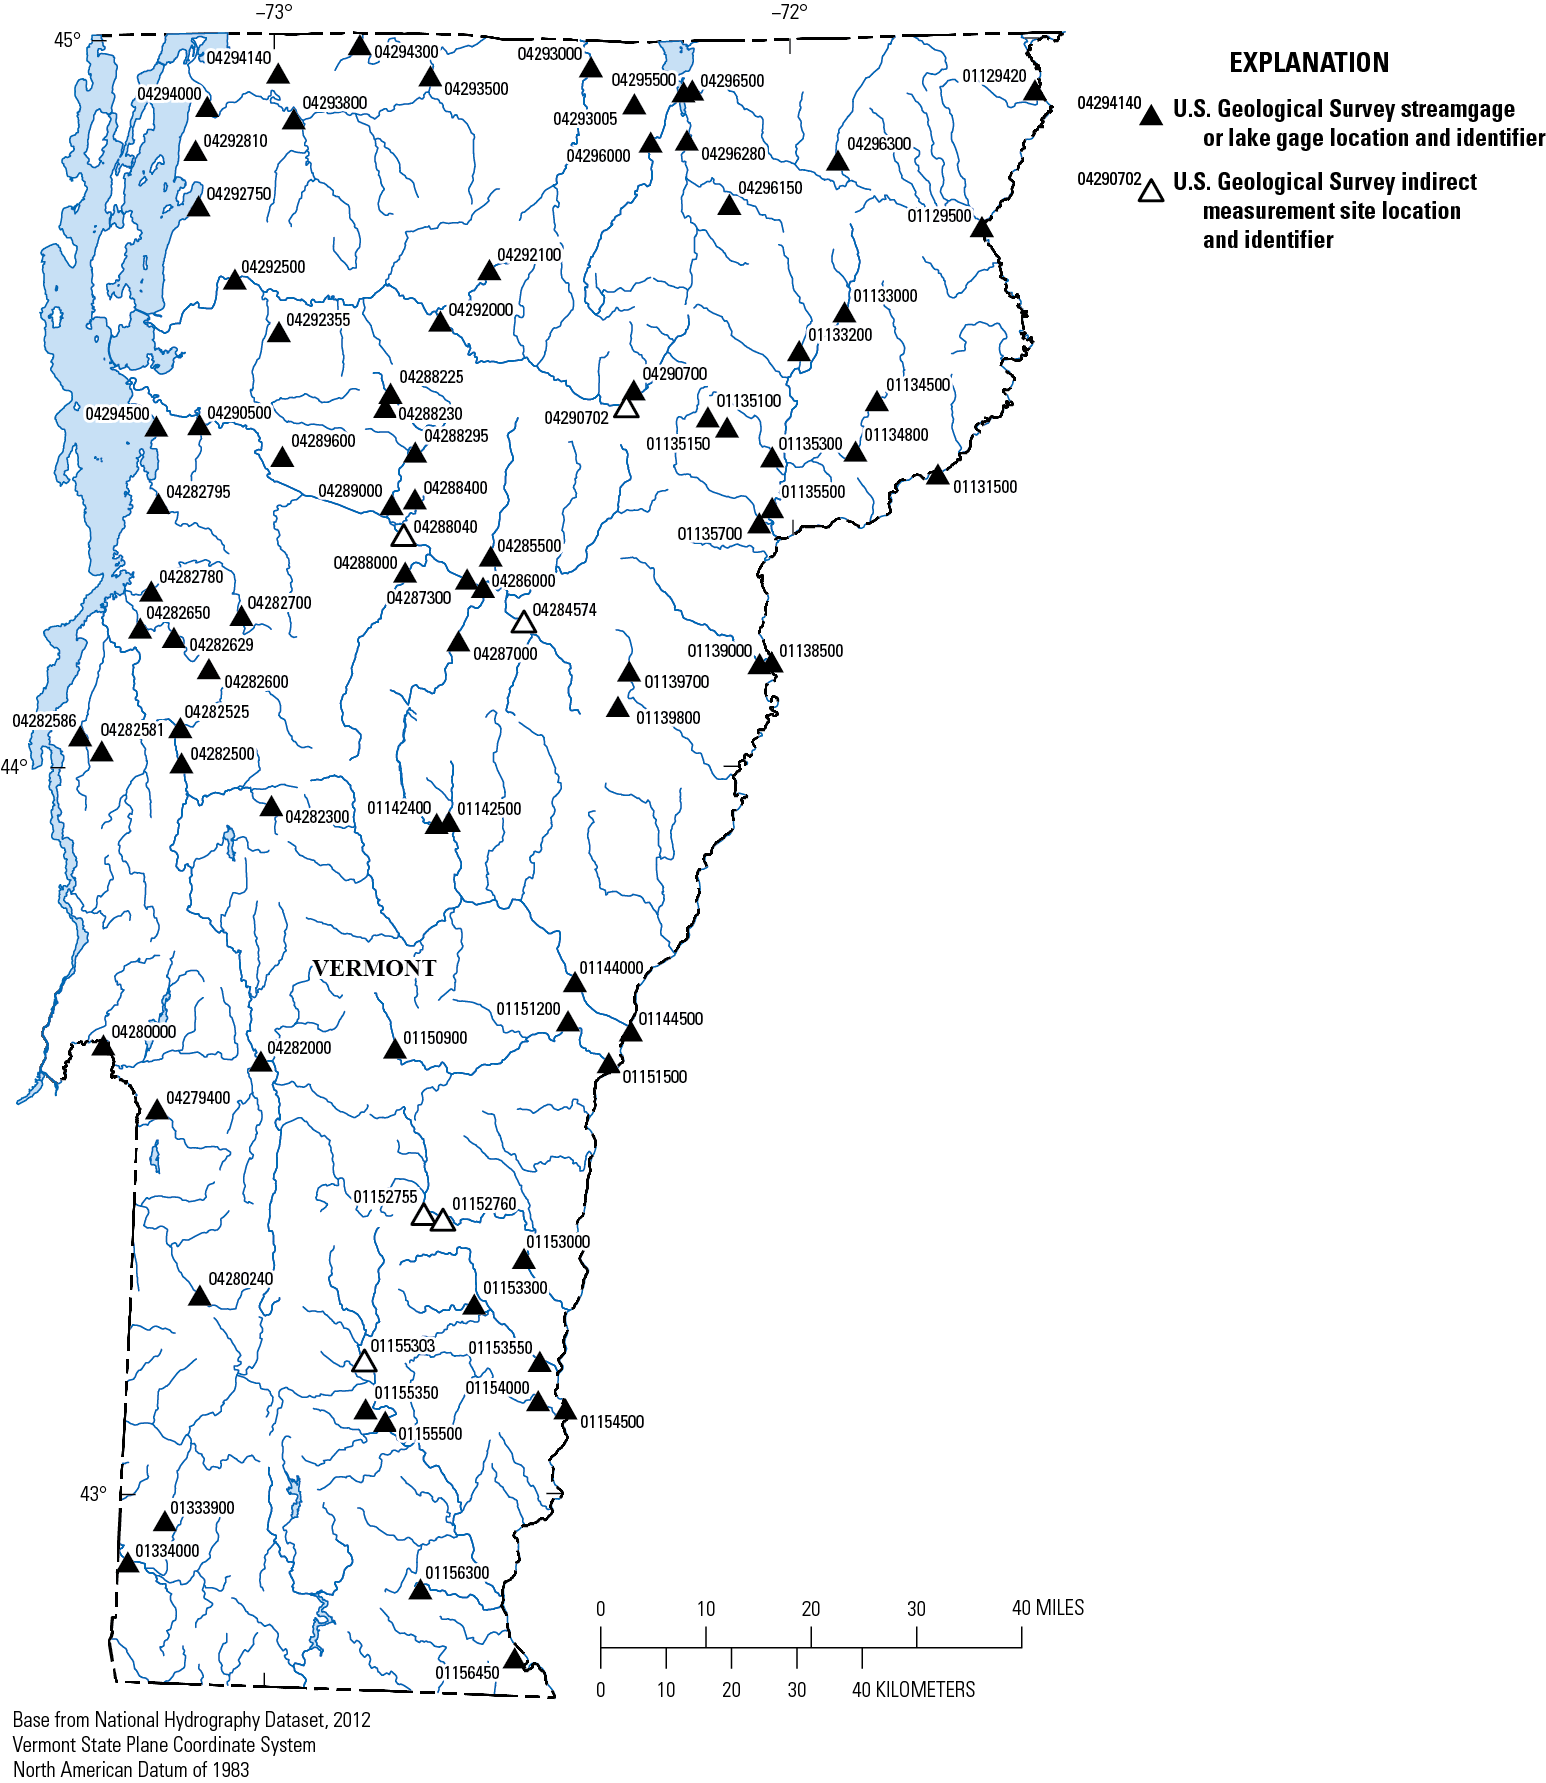
Map showing streamgages, lake gages, and indirect measurement locations in Vermont where the flood of July 9–12, 2023, was documented.
Exceedance Probabilities of Peak Streamflows
Frequency analysis at each of the streamgage and lake gage sites was done to find the magnitude of the streamflow or lake elevation at the 50-, 20-, 10-, 4-, 2-, 1-, and 0.2-percent AEP. Several techniques were used for the frequency analysis depending on the site. Of the 80 streamgages with peak streamflow recorded for the July 2023 flood, 5 streamgages did not have the minimum requirement of 10 years of peak streamflow data for a frequency analysis. The AEPs for these five streamgages were estimated using regression equations developed for Vermont (Olson, 2014).
For 75 of the 80 streamgages that have at least 10 years of peak streamflow data, the flood-frequency analysis was done following techniques described in “Guidelines for Determining Flood Flow Frequency—Bulletin 17C” (England and others, 2018). These techniques incorporate the expected moments algorithm (EMA; Cohn and others, 1997, 2001), methods for detecting and treating outliers, and the log-Pearson type III distribution (Veilleux and others, 2013). The PeakFQ version 7.5 software developed by the USGS to analyze peak streamflow data (USGS, 2024c) was used for the flood frequency computations. The peak streamflow data, used as input to the PeakFQ program, were retrieved from the National Water Information System (USGS, 2024b). Peak streamflows through 2023 were included in the frequency analysis.
The methods to obtain the final flood-frequency results varied depending on whether the peak streamflows were substantially affected by regulation from storage reservoirs and (or) flood control, or if the streamflow was nonregulated and considered natural flow. The criterion used to categorize streamgage sites as having peak streamflows affected by regulation was from Benson (1962). Benson concluded that less than 4.5 million cubic feet (Mft3) of usable storage per square mile (mi2) of drainage area would affect peak streamflows by less than 10 percent in New England. In accordance with the Benson criterion, streamgage sites with usable storage above 4.5 million cubic feet per square mile (Mft3/mi2) of drainage area were categorized as having regulated peak streamflows. Conversely, streamgage sites with usable storage below 4.5 Mft3/mi2 of drainage area were categorized as having unregulated peak streamflows. The only variation from this criterion was the Winooski River at Montpelier, Vt. (station 04286000), USGS streamgage, which has usable storage of 4.7 Mft3/mi2. The peak streamflows from this streamgage were treated as unregulated because the usable storage is close to the cutoff of the Benson criterion and because the drainage and storage reservoirs are primarily in the Winooski River headwaters, leaving approximately 68 percent of the drainage area upstream from the streamgage unregulated.
The station skew, defined only by the station’s historical data and adjusted for outliers, was used for the streamflow frequency analysis at streamgage sites where peak streamflows were affected by regulation. In addition, the frequency analysis was done only on the period of record associated with the current regulation conditions upstream from each streamgage. There were 14 streamgages that had peak streamflows substantially affected by regulation (Olson and others, 2025) and the station skew was used.
At the remaining 61 streamgages where peak streamflows were not substantially affected by streamflow regulation, the station skew was weighted with a generalized skew according to methods described in England and others (2018). The generalized skew was developed for Vermont by Olson (2014). In addition, the streamflow frequencies were weighted using the weighted independent estimates method (Cohn and others, 2012), which uses the variance of the frequency estimate from the EMA analysis and the variance of an available regional-regression equation estimate to weight the EMA result. The Vermont regional regression equations in Olson (2014) were used for weighting. This weighting could not be done for three of the streamgages in northern Vermont that have drainage areas that extend into Canada (Olson and others, 2025) because some of the basin characteristics used to solve the regression equations were not available for Canada. The EMA and the weighted EMA results are listed in Olson and others (2025); where applicable, the weighted EMA flood frequencies are considered to be the final results and were used to define the AEP of the July 9–12, 2023, peak streamflows listed in Olson and others (2025).
For the two lake gages, the frequency analysis was completed using station skew and a log-Pearson type III distribution on annual peak lake elevations that were not logarithmically transformed. The frequency analysis of the lake gages was done by using the U.S. Army Corp of Engineers Hydrologic Engineering Center’s Statistical Software Package (U.S. Army Corp of Engineers, 2023).
The results of the frequency analyses for each streamgage along with the PeakFQ input and output files are found in Olson and others (2025). During the July 2023 flood, four streamgages recorded a peak streamflow with an AEP of less than 2 percent and greater than 1 percent (between a 50- and 100-year recurrence interval; fig. 6). Seven streamgages recorded a peak streamflow with an AEP less than or equal to 1 percent and greater than 0.2 percent (between a 100- and 500-year recurrence interval). Three streamgages recorded a peak streamflow with an AEP less than or equal to 0.2 percent (greater than a 500-year recurrence interval).
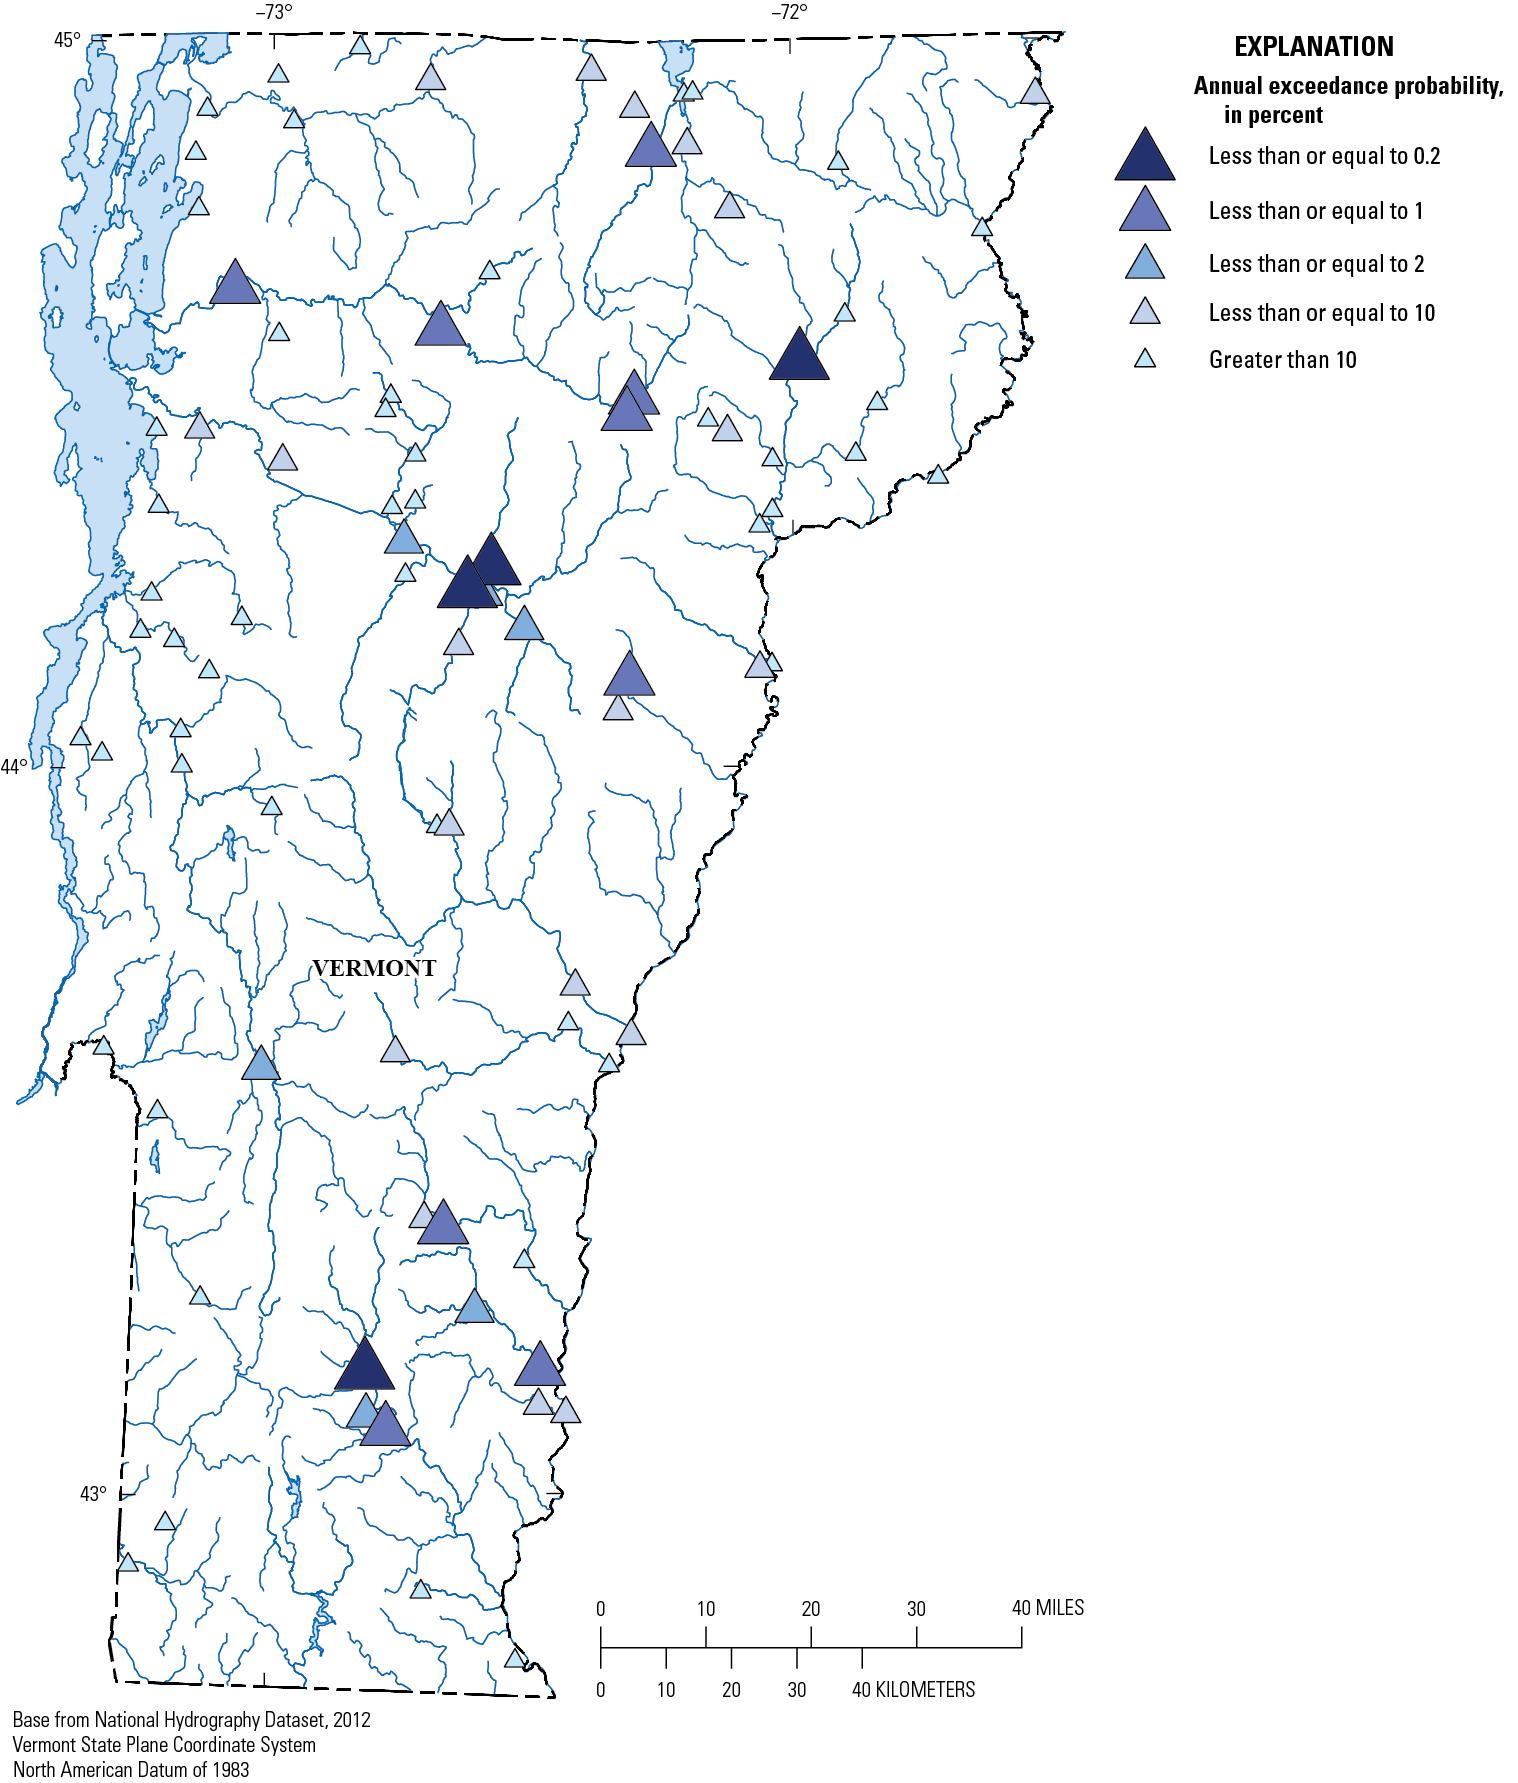
Map of annual exceedance probabilities of the July 9–12, 2023, flood at streamgages, lake gages, and indirect streamflow measurement locations in Vermont.
Peak Streamflows and Exceedance Probabilities at Select Ungaged Locations
In addition to flood streamflow data collected at USGS streamgages during the July 2023 flood, six ungaged locations were selected for computations of the peak streamflow by indirect methods. The indirect method of measuring peak streamflows applied at these six locations uses open-channel width contraction caused by a roadway crossing, as described in Matthai (1967). This indirect peak streamflow estimation method was used at the Jewell Brook at Ludlow, Vt. (station 01152755); Black River at East Hill Road, near Ludlow, Vt. (station 01152760); West River at South Londonderry, Vt. (station 01155303); Stevens Branch at Willey Street, at Barre, Vt. (station 04284574); Lamoille River near Hardwick, Vt. (station 04290702); and Winooski River above Crossett Brook, at Waterbury, Vt. (station 04288040), USGS streamgages (fig. 5; table 1). The Winooski River above Crossett Brook, at Waterbury, Vt., streamgage is an active stage-only streamgage where streamflow is not usually determined. Thus, an indirect streamflow measurement was computed.
Except for the Winooski River above Crossett Brook at Waterbury, Vt., streamgage, the AEPs of the streamflows computed at ungaged locations were determined by using the regression equations developed for ungaged, rural locations in Vermont (Olson, 2014). The AEPs for the Winooski River above Crossett Brook at Waterbury, Vt., streamgage were interpolated from AEPs estimated from the upstream Winooski River at Montpelier, Vt. (station 0428600), and downstream Winooski River near Essex Junction, Vt. (station 04290500), USGS streamgages. Regression equation estimates were computed using the USGS StreamStats web application (Ries and others, 2017). At the Stevens Branch at Willey Street, at Barre, Vt. (station 04284574), indirect measurement location, applying the regression equations resulted in an AEP between 1 and 2 percent (table 1). However, applying the regression equations does not account for the flood-detention reservoir upstream from the Stevens Branch at Willey Street at Barre, Vt. (station 04284574), USGS streamgage, resulting in an overestimation of the AEP.
Table 1.
Peak streamflows and annual exceedance probabilities for the July 9–12, 2023, flood in Vermont at sites where indirect streamflow measurement techniques were applied.[Data from Olson and others (2025). Streamgage locations are shown in figure 5. USGS, U.S. Geological Survey. mi2, square mile; ft3/s, cubic foot per second; AEP, annual exceedance probability; <, less than]
Comparison of the July 2023 Flood with August 2011 Tropical Storm Irene
Two of the largest floods in recent Vermont history, Tropical Storm Irene in August 2011 and the July 2023 flood delivered more than 4 in. of rainfall in a 48-hour period throughout areas of Vermont (Banacos, 2023). Both floods were preceded by periods of increased precipitation and saturated soil conditions, highlighting the effects of antecedent conditions. Rainfall totals and the conditions leading up to the July 2023 flood were discussed in greater detail in the “Storm Characteristics” and “Antecedent Conditions” sections of this report, respectively. Flooding from both storms was generally characterized by heavy localized rainfall over 2 days, which followed a period of above-average rainfall, abnormally high soil moisture, and flash floods.
Tropical Storm Irene hit Vermont on August 28, 2011, with heavy rainfall continuing through August 29, 2011. Parts of southern and central Vermont received 4 to 8 in. of rainfall in 48 hours, with Addison, Caledonia, Orange, Washington, Windham, and Windsor Counties being some of the hardest hit (National Oceanic and Atmospheric Administration, undated). Although heavy rainfalls (with 48-hour totals greater than 4 in.) were more widespread across Vermont during Tropical Storm Irene, localized 48-hour rainfall totals in some areas were greater during the July 2023 flood, when areas in Washington and Windsor Counties received more than 9 in. of rainfall in 48 hours. The 48-hour rainfall total in Montpelier measured during July 9–11, 2023, was 5.28 in., slightly higher than the previous record of 5.27 in. measured during Tropical Storm Irene (Banacos, 2023).
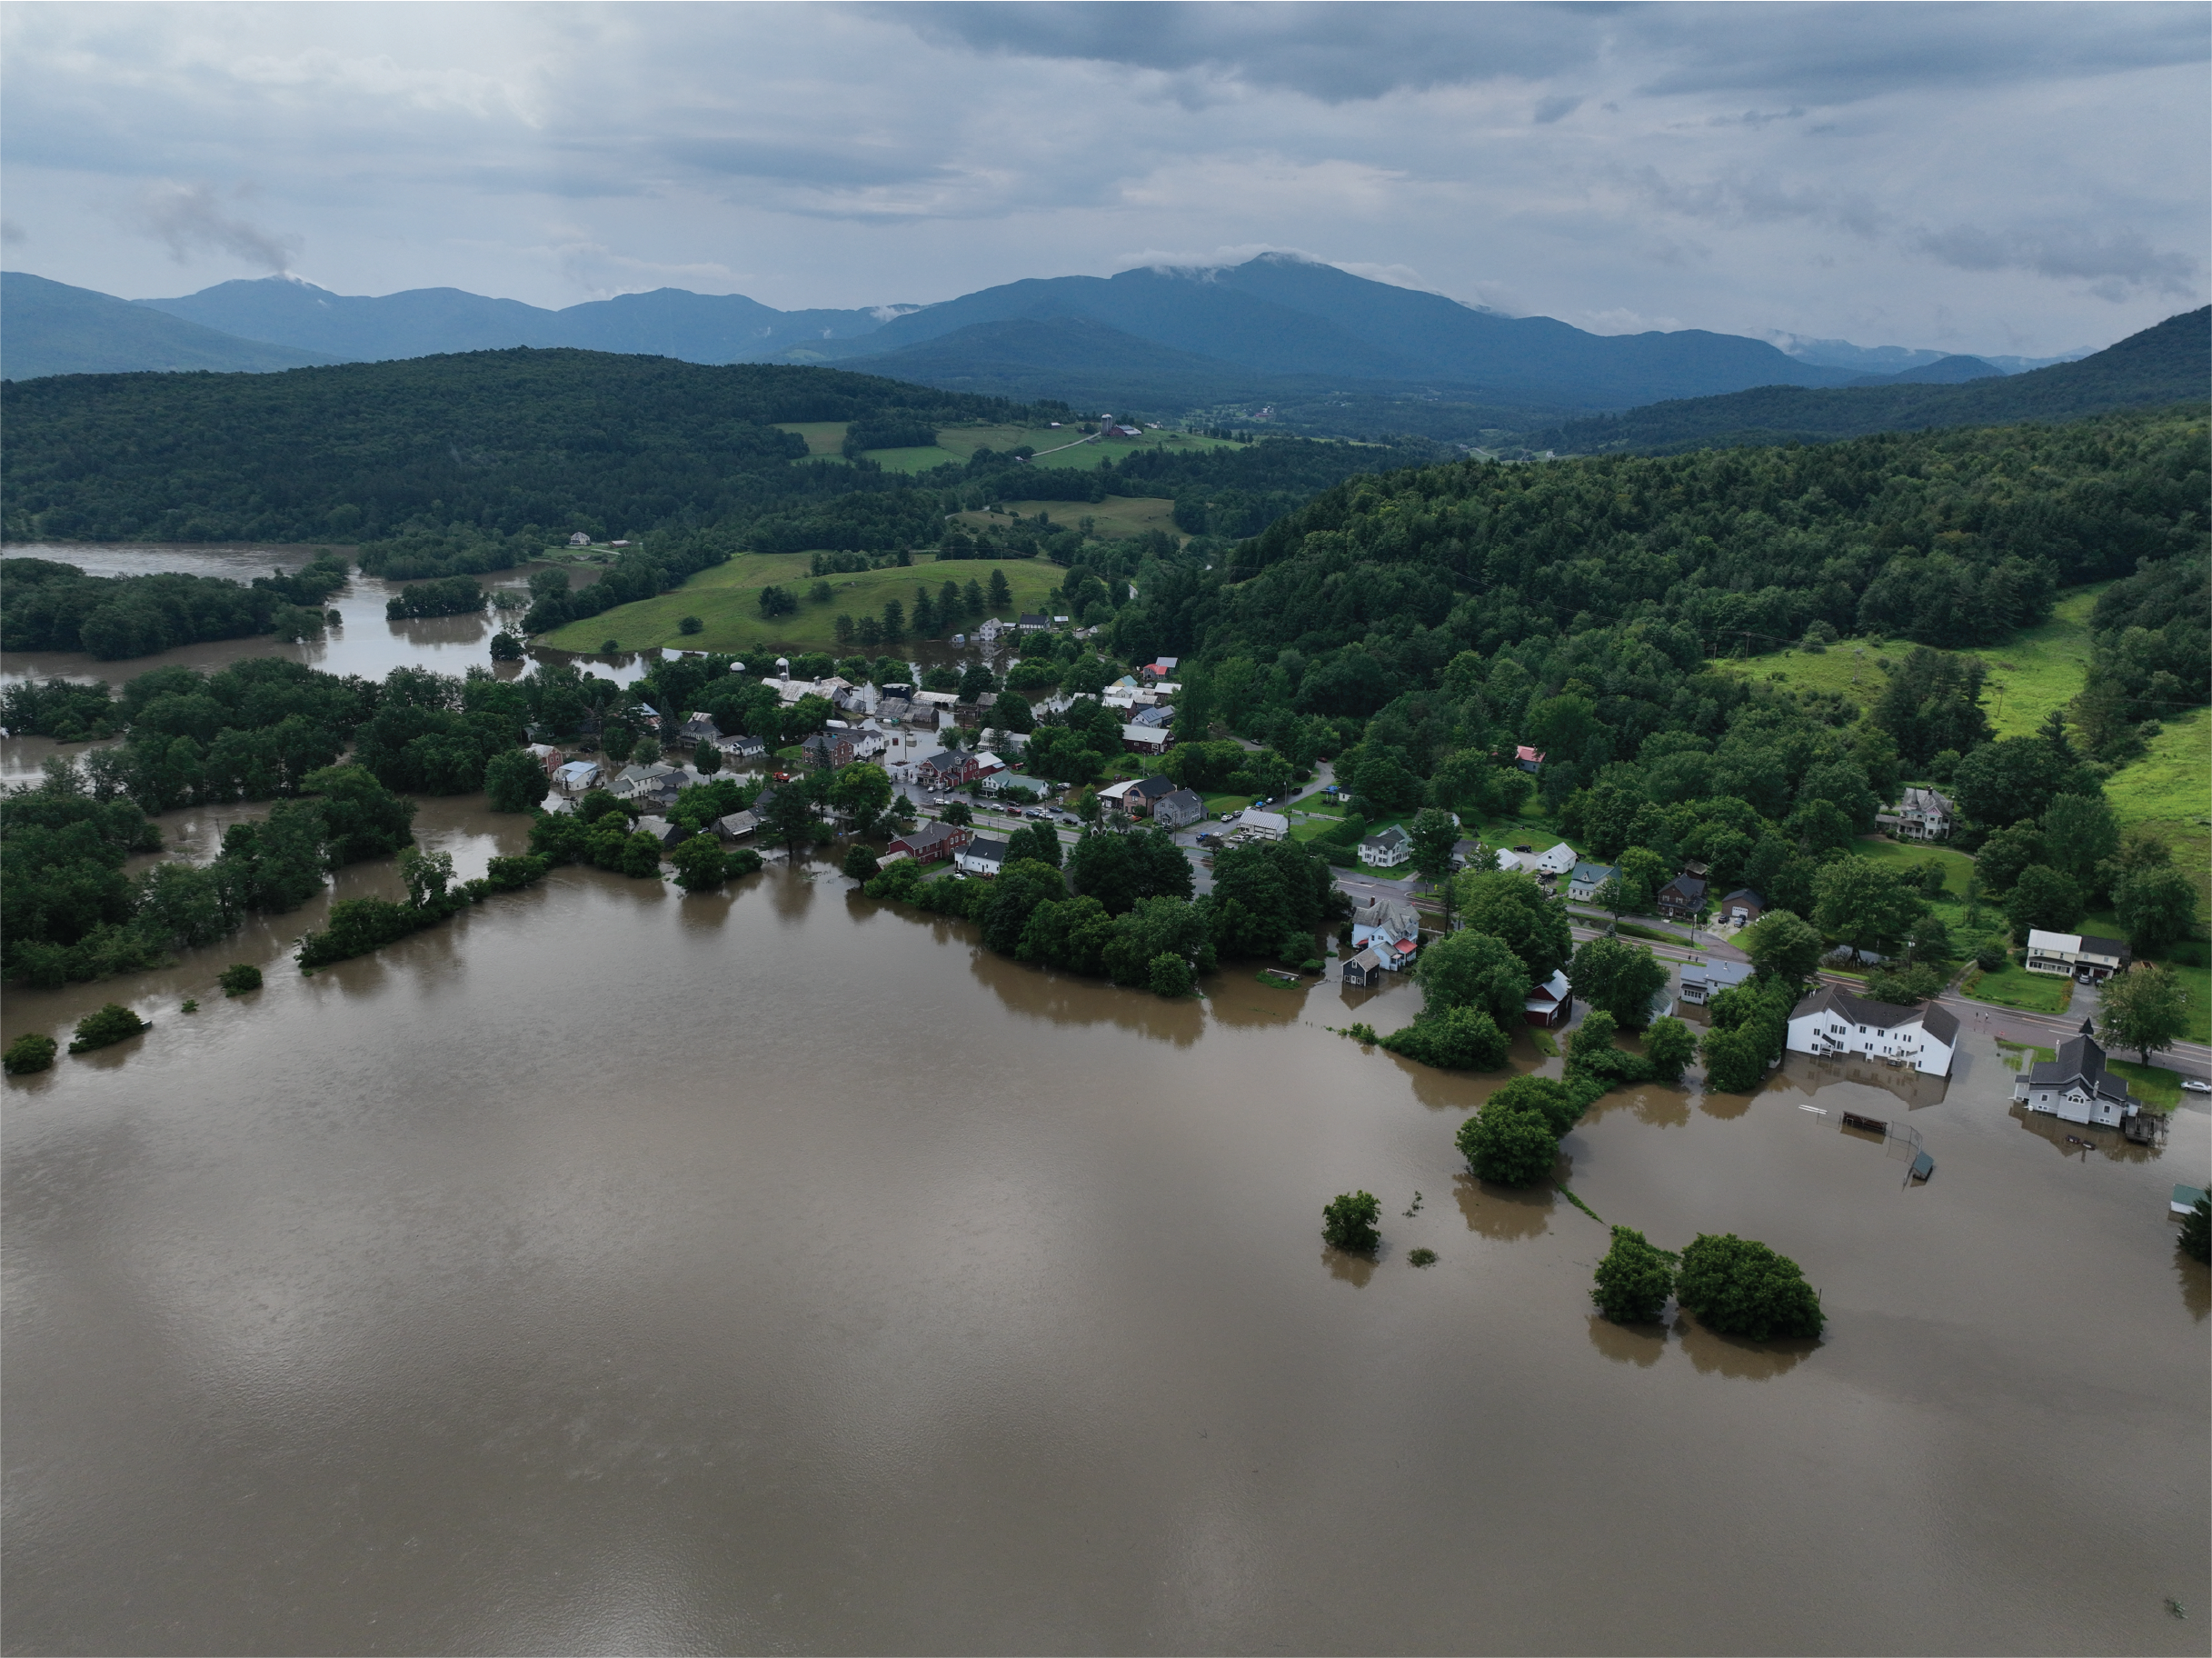
Flooding in the town of Cambridge, Vermont, from the Lamoille River on July 11, 2023. Photograph by the University of Vermont Spatial Analysis Laboratory.
Similar to the conditions before the July 2023 flood, heavy rainfall preceded Tropical Storm Irene and brought 1 to 2 in. of rain across central and eastern Vermont on August 15 and 16, 2011 (Dupigny-Giroux and Hogan, 2011). Increased precipitation before both events caused increased soil moisture. Antecedent soil moisture contributed to greater runoff and flash flooding during both Tropical Storm Irene and the July 2023 flood (Banacos, 2023).
Streamflow Comparison
Streamflows recorded at USGS streamgages before the July 2023 flood were generally higher than streamflows before Tropical Storm Irene. On August 26, 2011, there were two streamgages below normal conditions (streamflow below the 25th percentile), 23 streamgages at normal conditions (streamflow between the 25th and 75th percentile), and 1 streamgage above normal conditions (streamflow above the 75th percentile). On July 7, 2023, there were no streamgages below normal, 18 streamgages at normal conditions, 10 streamgages above normal conditions, and 1 streamgage much above normal conditions (streamflow greater than the 90th percentile; USGS, undated). Of the 45 continuous-recording USGS streamgages in Vermont that were in operation during both Tropical Storm Irene and the July 2023 flood, 25 streamgages recorded greater peak flow during Tropical Storm Irene and 20 streamgages recorded greater peak flow during the July 2023 flood.
HWM Comparison
To capture the peak water-surface elevations from flooding during Tropical Storm Irene, the USGS identified and flagged HWMs throughout Vermont. These were later surveyed for peak water-surface elevation by Dewberry (Medalie and Olson, 2013). HWMs from the July 2023 flood (Olson and others, 2025) were flagged and surveyed near Tropical Strom Irene HWMs, when possible, to provide a direct comparison of peak water-surface elevation between the two events. The surveyed HWM data for these two events and other nationwide floods are publicly available on the USGS Flood Event Viewer website (USGS, 2024a).
Seventeen rivers in Vermont were surveyed for HWMs for both Tropical Storm Irene and the July 2023 flood (Olson and others, 2025). The surveyed HWMs are grouped into sites that share the same hydrologic conditions, for example, immediately downstream of the same bridge on the same river. On those 17 rivers, there are 103 HWM sites that have surveyed HWM data for both Tropical Storm Irene and the July 2023 flood. The peak water-surface elevations from Tropical Storm Irene were higher than those of the July 2023 flood at 71 sites, whereas 32 sites had higher peak water-surface elevations for the July 2023 flood. The most extreme difference in peak water-surface elevations at shared sites occurred on the Mad River in Moretown, Vt. The recorded peak water-surface elevation upstream of the Mad River near Moretown, Vt. (station 04288000), USGS streamgage was 18.66 ft higher during Tropical Storm Irene, at 591.78 ft, than during the July 2023 flood.
Surveyed HWM elevations were higher at all shared sites for the July 2023 flood compared with Tropical Storm Irene on the Black River in Newport, Jewell Brook, Middlebury River, and Missisquoi River. Surveyed HWM elevations were higher at all shared sites for Tropical Storm Irene compared with the July 2023 flood on Ayers Brook, East Branch Passumpsic River, Mad River, North Branch Deerfield River, Passumpsic River, and White River. Surveyed HWM elevations were higher for one or the other event depending on where the site is located along the river on Black River in Springfield, Dog River, Ottauquechee River, Otter Creek, Wells River, Whetstone Brook, and Winooski River. Although the Lamoille River experienced flooding during both the July 2023 flood and Tropical Storm Irene, HWMs were not collected during Tropical Storm Irene, so it is impossible to compare surveyed HWMs between the two events. However, the two streamgages along the Lamoille River (Lamoille River at Johnson, Vt. [station 04292000], and Lamoille River at East Georgia, Vt. [station 0429500]) recorded greater peak streamflows during the July 2023 flood than during Tropical Storm Irene (USGS, undated).
The flood damage affected many communities but the flooding along the Winooski River in Montpelier was especially disastrous. There were 33 HWMs surveyed on the Winooski River in Montpelier or on the opposite bank in Berlin for the July 2023 flood and 8 HWMs surveyed for Tropical Storm Irene. The elevation differences at two identical sites where HWMs were flagged for both events along the Winooski River in Montpelier were 1.44 and 4.80 ft higher, respectively, during the July 2023 flood compared with Tropical Storm Irene. Additional details and comparative analysis of HWM data for the July 2023 flood and Tropical Storm Irene are available on the USGS Vermont High-Water Mark Data Viewer (LeNoir, 2024).

Flooding in the town of Richmond, Vermont, from the Winooski River on July 11, 2023. Photograph by the University of Vermont Spatial Analysis Laboratory.
Evaluation of Flood Insurance Studies Using Flood Data From July 2023
Flood insurance studies published by FEMA provide 10-, 2-, 1-, and 0.2-percent AEP streamflows and water-surface elevations for many stream reaches affected by the July 2023 flood in Vermont. After a flood of this magnitude, it is useful to compare observed streamflows and water-surface elevations from the flood with estimated flood flow frequency and water-surface elevation data published in the applicable flood insurance study (FEMA, 1979, 1980a–c, 1981a–c, 1982, 1983, 1984, 1986a–d, 1987, 1991, 1992, 1994, 1999, 2002, 2005, 2006, 2007a–b, 2008a–b, 2013a–b, 2014, 2015). A large event can cause the hydrology at a site to shift and indicate that a new flood frequency analysis is warranted. In addition, if there are reaches for which the observed 2023 peak streamflow and water-surface elevation AEPs (as estimated from flood insurance studies) do not align, updated techniques and additional data could be used to update hydrologic and hydraulic models. Flood insurance studies evaluated were published as far back as 1979.
Evaluation of Hydrology in Flood Insurance Studies
Flood streamflows for the 10-, 2-, 1- and 0.2-percent AEPs from effective (FEMA, 1979, 1980a–c, 1981a–c, 1982, 1983, 1984, 1986a–d, 1987, 1991, 1992, 1994, 1999, 2002, 2005, 2006, 2007a–b, 2008a–b, 2013a–b, 2014, 2015) and preliminary (FEMA, 2024) FEMA flood insurance study reports were compared to updated AEP streamflows computed using annual peak streamflow data through water year 2023 (Olson and others, 2025) at 26 USGS streamgage locations. After the July 2023 flood, flood-frequency estimates were updated for 77 streamgages (73 in Vermont and 4 in New Hampshire; Olson and others, 2025). However, only 26 of the 77 streamgages had corresponding streamflow-computation locations in flood insurance study reports to be used in the flood frequency comparison. Comparisons were made by computing percentage-difference values between flood insurance study streamflow computations (FEMA, 1979, 1980a–c, 1981a–c, 1982, 1983, 1984, 1986a–d, 1987, 1991, 1992, 1994, 1999, 2002, 2005, 2006, 2007a–b, 2008a–b, 2013a–b, 2014, 2015) and updated AEP streamflows (Olson and others, 2025).
Percentage-difference values for the 1-percent AEP (100-year flood) streamflow were computed for the 26 flood insurance study streamflow-computation locations. FEMA flood insurance study 1-percent AEP streamflows were found to be from 2 to 37 percent larger than the updated 1-percent AEP streamflows at 13 sites and from 1 to 29 percent smaller than the updated 1-percent AEP streamflows at 13 sites. Three of the 26 locations had differences of less than 5 percent between the 1-percent AEP streamflows. Twenty-one of the 26 locations had more than a 10 percent difference in the 1-percent AEP streamflows (Olson and others, 2025).
Percentage-difference values for the 10-percent AEP (10-year flood) streamflows were computed for 23 flood insurance study streamflow-computation locations. FEMA flood insurance study 10-percent AEP streamflows were found to be from 1 to 42 percent larger than the updated streamflows at 11 sites and from 1 to 55 percent smaller than the updated AEP streamflows at 12 sites. Three of the 23 locations had less than a 5 percent difference in the 10-percent AEP streamflows. Fourteen of the 23 locations had more than a 10 percent difference in the 10-percent AEP streamflow (Olson and others, 2025).
Evaluation of Hydraulic Models in Flood Insurance Studies
To evaluate hydraulic models of flood insurance studies in the regions affected by the July 2023 flood, peak water-surface elevations and the associated peak streamflows for water year 2023 were obtained at 10 streamgages in Vermont (USGS, 2024b; Olson and others, 2025) that had flood insurance studies informed by detailed hydraulic models at the streamgages (FEMA, 1979, 1980a–c, 1981a–c, 1982, 1983, 1984, 1986a–d, 1987, 1991, 1992, 1994, 1999, 2002, 2005, 2006, 2007a–b, 2008a–b, 2013a–b, 2014, 2015). The AEPs of the 2023 peak streamflows relative to the flood insurance study were determined by matching the applicable 2023 peak streamflow to the streamflow AEP data at the streamgage location in the flood insurance study. The AEPs of the 2023 peak water-surface elevations relative to the flood insurance study were then determined at those same locations (table 2) by applying them to the water-surface profiles in the flood insurance study. If the AEP of the peak streamflow did not match the AEP of the associated peak water-surface elevation on the flood insurance study profile, then the hydraulic model used in that flood insurance study may not be an accurate representation of current stream hydraulics at that location. For example, if an observed peak streamflow had an AEP of between 10 and 2 percent, the associated observed peak water-surface elevation would be expected to also have an AEP of between 10 and 2 percent if the hydraulic model was an accurate representation of stream hydraulics at that location. Four of the 10 streamgages had poor alignment between the AEPs of the observed peak streamflows and the AEPs of the observed peak water-surface elevations as computed from the flood insurance studies including Otter Creek at Center Rutland, Vt. (04282000); North Branch Winooski River at Wrightsville, Vt. (05285500); Winooski River at Montpelier, Vt. (04286000); and Lamoille River at East Georgia, Vt. (04292500; table 2).
Table 2.
Peak streamflows and peak water-surface elevations for water year 2023 in Vermont, and their respective annual exceedance probabilities as computed from effective or preliminary flood insurance studies.[Data are from Olson and others (2025). Streamgage locations are shown in figure 5. A water year is the 12-month period from October 1 through September 30 of the following year and is designated by the calendar year in which it ends. USGS, U.S. Geological Survey; ft3/s, cubic foot per second; ft, foot; NAVD88, National Vertical Datum of 1988; AEP, annual exceedance probability; %, percent; <, less than; >, greater than]
From USGS peak flow file (USGS, 2024b).
From effective or preliminary Federal Emergency Management Agency flood insurance study (Federal Emergency Management Agency, 1979, 1980a–c, 1981a–c, 1982, 1983, 1984, 1986a–d, 1987, 1991, 1992, 1994, 1999, 2002, 2005, 2006, 2007a–b, 2008a–b, 2013a–b, 2014, 201511).
In addition to the 10 peak water-surface elevations from the July 2023 flood at the streamgages documented in table 2, 184 additional peak water-surface elevations documented as HWMs are compiled in the “Comparison of effective FIS hydraulics to 2023 event” table in Olson and others (2025). HWMs were selected for analysis on the basis of two criteria: (1) whether they were in the same reach as one of the streamgages in table 2 that had an associated AEP and (2) whether there was a flood insurance study that had been informed by a detailed hydraulic model for the location. HWMs were in the same reach as the streamgage if their drainage area did not deviate more than 50 percent from the drainage area of the streamgage. The AEPs of the streamflow relative to the flood insurance study are presented alongside AEPs of HWMs relative to the flood insurance study. The AEPs can be compared to evaluate the hydraulic models in the flood insurance studies.
A hydraulic model is likely an accurate representation of stream hydraulics at that location if the AEP of the streamflow falls within the same range of AEPs as the peak water-surface elevation. Although elevations determined for HWMs are not as accurate as elevations determined at a streamgage, this analysis of peak water-surface elevations from HWMs gives us a larger and more spatially comprehensive dataset to evaluate than the dataset that uses only the streamgages represented in table 2.
Of the 194 locations analyzed, 108 show good alignment between the AEP of the 2023 water-surface elevations and the AEP of the 2023 peak streamflow, indicating that the observed water-surface elevation is what would be expected given the observed streamflow applied to the hydraulic model in the FEMA flood insurance studies. These locations that show good alignment include 12 out of 13 locations on the Passumpsic River, 3 out of 5 locations on the White River, 3 out of 7 locations on the Otter River, 12 out of 18 locations on the Dog River, 3 out of 10 locations on the Mad River, 40 out of 72 locations on the Winooski River, and 35 out of 64 locations on the Lamoille River.
The elevation AEPs at 56 locations are smaller than the streamflow AEPs, indicating that the observed water-surface elevation is greater than what would be expected given the observed streamflow applied to the hydraulic model in the FEMA flood insurance study. These include 1 out of 13 locations on the Passumpsic, 4 out of 7 locations on Otter Creek, 4 out of 5 locations on the North Branch Winooski River, 7 out of 10 locations on the Mad River, 19 out of 72 locations on the Winooski River, and 21 out of 64 locations on the Lamoille River. The water-surface elevation AEPs at 30 locations are greater than streamflow AEPs, indicating that the observed water-surface elevation is less than what would be expected given the observed streamflow applied to the hydraulic model in the FEMA flood insurance study. These locations include 2 out of 5 locations on the White River, 1 out of 5 locations on the North Branch Winooski River, 6 out of 18 locations on the Dog River, 13 out of 72 locations on the Winooski River, and 8 out of 64 locations on the Lamoille River.

Flooding in the town of Waterbury, Vermont, from the Winooski River on July 11, 2023. Photograph by the University of Vermont Spatial Analysis Laboratory.
Discrepancies between elevations in the flood insurance study models and elevations observed in the July 2023 flood, given a known observed flow, have several possible causes. Discrepancies could be caused by the possible geomorphic or structural changes that may have taken place at the structure between the flood insurance study analysis and the July 2023 flood. Another possible cause of elevation discrepancies is the error in determining the elevation from a plot of the flood-frequency water-surface elevation profiles in the flood insurance study. Choosing the incorrect location and (or) reading the incorrect elevation from the profile plot may introduce errors because of the linear interpolation used to develop the profiles between surveyed cross-sections and because of the plot scale. The amount of the error is dependent in part on the rate of change of the profile plot near the structure of interest. There is also uncertainty in the HWM elevation based on the quality of the HWM. In addition, hydraulic models from which elevations are obtained may not have been calibrated if there had not been a flood of that magnitude at that location, during the period of record, and before the current flood insurance study. Data collected during and after the July 2023 flood may be used to calibrate hydraulic models more accurately in the future.
Summary
On July 9–11, 2023, a slow-moving rainstorm caused catastrophic flooding in various parts of Vermont, which resulted in a declaration of a state of emergency by President Biden. The storm produced 48-hour rainfall totals exceeding 9 inches in some locations, resulting in millions of dollars in damages. The high amount of rainfall, which led to above-normal streamflow and saturated soil, caused several rivers to peak at record levels. In some cases, water levels exceeded previous records set by Tropical Storm Irene in 2011.
The U.S. Geologic Survey (USGS), in cooperation with the Federal Emergency Management Agency (FEMA), collected and analyzed data that summarized the July 9–12, 2023, flooding in Vermont. These data include peak streamflow and peak water-surface elevation recorded at 82 USGS gages during the flood; streamflows for selected annual exceedance probabilities (AEPs) at 80 USGS streamgages characterized by the flood; and peak water-surface elevations from 547 high-water marks (HWMs) at bridges, dams, and major infrastructure sites.
As a result of this flood, 11 USGS streamgages with 12 to 97 years of record had peak streamflows that were the highest on record. Five USGS streamgages recorded peak streamflow with an AEP between 2 and 1 percent. Eight USGS streamgages recorded a peak streamflow with an AEP between 1 and 0.2 percent. Two streamgages (North Branch Winooski River at Wrightsville, Vt. [station 04285500], and Sunny Brook near Montpelier, Vt. [station 04287300]) recorded peak streamflow with an AEP less than or equal to 0.2 percent.
The streamflows and water-surface elevations recorded at 45 USGS streamgages during Tropical Storm Irene in 2011 were compared with those of the July 2023 flood. Of these 45 streamgages, 20 recorded peaks during the July 2023 flood that were greater than Tropical Storm Irene. Following the 2023 event, 103 HWMs on 17 rivers were located and surveyed near 2011 HWMs to provide a comparison between the two events. The July 2023 flood had greater water-surface elevations at 32 of these 103 locations.
The hydrology and the hydraulics of preliminary or effective FEMA flood insurance studies were evaluated in the context of the July 2023 flood. The hydrologic evaluation of FEMA flood insurance studies was made by comparing statistical streamflows at 26 USGS streamgage locations documented in FEMA flood insurance studies to updated [2024] statistical streamflows which incorporated the 2023 flood data at these same streamgages. Twenty-one streamgages had more than a 10 percent difference between the 1-percent AEP statistical streamflows found in the preliminary or effective flood insurance studies and the updated 1-percent AEP statistical streamflows using the 2023 flood data.
The hydraulic evaluation of the FEMA flood insurance studies was made at 10 streamgages and 184 HWMs. Of the 194 analyzed locations, 106 show good alignment between the AEP of the 2023 water-surface elevations and the AEP of the 2023 peak streamflow, indicating that the streamflows and peak water-surface elevations observed in 2023 support the hydraulic model in the preliminary or effective FEMA flood insurance study. Of the 98 peak water surface elevations with poor alignment, 56 had higher water-surface elevations than expected, and 30 had lower water-surface elevations than expected.
Selected References
Banacos, P., 2023, The great Vermont flood of 10–11 July 2023—Preliminary meteorological summary: National Weather Service web page, accessed February 28, 2024, at https://www.weather.gov/btv/The-Great-Vermont-Flood-of-10-11-July-2023-Preliminary-Meteorological-Summary.
Benson, M.A., 1962, Factors influencing the occurrence of floods in a humid region of diverse terrain: U.S. Geological Survey Water-Supply Paper 1580–B, 64 p., 1 pl. [Also available at https://doi.org/10.3133/wsp1580B.]
Benson, M.A., and Dalrymple, T., 1967, General field and office procedures for indirect discharge measurements: U.S. Geological Survey Techniques of Water-Resources Investigations, book 3, chap. A1, 30 p. [Also available at https://doi.org/10.3133/twri03A1.]
Cohn, T.A., Berenbrock, C., Kiang, J.E., and Mason, R.R., Jr., 2012, Calculating weighted estimates of peak streamflow statistics: U.S. Geological Survey Fact Sheet 2012–3038, 4 p., accessed March 4, 2024, at https://doi.org/10.3133/fs20123038.
Cohn, T.A., Lane, W.M., and Baier, W.G., 1997, An algorithm for computing moments-based flood quantile estimates when historical flood information is available: Water Resources Research, v. 33, no. 9, p. 2089–2096. [Also available at https://doi.org/10.1029/97WR01640.]
Cohn, T.A., Lane, W.M., and Stedinger, J.R., 2001, Confidence intervals for expected moments algorithm flood quantile estimates: Water Resources Research, v. 37, no. 6, p. 1695–1706. [Also available at https://doi.org/10.1029/2001WR900016.]
Community Collaborative Rain, Hail & Snow Network, [variously dated], [Daily precipitation reports across the nations]: Colorado Climate Center web page, accessed January 29, 2024, at https://www.cocorahs.org/.
Dupigny-Giroux, L.-A., and Hogan, S., 2011, Initial climate impacts summary—August 2011: Vermont State Climate Office, 7 p., accessed June 24, 2024, at https://www.uvm.edu/~vtstclim/Documents/pdfs/VT_August_2011.pdf.
England, J.F., Jr., Cohn, T.A., Faber, B.A., Stedinger, J.R., Thomas, W.O., Jr., Veilleux, A.G., Kiang, J.E., and Mason, R.R., Jr., 2018, Guidelines for determining flood flow frequency—Bulletin 17C (ver. 1.1, May 31, 2019): U.S. Geological Survey Techniques and Methods, book 4, chap. B5, 148 p., accessed December 15, 2023, at https://doi.org/10.3133/tm4B5.
Federal Emergency Management Agency [FEMA], 1979, Flood insurance study—City of Newport, Vermont; Orleans County: Federal Emergency Management Agency Flood Insurance Study 500086V000, 29 p., accessed July 19, 2024, at https://msc.fema.gov/portal/home.
Federal Emergency Management Agency [FEMA], 1980a, Flood insurance study—Town of Burke, Vermont; Caledonia County: Federal Emergency Management Agency Flood Insurance Study 500025V000, 52 p., accessed July 19, 2024, at https://msc.fema.gov/portal/home.
Federal Emergency Management Agency [FEMA], 1980b, Flood insurance study—Town of Canaan, Vermont, Essex County: Federal Emergency Management Agency Flood Insurance Study 500046V000, 37 p., accessed July 19, 2024, at https://msc.fema.gov/portal/home.
Federal Emergency Management Agency [FEMA], 1980c, Flood insurance study—Town of Troy, Vermont; Orleans County: Federal Emergency Management Agency Flood Insurance Study 500089V000, 40 p., accessed July 19, 2024, at https://msc.fema.gov/portal/home.
Federal Emergency Management Agency [FEMA], 1981a, Flood insurance study—Town of Fairfax, Vermont; Franklin County: Federal Emergency Management Agency Flood Insurance Study 500052V000, 27 p., accessed July 19, 2024, at https://msc.fema.gov/portal/home.
Federal Emergency Management Agency [FEMA], 1981b, Flood insurance study—Town of Fletcher, Vermont; Franklin County: Federal Emergency Management Agency Flood Insurance Study 500054V000, 20 p., accessed July 19, 2024, at https://msc.fema.gov/portal/home.
Federal Emergency Management Agency [FEMA], 1981c, Flood insurance study—Town of Georgia, Vermont; Franklin County: Federal Emergency Management Agency Flood Insurance Study 500217V000, 23 p., accessed July 19, 2024, at https://msc.fema.gov/portal/home.
Federal Emergency Management Agency [FEMA], 1982, Flood insurance study—Town of Swanton, Vermont; Franklin County: Federal Emergency Management Agency Flood Insurance Study 500220V000, 33 p., accessed July 19, 2024, at https://msc.fema.gov/portal/home.
Federal Emergency Management Agency [FEMA], 1983, Flood insurance study—Town of Berkshire, Vermont; Franklin County: Federal Emergency Management Agency Flood Insurance Study 500049V000, 24 p., accessed July 19, 2024, https://msc.fema.gov/portal/home.
Federal Emergency Management Agency [FEMA], 1984, Flood insurance study—Town of Middlebury, Vermont; Addison County: Federal Emergency Management Agency Flood Insurance Study 500008V000, 35 p., accessed July 19, 2024, at https://msc.fema.gov/portal/home.
Federal Emergency Management Agency [FEMA], 1986a, Flood insurance study—Town of Ferrisburgh, Vermont; Addison County: Federal Emergency Management Agency Flood Insurance Study 500002V000, 21 p., accessed July 19, 2024, at https://msc.fema.gov/portal/home.
Federal Emergency Management Agency [FEMA], 1986b, Flood insurance study—Town of New Haven, Vermont; Addison County: Federal Emergency Management Agency Flood Insurance Study 500009V000, 36 p., accessed July 19, 2024, at https://msc.fema.gov/portal/home.
Federal Emergency Management Agency [FEMA], 1986c, Flood insurance study—Town of Vergennes, Vermont; Addison County: Federal Emergency Management Agency Flood Insurance Study 500011V000, 17 p., accessed July 19, 2024, at https://msc.fema.gov/portal/home.
Federal Emergency Management Agency [FEMA], 1986d, Flood insurance study—Town of St. Johnsbury, Vermont; Caledonia County: Federal Emergency Management Agency Flood Insurance Study 500031V000, 42 p., accessed July 19, 2024, at https://msc.fema.gov/portal/home.
Federal Emergency Management Agency [FEMA], 1987, Flood insurance study—Town of Johnson, Vermont; Lamoille County: Federal Emergency Management Agency Flood Insurance Study 500063V000, 32 p., accessed July 19, 2024, at https://msc.fema.gov/portal/home.
Federal Emergency Management Agency [FEMA], 1991, Flood insurance study—Town of Randolph, Vermont; Orange County: Federal Emergency Management Agency Flood Insurance Study 500073V000, 27 p., accessed July 19, 2024, at https://msc.fema.gov/portal/home.
Federal Emergency Management Agency [FEMA], 1992, Flood insurance study—Town of Concord, Vermont; Essex County: Federal Emergency Management Agency Flood Insurance Study 500207V000, 22 p., accessed July 19, 2024, at https://msc.fema.gov/portal/home.
Federal Emergency Management Agency [FEMA], 1994, Flood insurance study—Town of Barton, Vermont; Orleans County: Federal Emergency Management Agency Flood Insurance Study 500081V000, 59 p., accessed July 19, 2024, at https://msc.fema.gov/portal/home.
Federal Emergency Management Agency [FEMA], 1999, Flood insurance study—Town and Village of Newbury, Vermont; Orange County: Federal Emergency Management Agency Flood Insurance Study 500237V000, 22 p., accessed July 19, 2024, at https://msc.fema.gov/portal/home.
Federal Emergency Management Agency [FEMA], 2002, Flood insurance study—Town of Barnet, Vermont; Caledonia County: Federal Emergency Management Agency Flood Insurance Study 500024V000, 39 p., accessed July 19, 2024, at https://msc.fema.gov/portal/home.
Federal Emergency Management Agency [FEMA], 2005, Flood insurance study—Town of Stowe, Vermont; Lamoille County: Federal Emergency Management Agency Flood Insurance Study 500066V000A, 37 p., accessed July 19, 2024, at https://msc.fema.gov/portal/home.
Federal Emergency Management Agency [FEMA], 2006, Flood insurance study—Cheshire County, New Hampshire: Federal Emergency Management Agency Flood Insurance Study 33005CV001A, 100 p., accessed July 19, 2024, at https://msc.fema.gov/portal/home.
Federal Emergency Management Agency [FEMA], 2007a, Flood insurance study—Windham County, Vermont (all jurisdictions): Federal Emergency Management Agency Flood Insurance Study 50025CV001A, 135 p., accessed August 8, 2023, at https://map1.msc.fema.gov/data/50/S/PDF/50025CV001A.pdf?LOC=95c1a1314d2034d6a33e51c3f0ea5e71.
Federal Emergency Management Agency [FEMA], 2007b, Flood insurance study—Windsor County, Vermont: Federal Emergency Management Agency Flood Insurance Study 50027CV001A, 121 p., accessed July 19, 2024, at https://msc.fema.gov/portal/home.
Federal Emergency Management Agency [FEMA], 2008a, Flood insurance study—Grafton County, New Hampshire: Federal Emergency Management Agency Flood Insurance Study 33009CV001B, 79 p., accessed July 19, 2024, at https://msc.fema.gov/portal/home.
Federal Emergency Management Agency [FEMA], 2008b, Flood insurance study—Rutland County, Vermont: Federal Emergency Management Agency Flood Insurance Study 50021CV001A, 86 p., accessed July 19, 2024, at https://msc.fema.gov/portal/home.
Federal Emergency Management Agency [FEMA], 2013a, Flood insurance study—Coos County, New Hampshire: Federal Emergency Management Agency Flood Insurance Study 33007CV001A, 96 p., accessed July 19, 2024, at https://msc.fema.gov/portal/home.
Federal Emergency Management Agency [FEMA], 2013b, Flood insurance study—Washington County, Vermont: Federal Emergency Management Agency Flood Insurance Study 50023CV001A, 82 p., accessed July 19, 2024, at https://msc.fema.gov/portal/home.
Federal Emergency Management Agency [FEMA], 2014, Flood insurance study—Chittenden County, Vermont: Federal Emergency Management Agency Flood Insurance Study 50007CV001B, 75 p., accessed July 19, 2024, at https://msc.fema.gov/portal/home.
Federal Emergency Management Agency [FEMA], 2015, Flood insurance study—Bennington County, Vermont: Federal Emergency Management Agency Flood Insurance Study 50003CV000A, 123 p., accessed July 19, 2024, at https://msc.fema.gov/portal/home.
Federal Emergency Management Agency [FEMA], 2024, Two months later, recovery from July storms well underway: Federal Emergency Management Agency Press Release 46, accessed February 6, 2024, at https://www.fema.gov/press-release/20231027/two-months-later-recovery-july-storms-well-underway.
Koenig, T.A., Bruce, J.L., O’Connor, J.E., McGee, B.D., and Holmes, R.R., Jr., Hollins, R., Forbes, B.T., Kohn, M.S., Schellekens, M.F., Martin, Z.W., and Peppler, M.C., 2016, Identifying and preserving high-water mark data: U.S. Geological Survey Techniques and Methods, book 3, chap. A24, 47 p., accessed December 18, 2023, at https://doi.org/10.3133/tm3A24.
LeNoir, J.M., 2024, Vermont high-water mark data viewer: U.S. Geological Survey web page, accessed November 7, 2024, at https://geonarrative.usgs.gov/vermontfloodireneandjuly2023/.
Lombard, P.J., 2010, Flood of April and May 2008 in northern Maine: U.S. Geological Survey Scientific Investigations Report 2010–5003, 17 p., accessed December 15, 2023, at https://doi.org/10.3133/sir20105003.
Medalie, L., and Olson, S.A., 2013, High-water marks from flooding in Lake Champlain from April through June 2011 and tropical storm Irene in August 2011 in Vermont: U.S. Geological Survey Data Series 763, 11 p., 3 apps., accessed December 15, 2023, at https://doi.org/10.3133/ds763.
Matthai, H.F., 1967, Measurement of peak discharge at width contractions by indirect methods: U.S. Geological Survey Techniques of Water-Resources Investigations, book 3, chap. A4, 44 p. [Also available at https://doi.org/10.3133/twri03A4.]
National Oceanic and Atmospheric Administration, 2023a, Statewide time series: National Oceanic and Atmospheric Administration Climate at a Glance Statewide Time Series database, accessed December 15, 2023, at https://www.ncei.noaa.gov/access/monitoring/climate-at-a-glance/statewide/time-series.
National Oceanic and Atmospheric Administration, 2023b, WFO Burlington, VT spotter reports: National Weather Service interactive map, accessed December 19, 2023, at https://www.weather.gov/btv/spotterReports?report=20230711.
National Oceanic and Atmospheric Administration, [undated], Flooding in Vermont: National Weather Service web page, accessed June 24, 2024, at https://www.weather.gov/safety/flood-states-vt.
National Soil Moisture Network, 2023, 5 cm moisture percentile (regression Kriging interpolation) on Sat Jul 08 2023: National Soil Moisture Network interactive map, accessed December 18, 2023, at http://nationalsoilmoisture.com/hist_asc_data/rk_05_20230709.html.
Noll, M.L., and Rydlund, P.H., 2020, Procedures and best practices for trigonometric leveling in the U.S. Geological Survey: U.S. Geological Survey Techniques and Methods, book 11, chap. D3, 94 p., app., accessed December 15, 2023, at https://doi.org/10.3133/tm11D3.
Northeast Regional Climate Center and Natural Resources Conservation Service, 2024, Extreme precipitation in New York and New England (version 2.0): Northeast Regional Climate Center interactive web tool, accessed January 29, 2024, at https://precip.eas.cornell.edu/#/.
Olson, S.A., 2014, Estimation of flood discharges at selected annual exceedance probabilities for unregulated, rural streams in Vermont, with a section on Vermont regional skew regression, by Veilleux, A.G.: U.S. Geological Survey Scientific Investigations Report 2014–5078, 27 p., apps., accessed at https://doi.org/10.3133/sir20145078.
Olson, S.A., and Bent, G.C., 2013, Annual exceedance probabilities of the peak discharges of 2011 at streamgages in Vermont and selected streamgages in New Hampshire, western Massachusetts, and northeastern New York: U.S. Geological Survey Scientific Investigations Report 2013–5187, 17 p., apps., accessed January 29, 2024, at https://doi.org/10.3133/sir20135187.
Olson, S.A., LeNoir, J.M., Kalmon, R.D., and Ahearn, E.A., 2025, Vermont flood of July 2023 data: U.S. Geological Survey data release, https://doi.org/10.5066/P14XBBAT.
Ries, K.G., III, comp., 2007, The national streamflow statistics program—A computer program for estimating streamflow statistics for ungaged sites: U.S. Geological Survey Techniques and Methods, book 4, chap. A6, 37 p., accessed April 21, 2022, at https://doi.org/10.3133/tm4A6.
Ries, K.G., III, and Friesz, P.J., 2000, Methods for estimating low-flow statistics for Massachusetts streams: U.S. Geological Survey Water-Resources Investigations Report 2000–4135, 81 p. [Also available at https://doi.org/10.3133/wri004135.]
Ries, K.G., III, Newson J.K., Smith, M.J., Guthrie, J.D., Steeves, P.A., Haluska, T.L., Kolb, K.R., Thompson, R.F., Santoro, R.D., and Vraga, H.W., 2017, StreamStats, version 4: U.S. Geological Survey Fact Sheet 2017–3046, 4 p., accessed January 29, 2024, at https://doi.org/10.3133/fs20173046.
Roland, M.A., and Stuckey, M.H., 2008, Regression equations for estimating flood flows at selected recurrence intervals for ungaged streams in Pennsylvania: U.S. Geological Survey Scientific Investigations Report 2008–5102, 57 p., accessed September 4, 2020, at https://doi.org/10.3133/sir20085102. [Superseded by USGS Scientific Investigations Report 2019–5094.]
Rydlund, P.H., Jr., and Densmore, B.K., 2012, Methods of practice and guidelines for using survey-grade global navigation satellite systems (GNSS) to establish vertical datum in the United States Geological Survey: U.S. Geological Survey Techniques and Methods, book 11, chap. D1, 102 p., apps., https://doi.org/10.3133/tm11d1.
U.S. Army Corp of Engineers, 2023, Hydrologic Engineering Center statistical software package: U.S. Army Corps of Engineers Hydrologic Engineering Center software website, accessed March 4, 2024, at https://www.hec.usace.army.mil/software/hec-ssp/.
U.S. Geological Survey [USGS], 2024a, Flood event viewer: U.S. Geological Survey Short-Term Network data portal, accessed on February 28, 2024, at https://stn.wim.usgs.gov/fev/.
U.S. Geological Survey [USGS], 2024b, USGS water data for Vermont: U.S. Geological Survey National Water Information System data, accessed February 28, 2024, at https://doi.org/10.5066/F7P55KJN. [Site specific information referenced at https://waterdata.usgs.gov/vt/nwis/nwis.]
U.S. Geological Survey [USGS], 2024c, Water resources application software—PeakFQ: U.S. Geological Survey web page, accessed March 4, 2024, at https://water.usgs.gov/software/peakfq.html.
U.S. Geological Survey [USGS], [undated], Comparison of streamflow maps: U.S. Geological Survey WaterWatch interactive map, accessed June 24, 2024, at https://waterwatch.usgs.gov/index.php?st=vt&huc=&go=GO&mmt=pa01a&smt=&id=wwchart_map&mdt=20110826&mdt2=20230707. [Link includes presets for “Vermont” as the geographic area, “Daily Streamflow (all days)” as the map type, “Point” as the subtype, “20110826” as the date on the map on the left, and “20230707” as the date on the map on the right.]
Veilleux, A.G., Cohn, T.A., Flynn, K.M., Mason, R.R., Jr., and Hummel, P.R., 2013, Estimating magnitude and frequency of floods using the PeakFQ 7.0 program: U.S. Geological Survey Fact Sheet 2013–3108, 2 p., accessed March 4, 2023, at https://doi.org/10.3133/fs20133108.
White House, 2023, President Joseph R. Biden, Jr. approves Vermont emergency declaration: White House Press Briefing, July 11, accessed June 17, 2024, at https://www.whitehouse.gov/briefing-room/presidential-actions/2023/07/11/president-joseph-r-biden-jr-approves-vermont-emergency-declaration-2/. [Page no longer available at original URL; archived version of the page available at https://bidenwhitehouse.archives.gov/briefing-room/presidential-actions/2024/08/09/president-joseph-r-biden-jr-approves-vermont-emergency-declaration- 3/.]
Conversion Factors
Datums
Vertical coordinate information is referenced to the North American Vertical Datum of 1988 (NAVD 88).
Horizontal coordinate information is referenced to the North American Datum of 1983 (NAD 83).
Elevation, as used in this report, refers to distance above the vertical datum.
Supplemental Information
A water year is the 12-month period from October 1 through September 30 of the following year and is designated by the calendar year in which it ends.
Usable storage is the volume of water normally available for release from a body of water below the stage of the maximum controllable level and is given in millions of cubic feet (Mft3).
For more information, contact:
Director, New England Water Science Center
U.S. Geological Survey
10 Bearfoot Road
Northborough, MA 01532
dc_nweng@usgs.gov
or visit our website at
Disclaimers
Any use of trade, firm, or product names is for descriptive purposes only and does not imply endorsement by the U.S. Government.
Although this information product, for the most part, is in the public domain, it also may contain copyrighted materials as noted in the text. Permission to reproduce copyrighted items must be secured from the copyright owner.
Suggested Citation
Smith, T.L., Olson, S.A., LeNoir, J.M., Kalmon, R.D., and Ahearn, E.A., 2025, Flood of July 2023 in Vermont (ver. 1.1, May 22, 2025): U.S. Geological Survey Scientific Investigations Report 2025–5016, 21 p., https://doi.org/10.3133/sir20255016.
ISSN: 2328-0328 (online)
Study Area
| Publication type | Report |
|---|---|
| Publication Subtype | USGS Numbered Series |
| Title | Flood of July 2023 in Vermont |
| Series title | Scientific Investigations Report |
| Series number | 2025-5016 |
| DOI | 10.3133/sir20255016 |
| Edition | Version 1.0: May 19, 2025; Version 1.1: May 22, 2025 |
| Publication Date | May 19, 2025 |
| Year Published | 2025 |
| Language | English |
| Publisher | U.S. Geological Survey |
| Publisher location | Reston, VA |
| Contributing office(s) | New England Water Science Center |
| Description | Report; vii, 21 p.; 2 Data Releases: Application Site |
| Country | United States |
| State | Vermont |
| Online Only (Y/N) | Y |
| Additional Online Files (Y/N) | Y |