

World Minerals Outlook—Cobalt, Gallium, Helium, Lithium, Magnesium, Palladium, Platinum, and Titanium Through 2029
Links
- Document: Report (2.16 MB pdf) , HTML , XML
- Data Release: USGS data release - World minerals outlook to 2029—Cobalt, gallium, helium, lithium, magnesium, palladium, platinum, and titanium data
- Version History: Version History (4.64 KB txt)
- NGMDB Index Page: National Geologic Map Database Index Page (html)
- Download citation as: RIS | Dublin Core
Preface
Every segment of the economy depends on materials that comprise or derive from nonfuel mineral commodities, whether directly or indirectly. This reliance is not new because human societies have used nonfuel mineral commodities—including copper, iron, gold, lead, mercury, silver, and tin—since antiquity to forge tools, build civilizations, and explore the world. However, the number of mineral commodities currently used and the rate at which they are extracted, processed, and consumed are unprecedented. Our ever-expanding understanding of the uses of mineral commodities and the elements contained within these commodities has enabled advances in science and technology, rapid economic growth, and rising living standards.
As demand continues to grow and evolve, evaluating the current and potential future supplies of mineral commodities can help to inform whether they will be sufficient to meet demand growth and also help to inform the potential for supply disruption. It is notable that the extraction and production of many commodities, especially nonferrous minor and precious metals, is concentrated in a few countries. Countries currently supplying mineral commodities have the advantage of in-place infrastructure, skilled labor, and known mineral endowments that provide them with better investment opportunities for new and expanded production. Countries with low domestic mineral endowments must either invest abroad or import to meet their mineral requirements. This dependency exposes the downstream industries that rely on mineral commodities to numerous risk factors, including geopolitical tension, currency manipulation and volatility, property rights disputes, natural disasters, trade restrictions, energy price volatility, and resource nationalism.
The goal of this publication is to provide recent mine production and future capacity outlooks for an initial group of nonfuel mineral commodities. This first “World Minerals Outlook” includes information for cobalt, gallium, helium, lithium, magnesium, palladium, platinum, and titanium. For each of these commodities, a possible future supply scenario is presented based on reported data of planned and announced mine production capacity at the time of this report. Moreover, the scope of this world outlook is limited to the 2025–2029 timeframe—the time horizon that affords an assessment of greenfield or brownfield projects and the expansion (or closure) of existing mines that might occur with a reasonable degree of certainty.
Specifically, the capacity projections for this 5-year time horizon include:
• currently operating facilities;
• planned expansion projects that have met the typical milestones associated with a mining or processing investment, such as proven or probable reserves, a completed feasibility study, established financing, approved permitting, and project timelines; and
• the capacity of those facilities that have announced short-term reductions in production or temporary care-and-maintenance status (typically owing to oversupply and low prices in the commodity market) but can be brought online rather quickly. Any mines or processing operations that had indications of future closures, even if those mines were operational in 2024, were excluded from capacity projections in this report.
Readers may recognize the similarity of this work to the USGS “Regional Summaries” presented in Volume III: Area Reports: International of the USGS Minerals Yearbook series before 2016. This “World Minerals Outlook” series is an outgrowth and expansion of the “Regional Summaries” that combines historical production and capacity data and an outlook for future supply capacity. This publication also complements other USGS publications, including the annual Mineral Commodity Summaries and other Minerals Yearbook series.
Abstract
Given the rapid expansion in the demand for mineral commodities that underpin worldwide economic growth and technological advancement, information regarding expected country-level mine production and production capacity is becoming increasingly important to industry stakeholders, end users, and policymakers. Production capacity can limit future supply, depending on how rapidly that capacity is able to expand. Current capacity can be evaluated on the basis of past production. Decreases to future capacity can be taken into account from announcements of planned shutdowns of mines or processing facilities, which are frequently publicized well in advance of such closures. Likewise, capacity expansions, which usually involve multiple stages—such as permitting, financing, and construction (all of which take time)—can also be estimated. As such, it is possible to evaluate midterm future capacity based on estimates of today’s capacities along with consideration of future investment plans. This World Minerals Outlook provides estimated capacities for cobalt, gallium, helium, lithium, magnesium, palladium, platinum, and titanium for 2025 through 2029.
The results of this analysis indicate that two mineral commodities important to the manufacture of lithium-ion batteries—cobalt and lithium—are expected to have large capacity growth in the next few years, likely owing to expectations for increased demand for these batteries. For gallium, helium, palladium, and platinum, capacity is expected to remain stable or exhibit moderate growth. Still, these expected capacity levels are higher than current production, allowing for future production growth. The production capacity outlook is opaque for magnesium and titanium metal, which have a significant fraction of current production in nonmarket economies, such as China and Russia. Ultimately, though, where free market conditions prevail, full utilization of capacity potential for those commodities is likely to depend on supply deficits and prices that are above production costs.
Plain Language Summary
Understanding mine production and potential capacity growth can help inform the growing need for the minerals that support economic growth, technological change, and national security for businesses and policy makers. How much a mine can produce affects future supply, especially as capacities can change over time. This report estimates production capacities for cobalt, gallium, helium, lithium, magnesium, palladium, platinum, and titanium through 2029. The results of the analysis suggest that cobalt and lithium, which are key for lithium-ion batteries, are likely to see significant increases in production capacity owing to rising demand, whereas gallium and platinum are expected to see stable or moderate growth, exceeding current production levels. However, the future for magnesium and titanium is less clear because much of their production comes from countries with nonmarket economies, like China and Russia. In free markets, using full production capacity is likely to depend on supply shortages and prices being above production costs.
Introduction
The markets for mineral commodities exhibit fluctuations that largely follow the overall business cycle. However, mineral commodity markets are also influenced by factors such as government intervention, high concentration of production, production costs, exchange rates, and trade policy. Some nonfuel mineral commodities, such as aluminum, copper, iron ore, steel, and tin, feature a homogenous supply, many producers, and numerous buyers. Other mineral commodities, such as cobalt, gallium, germanium, lithium, and rare earths, have end uses with highly customized specifications and much smaller markets. For example, the global market for steel in 2024 was approximately 1.9 billion metric tons, whereas the market for mined cobalt was only about 240,000 metric tons in that year (U.S. Geological Survey, 2025). Still other mineral commodities, such as gold, platinum-group metals, and silver, are used as investments, which can create disruptions that are unrelated to underlying market fundamentals.
Generally, prices rise as demand exceeds supply. The market restores equilibrium when supply has increased, demand has decreased, or when there is a combination of these two factors. If additional existing capacity is available, supply can respond quickly to rising demand, but if mines or processing plants are operating at or close to full capacity, new capacity will be required, which takes time and capital. Changes in demand and supply can transpire gradually or can happen suddenly. Abrupt changes in demand or supply can usually be tied to some event, whether manmade or natural. For example, a government policy that encourages the use of electric vehicles (EVs) can create a sudden surge in demand for the materials needed to manufacture them. On the supply side, production could be disrupted owing to natural disasters, labor strikes, higher energy costs, government quotas and regulations, or trade policy. Most changes, however, happen gradually over time. Global demand for most mineral commodities has been increasing over the past few decades owing to population and economic growth. Supply has grown for most commodities, too, with new (greenfield) mines taking approximately 5 to 30 years to develop, depending on the jurisdiction and size of the deposit (United Nations Environment Programme, International Resource Panel, 2024).
Market dynamics in the mineral commodity sector generally adhere to standard economic theory. Still, they are incredibly difficult to forecast given the myriad of factors that can affect demand and supply. Efforts to model mineral commodity business cycles take these dynamics into consideration by assessing: (1) the interactions between various supply chain nodes, (2) the quantity of a mineral commodity needed to produce a good, (3) changes in a mineral commodity’s principal end-use sectors, (4) economic growth, (5) technological change, and (6) the price elasticity of demand and supply. Examples from literature may be found for forecasting for several mineral commodities using methods such as agent-based modeling (Riddle and others, 2021) and system dynamics modeling (Nguyen and others, 2021).
The opacity exhibited in several mineral commodity markets makes price elasticity and market dynamics difficult to capture with models. For example, many of the low-volume-consumption mineral commodities do not have robust price discovery mechanisms because transactions are private and are held between few buyers and sellers. From a modeling perspective, those mineral commodities do not have published price elasticities, although recent additions to the literature have attempted to fill that gap (Shojaeddini, Alonso, and Nassar, 2024).
In view of the complexity of market dynamics, there are alternative, simple approaches that provide insights through models that assess supply and demand outlooks separately. Many such models, such as those centered on energy transition minerals, have focused on the demand side. In addition to the material intensity of the technologies that underpin the energy transition (for example, EVs, solar photovoltaics, wind turbines), the rate of adoption of these new technologies in the next few years may be a significant factor when considering the demand growth of mineral commodities. On the supply side, mineral reserves and resources, mineral deposit development, activities such as exploration, new mining projects, capacity expansion, and closures all depend on profitability. Because profitability is partly a reflection of operational decisions, a viable approach is to assess the supply side by considering such factors as: (1) historical mineral production, (2) site-level production, (3) site-level capacity, (4) new projects, (5) expansions and (6) closures based on mine-life and project development stages.
This World Minerals Outlook report highlights the supply side of the listed mineral commodities by considering country-level capacity data. It represents a synthesis of government, industry, and company reports available as of June 2024 on near-term production, expansion, development, and closure for select nonfuel mineral commodities globally. Perceptions regarding the world market outlook for price, demand, and supply are assumed to be embedded in companies’ decisions to produce, close, expand, or develop mineral deposits. These results are not a forecast, nor an endorsement of any project, and, therefore, should not be relied upon for financial investments or decisions.
Summaries are provided in the following pages for each nonfuel mineral commodity covered in this report. Specifically, the summaries review each commodity’s historical production and the outlook for future production capacity. This outlook estimates capacity for projects where the mineral is a main product, coproduct, or byproduct.
Production and Capacity Utilization
Production capacity provides an estimate of the maximum production quantity that can be expected in the future based on known projects that could be online in any given year. Production capacity expansion can be evaluated from announced projects, whereas capacity shutdowns can be tracked by identifying aging plants, depleted resources, and announced life of mine and mine closure plans. Given typical timelines for building new mines and the 5-year timeframe of this study, planned construction were deemed to be a good estimate of future capacity. Meanwhile, mine capacity that has been idled owing to temporary price declines can still be brought back online in the future if the site is put on care-and-maintenance status. For this study, capacity that is on care-and-maintenance status is considered available.
Production is more closely tied to price and more subject to disruptions than capacity, making future production outlooks much more challenging to assess than future capacity. For example, there can be production disruptions from events such as labor strikes, natural disasters, political upheaval, and power outages. Forecasting price volatility and quantifying potential production disruptions using price elasticity of supply are outside the scope of this publication.
Based on historical data of U.S. capacity utilization, the expectation is that, across a given industry, production is a percentage of total capacity that varies over time and usually in accordance with price fluctuations throughout the business cycle. Although any single facility is capable of operating above capacity temporarily, doing so for an extended amount of time increases the risk of worker safety, damage to equipment and potential violations of emissions permits. On the other hand, a low operating rate is usually a sign of poor economic performance and is inefficient in profit-driven companies. The U.S. Federal Reserve publishes historical data of capacity utilization collected by the Federal Reserve Board (Board of Governors of the Federal Reserve System, 2024a) for industries related to mineral commodities and to manufacturing, including mining, primary and fabricated metals, nonmetallic mineral products, and chemicals. The USGS provides production data to the Federal Reserve Board monthly on 16 mineral commodities and provides capacity utilization rates twice a year to support the analysis. Summary data are also published for the manufacturing industry as a whole.
Domestic capacity utilization in these mineral commodity-adjacent industries (fig. 1) has generally fluctuated between 65 and 90 percent during the past 20 or more years. Notable exceptions include the nonmetallic mineral product sector (North American Industry Classification System [NAICS] industry code 327) and the primary metal sector (NAICS 331), which saw capacity utilization plunge to 45 percent and 50 percent, respectively, during the 2007–9 recession. Because these sectors are used in building and construction, it stands to reason that their utilization rates would struggle during an economic downturn (Bureau of Economic Analysis, 2024). An anomaly was observed again starting in 2020 when capacity utilization plummeted to about 50 percent for the primary metal sector and 60 percent on average for other sectors, which is when the 2019 novel coronavirus (COVID–19) spread to the United States (Board of Governors of the Federal Reserve System, 2024b).
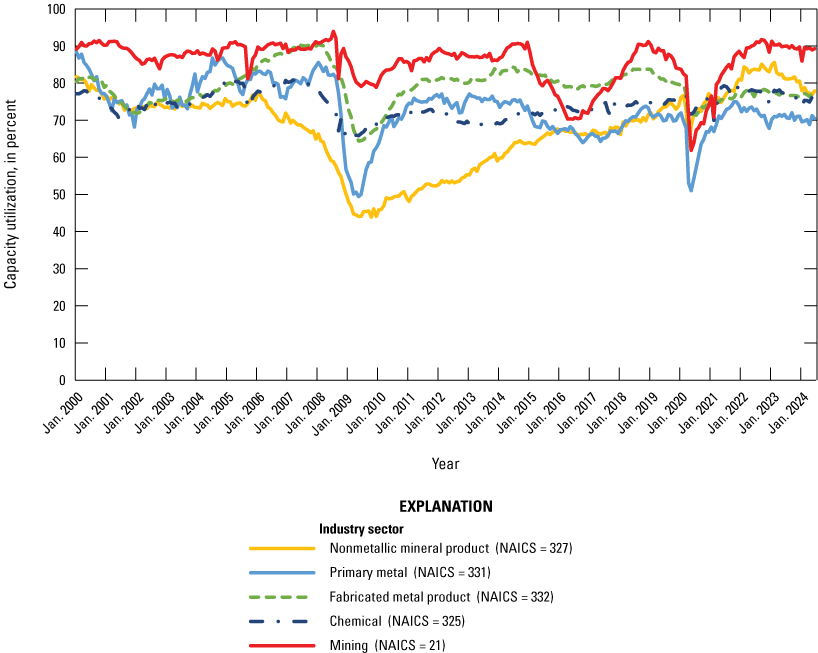
Industrial capacity utilization in the United States for 2000 through 2024; data are from Federal Reserve (2024). NAICS, North American Industry Classification System.
Figure 1 shows data for the United States only; capacity utilization rates can differ significantly across countries and are usually a function of the performance of individual mining operations on the industry cost curve. Low-cost operations tend to operate at higher capacity utilization than higher cost operations until demand reaches a level where more supply is needed in the market and the prices the market is willing to pay can justify production from the higher cost capacity. However, some countries use subsidies, tax breaks, and other incentives; this creates overcapacity and tends to keep prices and operating rates of competitors in other countries low. One example of this is China where state support for favored industry sectors has led to persistent overinvestment (Shambaugh, 2024). China’s support of its industrial sector dwarfs that sector’s competitors in relative and absolute terms. For example, in 2019 China spent 1.73 percent of its gross domestic product (GDP) on various incentive programs, including for mining and mineral commodity production (DiPippo, Mazzocco, and Scott, 2022). South Korea was second in industry investment, spending 0.67 percent as a share of GDP, whereas the United States came in seventh at 0.39 percent of GDP (DiPippo, Mazzocco, and Scott, 2022).
Investments in China have generated massive overcapacity in several critical sectors (Shambaugh, 2024). For example, as of 2023, total production of lithium-ion batteries in China totaled over 2 terawatt hours (Shambaugh, 2024), with global demand being roughly half that amount. China’s solar panel production is also roughly twice the size of global demand. In the EV market, China’s production of cars currently equals global demand but is expected to surpass global demand by 2025 (Shambaugh, 2024, citing BloombergNEF and the International Energy Agency [IEA]). Overcapacity puts downward pressure on prices and profitability for other global producers that do not benefit from government support.
China’s low operating rates increase the possibility that operations outside of China may never come to fruition because Chinese facilities can quickly increase production and keep downward pressure on prices (Boullenois, Kratz, and Rosen, 2024; Wu, Karmer, and Weidensteiner, 2024). Such different approaches to investment and capacity growth across countries add to the uncertainty in this outlook analysis. Capacity data thus provide only a rough approximation for future supply scenarios.
Methodology and Data Collection
Annual world mineral production data for 2018 through 2022 are primarily from published USGS Minerals Yearbook chapters and are provided in the accompanying data release (Alonso and others, 2025). Production data for 2024 and previous years, where unavailable from the Minerals Yearbook chapters, are based on estimates published by the USGS in the Mineral Commodity Summaries (U.S. Geological Survey, 2020, 2021, 2022, 2023, 2024, 2025).
Current capacity data are collected from annual mine- and country-level operating production and capacity data based on reports from companies, governments, and industry sources. Currently producing mines and facilities are considered operating capacity. In some cases, generally owing to poor market conditions, producers decide to idle but not fully shut down a production site. Instead, they put a facility on care-and-maintenance status or pause production on a particular production line. In those cases, the production capacity is deemed idled capacity. The sum of operating and idled capacity equals the total current estimated production capacity.
The USGS reconciled any identified discrepancies between reported capacity and production by selecting the larger value of these two on the basis of the assumption that capacity should be larger than production. For some facilities, this may be an overestimate, such as cases where production facilities were pushed to operate above reported capacity. However, over time and at the country level, this assumption should be reasonable because operating above capacity is not likely across many mines or for a significant period. Where capacity data were not available, the reported production value was used to calculate the current operating capacity rate. This second assumption would, in general, underestimate capacity because most facilities operate at less than 100 percent.
For the outlook part of the report, capacity adjustments were made for each year based on (1) announced expansions of existing mines, (2) developments of new mines with bankable or definitive feasibility studies, and (3) reported mine closures to calculate world mineral capacity outlooks through 2029 (Alonso and others, 2025). [Development timelines, reported by mining companies, are often delayed by factors including environmental, financing, infrastructure, permitting, and social issues. Some reported development dates may have been adjusted in anticipation of development delays.] Future capacity may be producing or idled but is not distinguished in this study because this analysis does not attempt to predict market conditions for determining future operation status.
Mathematically, world production capacity (W) of mineral i in year t was calculated by summing production capacity across n producing countries (j), as follows:
wherei
is the mineral or material being examined;
t
is the year being estimated;
j
producing country;
n
is the number of mineral producing countries;
Oi,j,t−1
represents the estimated operating production capacity of mineral or material i in country j during the previous year (t−1);
Ci,j,t
is the expected decrease in production capacity owing to announced closures and other factors in year t for country j;
Ei,j,t
represents the expected increase in production capacity owing to reported expansions and other factors in year t for country j; and
Di,j,t
represents the increase of production capacity owing to development in year t for country j.
The data collected for this report primarily consist of annual mine- (or country-) level production, capacity, and utilization rates and planned production, development, expansion, and closure reported by companies, governments, and industry sources. Given the short-term focus of this report, exploration or development projects without a bankable or definitive feasibility study are not included regardless of whether the company has made detailed production projections.
Mineral Outlook Through 2029
Cobalt
Cobalt concentrates are often processed into intermediate products, which are then refined into chemical compounds or metal (Shedd, 2024). Chemical compounds comprise most of the global cobalt market, by contained cobalt volume, through their use in lithium-ion battery cathode materials, the primary end use for cobalt. Lithium-ion batteries have become the leading type of battery used in EVs. Other uses for lithium-ion batteries include energy storage systems, electronics, and power tools. Alternatives, such as low-cobalt and cobalt-free cathodes do exist, with substitution motivated by high cobalt prices. Superalloys are the second largest application where cobalt is used as one of many alloying elements in corrosion-resistant, high-temperature, applications such as industrial gas turbine and jet engines.
U.S. efforts to establish domestic cobalt mining and processing are expected to be strengthened through incentives in the Bipartisan Infrastructure Law (BIL; Infrastructure Investment and Jobs Act; Public Law 117–58, 135 Stat. 429), the Inflation Reduction Act (IRA; Public Law 117–169, 136 Stat. 1818), and applications of the Defense Production Act of 1950 (DPA; Public Law 81–774, 64 Stat. 798). Though multiple North American cobalt mining and processing projects are in development, some have stalled owing to the current cobalt price environment.
Globally, the majority of cobalt supply is profitable at current prices (S&P Capital IQ, 2024). The Democratic Republic of the Congo (Congo [Kinshasa]) is the world’s leader in cobalt mining (fig. 2); however, companies owned or controlled by China accounted for most of the cobalt production in Congo (Kinshasa) (Gulley, 2024; Darton Commodities Ltd., 2025). New projects and expansions of existing mines in Congo (Kinshasa) and Indonesia are expected to continue to drive increases in mined cobalt production. These companies also have large offtake agreements resulting in significant exports of cobalt from the mining countries to China (Gulley, 2024) where cobalt ore is refined into cobalt chemicals and cobalt metal. Although most of China’s refined cobalt production is used in domestic downstream manufacturing (especially batteries), anecdotal evidence suggests that some of it is being stockpiled (Wang, 2024). Higher mine production led to a market surplus in the past 2 years, resulting in a 46‑percent decrease in the average cash price on the London Metal Exchange (LME) from 2022 to 2023, reducing incentives for new capacity (fig. 3) to come online (Argus Media, 2024). New projects and expansions of existing mines in Congo (Kinshasa) and Indonesia are expected to continue to drive increases in mined cobalt production.
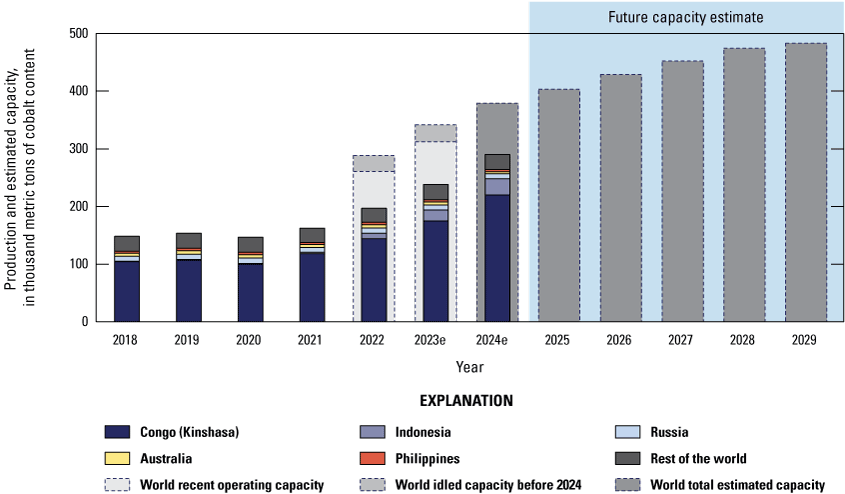
Recent and estimated production and outlook capacity of mined cobalt in thousand metric tons, cobalt content, by country, for 2018 through 2029. Countries that have cobalt mine capacity include Australia, Botswana, Brazil, Cameroon, Canada, China, Congo (Kinshasa), Cuba, Finland, Indonesia, Madagascar, Mexico, Morocco, New Caledonia, Papua New Guinea, Philippines, Russia, South Africa, Turkey, United States, Vietnam, Zambia, and Zimbabwe. Data are from Alonso and others (2025). e, estimated data.
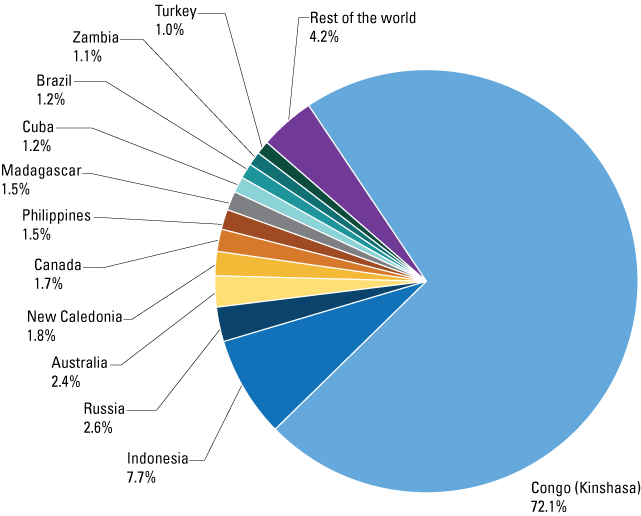
Potential capacity, by country, of cobalt mine production, estimated for 2024. All capacity status (operating, expansion, care-and-maintenance, and expected new capacity) is included. Data are from Alonso and others (2025). %, percent.
Gallium
Gallium is primarily used in the semiconductor industry where it is combined with other elements in a family of materials known as compound semiconductors (Jaskula, 2024b). Although silicon wafers are the predominant material in the semiconductor market, gallium-containing compound semiconductors play an important role in applications where wide-band gaps and high-temperature operation are vital. Examples include light-emitting diodes (LEDs), power-integrated circuits, solar photovoltaics, and transistors, which are then used in communication devices, electricity generation, medical equipment, and transportation applications. More recently, growth in demand for gallium semiconductors has been increasingly tied to the adoption of EVs and the deployment of 5G wireless networks. Gallium is also used as an alloying element in neodymium-iron-boron magnets as well as research and development applications.
The United States is entirely import-reliant for all gallium used domestically, although a single U.S. refinery recovers and recycles new scrap and imported low-purity gallium (Jaskula, 2024a, b18). Recent analysis of the U.S. supply risks related to gallium estimated the total U.S. production capacity for high-purity and secondary refined gallium to be 20,000 kilograms (Nassar and others, 2024).
China is the predominant world producer and refiner of gallium (fig. 4). In 2023, China imposed new export controls on the material ([China] Ministry of Commerce, 2023) and followed up with more stringent export restrictions in December 2024 (Kurtenbach, 2024). In 2024, China accounted for 98 percent of global production, but only 87 percent of the global primary low-purity gallium production capacity (fig. 5). The discrepancy is because most of the capacity outside of China is operating at low utilization rates or is on care-and-maintenance status and hence idled. There is not much planned growth in production capacity. However, it is possible that the export controls may result in idled capacity outside of China coming online again.
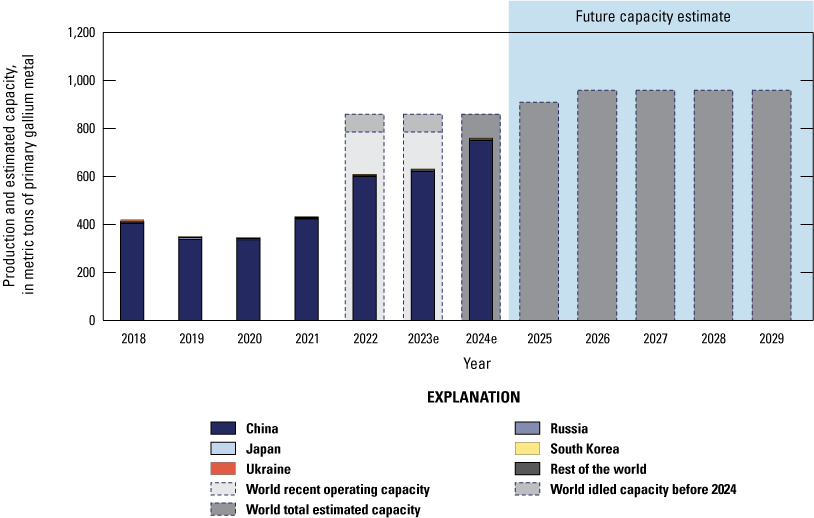
Recent and estimated production and outlook capacity of low-purity primary gallium, in metric tons, by country, for 2018 through 2029. Countries that have gallium primary production capacity include Canada, China, Germany, Hungary, India, Japan, Kazakhstan, Russia, Slovakia, South Korea, Ukraine, the United Kingdom, and the United States. Data are from Alonso and others (2025). e, estimated data.
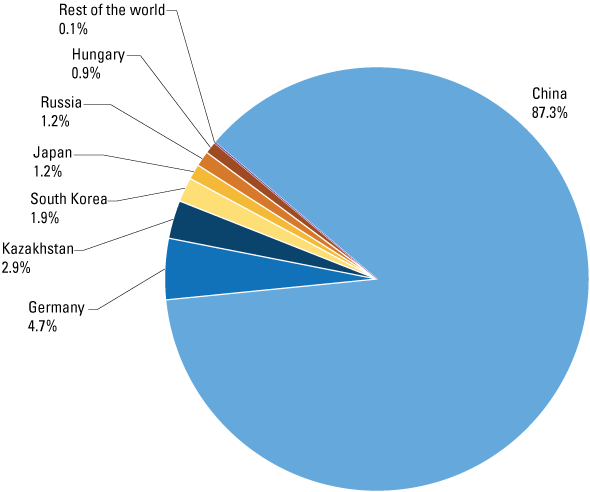
Potential capacity, by country, of low-purity primary gallium production estimated for 2024. All capacity status (operating, expansion, care-and-maintenance, and expected new capacity) is included. Data are from Alonso and others (2025). %, percent.
Helium
Helium is a light, inert gas that is liquid only at very low temperatures owing to a very low boiling point. It is used in applications where these properties are desirable, such as for balloons and dirigibles, magnetic resonance imaging (MRI) coolants, research, aerospace, and welding. Although substitution is challenging owing to helium’s unique properties, recycling is possible in many applications by adding a closed-loop collection system to avoid loss to the atmosphere. Even though the quantity of supplies from the closed-loop recycling is not easy to measure, it helps to add resiliency to the helium supply chain.
Helium is largely extracted as a byproduct of natural gas (Goodin and Hamak, 2024). There are some cases where helium is extracted as the main product or coproduced with nitrogen. Some quantities of helium are also obtained from recycling and stockpiles provide market flexibility over time when supply and demand differ significantly. Only a portion of the helium extracted with natural gas is refined, and refining capacity determines most of the primary production capacity. The United States and Qatar are the world’s leading producers, and both countries export helium (fig. 6).
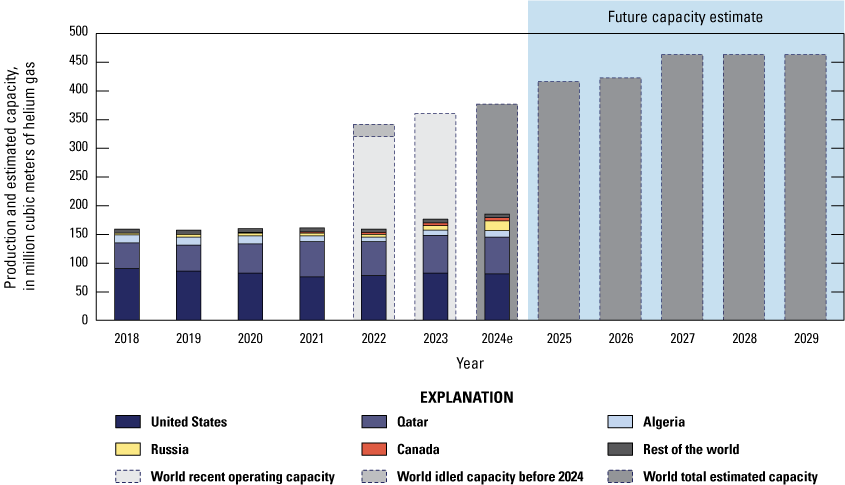
Recent and estimated production and outlook capacity of helium, in million cubic meters, by country, for 2018 through 2029. Countries that have helium production capacity include Algeria, Australia, Canada, Poland, Qatar, Russia, South Africa, and the United States. Data are from Alonso and others (2025). e, estimated data.
Supply chain issues have affected helium availability over the past 15 years. Transporting and delivering helium involves complex logistics because helium requires large specialty containers or tankers to keep it compressed at high pressures or, in the case of liquid helium, at extremely low temperatures. Moreover, those tankers and containers must make the trip back to the refineries to be refilled, adding to the logistical challenges. In 2017, disputes with Saudi Arabia affected Qatar’s ability to export helium to global markets (Butler, 2017). As a result, Qatar needed to establish new and more complex routes through Oman. More recently, explosions, fires, and the conflict in Ukraine have caused delays in the development of Russia’s Amur helium refinery project but is still expected to add significant global capacity (fig. 7), which was expected to predominantly feed the Chinese market (Kornbluth, 2023; TASS Russian News Agency, 2023).
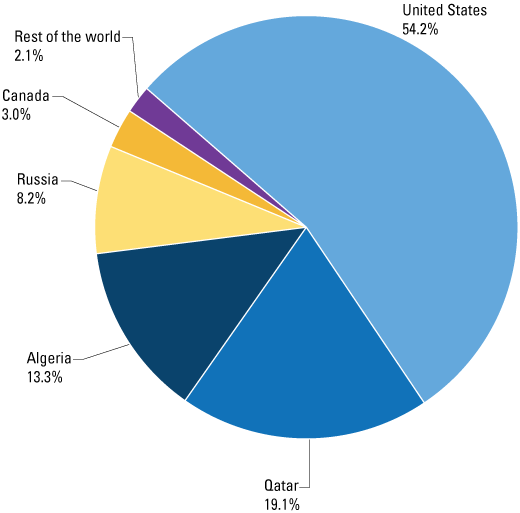
Potential capacity, by country, of helium refinery production estimated for 2024. All capacity status (operating, expansion, care-and-maintenance, and expected new capacity) is included. Data are from Alonso and others (2025). %, percent.
Lithium
Batteries are the principal end use for lithium, accounting for 87 percent of usage (Jaskula, 2024c). Air treatment, ceramics, glass, grease, and other uses make up the remainder. Rechargeable lithium-ion batteries are the main battery type for lithium, although non-rechargeable lithium batteries are used in niche applications. Lithium-ion battery demand has grown rapidly over the past decade and is expected to continue to increase owing to rising demand for EVs and energy storage systems (International Energy Agency, 2024).
Lithium is produced from brines and hard rock ores which are then processed into compounds such as lithium carbonate, hydroxide, and chloride. The United States imports lithium products but also produces lithium commercially from brine sources. In anticipation of rising demand for lithium-ion batteries, especially those used in EVs, mining companies have invested in the expansion of lithium production (figs. 8 and 9). Although not included in the timeframe covered for this outlook, between 2016 and 2018, lithium production in Australia quadrupled as five mines ramped up production. Currently, hard rock ores in Australia are the main source of lithium worldwide (fig. 8). Chile is the world’s second-largest producer, drawing from lithium brines.
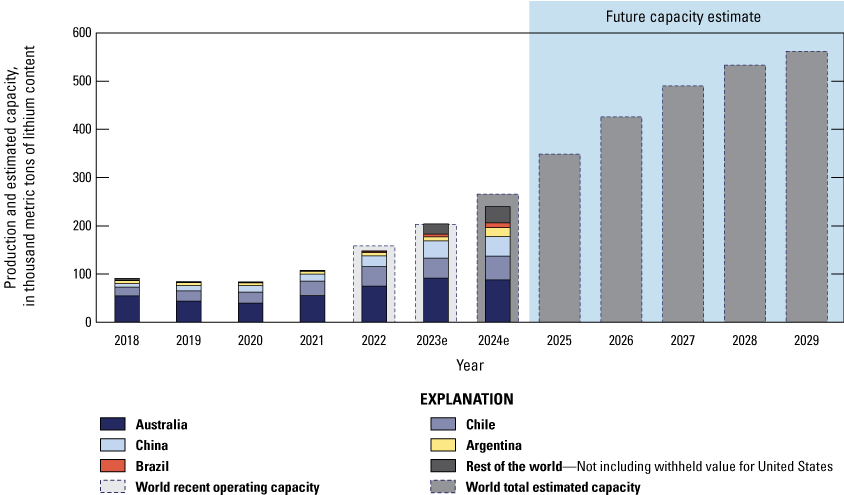
Recent and estimated production and outlook capacity of lithium content in thousand metric tons, by country, for 2018 through 2029. Countries that have lithium production capacity include Argentina, Australia, Austria, Bolivia, Brazil, Canada, Chile, China, Czechia, Congo (Kinshasa), Ethiopia, Finland, France, Germany, Ghana, Mali, Mexico, Namibia, Nigeria, Peru, Portugal, Russia, Rwanda, Serbia, South Africa, Spain, the United Kingdom, and Zimbabwe. Data are from Alonso and others (2025). e, estimated data.
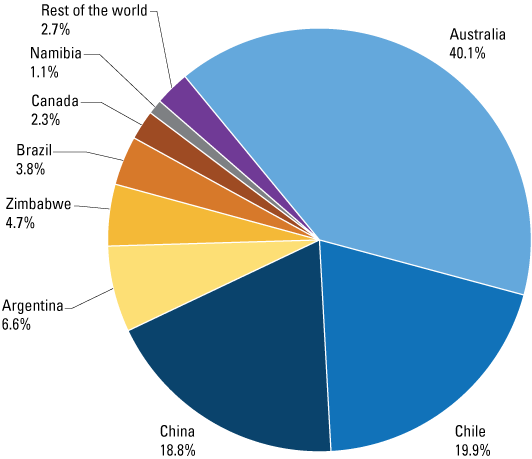
Potential capacity, by country, of lithium primary production estimated for 2024. All capacity status (operating, expansion, care-and-maintenance, and expected new capacity) is included. Data are from Alonso and others (2025). %, percent.
Magnesium Metal
The magnesium market is split into magnesium metal and magnesium compounds; this report only considers magnesium metal. Magnesium metal is desired for its high strength-to-weight ratio. Magnesium metal is used in aluminum alloys, die casting, metal desulfurization, metal reduction, nodular cast iron, and other applications. Within the die-casting segment, magnesium is used in the aerospace and automotive sectors, in consumer goods, medical devices, and in sporting equipment (Bray, 2024).
A single producer in the United States produces magnesium metal from brine, but the production number was withheld to avoid disclosing company proprietary information. However, the production capacity value was included in the outlook because it is reported on the company’s website (US Magnesium LLC, 2024). The United States also has secondary production capacity for magnesium metal from recycled metal, and this value has been used for the capacity shown in figure 10.
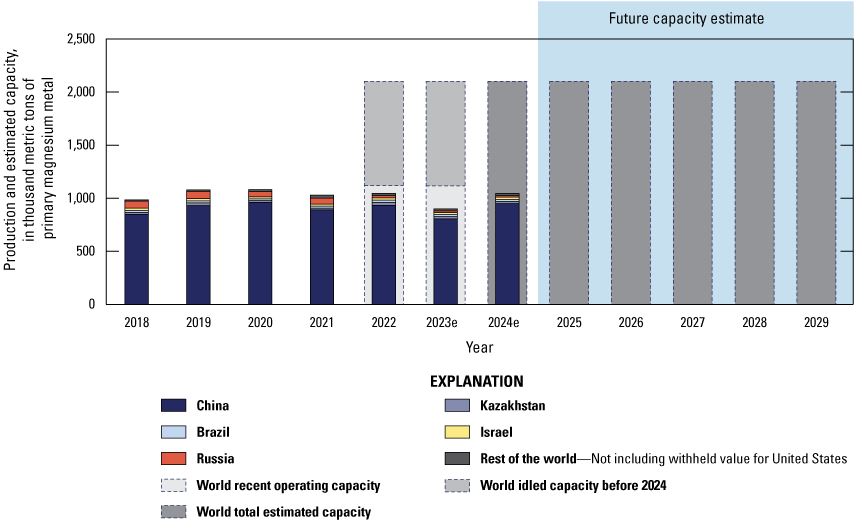
Recent and estimated production and outlook capacity of primary magnesium metal in thousand metric tons, by country, for 2018 through 2029. Countries that have magnesium production capacity include Australia, Brazil, Canada, China, Iran, Israel, Kazakhstan, Malaysia, Russia, Serbia, South Korea, Turkey, Ukraine, and the United States. Data are from Alonso and others (2025). e, estimated data.
Overall, world production of primary magnesium metal has been relatively flat from 2018 to 2024. China dominates the production of magnesium metal and global production capacity. Other producing countries include Brazil, Iran, Israel, Kazakhstan, Russia, Turkey, and Ukraine, each with less than a 3‑percent share of world production. The global future capacity for magnesium metal is not expected to grow. About half of China’s capacity is idled at least some of the time, and any proposed capacity expansions are highly uncertain (fig. 11). Many of the magnesium projects outside of China cannot compete with China owing to the country’s access to low-cost fuel, large deposits of dolomite, and government support. As a result, non-Chinese projects lose funding or encounter other technical and economic obstacles before construction is completed (Project Blue, 2024).
Potential capacity, by country, of magnesium primary production estimated for 2024. All capacity status (operating, expansion, care-and-maintenance, and expected new capacity) is included. Data are from Alonso and others (2025). %, percent.
Palladium
Palladium is a platinum-group metal (PGM) predominantly used in automobile and truck catalytic converters (especially for gasoline-based engines) as well as capacitors, chemical production, dental alloys, integrated circuits, jewelry, and petroleum refining (Schulte, 2024). Rising adoption of EVs could reduce demand for palladium since EVs do not have a catalytic converter. This development may reduce future palladium production unless other end-use sectors increase consumption to balance the projected downturn in demand caused by EVs. Palladium is mined from two deposits in Montana by one company. One of those mines was recently put on care-and-maintenance status as the company restructured its operations owing to the decreasing price of palladium. The PGM deposits in the United States have higher concentrations of palladium than platinum. However, the palladium mined in the United States is sent overseas to be refined. Secondary palladium is also refined and recycled domestically along with other PGMs.
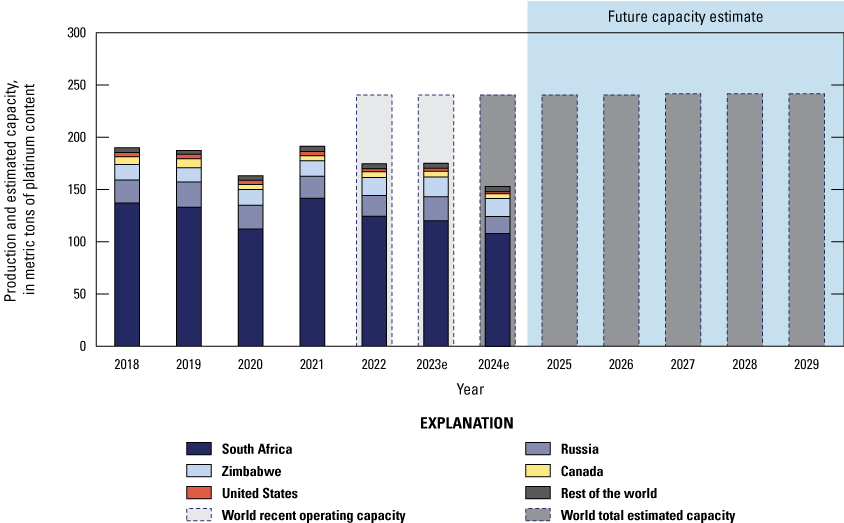
Globally, mine production and primary refining are concentrated in South Africa and Russia (fig. 12). Despite recent improvements (Habershon, 2024), South Africa’s long history of uncertainty in the supply of electricity will likely continue to affect the country’s PGM production. Russia’s 2023 palladium production was estimated to have increased from that in 2022 and 2021 (fig. 13). Both countries have abundant reserves and are expected to continue contributing significantly to future installed capacity given an outlook where future capacity remains flat. Recycling is also an important source of palladium, but statistics on the availability of secondary palladium are difficult to track owing to the closed-loop nature of recycling.
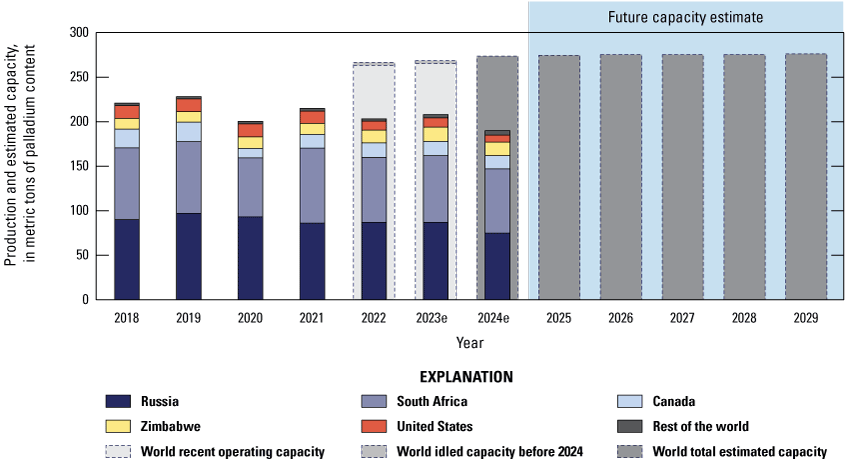
Recent and estimated mine production and outlook capacity of palladium (metal content), in metric tons, by country, for 2018 through 2029. Countries that have palladium production capacity include Australia, Canada, China, Finland, Russia, Serbia, South Africa, the United States, and Zimbabwe. Data are from Alonso and others (2025). e, estimated data.
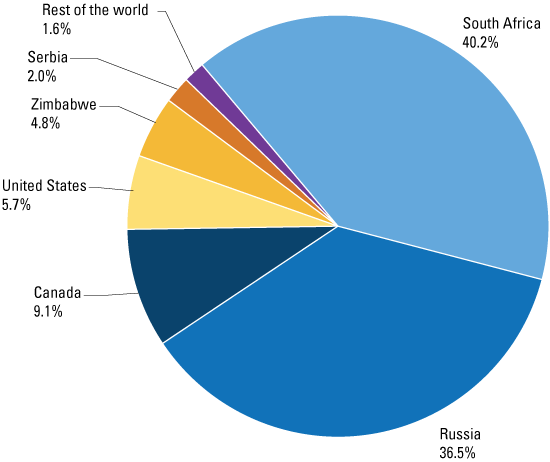
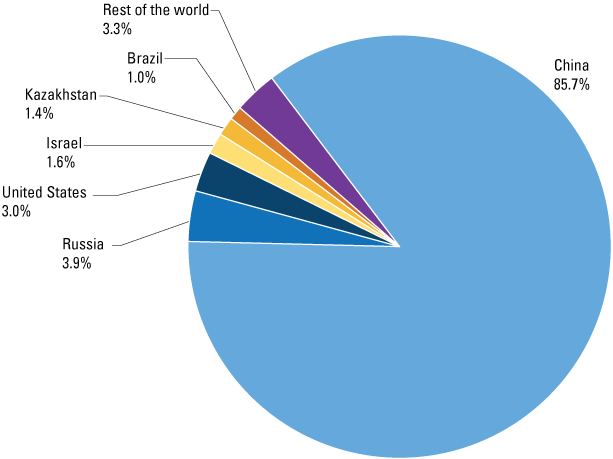
Potential capacity, by country, of palladium mine production estimated for 2024. All capacity status (operating, expansion, care-and-maintenance, and expected new capacity) is included. Data are from Alonso and others (2025). %, percent.
Platinum
Platinum is used in automobile and truck catalytic converters (especially for diesel-based combustion engines), as well as chemical production, dental alloys, hard disk drives, industrial thermocouples, jewelry, petroleum refining catalysts, and medical devices (Schulte, 2024). An emerging application of platinum is in proton exchange membrane fuel cells, one of many technologies that could be implemented in a low-carbon future. However, the rate of adoption for fuel cell technologies is uncertain given the uptake in lithium-ion batteries for EVs and energy storage. Platinum is mined from two deposits in Montana by one company (fig. 14). Operations are expected to continue but various cost reduction measures have been put in place, including putting one of the mines on care-and-maintenance status (Sibanye Stillwater Ltd., 2024). The platinum mined in the United States is sent overseas to be refined. The PGM deposits in the United States contain platinum in lower concentrations than palladium. Secondary platinum is also refined and recycled domestically along with other PGMs.
Recent and estimated mine production and outlook capacity of platinum (metal content), in metric tons, by country, for 2018 through 2029. Countries that have platinum production capacity include Australia, Canada, China, Colombia, Ethiopia, Finland, Russia, Serbia, South Africa, the United States, and Zimbabwe. Data are from Alonso and others (2025). e, estimated data.
More so than palladium, platinum mine production is highly concentrated in South Africa (fig. 15). As with palladium, recent efforts to stabilize the power supply will likely improve platinum supply stability, but uncertainty remains. Recycling is highly dependent on the price of platinum. Additionally, vehicle retirements, a major source of recycled platinum, have trended down recently, thereby reducing the amount of platinum available for recycling.
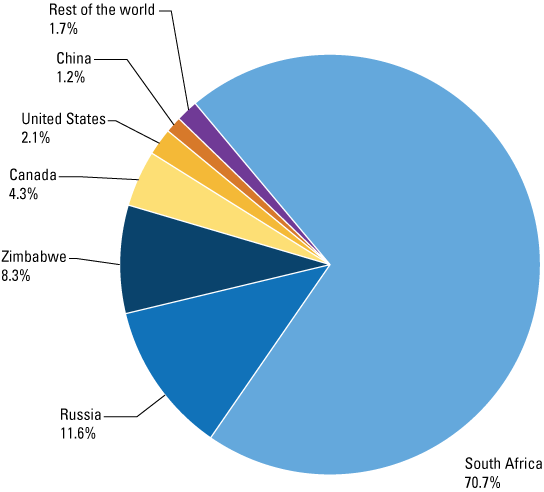
Potential capacity, by country, of platinum mine production estimated for 2024. All capacity status (operating, expansion, care-and-maintenance, and expected new capacity) is included. Data are from Alonso and others (2025). %, percent.
Titanium Sponge Metal
The global market for titanium can be broken down into coatings, chemicals, titanium dioxide and titanium sponge metal segments. This report only considers titanium sponge metal. Titanium sponge metal is used primarily in the aerospace industry. Other significant consuming industries include consumer goods, chemical process, medical, power generation, and metallurgy applications.
In 2023, the United States had one active producer of titanium sponge metal with limited production capacity dedicated to serving the electronics industry. Previously, two producers idled sponge facilities, which caused an increased reliance on imports from Japan and elsewhere to support the domestic supply chain. The production value has been withheld in this report (fig. 16) to avoid disclosing proprietary information. World titanium sponge production has been steadily increasing over the past few years, primarily from capacity expansions in China (fig. 17). China was the top global producer with a 67‑percent share of world output in 2023 (U.S. Geological Survey, 2025). Other notable producing countries include Japan, Kazakhstan, Russia, and Saudi Arabia while operations in Ukraine were idle owing to the conflict with Russia (fig. 17).
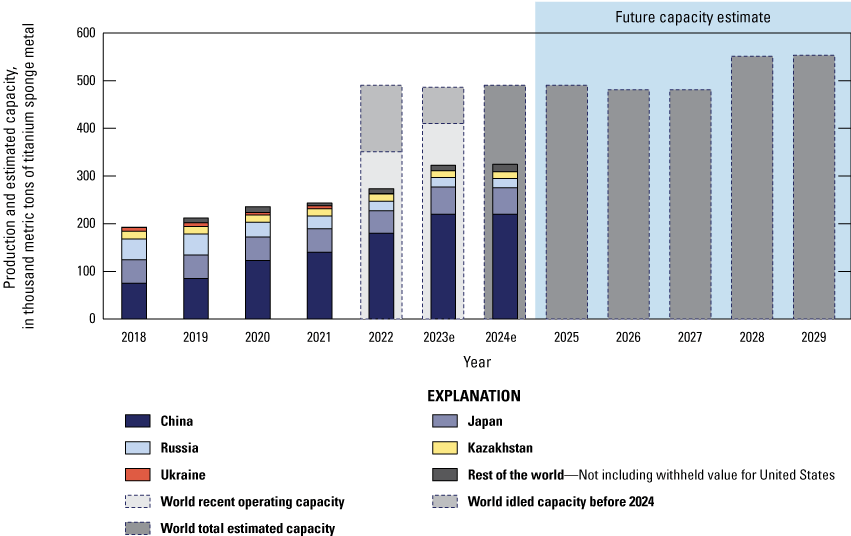
Recent and estimated production and outlook capacity of titanium sponge (metal), in thousand metric tons, by country, for 2018 through 2029. Countries that have titanium sponge refining and production capacity include China, India, Japan, Kazakhstan, Russia, Saudi Arabia, Ukraine, and the United States. Data are from Alonso and others (2025). e, estimated data.
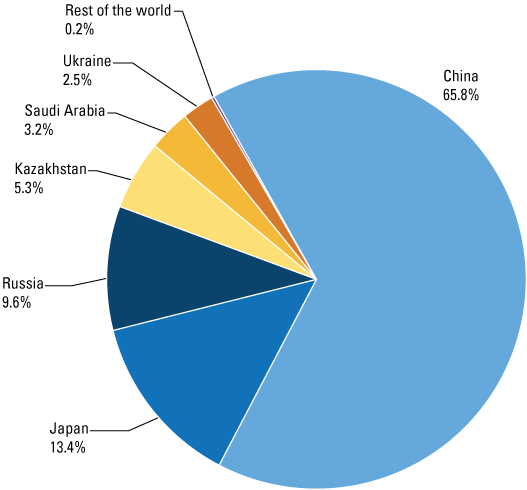
Potential capacity, by country, of titanium sponge (metal) production estimated for 2024. All capacity status (operating, expansion, care-and-maintenance, and expected new capacity) is included. Data are from Alonso and others (2025). %, percent.
Acknowledgments
The authors thank U.S. Geological Survey (USGS) mineral commodity specialists Lee Bray, Samantha Ewing, Joseph Gambogi, Robert Goodin, and Brian Jaskula for sharing their expertise and insights related to specific mineral commodities. The authors also thank the USGS country specialists Jaewon Chung, Keita DeCarlo, Ji Won Moon, and Sean Xun for supporting the country-level facility data collection effort.
References Cited
Alonso, E., Brioche, A.S., Schulte, R.F., Trimmer, L.M., Kim, J.-E., Gulley, A.L., and Pineault, D.G., 2025, World minerals outlook to 2029—Cobalt, gallium, helium, lithium, magnesium, palladium, platinum, and titanium data: U.S. Geological Survey data release, https://doi.org/10.5066/P1HTTCWN.
Argus Media, 2024, Argus metals prices & data: Argus Media data, accessed January 14, 2025, at https://metals.argusmedia.com/metal/minor-and-specialty-metals-cobalt.
Board of Governors of the Federal Reserve System, 2024a, FRED economic data: Board of Governors of the Federal Reserve System database, accessed January 16, 2025, at https://fred.stlouisfed.org/series/TCU/.
Board of Governors of the Federal Reserve System, 2024b, Industrial production and capacity utilization—G.17: Board of Governors of the Federal Reserve System web page, accessed January 16, 2025, at https://www.federalreserve.gov/releases/G17/Revisions/20240628/DefaultRev.htm.
Boullenois, C., Kratz, A., and Rosen, D.H., 2024, Overcapacity at the gate: Rhodium Group web page, March 26, accessed January 24, 2025, at https://rhg.com/research/overcapacity-at-the-gate/.
Bray, E.L., 2024, Magnesium, chap. 45 of Metals and minerals: U.S. Geological Survey Minerals Yearbook 2020, v. I, p. 45.1–45.10, accessed January 16, 2025, at https://pubs.usgs.gov/myb/vol1/2020/myb1-2020-magnesium-metal.pdf.
Bureau of Economic Analysis, 2024, The use of commodities by industries—Sector; 2023, (millions of dollars): Bureau of Economic Analysis interactive data, accessed January 24, 2025, at https://apps.bea.gov/iTable/?reqid=150&step=2&isuri=1&categories=Io&_gl=1*3z7pt2*_ga*MTEyMTEwODMzLjE3MzY5NzY4NDk.*_ga_J4698JNNFT*MTczNzc0NjA3MC4yLjEuM TczNzc0NjI2Ni41Ny4wLjA.#eyJhcHBpZCI6MTUwLCJzdGVwcyI6WzEsMiwzXSwiZGF0YSI6W1siY2F0ZWdvcmllcyIsIkdkcHhJbmQiXSxbIlRhYmxlX0xpc3QiLCI2MDEwIl1dfQ==.
Butler, D., 2017, Qatar blockade hits helium supply: Nature, v. 547, p. 16, accessed January 14, 2025, at https://doi.org/10.1038/547016a.
[China] Ministry of Commerce, 2023, [Implementation of export control on gallium and germanium related items]: Ministry of Commerce and the General Administration of Customs Announcement no. 23 of 2023, accessed July 6, 2023, at https://m.mofcom.gov.cn/article/zwgk/gkzcfb/202307/20230703419666.shtml. [Translated by Google Translate.]
DiPippo, G., Mazzocco, I., and Scott, K., 2022, Red ink—Estimating Chinese industrial policy spending in comparative perspective: Center for Strategic and International Studies, 87 p., accessed January 14, 2025, at https://www.csis.org/analysis/red-ink-estimating-chinese-industrial-policy-spending-comparative-perspective.
Federal Reserve, 2024, Industrial production and capacity utilization—G.17—The 2024 annual revision: Federal Reserve data, accessed June 28, 2024, at https://www.federalreserve.gov/releases/G17/Revisions/20240628/DefaultRev.htm.
Goodin, R.C., and Hamak, J.E., 2024, Helium, chap. 34 of Metals and minerals: U.S. Geological Survey Minerals Yearbook 2020, v. I, p. 34.1–34.8, accessed January 16, 2025, at https://pubs.usgs.gov/myb/vol1/2020/myb1-2020-helium.pdf.
Gulley, A.L., 2024, The development of China’s monopoly over cobalt battery materials: Mineral Economics, v. 37, p. 619–631, accessed January 14, 2025, at https://doi.org/10.1007/s13563-024-00447-w.
Habershon, E., 2024, Joy and relief as South Africa manages to keep its lights on: BBC News, August 6, accessed January 14, 2025, at https://www.bbc.com/news/articles/c4ng1ygxzddo.
International Energy Agency, 2024, Global critical minerals outlook 2024: International Energy Agency, 280 p., accessed March 4, 2025, at https://www.iea.org/reports/global-critical-minerals-outlook-2024.
Jaskula, B.W., 2024a, Gallium, chap. 27 of Metals and minerals: U.S. Geological Survey Minerals Yearbook 2019, v. I, p. 27.1–27.9, accessed January 16, 2025, at https://pubs.usgs.gov/myb/vol1/2019/myb1-2019-gallium.pdf.
Jaskula, B.W., 2024b, Gallium, chap. 27 of Metals and minerals: U.S. Geological Survey Minerals Yearbook 2020, v. I, p. 27.1–27.9, accessed January 16, 2025, at https://pubs.usgs.gov/myb/vol1/2020/myb1-2020-gallium.pdf.
Jaskula, B.W., 2024c, Lithium, chap. 44 of Metals and minerals: U.S. Geological Survey Minerals Yearbook 2020, v. I, p. 44.1–44.11, accessed January 16, 2025, at https://pubs.usgs.gov/myb/vol1/2020/myb1-2020-lithium.pdf.
Kornbluth, P., 2023, Helium shortage 4.0—What caused it and when will it end?: Innovation News Network, no. 13, p. 250–253, accessed January 14, 2025, at https://edition.pagesuite-professional.co.uk/html5/reader/production/default.aspx?pubname=&edid=22fd6ed7-5a90-41fd-a79f-362fd8f0fb69. [Standalone article available at https://www.innovationnewsnetwork.com/helium-shortage-4-0-what-caused-it-and-when-will-it-end/29255/.]
Kurtenbach, E., 2024, China bans exports to US of gallium, germanium, antimony in response to chip sanctions: The Associated Press, December 3, 2024, accessed February 10, 2025, at https://apnews.com/article/china-us-tech-semiconductor-chip-gallium-6b4216551e200fb719caa6a6cc67e2a4.
Nassar, N.T., Shojaeddini, E., Alonso, E., Jaskula, B., and Tolcin, A., 2024, Quantifying potential effects of China’s gallium and germanium export restrictions on the U.S. economy: U.S. Geological Survey Open-File Report 2024–1057, 66 p., accessed January 14, 2025, at https://doi.org/10.3133/ofr20241057.
Nguyen, R.T, Eggert, R.G., Severson, M.H., and Anderson, C.G., 2021, Global electrification of vehicles and intertwined material supply chains of cobalt, copper and nickel: Resources, Conservation and Recycling, v. 167, article 105198, 21 p., accessed May 23, 2024, at https://doi.org/10.1016/j.resconrec.2020.105198.
Project Blue, 2024, Magnesium analysis: Project Blue, May 2024, 25 p., accessed February 2025 at https://proxima.projectblue.com/. [Analysis web page is behind paywall.]
Riddle, M.E., Tatara, E., Olson, C., Smith, B.J., Irion, A.B., Harker, B., Pineault, D., Alonso, E., and Graziano, D.J., 2021, Agent-based modeling of supply disruptions in the global rare earths market: Resources, Conservation and Recycling, v. 164, article 105193, accessed January 14, 2025, at https://doi.org/10.1016/j.resconrec.2020.105193.
S&P Capital IQ, 2024, Mine economics, scenario—Market intelligence 2023 constant USD: S&P Capital IQ, accessed December 2, 2024, at https://www.capitaliq.spglobal.com/. [Scenario web page is behind paywall.]
Schulte, R.F., 2024, Platinum-group metals, chap. 57 of Metals and minerals: U.S. Geological Survey Minerals Yearbook 2020, v. I, p. 57.1–57.13, accessed January 16, 2025, at https://pubs.usgs.gov/myb/vol1/2020/myb1-2020-platinum-group.pdf.
Shambaugh, J., 2024, Remarks by Under Secretary for International Affairs Jay Shambaugh on Chinese overcapacity and the global economy: U.S. Department of the Treasury press release, July 10, accessed July 11, 2024, at https://home.treasury.gov/news/press-releases/jy2455.
Shedd, K.B., 2024, Cobalt, chap. 19 of Metals and minerals: U.S. Geological Survey Minerals Yearbook 2020, v. I, p. 19.1–19.20, accessed January 16, 2025, at https://pubs.usgs.gov/myb/vol1/2020/myb1-2020-cobalt.pdf.
Shojaeddini, E., Alonso, E., and Nassar, N.T., 2024, Estimating price elasticity of demand for mineral commodities used in lithium-ion batteries in the face of surging demand: Resources, Conservation and Recycling, v. 207, article 107664, 9 p., accessed January 14, 2025, at https://doi.org/10.1016/j.resconrec.2024.107664.
Sibanye Stillwater Ltd., 2024, Sibanye-Stillwater provides updates on its SA PGM operations: Sibanye Stillwater Ltd. market release, April 18, 3 p., accessed January 14, 2025, at https://thevault.exchange/?get_group_doc=245/1713448230-LogoSibanye-StillwaterprovidesupdatesonitsSAPGMoperations18April2024.pdf.
TASS Russian News Agency, 2023, Gazprom launches two helium units of Amur Gas Processing Plant: TASS Russian News Agency, January 25, accessed January 26, 2023, at https://tass.com/economy/1737341.
United Nations Environment Programme, International Resource Panel, 2024, Global resources outlook 2024: United Nations Environment Programme, 162 p., accessed March 4, 2025, at https://www.unep.org/resources/Global-Resource-Outlook-2024.
U.S. Geological Survey, 2020, Mineral commodity summaries 2020: U.S. Geological Survey, 200 p., accessed January 14, 2025, at https://doi.org/10.3133/mcs2020.
U.S. Geological Survey, 2021, Mineral commodity summaries 2021: U.S. Geological Survey, 200 p., accessed January 14, 2025, at https://doi.org/10.3133/mcs2021.
U.S. Geological Survey, 2022, Mineral commodity summaries 2022: U.S. Geological Survey, 202 p., accessed January 14, 2025, at https://doi.org/10.3133/mcs2022.
U.S. Geological Survey, 2023, Mineral commodity summaries 2023: U.S. Geological Survey, 210 p., accessed January 14, 2025, at https://doi.org/10.3133/mcs2023.
U.S. Geological Survey, 2024, Mineral commodity summaries 2024: U.S. Geological Survey, 212 p., accessed January 14, 2025, at https://doi.org/10.3133/mcs2024.
U.S. Geological Survey, 2025, Mineral commodity summaries 2025: U.S. Geological Survey, 212 p., accessed February 12, 2025, at https://doi.org/10.3133/mcs2025.
US Magnesium LLC, 2024, About us: US Magnesium LLC website, accessed January 14, 2025, at https://usmagnesium.com/about-us-mag/.
Wang, Y., 2024, China cobalt market report 2024: Shanghai Metals Market Global UK presentation, 16 p., accessed June 2, 2024, at https://www.cobaltinstitute.org/wp-content/uploads/2024/05/Cobalt_Congress_2024-Presentation_SMM-Yanchen_Wang.pdf.
Wu, T., Karmer, J., and Weidensteiner, B., 2024, Overcapacity in China: Commerzbank Week in Focus, June 6, p. 2–5, accessed January 24, 2025, at https://www.commerzbank.de/group/research/week-in-focus/wif2106e.pdf.
Supplemental Information
Mineral resources refers to the physical aggregate of mineral deposits in a region above some lower cutoff.
A bankable or definitive feasibility study is a detailed analysis of all relevant project components that demonstrates the economic feasibility of a project with sufficient certainty to allow a decision to finance and develop a mine.
Abbreviations
BIL
Bipartisan Infrastructure Law
COVID–19
novel coronavirus 2019
DPA
Defense Production Act of 1950
EV
electric vehicle
GDP
gross domestic product
IEA
International Energy Agency
IRA
Inflation Reduction Act
LED
light-emitting diode
LME
London Metal Exchange
MRI
magnetic resonance imaging
NAICS
North American Industry Classification System
PGM
platinum-group metal
USGS
U.S. Geological Survey
For additional information, contact:
Director, National Minerals Information Center
U.S. Geological Survey
12201 Sunrise Valley Drive
988 National Center
Reston, VA 20192
Email: nmicrecordsmgt@usgs.gov
Publishing support provided by Pembroke and Reston Publishing Service Centers.
Disclaimers
Any use of trade, firm, or product names is for descriptive purposes only and does not imply endorsement by the U.S. Government.
Although this information product, for the most part, is in the public domain, it also may contain copyrighted materials as noted in the text. Permission to reproduce copyrighted items must be secured from the copyright owner.
Suggested Citation
Alonso, E., Brioche, A.S., Schulte, R.F., Trimmer, L.M., Kim, J.-E., Gulley, A.L., and Pineault, D.G., 2025, World minerals outlook—Cobalt, gallium, helium, lithium, magnesium, palladium, platinum, and titanium through 2029 (ver. 1.1, March 14, 2025): U.S. Geological Survey Scientific Investigations Report 2025–5021, 19 p., https://doi.org/10.3133/sir20255021.
ISSN: 2328-0328 (online)
| Publication type | Report |
|---|---|
| Publication Subtype | USGS Numbered Series |
| Title | World minerals outlook—Cobalt, gallium, helium, lithium, magnesium, palladium, platinum, and titanium through 2029 |
| Series title | Scientific Investigations Report |
| Series number | 2025-5021 |
| DOI | 10.3133/sir20255021 |
| Edition | Version 1.0: March 11, 2025; Version 1.1: March 14, 2025 |
| Publication Date | March 11, 2025 |
| Year Published | 2025 |
| Language | English |
| Publisher | U.S. Geological Survey |
| Publisher location | Reston, VA |
| Contributing office(s) | National Minerals Information Center |
| Description | Report: vi, 19 p.; Data Release |
| Online Only (Y/N) | Y |