

User’s Guide for the National Hydrography Dataset Plus High Resolution (NHDPlus HR)
Links
- Document: Report (9.55 MB pdf) , HTML , XML
- Data Releases:
- USGS data release - USGS National Hydrography Dataset Plus High Resolution National Release 1 FileGDB
- USGS data release - The National Map downloader (ver. 2.0)
- Project Site: NHDPlus High Resolution
- Superseded Publications:
- Download citation as: RIS | Dublin Core
Acknowledgments
National Hydrography Dataset Plus (NHDPlus) High Resolution data were produced nationally as part of the U.S. Geological Survey (USGS) National Geospatial Program with input from the U.S. Environmental Protection Agency, and numerous State and local agencies. The authors thank Silvia Terziotti, Amanda Schoen, Gregory Cocks, Michael Tinker, Annalisa Stasey, David Anderson, Cynthia Ritmiller, and John Tellini (USGS) for their constructive review of this document, and Karen Adkins (USGS) for facilitating the review. The authors also wish to acknowledge the many contributions of Craig Johnston (USGS), deceased, in the development of NHDPlus.
Abstract
The National Hydrography Dataset Plus High Resolution (NHDPlus HR) is a scalable hydrologic geospatial fabric or framework, built from (1) the High Resolution (1:24,000-scale or better) National Hydrography Dataset (NHD), (2) nationally complete Watershed Boundary Dataset (WBD), and (3) 1/3-arc-second 3D Elevation Program (3DEP) digital elevation model (DEM) data (at a 10-meter ground spacing; or 5-meter 3DEP DEM in Alaska only). The NHDPlus HR provides a modeling and assessment framework at a local 1:24,000 scale, while nesting seamlessly into the national context.
NHDPlus HR is modeled after the highly successful NHDPlus version 2 (NHDPlusV2). Like NHDPlusV2, the NHDPlus HR includes data for a nationally seamless network of stream reaches, elevation-based catchment areas, flow surfaces, and value-added attributes that enhance stream-network navigation, analysis, and data display. However, NHDPlus HR provides much greater spatial detail than NHDPlusV2, while NHDPlusV2 is, at present, more complete in its attribution of additions, removals, and diversions, as well as stream connectivity. This user’s guide is intended to provide necessary information and guidance in the use of NHDPlus HR data.
Introduction
The National Hydrography Dataset Plus (NHDPlus) High Resolution (NHDPlus HR) is a scalable geospatial hydrography framework built from the high-resolution (1:24,000-scale or better) National Hydrography Dataset (NHD), nationally complete Watershed Boundary Dataset (WBD), and 1/3-arc-second (10-meter [m] ground spacing) 3D Elevation Program (3DEP) digital elevation model (DEM) data. The NHDPlus HR brings modeling and assessment to a local neighborhood level while nesting seamlessly into the national context. This report supersedes U.S. Geological Survey (USGS) Open-File Report 2019–1096 (Moore and others, 2019).
The NHDPlus HR (USGS, 2018a) is modeled after the highly successful NHDPlus version 2 (Horizon Systems Corp, undated b; Dewald, 2015; Moore and Dewald, 2016). Like the NHDPlusV2, the NHDPlus HR includes data for a nationally seamless network of stream reaches, elevation-based catchment areas, flow surfaces, and value-added attributes that enhance stream-network navigation, analysis, and data display (Viger and others, 2016). The NHDPlus HR increases the number of features nationally from about 2.6 million in the NHDPlusV2 to more than 30 million and provides richer, more current content that can be used at a variety of scales.
The snapshots of the NHD, 3DEP DEM, and WBD used to construct the NHDPlus HR are included with the NHDPlus HR data. These three datasets are periodically updated by the USGS, States, and other organizations who are active stewards of the datasets. These snapshots of the data are not intended to be directly updated by users as inclusions in these national databases. Requests for updates should be directed to the respective USGS national stewardship programs, National Geospatial Program (NGP) User Engagement Office (https://www.usgs.gov/ngp-user-engagement-office). NHDPlus HR consists of vector (point, line, and polygon) and raster data layers and includes the following components:
-
• a set of tables with value-added attributes, in addition to the standard NHD attributes, which enhance stream-network navigation, analysis, and display;
-
• a polygon and raster representation of the elevation-based catchment area for each flowline in the stream network;
-
• catchment characteristics including mean annual precipitation, mean annual temperature, mean annual runoff, and mean latitude;
-
• cumulative drainage-area characteristics;
-
• mean annual flow values and velocity estimates for each flowline in the stream network;
-
• flow-direction and -accumulation, elevation, and hydroenforced DEM rasters;
-
• headwater-node areas; and
-
• minimum and maximum elevations and slopes of flowlines.
The NHDPlus HR elevation-derived catchments were produced by using a drainage- enforcement technique first applied to a large region by the Spatially Referenced Regression on Watershed Attributes (SPARROW) model for New England. This technique involves forcing the high-resolution NHD drainage network onto the 3DEP data by lowering the elevation values in the DEM at streams (creating virtual “trenches”), and enforcing the WBD hydrologic divides by greatly increasing the elevation values where the boundaries are (creating virtual “walls”) (Moore and others, 2004). The WBD is also used to identify the placement of sinks in noncontributing areas (areas of no external drainage). The resulting hydrologically conditioned DEM is used to produce catchments and other hydrologic derivatives that closely agree with the NHD and the WBD (fig. 1).
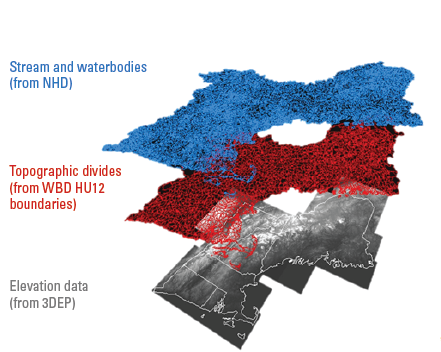
Diagram of model layers from major input datasets for the process of creating a hydrologically conditioned digital elevation model to create catchments in the National Hydrography Dataset Plus High Resolution (NHDPlus HR). 3DEP, 3D Elevation Program; HU12, 12-digit hydrologic unit; NHD, National Hydrography Dataset; WBD, Watershed Boundary Dataset.
These data are provided in a variety of map projections because the raster data (.tif files) in the NHDPlus HR cover different parts of the Earth’s surface (for example, the contiguous United States, Alaska, and Hawaii). Specific map projections centered on these respective areas provide the best representation of the rasterized 10-m data. Feature class data (lines and polygons), on the other hand, can be represented worldwide in a single geographic coordinate system. Table 1 lists the projections for each type of data.
Table 1.
Map projection information for the National Hydrography Dataset Plus High Resolution (NHDPlus HR) data.[GCS, geographic coordinate system; NAD 83, North American Datum 1983; GRS 1980, Geodetic Reference system 1980; UTM, Universal Transverse Mercator; m, meter; cm, centimeter]
Downloading and Organizing NHDPlus HR Data by Hydrologic Unit-Based Production Unit
NHDPlus HR data are distributed as compressed files with a “.zip” or “.7z” extension (USGS, 2019b). After downloading the NHDPlus HR data, install the data as follows:
-
1. Create a folder called “NHDPlusHRData” for the NHDPlus HR data. For the best performance, install the data to that directory on a local drive.
-
2. The compressed data files are named as follows, where “vpuid” is the identifier of each vector-processing unit followed by the HU level such as “_HU4” or “_HU8”:
-
• For vector layers and attributes: NHDPlus_H_<vpuid>_GDB.zip
-
• For raster layers: NHDPlus_H_<vpuid>_RASTER.7z
Note: Each NHDPlus HR compressed file should be uncompressed into the folder created in step 1. When using the unzip utility, choose the option that automatically preserves or creates the folder structure that is included inside the compressed files. Do not unzip into a folder named for the compressed file.
-
-
3. When completely installed, the uncompressed data should look as shown in figure 2.
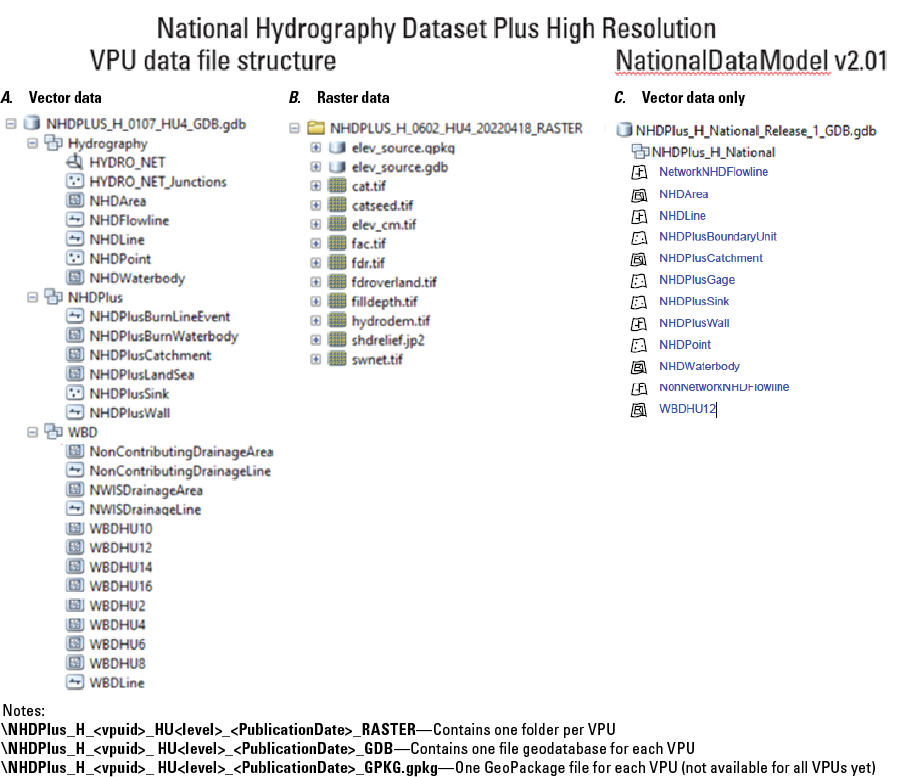
Screenshot showing how the National Hydrography Dataset Plus High Resolution (NHDPlus HR) data structure should look in ArcCatalog once the compressed data files are uncompressed. A, B, The first two columns show the NHDPlus HR VPU data file structure. Additionally, many tables and relationship classes are included in the geodatabase. See table 3 for a complete listing. A, vpuid=“0107” is shown for vector data, and B, vpuid=0107 is shown for raster data. The third column, C, shows the National Data Model (v2.01) data structure. HU, hydrologic unit; VPU, vector-processing unit.
Data File Formats
The NHDPlus HR vector datasets were developed using Esri ArcGIS software and are distributed in Esri File Geodatabase (.gdb) format. The vector-processing unit (VPU) data releases are also provided in GeoPackage format. The GeoPackage format is a relatively new, “open, standards-based, platform-independent, portable, self-describing, compact format for transferring geospatial information” (Open Geospatial Consortium, 2018).
NHDPlus HR Versioning
This user guide documents the major characteristics of the datasets which have been released to the public and are available for download or use through web services as of 2023. NHDPlus HR data has been developed and released to the public over a period of several years, during which the data model schema and file naming conventions have been subject to a few minor changes. The data model schema changes were tracked using a series of data model/schema version numbers. The initial data were released by VPU using NHDPlus HR VPU Data Model version 1.0. Later data were released by VPU using NHDPlus HR VPU Data Model versions 2.0, 2.0.1, and 2.1. Additionally, the data have been released as a single national database known as NHDPlus HR National Release 1 (USGS, 2022b), which has a separate data model schema known as NHDPlus HR National Data Model version 2.01. The “National Data Model and Release” section of this user guide covers the national release and its separate data model.
All NHDPlus HR data releases include the publication date in an XML metadata file included in the download file. The initial data released by VPU did not include the publication date in the download file name; however, later releases include the addition of the publication date to the database or raster directory name. For example: NHDPLUS_H_0101_HU4_GDB became NHDPLUS_H_0101_HU4_<PUBLICATIONDATE>_GDB, where <PUBLICATIONDATE> is given in YYYYMMDD format.
Additionally, the NHDPlus HR National Release 1 available at https://doi.org/10.5066/P9WFOBQI (USGS, 2022b) is identified with a unique digital object identifier (DOI), which allows easier and more precise citation of the data in scientific studies and reports. A second national release containing updated data in the same format as National Release 1 is planned.
Structure of the NHDPlus HR VPU Data
The NHDPlus HR vector feature classes and attribute tables are distributed in Esri file geodatabases or GeoPackage format (http://www.geopackage.org/), with the file names following the format NHDPlus_H_<vpuid>_HU<level>_<PUBLICATIONDATE>_GDB.gdb, where vpuid is the identification number of the vector-processing unit (VPU), level indicates the size of hydrologic unit (either HU4 or HU8), and GDB indicates Esri file geodatabase format while GPKG indicates the GeoPackage format. Each file geodatabase or GeoPackage contains the data for a single 4-digit hydrologic unit (HU4) currently within the contiguous United States and 8-digit hydrologic unit (HU8) for parts of Alaska (as of 2019); however, the data are designed to fit together seamlessly to allow distribution by using differently sized hydrologic units. This seamless design is made possible by using NHDPlus identification numbers (IDs), hydrosequence numbers, and origin and terminus nodes that are nationally unique. There are approximately 212 HU4s in the contiguous United States. Each HU4 is referred to as a VPU in NHDPlus HR terms. The NHDPlus HR raster data are distributed as a set of tag image file format (TIFF; extension .tif) or Joint Photographic Experts Group (JPEG 2000; extension .jp2) files. As of June 2019, all VPUs contained only a single raster-processing unit (RPU); however, the structure of NHDPlus HR can allow for the subdivision of large VPUs into multiple RPUs if necessary. Alaskan VPUs are being developed as HU8s rather than HU4s.
In addition to the three original datasets that were used to create NHDPlus (NHD, 3DEP DEM, and WBD), NHDPlus HR contains NHDPlus catchments, burn components (feature classes used to create the catchments), and multiple tables (table 2). In addition to the NHDPlus_H_<vpuid>_HU<level>_<PUBLICATIONDATE>_GDB file geodatabase, each VPU includes a folder that is named following the format HRNHDPlusRasters<vpuid>_HU<level>_<PUBLICATIONDATE> and contains the raster images (table 3). NHDPlus HR includes the components listed in tables 2 and 3. Complete NHD, 3DEP, and WBD documentation is available at USGS Hydrography Standards and Specifications at https://www.usgs.gov/index.php/ngp-standards-and-specifications/hydrography-standards-and-specifications.
Table 2.
Feature classes, tables, and other data used in the National Hydrography Dataset Plus High Resolution (NHDPlus HR).[National Hydrography Dataset (NHD; U.S. Geological Survey, 2019b) and Watershed Boundary Dataset (WBD) documentation is available at U.S. Geological Survey (2018b); complete 3D Elevation Program (3DEP) documentation is available at U.S. Geological Survey (2019a); NHDPlus, National Hydrography Dataset Plus; NHDPlus HR, National Hydrography Dataset Plus High Resolution; NWIS, National Water Information System]
| Feature class | Comment |
|---|---|
| NHD Hydrography | Original NHD data (input data to NHDPlus) |
| NHDFlowline | Lines representing the flowlines of the NHD network |
| NHDWaterbody | Polygons representing waterbodies in the NHD |
| NHDPoint | Points representing NHD hydrographic landmark features |
| NHDLine | Lines representing NHD hydrographic landmark features used for cartographic representation |
| NHDArea | Polygons representing river area in the NHD |
| NHDPlusCatchment | Polygon feature class for NHDPlus catchment polygons |
| NHDPlus Burn Components | NHDPlus feature classes used to create catchments; described in the “Main Data Components of the NHDPlus HR VPU Datasets and How They Fit Together” section of this report: |
| NHDPlusBurnLineEvent | Line feature class |
| NHDPlusBurnWaterbody | Polygon feature class |
| NHDPlusLandSea | Polygon feature class |
| NHDPlusSink | Point feature class |
| NHDPlusWall | Line feature class |
| 3DEP digital elevation model (DEM) | 3D elevation program (digital elevation model) |
| WBD | Watershed Boundary Dataset (original watershed data input to NHDPlus) |
| WBDHU_x | Polygon feature class, where x is the numeric identifier for each level (2, 4, 6, 8, 10, and 12) of hydrologic units |
| WBDLine | Watershed Boundary Dataset line |
| NonContributingDrainageArea | Area that does not flow to the outlet of a hydrologic unit |
| NonContributingDrainageLine | Edge of noncontributing area |
| NWISDrainageArea | Drainage-area polygons for streamgages from NWIS |
| NWISDrainageLine | Edge of area draining to streamgages |
Table 3.
Structure of tables and rasters in the National Hydrography Dataset Plus High Resolution (NHDPlus HR).[NHDPlus HR, National Hydrography Dataset Plus High Resolution; VPU, vector-processing unit; v, version; NHD, National Hydrography Dataset; FGDC, Federal Geographic Data Committee; FOD, Feature Object Data; TIFF, tag image file format (extension .tif); 3DEP DEM, 3D Elevation Program digital elevation model; RClass, relationship class, RPU, raster processing unit; EROM, Enhanced Runoff Method; VAA, value-added attribute; WBD, Watershed Boundary Dataset]
Main Data Components of the NHDPlus HR VPU Datasets and How They Fit Together
This section describes the main data components of the NHDPlus HR VPU datasets and how most of the separate feature classes, rasters, and tables all fit together as one cohesive dataset. Figure 3 provides examples of how the data are tied together to create one system of stream network data. Feature classes, tables, and rasters all fit together within the NHDPlus HR data model structure, with NHDPlusID as the main interconnecting link (or “Join Item”) between the various datasets. Figure 3 is followed by descriptions of each feature class, table, raster, and their components. Complete descriptions are not given for components that are inherited from NHD or WBD. These feature classes and tables were included directly from the NHD or WBD, and the only modifications made were to add NHDPlusID and VPUID fields to the feature class attribute tables. Posters summarizing the data components of the NHDPlus HR National and VPU Data can be found on the web at https://www.usgs.gov/media/files/national-hydrography-dataset-plus-high-resolution-nhdplus-hr-national-data-model-v201 (USGS, 2023b) and https://www.usgs.gov/media/files/national-hydrography-dataset-plus-high-resolution-nhdplus-hr-vector-processing-unit-vpu (USGS 2023c), respectively.
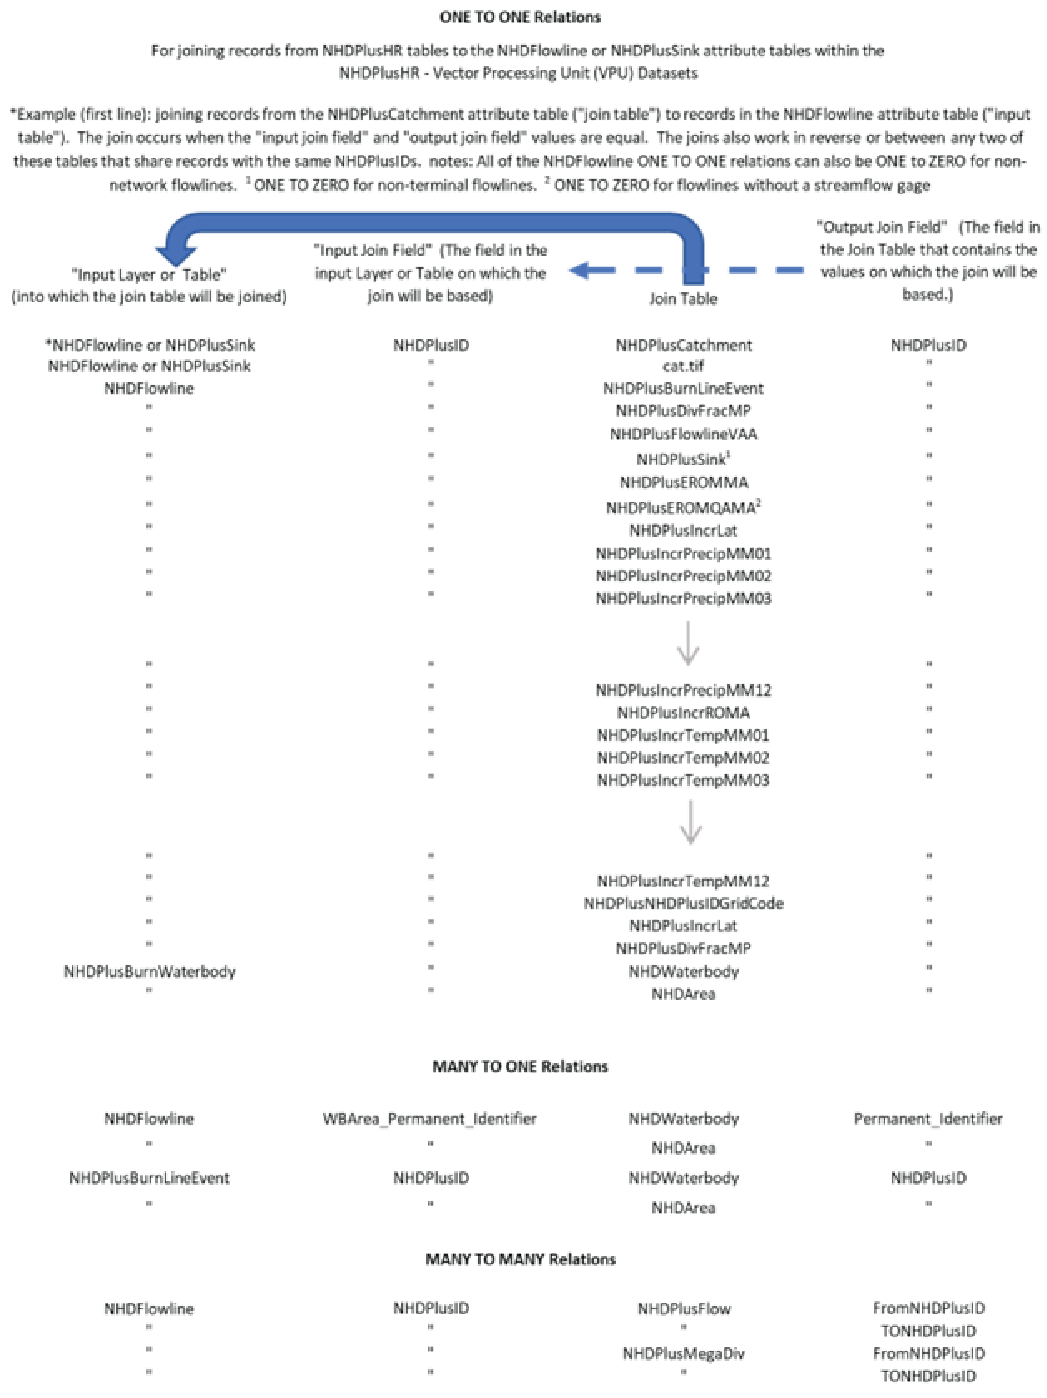
Chart showing relations among feature classes, tables, and rasters in the U.S. Geological Survey National Hydrography Dataset Plus (NHDPlus) High Resolution (NHDPlus HR) Vector Processing Unit (VPU) Datasets.
Feature Classes of the NHDPlus HR VPU Data Model
NHDPlusCatchment
Description.—Contains a catchment polygon for either a NHDFlowline feature or a NHDPlusSink feature (table 4). Some polygons may be multipart polygons.
Table 4.
NHDPlusCatchment polygon features in the National Hydrography Dataset Plus High Resolution (NHDPlus HR).[Refers to the NHDPlusCatchment polygon features table in the NHDPlus_H_<vpuid>_HU<level>_<PublicationDate>_GDB file geodatabase, where VPUID is the identifier of each vector-processing unit (VPU). The table describes attributes for catchment polygons for NHDFlowline or sink features. The geometric shape of the features is polygonal; the feature class does not include measures of distances (M) or elevation (Z) values. NA, not applicable]
Burn Components
Catchments are created by a separate raster process that requires five additional feature classes created specifically for the purpose of producing catchments. These data, used to create the catchments, are as follows:
NHDPlusBurnLineEvent Line Feature Class
Description.—Events that describe the parts of the NHDFlowline features used for hydroenforcement (table 5). Note: these line features are based on reaches (ReachCode) and may not capture the entire reach, particularly in areas where very short segments exist, at confluences, or in headwater catchments. The term “hydroenforcement” refers to aligning the 3DEP DEM data to the streams in the high-resolution NHDPlus drainage network. This alignment is achieved through lowering raster cell values that either coincide with or are near the mapped stream network onto the 3DEP DEM (creating virtual trenches at the locations of the streams).
Other spatial features (tables 6, 7, and 8) are also used in hydroenforcement—for example, the raising of raster cell values that coincide with the WBD hydrologic divides through “walls” (lines of raster cells with greatly exaggerated elevation values). Additional features used in the hydroenforcement process include sinks, oceanic and lacustrine waterbodies, and estuaries. The resulting modified DEM is used to produce flow-direction rasters, catchments and other hydrologic derivatives that closely agree with the NHD (streams and waterbodies), WBD (divides), sinks, ocean, and estuary features.
Table 5.
NHDPlusBurnLineEvent line features used in hydroenforcement in the National Hydrography Dataset Plus High Resolution (NHDPlus HR).[Refers to the NHDPlusBurnLineEvent line feature class in the NHDPlus_H_<vpuid>_HU<level>_<PublicationDate>_GDB file geodatabase, where VPUID is the identifier of each vector-processing unit (VPU). This table lists the NHDPlusBurnLineEvent attributes, many of which are used in the hydroenforcement process. The geometry of the feature class is polylines; the feature class does not contain measure (M) or elevation (Z) values. NHDPlus, National Hydrography Dataset Plus; NHDPlus HR, National Hydrography Dataset Plus High Resolution; NA, not available]
NHDPlusBurnWaterbody Polygon Feature Class
Description.—NHDWaterbody and NHDArea features used for hydroenforcement (table 6).
Table 6.
NHDPlusBurnWaterbody polygon features used for hydroenforcement for waterbodies in the National Hydrography Dataset Plus High Resolution (NHDPlus HR).[This table refers to the NHDPlusBurnWaterbody polygon feature class in the NHDPlus_H_<vpuid>_HU<level>_<PublicationDate>_GDB file geodatabase, where VPUID is the identifier of each vector-processing unit. This table lists details of the NHDWaterbody and NHDArea polygon features used for hydroenforcement. The geometry of the feature class is polygon; the feature class does not contain measure (M) or elevation (Z) values. NHDPlus, National Hydrography Dataset Plus; NA, not available]
| Field name | Data type | Allow nulls | Alias name | Domain | Precision | Scale | Length | Comments |
|---|---|---|---|---|---|---|---|---|
| OBJECTID | Object identifier | No | NA | NA | NA | NA | NA | |
| SHAPE | Geometry | Yes | NA | NA | NA | NA | NA | |
| NHDPlusID | Double | Yes | NA | NA | 0 | 0 | NA | NHDPlus identifier for a feature, nationally unique |
| SourceFC | String | Yes | SourceFeatureClass | NA | NA | NA | 20 | Source “NHDWaterbody” or “NHDArea” |
| OnOffNet | Short integer | Yes | OnNetwork | NoYes | 0 | NA | NA | On/Off network flag, 1=on, 0=off |
| PurpCode | String | Yes | PurposeCode | PurposeCode | NA | NA | 2 | Code describing purpose of feature (table 30, p. 37) |
| Burn | Short integer | Yes | NA | NoYes | 0 | NA | NA | Will feature be hydroenforced? 0=no, 1=yes |
| VPUID | String | Yes | NA | NA | NA | NA | 8 | Vector processing-unit identifier |
| SHAPE_Length | Double | Yes | NA | NA | 0 | 0 | NA | Total length of the polygon's perimeter, in geographic units (degrees) |
| SHAPE_Area | Double | Yes | NA | NA | 0 | 0 | NA | Area of the polygon, in geographic units (degrees by degrees) |
NHDPlusLandSea Polygon Feature Class
Description.—Polygons used for hydroenforcement along coastlines in the NHDPlus HR (table 7).
Table 7.
NHDPlusLandSea polygon features used for hydroenforcement of coastlines and estuaries in the National Hydrography Dataset Plus High Resolution (NHDPlus HR).[Refers to the NHDPlusLandSea polygon feature class in the NHDPlus_H_<vpuid>_HU<level>_<PublicationDate>_GDB file geodatabase, in which VPUID is the identifier of each vector-processing unit. This table describes polygons used for hydroenforcement along coastlines. The geometry of the feature class is polygon; the feature class does not contain measures (M) along the features or elevation (Z) values. NA, not available]
NHDPlusSink Point Feature Class
Description.—Point locations of sinks used for hydroenforcement (table 8).
Table 8.
NHDPlusSink point features used for sink-point locations in the National Hydrography Dataset Plus High Resolution (NHDPlus HR).[Refers to the NHDPlusSink point feature class in the NHDPlus_H_<vpuid>_HU<level>_<PublicationDate>_GDB file geodatabase, where VPUID (vpuid) is the identifier of each vector-processing unit (VPU) and RPUID (rpuid) is the identifier of each raster-processing unit. Point locations of sinks used for hydroenforcement. The geometry of the feature class is point; the feature class does not contain measures (M) or elevation (Z) values. NHDPlus HR, National Hydrography Dataset Plus High Resolution; NA, not available]
| Field name | Data type | Allow nulls | Alias name | Domain | Precision | Scale | Length | Comments |
|---|---|---|---|---|---|---|---|---|
| OBJECTID | Object identifier | No | NA | NA | NA | NA | NA | |
| SHAPE | Geometry | Yes | NA | NA | NA | NA | NA | |
| NHDPlusID | Double | Yes | NA | NA | 0 | 0 | NA | Nationally unique identifier of sink point |
| GridCode | Long integer | Yes | NA | NA | 0 | NA | NA | Compacted numeric identifier of catchment, unique within each VPU |
| PurpCode | String | Yes | PurposeCode | PurposeCode | NA | NA | 2 | Code describing purpose of sink (table 30, p. 37) |
| FeatureID | Double | Yes | NA | NA | 0 | 0 | NA | Identifier of feature in another related feature |
| SourceFC | String | Yes | SourceFeatureClass | NA | NA | NA | 20 | Feature class referenced by FeatureID |
| RPUID | String | Yes | NA | NA | NA | NA | 8 | Raster processing-unit identifier |
| StatusFlag | String | Yes | NA | StatusFlag | NA | NA | 1 | Flag reserved for NHDPlus HR production process (A=add; C=change; D=delete; N=Not set) |
| Catchment | Short integer | Yes | NA | NoYes | 0 | NA | NA | Will feature receive catchment? 0=no, 1=yes |
| Burn | Short integer | Yes | NA | NoYes | 0 | NA | NA | Will feature be hydroenforced? 0=no, 1=yes |
| VPUID | String | Yes | NA | NA | NA | NA | 8 | Vector processing-unit identifier |
NHDPlusWall Line Feature Class
Description.—Lines used as “walls” in hydroenforcement (table 9).
Table 9.
NHDPlusWall line features used for walls in hydroenforcement in the National Hydrography Dataset Plus High Resolution (NHDPlus HR).[Refers to the NHDPlusWall line feature class in the NHDPlus_H_<vpuid>_HU<level>_<PublicationDate>_GDB file geodatabase, where VPUID is the identifier of each vector-processing unit. This table details specifications of lines used as walls in hydroenforcement. The geometry of the feature class is polyline; the feature class does not contain measures (M) or elevation (Z) values. NA, not available]
Raster Datasets
This section includes descriptions of the raster attributes in the NHDPlus HR. The rasters are in the \HRNHDPlusRasters<vpuid> folder. A raster-attribute table is required and included for the catchment raster (abbreviated in the table as “cat”). The other rasters (for example, catseed, elev_cm, fac, filldepth, and hydrodem), however, are not required to have attribute tables because no other information is stored in these rasters except for the cell value itself. Other rasters, particularly ones with many unique values, will not always have attribute tables, but some may be created while processing occurs. All rasters are stored as integers. Information about projections for rasters in various geographic areas is listed in table 1.
cat.tif
Description.—Rasters of catchments. Within a VPU, each catchment has a unique GridCode value with a one-to-one match to the NHDPlusID field code values (table 10). GridCode values are unique within a VPU, however, are not nationally unique.
catseed.tif
Description.—The catseed.tif is the raster representation of the NHDPlusBurnLineEvent features. Cell values correspond to the portions of the NHDFlowline that will be used to create catchments. Catchments are created using the ArcGIS watershed tool, https://pro.arcgis.com/en/pro-app/latest/tool-reference/spatial-analyst/watershed.htm, with the catseed.tif raster as the input raster and the fdr.tif raster as the flow-direction raster. The pixel value of catseed.tif will match the cat.tif pixel value. NoData cells are cells which do not serve as seeds to the catchments.
elev_cm.tif
Description.—Elevation raster projected to raster-coordinate system. Elevation values are represented as integers in centimeters relative to the North American Vertical Datum of 1988 (NAVD 88). An attribute table is not created for this raster.
hydrodem.tif
Description.—A raster of integer values of the hydrologically conditioned digital elevation model (HydroDEM) with the NHDPlusBurn components integrated into the digital elevation model and then filled. This raster is used to generate the flow-direction raster (fdr.tif) from which the flow-accumulation (fac.tif) and catchment (cat.tif) rasters are generated. The elevations are in the same units as elev_cm.tif (centimeters). Because the hydrologic conditioning greatly modifies elevation values, this raster is used only for deriving flow direction. Other analyses should use elev_cm.tif.
fac.tif
Description.—Flow-accumulation values based on the HydroDEM, where the cell values of the raster are defined as the number of cells within the RPU draining to each cell within the RPU. Further information is available in the Esri ArcGIS documentation of the Flow Accumulation tool (https://pro.arcgis.com/en/pro-app/latest/tool-reference/spatial-analyst/flow-accumulation.htm).
fdr.tif
Description.—Integer flow-direction raster that contains the codes that show the direction water would flow from each raster cell within the RPU based on the HydroDEM. The raster is saved as 8-bit unsigned. Cell values of the raster indicate downward direction of flow to a neighboring cell or 0 (zero) if the cell is a sink (end of flow). Directions are assigned according to the values in table 11.
Table 11.
Attributes of the flow-direction raster (fdr.tif) in the National Hydrography Dataset Plus High Resolution (NHDPlus HR).[Refers to the \HRNHDPlusRasters<vpuid>\fdr.tif rasters, where VPUID is the identifier of each vector-processing unit]
fdroverland.tif
Description.—Overland flow-direction raster. This raster is the same as fdr.tif except that cells coincident with flowlines and waterbodies along the network are set to NoData. The raster is saved as 8-bit unsigned (values are all positive). The fdroverland.tif raster can be used with the FlowLength function in the ArcGIS Spatial Analyst Toolbox to determine the overland flow-path length from each raster cell to a NoData cell representing a stream, open waterbody, or coastline. Flow-length rasters, created in this manner, are useful for a variety of applications, including determining buffer areas along the banks of rivers or lakes.
filldepth.tif
Description.—Raster showing the difference between the HydroDEM raster just before filling in isolated topographic lows and the final HydroDEM raster hydrodem.tif. Cell values of the raster are the fill-depth values, in centimeters. This raster is useful for examining the results of the hydrological-conditioning process and in identifying areas where the ingredient dataset (NHD, WBD, and 3DEP) may present conflicting information that is not rectified by the hydrodem processing. The hydrologically conditioned raster before filling can be recreated by subtracting this raster from hydrodem.tif. Note that some fill depths are very large because of the exaggerated values used to ensure alignment of raster and vector layers at streams and catchment divides.
shdrelief.jp2
Description.—Shaded-relief raster built from the elevation raster in the raster coordinate system (elev_cm.tif). Cell values of shaded-relief brightness are scaled from 0 to 255. More details are available in the ArcGIS documentation for the Hill Shade tool (https://pro.arcgis.com/en/pro-app/latest/help/analysis/raster-functions/hillshade-function.htm). The raster is saved as 8-bit unsigned. This raster is useful for display purposes where a shaded relief image is useful as a background.
swnet.tif
Description.—Raster that includes all cells on the flowline network (as represented in BurnlineEvent where the attribute Catchment=1; see table 5) and cells on certain waterbodies. Cell values are assigned 1 if the cell represents a flowline location, or 2 if it is a waterbody cell that represents an open waterbody (lakes, ponds, and so forth, but not wetlands) and intersects a flowline (table 12). Cell values for waterbodies which are not connected to the flow network and all other cells not on the network are assigned values of NoData. The raster is saved as 8-bit unsigned. The raster is useful for analyzing properties of the surface water network.
NHDPlus HR Tables
NHDPlus HR includes a set of tables with value-added attributes in addition to the standard NHD attributes which enhance stream-network navigation, analysis, and display.
NHDPlusFlow Table
Description.—The NHDPlusFlow table describes flowing and nonflowing connections among NHDFlowline features (table 13).The NHDPlusFlow table contains data for headwater and terminal NHDFlowline features, pairs of NHDFlowline features that exchange water, NHDFlowline features that connect to coastline NHDFlowline features, and coastline NHDFlowline features that connect to each other. Connections to or between coastline features are considered nonflowing. Although unique node numbers are identified in the NHDPlusFlow table, it should be noted that there is no set of features for these nodes.
Table 13.
Flow connections in the NHDPlusFlow table among flowline features in the National Hydrography Dataset Plus High Resolution (NHDPlus HR).[Refers to the NHDPlusFlow table in the in the NHDPlus_H_<vpuid>_HU<level>_<PublicationDate>_GDB file geodatabase, where VPUID is the identifier of each vector-processing unit. NA, not available]
Values for ToNHDPID, ToVPUID and ToPermID may be missing or temporarily assigned. Nationally consistent updated values for these attributes are provided in the National Release 1 (USGS, 2022b), at https://doi.org/10.5066/P9WFOBQI, and in the National Hydrography Dataset Plus High Resolution map service, https://hydro.nationalmap.gov/arcgis/rest/services/NHDPlus_HR/MapServer. This table can be linked to other NHDPlus HR data that contains the NHDPlusFlowline NHDPlusID (including the NHDPlusFlowline feature class itself).
The original NHD included a table called NHDFlow with flow connections that comprised only geometric connections among NHDFlowline features. The NHDPlusFlow table, on the other hand, may include nongeometric as well as geometric connections. Nongeometric connections may be used to represent situations where flow probably connects through underground, indistinct, or unidentified pathways (fig. 4). The NHDPlus HR dataset currently (October 2024) does not contain any nongeometric connections, but an ongoing project, led by the EPA, is developing such connections, to be published separately.
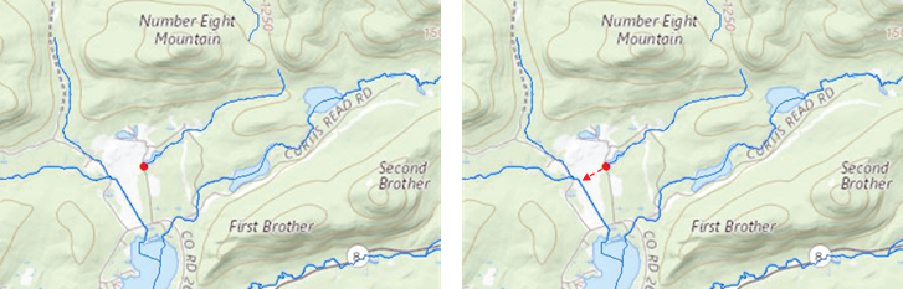
An example map demonstrating an ongoing effort (as of 2024) to use “nongeometric connections” to repair the network connectivity in the National Hydrography Dataset Plus High Resolution (NHDPlus HR). The red dot is the end of an isolated network that should be connected. Nongeometric connections allow tabular connections from the downstream end of an isolated network to either the upstream or downstream end of the flowline into which the flow of the water can be modeled within the NHDPlus HR network.
When initially developed, the NHDPlus HR data were created starting with headwater VPUs, then downstream VPUs were processed in such a way that required all upstream VPUs to have been processed. As any VPU was processed, the data for downstream VPUs did not yet exist, so values were assigned to the following NHDPlusFlow attributes, as if the VPU was the end of the hydrographic network. The following attributes had missing values (field aliases given in parentheses):
Batches of VPUs (usually corresponding to HU2 Regions) often were released together with updated values for these attributes, but the temporary values still exist in many of the VPU-based datasets as distributed. Nationally consistent updated values for these attributes are provided in the National Release 1, at https://doi.org/10.5066/P9WFOBQI (USGS, 2022b), and in the NHDPlus_HR map service, https://hydro.nationalmap.gov/arcgis/rest/services/NHDPlus_HR/MapServer. For applications for which the above attributes are important, users may update the NHDPlusFlow table manually, or get the NHDPlus HR National Release 1 dataset. See the “National Data Model and Release” section for more information on National Release 1 (USGS, 2022b). To manually update NHDPlusFlow for an individual VPU, append the NHDPlusFlow table(s) from any VPU(s) immediately downstream to the VPU’s NHDPlusFlow table, and remove or ignore any records having ToNHDPID=0 and Direction=709 (within network). The “direction” field in the flow table refers to the network position of the flowline (within network, network start, network end, or nonflowing).
NHDPlusDivFracMP Table
Description.—Specifications about the fraction of a cumulative attribute to be routed through each path in a divergence (table 14). The NHDPlusIDs in this table represent NHDFlowline surface-water features that, based on the NHDPlusFlow table (table 13), form a network divergence (a flow split). All the paths in a given divergence are identified in this table by unique node-identification numbers (NodeNumber). Although unique node numbers are identified in this DivFracMP table, it should be noted that there is no set of features for these nodes.
Table 14.
Fraction of flow or other cumulative attribute in the NHDPlusDivFracMP table routed through each path in a divergence in the National Hydrography Dataset Plus High Resolution (NHDPlus HR).[Refers to the NHDPlusDivFracMP table in the NHDPlus_H_<vpuid>_HU<level>_<PublicationDate>__GDB file geodatabase, where VPUID is the identifier of each vector-processing unit; this table lists flow values for divergent paths. NHDPlus, National Hydrography Dataset Plus; NHDPlus HR, National Hydrography Dataset Plus High Resolution; NA, not available]
| Field name | Data type | Allow nulls | Alias name | Domain | Precision | Scale | Length | Comments |
|---|---|---|---|---|---|---|---|---|
| OBJECTID | Object identifier | No | NA | NA | NA | NA | NA | |
| NHDPlusID | Double | Yes | NA | NA | 0 | 0 | NA | NHDPlus identifier for a flowline feature |
| NodeNumber | Double | Yes | NA | NA | 0 | 0 | NA | Unique identifier for point at top (start or from node) of flowline |
| DivFrac | Double | Yes | DivergenceFraction | NA | 0 | 0 | NA | Fraction for routing cumulative attribute, must be a value between 0 and 1, unless unknown (−9998) |
| StatusFlag | String | Yes | NA | StatusFlag | NA | NA | 1 | Flag reserved for NHDPlus HR production process (see table 31) |
| VPUID | String | Yes | NA | NA | NA | NA | 8 | Vector-processing-unit identifier |
All divergences are represented in this DivFracMP table. If values are specified in the DivFrac attribute, then they are used in the Divergence Routing method of all NHDPlus accumulated attributes, such as drainage area. Divergences for which no information is known about the fractional split are assigned DivFracMP.DivFrac=“−9998” for all paths in the divergence. In this case, the Divergence Routing method uses the PlusFlowlineVAA.Divergence field and routes a fraction of 1 to the main path (Divergence=1) and a fraction of 0 to all other paths (Divergence=2). When not set to “−9998,” the sum of the DivFrac values for all paths in a divergence (all records with the same NodeNumber) must equal 1.
NHDPlusMegaDiv Table
Description.—Table containing the NHDPlusFlow records for divergences that have more than two outflow paths. Used in downstream tracking of multiple paths (table 15). The NHDPlusMegaDiv table has an alias name of NHDPlusMultipleDivergence.
Table 15.
Flow paths in the NHDPlusMegaDiv table routed through divergence features that have more than two outflow paths in the National Hydrography Dataset Plus High Resolution (NHDPlus HR).[Refers to the NHDPlusMegaDiv table in the NHDPlus_H_<vpuid>_HU<level>_<PublicationDate>_GDB file geodatabase, where VPUID is the identifier of each VPU (vector-processing unit). Updated by using the NHDPlus HR production process. NA, not available]
NHDPlusFlowlineVAA Table
Description.—Value-added attributes for each NHD-Flowline feature that appears in the NHDPlusFlow table (or where NHDFlowline.FlowDir=“With Digitized”). The NHDPlus HR production process populates the NHDPlusFlowlineVAA table (table 16). The NHDPlusFlowlineVAA table differs from the NHDFlowlineVAA table because the NHDFlowlineVAA table is an official table in the NHD schema that contains all value-added attribute values that are stored in the NHD central database but is not populated by the NHDPlus HR production process. Additional information on value-added attributes can be found in steps C, F, Q, and R in the “NHDPlus HR Production Process Description” section of this report.
Table 16.
Value-added attributes in the NHDPlusFlowlineVAA table for features in the NHDFlowline class in the National Hydrography Dataset Plus High Resolution (NHDPlus HR).[Refers to the NHDPlusFlowlineVAA table in the NHDPlus_H_<vpuid>_HU<level>_<PublicationDate>_GDB file geodatabase, where VPUID is the identifier of each vector-processing unit (VPU). Describes flowing and nonflowing connections between NHDFlowline features. NHDPlus, National Hydrography Dataset Plus; NHDPlus HR, National Hydrography Dataset Plus High Resolution; NA, not available]
| Field name | Data type | Allow nulls | Alias name | Domain | Precision | Scale | Length | Comments |
|---|---|---|---|---|---|---|---|---|
| OBJECTID | Object identifier | No | NA | NA | NA | NA | NA | |
| NHDPlusID | Double | Yes | NA | NA | 0 | 0 | NA | NHDPlus identifier for a flowline feature |
| StreamLeve | Short integer | Yes | StreamLevel | NA | 0 | NA | NA | Stream level1 |
| StreamOrde | Short integer | Yes | StreamOrder | NA | 0 | NA | NA | Modified Strahler stream order |
| StreamCalc | Short integer | Yes | StreamCalculator | NA | 0 | NA | NA | Further modification of stream order |
| FromNode | Double | Yes | NA | NA | 0 | 0 | NA | NHDPlusID of the upstream end of flowline |
| ToNode | Double | Yes | NA | NA | 0 | 0 | NA | NHDPlusID of the downstream end of flowline |
| HydroSeq | Double | Yes | HydrologicSequence | NA | 0 | 0 | NA | Hydrologic sequence number; places flowlines in hydrologic order; processing NHDFlowline features in ascending order, encounters the features from downstream to upstream; processing the NHDFlowline features in descending order, encounters the features from upstream to downstream |
| LevelPathI | Double | Yes | LevelPathIdentifier | NA | 0 | 0 | NA | Level-path identifier; hydrologic sequence number of most downstream NHDFlowline feature in the level path1 |
| PathLength | Double | Yes | PathLength | NA | 0 | 0 | NA | Distance downstream to network end, in kilometers1 |
| TerminalPa | Double | Yes | TerminalPathIdentifier | NA | 0 | 0 | NA | Terminal-path identifier hydrologic sequence number of terminal NHDFlowline feature path1 |
| ArbolateSu | Double | Yes | UpstreamCumulativeStreamKm | NA | 0 | 0 | NA | Arbolate sum, the sum of the lengths of all digitized flowlines upstream from the downstream end of the immediate flowline, in kilometers |
| Divergence | Short integer | Yes | DivergenceCode | Divergence | 0 | NA | NA | 0=no divergence, 1=major path, 2=minor path |
| StartFlag | Short integer | Yes | IsHeadwater | NoYes | 0 | NA | NA | Start flag (0=not a headwater start, 1=headwater start) |
| TerminalFl | Short integer | Yes | IsNetworkEnd | NoYes | 0 | NA | NA | Terminal flag (0=not a network end, 1=network end) |
| UpLevelPat | Double | Yes | UpstreamMainPathLevelPathI | NA | 0 | 0 | NA | Upstream main-path level path identifier |
| UpHydroSeq | Double | Yes | UpstreamMainPathHydroSeq | NA | 0 | 0 | NA | Upstream main-path hydrosequence identifier |
| DnLevel | Short integer | Yes | DownstreamMainPathStreamLevel | NA | 0 | NA | NA | Stream level of downstream flowline1 |
| DnLevelPat | Double | Yes | DownstreamMainPathLevelPathID | NA | 0 | 0 | NA | Downstream main-stem level-path identifier1 |
| DnHydroSeq | Double | Yes | DownstreamMainPathHydroSeq | NA | 0 | 0 | NA | Downstream main-stem hydrosequence identifier1 |
| DnMinorHyd | Double | Yes | DownstreamMinorHydroSequence | NA | 0 | 0 | NA | Downstream minor-path hydrosequence identifier1 |
| DnDrainCou | Short integer | Yes | DownstreamDrainageCount | NA | 0 | NA | NA | Count of flowlines immediately downstream1 |
| FromMeas | Double | Yes | FromMeasure | NA | 0 | 0 | NA | ReachCode measure at top of flowline (percent of ReachCode route at upstream end of flowline; note measures are given in percent from downstream end of the one or more NHDFlowline features that are assigned to the ReachCode with 0 [zero] at the downstream end) |
| ToMeas | Double | Yes | ToMeasure | NA | 0 | 0 | NA | ReachCode measure at bottom of flowline (percent of ReachCode route at downstream end of flowline) |
| ReachCode | String | Yes | NA | NA | NA | NA | 14 | Unique reach identifier |
| RtnDiv | Short integer | Yes | HasReturningDivergence | NoYes | 0 | NA | NA | Returning-divergence flag; 0=no upstream divergences return at the top of this NHDFlowline feature, 1=one or more upstream divergences returned to the network at the top of this NHDFlowline feature |
| Thinner | Short integer | Yes | ThinnerCode | NA | 0 | NA | NA | Code for thinning the network; not in use |
| VPUIn | Short integer | Yes | NA | NoYes | 0 | NA | NA | Are there VPU inflows? 0=no, 1=yes |
| VPUOut | Short integer | Yes | NA | NoYes | 0 | NA | NA | Are there VPU outflows? 0=no, 1=yes |
| AreaSqKm | Double | Yes | NA | NA | 0 | 0 | NA | Catchment area, in square kilometers |
| TotDASqKm | Double | Yes | TotalDrainageAreaSqKm | NA | 0 | 0 | NA | Total cumulative area, in square kilometers |
| DivDASqKm | Double | Yes | DivergenceRoutedDrainAreaSqKm | NA | 0 | 0 | NA | Divergence-routed cumulative area, in square kilometers |
| MaxElevRaw | Double | Yes | MaximumElevationRaw | NA | 0 | 0 | NA | Maximum elevation raw (not smoothed), in centimeters |
| MinElevRaw | Double | Yes | MinimumElevationRaw | NA | 0 | 0 | NA | Minimum elevation raw, in centimeters |
| MaxElevSmo | Double | Yes | MaximumElevationSmoothed | NA | 0 | 0 | NA | Maximum elevation smoothed, in centimeters |
| MinElevSmo | Double | Yes | MinimumElevationSmoothed | NA | 0 | 0 | NA | Minimum elevation smoothed, in centimeters |
| Slope | Double | Yes | NA | NA | 0 | 0 | NA | Slope of the flowline from smoothed elevation (unitless) |
| SlopeLenKm | Double | Yes | SlopeLengthKm | NA | 0 | 0 | NA | Flowline length used to calculate slope, in kilometers. Will be less than NHDFlowline.LengthKM if the NHDFlowline feature was trimmed during the hydro-enforcement process. |
| ElevFixed | Short integer | Yes | IsElevationFixed | NoYes | 0 | NA | NA | Flag indicating if downstream elevation is fixed. 0=not held stationary, 1=held stationary and not changed in the smoothing process |
| HWType | Short integer | Yes | HeadwaterType | Headwater-Type | 0 | NA | NA | Headwater type, 0=real, 1=artificial |
| HWNodeSqKm | Double | Yes | HeadwaterNodeDrainageAreaSqKm | NA | 0 | 0 | NA | Area that drains to the headwater node in square kilometers |
| StatusFlag | String | Yes | NA | StatusFlag | NA | NA | 1 | Flag reserved for NHDPlus HR production process (see table 31) |
| VPUID | String | Yes | NA | NA | NA | NA | 8 | Vector-processing unit identifier |
As stated earlier, when initially developed, the NHDPlus HR data were created starting with headwater VPUs, then downstream VPUs were processed in such a way that ensures all upstream VPUs had already been processed. As any VPU was processed, the data for downstream VPUs did not yet exist, so temporary values were assigned to the following value-added attributes (VAAs), as if the VPU was the end of the hydrographic network (field aliases given in parentheses):
-
• StreamLeve (StreamLevel)
-
• LevelPathI (LevelPathIdentifier)
-
• PathLength (PathLength)
-
• TerminalPa (TerminalPathIdentifier)
-
• DnLevel (DownstreamMainPathStreamLevel)
-
• DnLevelPat (DownstreamMainPathLevelPathID)
-
• DnHydroSeq (DownstreamMainPathHydroSeq)
-
• DnMinorHyd (DownstreamMinorHydroSequence)
-
• DnDrainCou (DownstreamDrainageCount)
Batches of VPUs (usually corresponding to HU2 Regions) often were released together with updated values for these attributes, but the temporary values still exist in many of the VPU-based datasets as distributed. Nationally consistent updated values for these attributes are provided in the National Release 1 (USGS, 2022b; https://doi.org/10.5066/P9WFOBQI) and in the NHDPlus_HR map service, https://hydro.nationalmap.gov/arcgis/rest/services/NHDPlus_HR/MapServer. Values for the first four attributes listed above are updated for all connected flowlines upstream of a VPU outlet, while values for the remaining five attributes are updated only for flowlines that are VPU outlets. Therefore, for applications for which any of the above attributes are important, the NHDPlus HR National Release 1 or NHDPlus_HR map service data are recommended. See the “National Data Model and Release” section for more information.
NHDPlusEROMMA Table
Description.—Table of Enhanced Runoff Method (EROM) mean annual flow estimates for NHDFlow line features in the NHDPlus HR network (table 17). For NHDPlus HR VPU datasets having publication dates prior to 2022, as well as National Release 1 at https://doi.org/10.5066/P9WFOBQI (USGS, 2022b), the flow estimates are for the 1970–2000 period. For NHDPlus HR VPU datasets having publication dates in 2022 or later, the flow estimates are for the 1990–2019 period. All flow estimates are in cubic feet per second (cfs or ft3/s) and represent the flow at the downstream end of the NHDFlowline feature. All velocity computations are in feet per second and represent the velocity associated with the flow at the downstream end of the NHDFlowline feature based on the Jobson (1996) method (see step T of the “NHDPlus HR Production Process Description” section in this report).
Table 17.
Fields used to calculate mean annual flow estimates in the NHDPlusEROMMA table in the National Hydrography Dataset Plus High Resolution (NHDPlus HR).[Refers to the NHDPlusEROMMA table in the NHDPlus_H_<vpuid>_HU<level>_<PublicationDate>_GDB file geodatabase, where VPUID is the identifier of each vector-processing unit. All flow rates are in cubic feet per second (ft3/s), and all velocity values are in feet per second (ft/s). ET, evapotranspiration; EROM, Enhanced Runoff Method; NA, not available]
EROM uses a six-step flow-estimation procedure and populates the NHDPlusEROM and NHDPlusEROMQA tables. The steps are as follows:
-
Step 1. The unit runoff step uses a raster produced by a flow-balance model (McCabe and Wolock, 2011) to compute the initial estimates for the mean annual streamflow (QAMA) values. The McCabe and Wolock (2011) software produces a raster representing mean-annual runoff at 1-km resolution for either the 1970–2000 or 1990–2019 period, as appropriate. This raster is overlaid on catchments to compute mean-annual runoff by catchment and accumulated downstream.
-
Step 2. This step computes estimates of losses caused by excessive evapotranspiration (ET). EROM incorporates a “losing streams” methodology (loss in streamflow that can be caused by excessive evapotranspiration from the stream channels). Estimates of the loss made in this step are subtracted from the QAMA flow estimates and are stored in the mean annual streamflow modification-B (QBMA) attribute.
Steps 1 and 2 are designed to estimate what is called “natural flow.” Step 1 uses the flow-balance-runoff catchment values, which estimate the runoff from each catchment. Step 2 is designed to take instream losses caused by natural hydrologic processes into account. This loss of instream flow is an important observed phenomenon, especially in areas west of the Mississippi River.
-
Step 3. This log-log regression step uses reference gages to provide an additional adjustment to the flow estimates. Reference gages (Falcone and others, 2010) are gages on streams that are considered to have flows that are largely unaffected by human activities. This regression improves the mean annual flow estimates. Estimates made in this step are applied to the QBMA flow estimates and are stored in the mean annual streamflow modification-C (QCMA) attribute.
-
Step 4. This step adjusts the streamflow for flow transfers, withdrawals, and augmentations by using the NHDPlusAdditionRemoval table. Estimates made in this step are applied to the QCMA flow estimates and are stored in the mean annual streamflow modification-D (QDMA) attribute. Note that to date (as of 2024) the NHDPlusAdditionRemoval table is empty and therefore this step has no effect on any NHDPlus HR data published to date.
-
Step 5. This is the gage-adjustment step, which is based on the observed flow at the gage. Only gages that meet certain criteria are used to carry out gage adjustment. The gage-adjusted flow estimates should be considered the “best” NHDPlus HR flow estimates for use in models and analyses. Adjustments made in this step are applied to the QDMA flow estimates and are stored in the mean annual streamflow modification-E (QEMA) attribute.
-
Step 6. In this step, also referred to as the Gage Sequestration Step, a proportion (typically 20 percent) of the gages are randomly removed from the gage-adjustment process, which then provides a basis for an estimate of the accuracy of the flow estimates created in step 5. The streamflow estimates from this step are similar to the step 5 flows, except a random 20 percent of the gages are not used. This step is only useful as an approximate error estimate for the step 5 flows. The Gage Sequestration flows (QFMA and QFIncrMA) are included in the NHDPlusEROMMA results table for possible quality assurance uses. The QFMA flows should not be used in applications, because these flows are less accurate than the QEMA flows.
The best EROM streamflow and stream-velocity estimates are the gage-adjusted values, from streamflow calculation step 5 (NHDPlusEROMMA.QEMA, where QEMA is an attribute within the table NHDPlusEROMMA) and stream-velocity calculation step 6 (NHDPlusEROMMA.VEMA, where the mean annual velocity, VEMA, is an attribute within the NHDPlusEROMMAtable).
NHDPlusEROMQAMA Table
Description.—Statistical descriptions of initial estimates of streamflow from runoff for the EROM mean annual flow estimates are listed in the NHDPlusEROMQAMA table (table 18). The layout of the NHDPlusEROMQAMA table is designed to facilitate graphical and statistical analyses. All data values are adjusted for the downstream end of the flowline. The data in the table are sorted by GageRef; thus, all the reference gages are listed at the top of the table. This feature is useful for users who want to look at graphs or additional statistics for only the reference gages that represent more natural conditions.
Table 18.
Fields used in flow statistics in the NHDPlusEROMQAMA table in the National Hydrography Dataset Plus High Resolution (NHDPlus HR).[Refers to the NHDPlusEROMQAMA table in the NHDPlus_H_<vpuid>_HU<level>_<PublicationDate>_GDB file geodatabase, where VPUID is the identifier of each vector-processing unit. References Gages (identified where GageRef=1) are listed at the top of the actual NHDPlusEROMQAMA tables. NHDPlus, National Hydrography Dataset Plus; NWIS, National Water Information System; ET, evapotranspiration; ft3/s, cubic foot per second; (ft3/s)/km2, cubic foot per second (cfs) per square kilometer; NA, not available]
Note: The NHDPlusEROMQAMA table will be empty if no gages within the VPU meet the criteria for selection. To be selected for use in the EROM flow estimations, the streamflow-gaging station must be within the VPU being processed and have collected 10 years of continuous streamflow data within the period of reference (1970–2000 or 1990–2019), and the gage drainage area reported in the National Water Information System (NWIS) database (https://waterdata.usgs.gov/nwis) must be within 25 percent of the drainage area provided with the associated NHDPlus flowline.
NHDPlusEROMQARpt Table
Description.—Contains comparisons of the EROM flow estimates and the observed streamgage flows (table 19). The report is stored in the form of a table.
Table 19.
Fields containing a cumulative runoff statistics report for each vector-processing unit in the NHDPlusEROMQARpt table in the National Hydrography Dataset Plus High Resolution (NHDPlus HR).[Refers to the NHDPlusEROMQARpt table in the NHDPlus_H_<vpuid>_HU<level>_<PublicationDate>_GDB file geodatabase, where vpuid is the identifier of each vector-processing unit. RptLine, report text up to 120 characters; NA, not available]
NHDPlusIncrROMA Table
Description.—Mean annual runoff averaged over the area of each NHDPlus HR catchment. Mean annual-runoff values (table 20) were used in computing EROM mean annual-flow estimates. The runoff values are for the reference period, either 1970 to 2000 or 1990 to 2019. If a catchment extends beyond the geographic extent of the runoff data, the value will be the runoff over the part of the catchment which does have data. MissRMA will contain the area in the catchment where data were not available.
Table 20.
Fields used in the NHDPlusIncrROMA table for mean annual runoff averaged over the area of each catchment in the National Hydrography Dataset Plus High Resolution (NHDPlus HR).[Refers to the NHDPlusIncrROMA table in the NHDPlus_H_<vpuid>_HU<level>_<PublicationDate>_GDB file geodatabase, where VPUID is the identifier of each vector-processing unit. NHDPlus, National Hydrography Dataset Plus; NA, not available]
NHDPlusIncrLat Table
Description.—Mean latitude of each NHDPlus HR catchment (table 21). The mean latitude is needed for the potential evapotranspiration calculation, which is a part of the streamflow-estimation process.
Table 21.
Fields used in the NHDPlusIncrLat table for the mean latitude of each catchment in the National Hydrography Dataset Plus High Resolution (NHDPlus HR).[Refers to the NHDPlusIncrLat table in the NHDPlus_H_<vpuid>_HU<level>_<PublicationDate>_GDB file geodatabase, where VPUID is the identifier of each vector-processing unit. NHDPlus, National Hydrography Dataset Plus; NA, not available]
NHDPlusIncrPrecipMA and NHDPlusIncrPrecipMMmm
Description.—Mean annual and mean monthly precipitation, respectively, averaged over the area of each NHDPlus catchment (where “mm” in the NHDPlusIncrPrecipMMmm file name is substituted by values 01 through 12 to denote the months of January through December).The NHDPlusIncrPrecipMA table contains the mean annual precipitation, and each of the 12 NHDPlusIncrPrecipMMmm tables contains one month’s mean precipitation for each catchment. Note the EROM software computed the mean annual values by totaling the monthly values. For this reason, although the NHDPlusIncrPrecipMA table exists, it is not populated in most or all NHDPlus HR datasets because it is not needed for EROM flow estimation.
For 1970 to 2000, precipitation values were computed by using a raster that combined the data from the Parameter-Elevation Regressions on Independent Slopes Model (PRISM) for the conterminous United States (PRISM Climate Group, 2006) with data from a set of 1-kilometer (km) rasters for areas in Canada and Mexico (data from McKenney and others, 2006). For 1990–2019, data from the Daymet version 3 monthly climate summaries (Thornton and others, 2016) were used. Mean annual precipitation values were used in computing EROM mean annual flow estimates. The mean monthly precipitation values are used for estimating excess evapotranspiration in EROM.
If a catchment extends beyond the extent covered by the precipitation data, the value will be the average for the part of the catchment the data cover. The variables MissPMA and MissPMMmm (tables 22 and 23, respectively) will fill in the precipitation data for areas in the catchment for which data were not available.
Table 22.
Fields used in the NHDPlusIncrPrecipMA table for the mean annual precipitation averaged over the area of each catchment in the National Hydrography Dataset Plus High Resolution (NHDPlus HR).[Refers to the NHDPlusIncrPrecipMA table in the NHDPlus_H_<vpuid>_HU<level>_<PublicationDate>_GDB file geodatabase, where VPUID is the identifier of each vector-processing unit. Mean annual precipitation is not needed when estimating streamflow with Enhanced Runoff Method (EROM) and therefore this table is left blank. NHDPlus, National Hydrography Dataset Plus; NA, not available]
Table 23.
Fields used in the NHDPlusIncrPrecipMMmm tables for the mean monthly precipitation averaged over the area of each catchment in the National Hydrography Dataset Plus High Resolution (NHDPlus HR).[Refers to the NHDPlusIncrPrecipMMmm tables in the NHDPlus_H_<vpuid>_HU<level>_<PublicationDate>_GDB file geodatabase, where “mm” is the identifier for each month (with values of 01 to 12 that denote the months of January through December), and VPUID is the identifier of each vector-processing unit. NHDPlus, National Hydrography Dataset Plus; NA, not available]
Annual and Monthly Temperature
NHDPlusIncrTempMA and NHDPlusIncrTempMMmm Tables
Description.—Mean annual and mean monthly temperatures (in degrees Celsius) averaged over the area of each NHDPlus catchment (where "mm" in the NHDPlusIncrTempMMmm file name is substituted by values 01 to 12 to denote the months of January through December). The NHDPlusIncrTempMA table contains the mean annual temperature values (table 24), and the 12 NHDPlusIncrTempMMmm tables contain the mean monthly temperature values (table 25). Note the EROM software computed the mean annual values by totaling the monthly values. For this reason, although the NHDPlusIncrTempMA table exists, it is not populated in most or all, NHDPlus HR datasets. The temperature values for the period from 1971 to 2000 are computed using a raster that combines data from PRISM for the conterminous United States (PRISM Climate Group, 2006) with data arranged in a set of 1-km rasters provided for areas in Canada and Mexico by McKenney and others (2006). For 1990–2019, data from the Daymet version 3 monthly climate summaries (Thornton and others, 2016) were used.
Table 24.
Field names used for the mean annual temperature in the NHDPlusIncrTempMMmm table averaged over the area of each catchment in the National Hydrography Dataset Plus High Resolution (NHDPlus HR).[Refers to the NHDPlusIncrTempMMmm table in the NHDPlus_H_<vpuid>_HU<level>_<PublicationDate>_GDB file geodatabase, where VPUID is the identifier of each vector-processing unit. Mean annual temperature is not needed when estimating streamflow with Enhanced Runoff Method (EROM) and therefore this table is left blank. NHDPlus, National Hydrography Dataset Plus; NA, not available]
Table 25.
Fields used in the NHDPlusIncrTempMMmm tables for the mean monthly temperature averaged over the area of each catchment in the National Hydrography Dataset Plus High Resolution (NHDPlus HR).[Refers to the NHDPlusIncrTempMMmm tables in the NHDPlus_H_<vpuid>_HU<level>_<PublicationDate>_GDB file geodatabase, where “mm” is the identifier for each month (with values of 01 to 12 that denote the months of January to December), and VPUID is the identifier of each vector-processing unit. NA, not available]
If a catchment extends beyond the area from which the temperature data were provided, the value will be the average for the part of the catchment the data cover. The variables MissTMA and MissTMMmm (tables 24 and 25, respectively) give the total areas in the catchments from which data were not available.
NHDPlusNHDPlusIDGridCode Table
Description.—A table to cross-reference between NHDPlusIDs and grid codes assigned during raster processing (table 26).
Table 26.
Fields used in the NHDPlusNHDPlusIDGridCode table to cross-reference the catchment-feature identifiers and grid codes in the National Hydrography Dataset Plus High Resolution (NHDPlus HR).[Refers to the NHDPlusNHDPlusIDGridCode table in the NHDPlus_H_<vpuid>_HU<level>_<PublicationDate>_GDB file geodatabase, where VPUID is the identifier of each vector-processing unit. NHDPlus, National Hydrography Dataset Plus; VPU, vector-processing unit; NA, not available]
Connecting Isolated Flowlines With the Fill and Spill Tool
Flowline sink features mark the terminal ends of isolated stream networks. An automated tool called Fill and Spill (Justin Mayers, USGS, written comm., 2022) is presently (2024) being used to find connections from the disconnected flowlines to the downstream network based on elevation. The tool was combined with additional code that initially prepared the data and subsequently checked the potential connections as well. This process resulted in the identification of flowlines to which the connections could be made and the creation of a table which can be used to create an updated NHDPlusFlowlineVAA table.
Processing by HU4, the python code:
-
1. selects each isolated network-end sink,
-
2. fills the elevation raster at the sink location,
-
3. calculates flow direction of the filled raster,
-
4. traces the filled elevation raster downstream using least-cost path analysis until it hits the surface water network,
-
5. creates the connecting line, and
-
6. records the NHDPlusID of the targeted flowline.
National Data Model and Release
A seamless national aggregation of the NHDPlus HR has been compiled and was released in September 2022, designated as NHDPlus HR National Release 1. (A second national release containing updated data but having the same structure is planned.) NHDPlus HR National Release 1, at https://doi.org/10.5066/P9WFOBQI (USGS, 2022b), uses a simplified NHDPlus HR National Data Model that includes aggregations of selected vector data from the NHDPlus HR Vector Processing Unit (VPU) Data Model, plus two additional tables and two additional national feature classes that are not included in the VPU Data Model.
Like the NHDPlus HR VPU datasets, the NHDPlus HR National Release 1 is composed of separate feature classes and tables that fit together as one cohesive dataset. Figure 5 provides examples of how the data may be joined together to create one cohesive system of stream network data. In addition to being seamless, instead of consisting of separate VPU datasets, the national dataset is also simplified. Like the VPU based data, NHDPlusID is the main interconnecting link (or “Join Item”) between the various datasets.
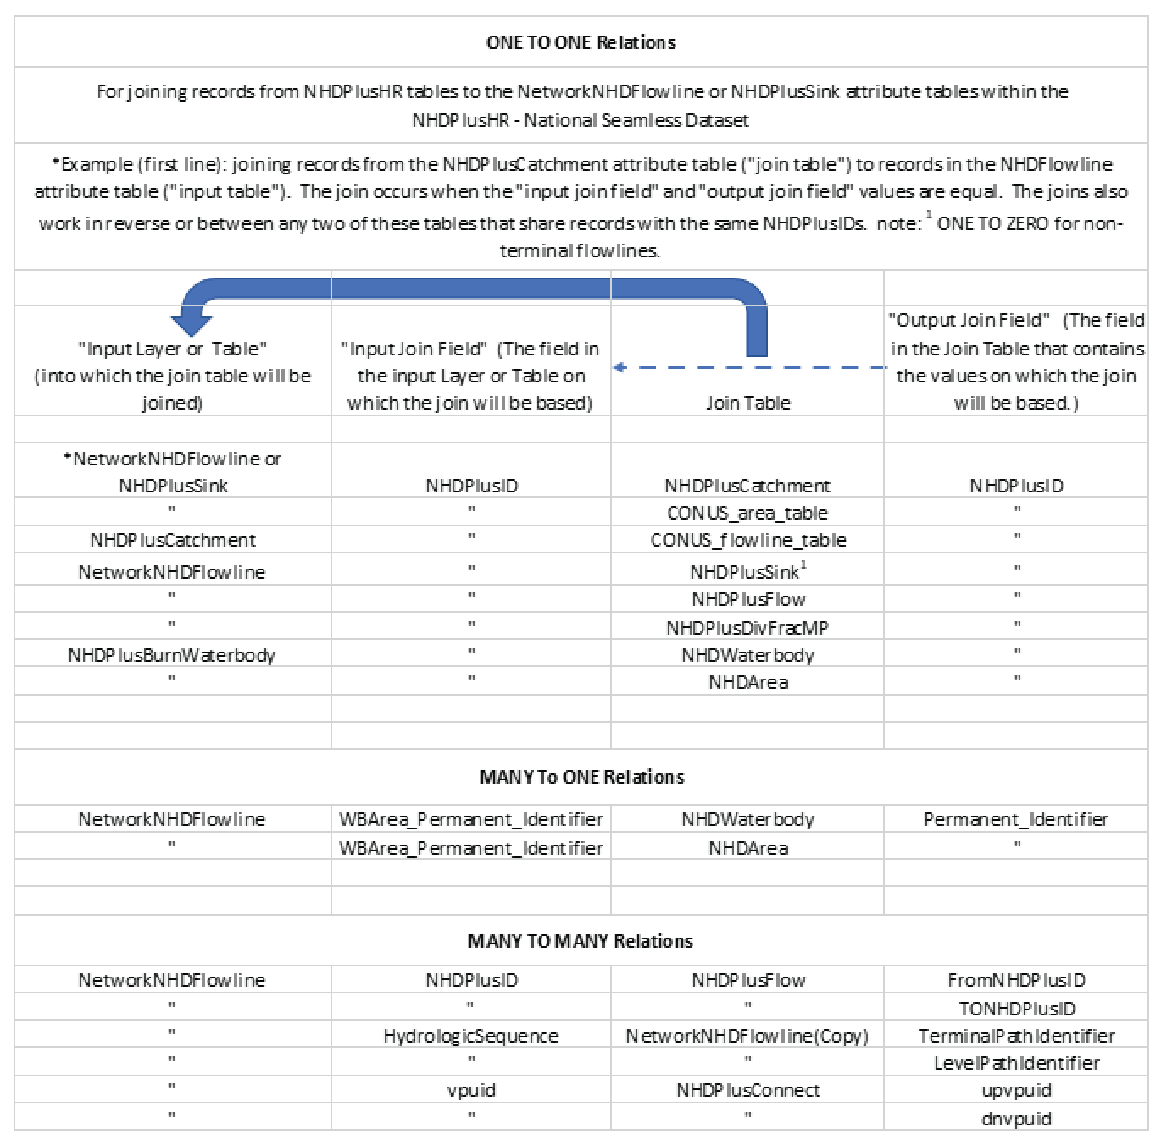
Chart of relations among feature classes and tables in the Seamless NHDPlus HR–NationalDataModel National Hydrography Dataset Plus High Resolution (NHDPlus HR).
The main differences between the Seamless NHDPlus HR National Data Model and NHDPlus HR VPU Data Models are as follows:
-
• The NHDFlowline feature class has been separated into two feature classes: NetworkNHDFlowline and NonNetworkNHDFlowline.
-
• Selected attributes from the NHDPlusFlowlineVAA and NHDPlusEROMMA tables were joined into the National attribute table of NetworkNHDFlowline.
-
• Three attributes from the NHDPlusBurnWaterbody table were joined into the NHDArea and NHDWaterbody tables for the National Data Model.
-
• Only 12 of the more than 20 VPU Data Model feature classes are included, and only 1 of the more than 40 VPU Data Model tables is included in the National Data Model.
-
• Two tables (Connect and GageSmooth) and two feature classes (BoundaryUnit and Gage) are added to the National Data Model.
-
• None of the raster datasets are included in the National Data Model.
Tables or feature classes in the National Data Model are defined the same as the identically named table or feature class within the VPU Data Model, with the exception that three attributes from the VPU Data Model NHDPlusBurnWaterbody feature class (“onoffnet,” “purpcode,” and “burn”) are joined into the NHDArea and NHDWaterbody tables. A poster summarizing the Seamless NHDPlus HR National Data Model is available at https://www.usgs.gov/media/files/national-hydrography-dataset-plus-high-resolution-data-model-v21 (USGS, 2022a).
Several other feature classes are inherited from the WBD (WBDHU12) or the NHD (NHDArea, NHDLine, NHDPoint, and NHDWaterbody). The attribute tables of these feature classes are defined exactly as in the NHD or WBD, except for the addition of the NHDPlusID and VPUID fields, plus the “onoffnet,” “purpcode,” and “burn” fields from the NHDPlus HR VPU Data Model. The NHDPlusBurnWaterbody feature class is joined into NHDArea and NHDWaterbody, as mentioned previously. Please see the NHD (https://www.usgs.gov/national-hydrography/national-hydrography-dataset) and WBD documentation (USGS, 2018b) for descriptions of these feature classes and tables that can be found on the web at https://www.usgs.gov/media/files/watershed-boundary-dataset-wbd-data-model-v231-poster (USGS, 2023d).
The feature classes included in the National Data Model are shown in table 27. Following are descriptions of the feature classes and tables unique to the National Data Model.
Table 27.
Feature classes and tables of national datasets used in the National Hydrography Dataset Plus High Resolution National Data Model (NHDPlus HR).[VPU, vector-processing unit; NHD, National Hydrography Dataset; NHDPlus HR, National Hydrography Dataset Plus High Resolution; EROM, Enhanced Runoff Method; WBD, Watershed Boundary Dataset]
| Feature class or table name | Description |
|---|---|
| NetworkNHDFlowline | Aggregation of NHDFlowline features from all VPUs that connect to other NHDFlowline features, with many attributes joined from the NHDPlusFlowlineVAA and NHDPlusEROMMA tables |
| NHDArea | Aggregation of NHDArea features from all VPUs |
| NHDLine | Aggregation of NHDLine features from all VPUs |
| NHDPlusAdditionRemoval | Table of streamflow transfers, withdrawals, and returns. This has not been populated or included in any NHDPlus HR data produced to date (as of 2024) but is implemented in software and referred to in other parts of this user guide. |
| NHDPlusBoundaryUnit | Polygon feature class of vector- and raster-processing unit boundaries (see table 28) |
| NHDPlusCatchment | Aggregation of NHDPlusCatchment features from all VPUs (see table 4) |
| NHDPlusConnect | Table showing flowline connections between vector-processing units (see NHDPlusConnect table in https://www.usgs.gov/media/files/national-hydrography-dataset-plus-high-resolution-nhdplus-hr-national-data-model-v201 (USGS, 2023b) |
| NHDPlusFlow | Table containing an aggregation of NHDPlusFlow records from all VPUs. (see table 13) Records having ToNHDPID=0 and Direction=709 (within network) can be ignored or removed. |
| NHDPlusGage | Point feature class of streamgage locations and characteristics (see table 29) |
| NHDPlusGageSmooth | Table of streamgage flows used in EROM calculations (see NHDPlusGageSmooth table in https://www.usgs.gov/media/files/national-hydrography-dataset-plus-high-resolution-nhdplus-hr-national-data-model-v201 (USGS, 2023c) |
| NHDPlusSink | Aggregation of NHDPlusSink features from all VPUs (see table 8) |
| NHDPlusWall | Aggregation of NHDPlusWall features from all VPUs (see table 9) |
| NHDPoint | Aggregation of NHDPoint features from all VPUs |
| NHDWaterbody | Aggregation of NHDWaterbody features from all VPUs |
| NonNetworkNHDFlowline | Aggregation of NHDFlowline features from all VPUs that do not connect to other NHDFlowline features |
| WBDHU12 | Aggregation of WBDHU12 features from all VPUs (see WBD documentation [U.S. Geological Survey, 2018b]) |
NHDPlus_H_NationalRelease_1_GDB.gdb\ NetworkNHDFlowline and NonNetworkNHDFlowline Feature Classes
Description.—The NetworkNHDFlowline feature class consists of an aggregation of NHDFlowline features from all VPUs that connect to other NHDFlowline features. NHDFlowlines that are isolated (that is, they do not connect to any other NHDFlowline features) are aggregated into the separate NonNetworkNHDFlowline feature class. Attribute definitions are the same as in the NHDFlowline (see https://www.usgs.gov/media/files/national-hydrography-dataset-plus-high-resolution-nhdplus-hr-national-data-model-v201 [USGS, 2023b] and https://www.usgs.gov/ngp-standards-and-specifications/national-hydrography-dataset-nhd-data-dictionary-0 [USGS, 2023a]), with the addition of the NHDPlusID and VPUID fields. In addition, all the attributes except OBJECTID from the NHDPlusFlowlineVAA tables (table 16) plus all the attributes except OBJECTID from the NHDPlusEROMMA tables (table 17) from all VPUs have been joined into the NetworkNHDFlowline feature class attribute table.
In addition to the NHDPlusFlowlineVAA attributes being joined into the NetworkNHDFlowline feature class attribute table, several of the VAA attribute values have been updated from the values included in the initial VPU-based data releases. When initially developed, the NHDPlus HR data were created starting with headwater VPUs, then downstream VPUs were processed to ensure that all upstream VPUs had already been processed. As any VPU was processed, the data for downstream VPUs did not yet exist, so temporary values were assigned to the following VAAs, as if the VPU were the end of the hydrographic network (field aliases given in parentheses):
-
• StreamLeve (StreamLevel)
-
• LevelPathI (LevelPathIdentifier)
-
• TerminalPa (TerminalPathIdentifier)
-
• PathLength (PathLength)
-
• DnLevelPat (DownstreamMainPathLevelPathID)
-
• DnLevel (DownstreamMainPathStreamLevel)
-
• DnHydroSeq (DownstreamMainPathHydroSeq)
-
• DnMinorHyd (DownstreamMinorHydroSequence)
-
• DnDrainCou (DownstreamDrainageCount)
Batches of VPUs (usually corresponding to HU2 Regions) often were released together with updated values for these attributes, but the temporary values still exist in many of the VPU-based datasets as distributed. Nationally consistent updated values for these attributes are provided in the National Release 1 (USGS, 2022b) and in the NHDPlus_HR map service at https://hydro.nationalmap.gov/arcgis/rest/services/NHDPlus_HR/MapServer. Values for the first four attributes listed above are updated for all connected flowlines upstream of a VPU outlet, while values for the remaining five attributes are updated only for flowlines that are VPU outlets. Therefore, for applications for which any of the above attributes are important, the NHDPlus HR National Release 1 or NHDPlus_HR map service data are recommended.
NHDPlus_H_NationalRelease_1_GDB.gdb\NHDPlusBoundaryUnit Feature Class
Description.—Polygon boundary for each geographic unit used to build NHDPlus HR (table 28). The unit types are VPU and RPU, and a polygon is included for each unit type. Users may want to use a definition query to view only one unit type or the other. For the contiguous United States, the boundaries were constructed from WBD HU4 polygons available during the production phase of the NHDPlus HR National Release 1 (USGS, 2022b).
Table 28.
Description of the polygon boundary for each geographic unit used in the National Hydrography Dataset Plus High Resolution (NHDPlus HR).[Refers to the \NHDPlus_H_NationalRelease_1_GDB.gdb\BoundaryUnit feature class. Char, number of characters; VPU, vector-processing unit; RPU, raster-processing unit; Double, double precision real number; km2, square kilometer]
NHDPlus_H_NationalRelease_1_GDB.gdb\NHDPlusGage Feature Class
Description.—Locations of streamflow-gaging stations on the NHDFlowline features. This table (table 29) is used for streamflow estimation.
Table 29.
Locations of streamflow-gaging stations on the NHDFlowline features NHDPlus_H_NationalRelease_1_GDB\NHDPlusGage (feature class).[NHD, National Hydrography Database; Char, number of characters; Double, double precision real number; FIPS code, Federal Information Processing Code; mi2, square mile]
NHDPlus_H_NationalRelease_1_GDB.gdb\NHDPlusConnect Table
Although part of the seamless National NHDPlus HR dataset, this table identifies flowline connections between VPUs. The attributes upvpuid and dnvpuid identify the upstream and downstream VPUs respectively for the connection. Similarly, the attributes upnhdid and dnnhdpid identify the NHDPlusID values of the upstream and downstream flowlines respectively (see https://www.usgs.gov/media/files/national-hydrography-dataset-plus-high-resolution-nhdplus-hr-national-data-model-v201; USGS, 2023b). The attributes uppermid and dnpermid identify the Permanent_Identifier values of the upstream and downstream flowlines respectively (USGS, 2023b).
NHDPlus_H_NationalRelease_1_GDB.gdb\NHDPlusGageSmooth Table
This table provides the mean flows for gages used in EROM streamflow estimates and includes the average (ave) streamflow per year or per month. Note: the field “month” in GageSmooth table equals “01” if the monthly average listed is for January, “02” for February, and so forth. “MA” is for the mean annual streamflow for the year listed. Streamflows listed are in cubic feet per second (cfs or ft3/s). The attribute field “completere” (alias CompleteRecord) contains a 1 if the gage record was complete for the time period, or a 0 if the gage record was not complete.
NHDPlus Data Domains
The data in the NHDPlus HR are described by purpose codes (table 30). Other domains are also used (table 31).
Table 30.
Purpose code domains and descriptions used in the National Hydrography Dataset Plus High Resolution (NHDPlus HR).[The field type for the purpose-code domain is string. NHDPlus, National Hydrography Dataset Plus; WBD, Watershed Boundary Dataset; HU12, 12-digit hydrologic unit; NHD, National Hydrography Dataset; VPU, vector-processing unit; X, used in feature class; —, not used in feature class]
Table 31.
Descriptions of other domains used in the National Hydrography Dataset Plus High Resolution (NHDPlus HR).Concepts for Understanding and Using NHDPlus HR
Concepts discussed in this section include the following:
-
• Unique Feature Identifiers in NHDPlusID
-
• Divergences in NHDPlus HR network with complex hydrography
-
• Total upstream and divergence-routed accumulation to aggregate upstream incremental values
-
• Stream slope in the NHDPlusFlowlineVAA table
-
• Finding the upstream inflows to an NHDPlus VPU: navigation of the stream network, if necessary, into upstream or downstream NHDPlus HR VPU workspaces
-
• Finding all the flowlines immediately tributary to a reach of river
-
• Working with isolated networks (ones that appear to terminate into the ground or have no outflow)
-
• Why NHDPlus catchment boundaries may differ from WBD HU12 boundaries
-
• Why some NHDFlowline features do not have matching catchments
-
• Using the NHDPlus value-added attributes for tasks other than navigation:
-
• Why flows estimated by the EROM may differ from gage-reported streamflow
NHDPlus HR Unique Feature Identifiers
The unique identifier for all NHDPlus HR spatial objects is the NHDPlusID. It is a 14-digit number stored in a field whose field type is defined as “double.”
Caution: Do not export the NHDPlus HR tables to .dbf format or the feature classes to shapefiles since the conversion process often leads to changes in the storage of significant digits of the NHDPlusID field. Low-order digits are lost along with the ability to link NHDPlus HR components to each other.
Caution: In addition, NHDPlus HR VPU Data released in 2022 for hydrologic regions 01, 02, 06, 14, 15, and 16 may contain NHDPlusID field values that differ from previously released NHDPlus HR VPU or National Release 1 values for the same features. Likewise, the same NHDPlusID value may represent different features between these datasets. NHDPlusID values within a single VPU or national release are consistent; however, care must be taken when working with data from different VPU dataset releases. These concerns apply only within the hydrologic regions listed above.
NHDPlus HR and Divergences
The NHDPlus HR hydrography network includes convergent, divergent, and complex flow paths (fig. 6). A convergent junction is the simplest type of junction for downstream routing and accumulation of attributes, such as drainage area. Divergent and other types of complex junctions complicate computing cumulative values.
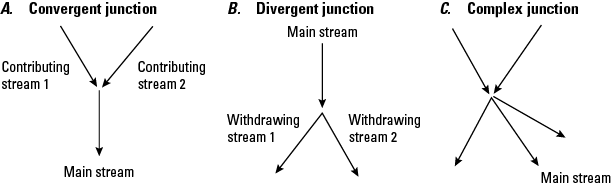
Schematic diagram showing complex hydrography with A, convergent, B, divergent, and C, complex flow paths in the National Hydrography Dataset Plus High Resolution (NHDPlus HR).
The Divergence field in the NHDPlus_H_<vpuid>_HU<level>_<PublicationDate>.gdb\NHDPlusFlowlineVAA table defines “main” and “minor” paths at divergences. One path is designated as the main path (see “Step F—Compute VAAs (Part 2)” and is given a Divergence attribute value of “1.” All other paths in the divergence are designated as minor paths and are given a Divergence attribute value of “2” (fig. 7).
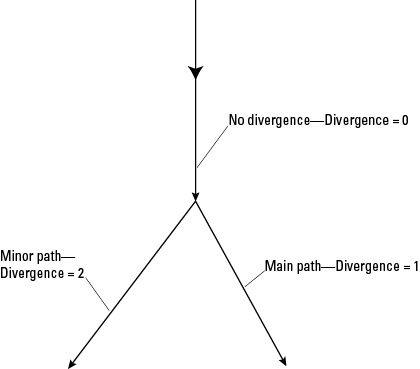
Schematic diagram showing main and minor paths of divergent junctions of hydrography in the National Hydrography Dataset Plus High Resolution (NHDPlus HR). One path is designated as the main path and given a Divergence attribute value of “1.” All other paths in the divergence are designated as minor paths and are given a Divergence attribute value of “2”. Divergent and other types of complex junctions complicate computing cumulative values. Flowlines not involving a diverging flow are given a divergent value of 0.
In many cases, the divergences are “local” (fig. 8) because the divergence returns to the main network at the next downstream confluence. In figure 8, the red flowline represents the local divergence. The blue line represents the main path or flowlines not affected by these divergences because the divergent streams rejoin the network.
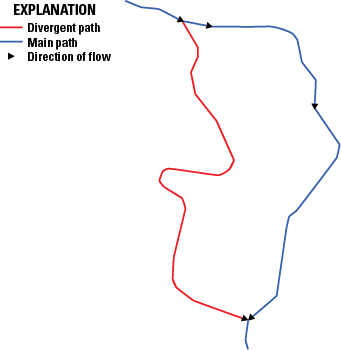
Schematic diagram showing a local divergence of streamflow within the National Hydrography Dataset Plus High Resolution (NHDPlus HR). In many cases, the divergences are “local” because the divergence returns to the main network at the next downstream confluence. The red flowline represents the local divergence. The blue line represents the main path or flowlines not affected by these divergences because the divergent streams rejoin the network.
NHDPlus HR can represent many complex networks—for example, nested divergences, braided streams, coastal drainage patterns, complex irrigation-channel systems, and instances where the divergent flowlines never rejoin the network downstream. Some complex divergences do not immediately rejoin the main network (fig. 9), may flow into additional divergences, and (or) return to the main network many miles downstream and can thus affect multiple flowlines. When attribute values are routed and accumulated, cumulative values will be affected by these divergences.
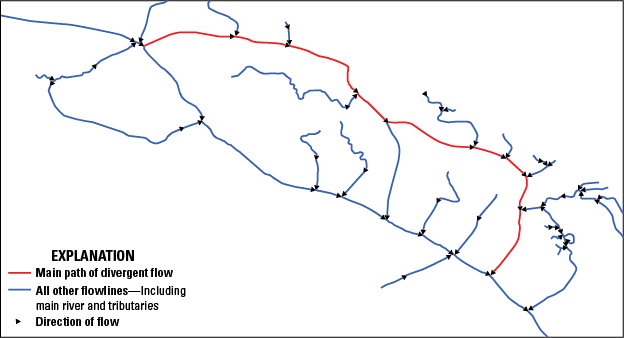
Map showing a stream network with multiple divergent junctions in the National Hydrography Dataset Plus High Resolution (NHDPlus HR). Some complex divergences that do not immediately rejoin the main network may flow into additional divergences, and (or) return to the main network many miles downstream and can thus affect multiple flowlines. When attribute values are routed and accumulated, cumulative values will be affected by these divergences.
Total Upstream Accumulation and Divergence-Routed Accumulation
The objective of accumulation is to aggregate the incremental values of features so that, at any NHDFlowline feature or catchment in the network, the cumulative attribute value for the area upstream of the feature or catchment can be computed. NHDPlus HR has implemented two methods for accumulating attributes along the NHDPlus HR network. The first method, Total Upstream Accumulation, accumulates the attribute for each NHDFlowline feature along the network upstream of the most downstream (bottom) node of the NHDFlowline feature. The second approach, Divergence-Routed Accumulation, apportions the attribute value at each divergence. A part of the accumulation is routed down each path of the divergence so that the sum of the divergence parts is 100 percent of the accumulated value at that point in the network. For each NHDFlowline feature along the main path of the network, the divergence-routed accumulation values for an attribute do not include amounts routed down minor divergent paths that have not returned to the main network.
For the vast majority of divergences, it is not known how to appropriately apportion to the paths in the divergence. Where there is no specific information, NHDPlus HR uses defaults that route to 100 percent of the attribute down main paths (NHDPlusFlowlineVAA.Divergence=1) and 0 percent down minor paths (NHDPlusFlowlineVAA.Divergence=2). The NHDPlus HR table NHDPlusDivFracMP documents known proportions for main and minor paths and thus provides information that is used in the Divergence-Routed Accumulation method. When the main path carries 100 percent and the minor path 0 percent of the flow, none of the accumulated value is passed down the minor path (fig. 10) until the minor path rejoins the main path.
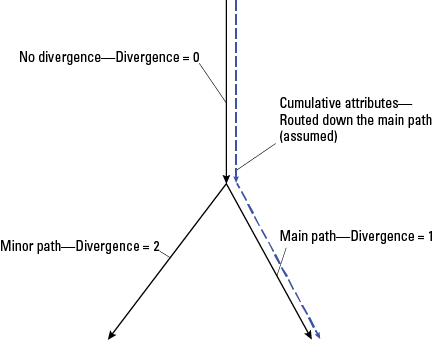
Schematic diagram showing the Divergence-Routed Accumulation method of aggregating the incremental values of features in the National Hydrography Dataset Plus High Resolution (NHDPlus HR). In this method, attributes are routed down the main path (dotted blue line) for aggregation. This method does not include minor divergent flowlines, and the flowlines downstream of the minor divergences do not include the cumulative values upstream of the divergence until the divergence rejoins the main path. The main path is given a Divergence attribute value of “1.” All other paths in the divergence are designated as minor paths and are given a Divergence attribute value of “2.” Flowlines not involving a diverging flow are given a divergent value of “0.”
Attribute accumulation can be done for specific sites or for the entire network. Site-specific accumulation can be easily completed with upstream navigation followed by the aggregation of any attributes assigned to NHDFlowline features (or their associated catchments) by using the navigation results. When an entire-network accumulation method is implemented, the desired attributes are accumulated for each NHDFlowline feature and saved in an attribute table for future use. Entire-network accumulations require a program or script to complete the task. Different mathematical operations are chosen based on the attribute being aggregated. For example, the attribute named “drainage area” is additive, whereas categorical land-use attributes are computed by using an area-weighted average.
For the Total Upstream Accumulation method, the accumulation for each NHDFlowline feature is the aggregation of all the incremental upstream values that are being accumulated. An advantage of this method is that it is not sensitive to errors in the divergence classifications because the accumulated values represent the total accumulation upstream of each NHDFlowline.
The Divergence-Routed Accumulation method starts at the top of the network and moves downstream, aggregating the incremental values for features or catchments. As each feature or catchment is processed, the cumulative values are saved. The advantage of this method is that values can be computed quickly; however, the Divergence-Routed Accumulation method is sensitive to errors in divergence classifications. The process of selection of the main path is discussed in “Step F—Compute VAAs (Part 2).” When the wrong path is designated as the major path, accumulated values downstream of divergences will not be routed correctly. NHDFlowline features downstream of divergences that have not returned to the major network path will not receive the full accumulated value from features upstream of the divergence. Divergence-routed accumulation may be appropriate for some attributes but not for others, and the user should be aware of these distinctions.
Understanding NHDPlus Slope
NHDPlus slope is unitless and is computed as shown in equation 1. Slope is found in the NHDPlusFlowlineVAA table. Minimum (MinElevSmo) and maximum (MaxElevSmo) smoothed elevations for flowlines are expressed in centimeters. The elevations are smoothed in step Q from the raw minimum elevations created in step O for each catchment and the maximum raw elevation, also created in step O, at the headwaters. The length of NHDPlusBurnLineEvent features (BurnLenKM) is in kilometers. Therefore, when slope is calculated with these fields, the result is slope in centimeters per kilometer:
wheremax elevsmo
is the maximum smoothed elevations for flowlines (cm),
min elevsmo
is the minimum smoothed elevations for flowlines (cm), and
BurnLenKM
is the length of NHDPlusBurnLineEvent features (km).
To calculate the true (unitless) slope provided in NHDPlusFlowlineVAA.Slope, the units were divided by 100,000 centimeters per kilometer (cm/km). NHDPlus slopes are constrained to be greater than or equal to (≥) 0.00001. Note: the smoothing technique is described in the section “Step Q—Smooth Raw Elevations” of this report.
Finding the Upstream Inflows to an NHDPlus HR VPU
All NHDPlus HR VPU workspaces are hydrologically connected drainage areas with potential inflows from other VPUs and outflows to other VPUs. Before navigating the stream network within a VPU, it may be useful to determine whether the navigation should be continued into upstream or downstream NHDPlus HR VPU workspaces.
The existence of upstream and downstream VPUs is noted in the NHDPlusFlowlineVAA VPUIn and VPUOut attributes. When these attributes are set to “1” (“Yes”), there are one or more upstream or downstream VPUs, respectively. Alternatively, the NHDPlusIDs of the flowlines that receive water from an upstream VPU or discharge water to a downstream VPU may be found by searching the NHDPlus_H_NationalRelease_1_GDB.gdb\NHDPlusConnect table for DnVPUID or UpVPUID, respectively, to be equal to the VPU of interest.
Finding All Flowlines That Are Immediately Tributary to a Stretch of River
Select in ArcGIS Pro, by whatever means you choose, a group of flowlines (from the feature class NHDFlowline in the NHDPlus HR VPU Data Model) that comprise a stretch of river where you wish to locate all flowlines that flow into that stretch of river.
-
1. Join the NHDPlusFlowlineVAA table to NHDFlowline by using NHDPlusID as the join field. Export the selected set of flowlines into its own feature class called, for example, “ReceivingFlowlines.” The new feature class will have the VAAs included in its attribute table. They should all have the same Level Path Identifier, LevelPathI. Record that number for later use.
-
2. Remove the join from NHDFlowline and join instead the NHDPlusFlow table using NHDPlusID as the join field for NHDFlowline, and FromNHDPlusID as the join field for NHDPlusFlow.
-
3. Next join the ReceivingFlowlines attribute table to the already combined NHDFlowline-NHDPlusFlow table, by using NHDPlusFlow.ToNHDPID as the join field for the NHDFlowline (which already contains the first join with NHDPlusFlow) and NHDPlusID as the join field for the ReceivingFlowlines.
-
4. Next select from NHDFlowline those flowlines where ReceivingFlowlines.NHDPlusID>0.
-
5. And lastly, remove from the selection those flowlines where ReceivingFlowlines.LevelPathI equals the Level Path Identifier of the originally selected flowlines recorded earlier.
The remaining selected flowlines are those flowlines that are immediately tributary to the originally identified stretch of river.
Working With Main Networks and Isolated Networks
Most of the features in the NHDPlus surface-water network ultimately drain to the Atlantic Ocean, Pacific Ocean, Gulf of America, land masses in Canada and Mexico, or to one of the Great Lakes. These features compose the “main” flowline network in NHDPlus HR. In addition, NHDPlus HR includes many isolated single-flowline features as well as isolated networks throughout the United States. An isolated single flowline or network of flowlines appears to terminate into the ground or has no outflow. Many isolated networks either seep into the ground or end because of excessive evaporation. These are often called “noncontributing” networks (fig. 11), and although they can develop in any part of the country, they develop primarily in the Great Basin (in Nevada and surrounding States; hydrologic region 16), the Southwest, and the southeastern parts of the Pacific Northwest (hydrologic region 17). Some isolated networks are mapping errors (fig. 12); these networks should be connected to the main NHDPlus network or removed (see the “Connecting Isolated Flowlines With the Fill and Spill Tool” section of this report as one source of potential connections). “Noncontributing” here refers to networks that include no surface-water connections. The absence of surface-water connections does not rule out the presence of groundwater connections that can and do exist in many places but are not part of NHDPlus HR.
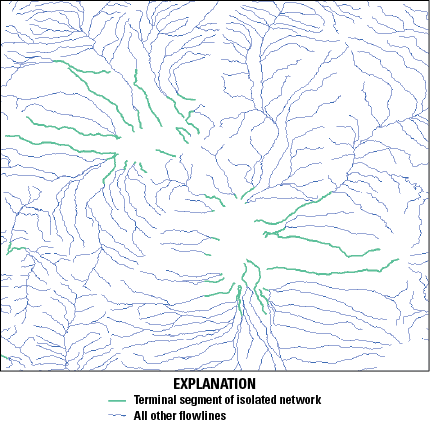
Map showing noncontributing isolated networks in the National Hydrography Dataset Plus High Resolution (NHDPlus HR). An isolated single flowline or network of flowlines appears to terminate into the ground or has no outflow. Many isolated networks either seep into the ground or end because of excessive evaporation. These are often called “noncontributing” networks. Green lines are terminal segments of isolated networks.
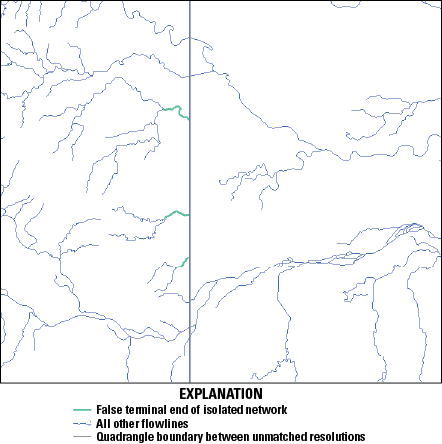
Map showing three isolated networks in the National Hydrography Dataset Plus High Resolution (NHDPlus HR) that include mapping errors indicated by the truncated green lines indicating terminal network segments in the center of the figure. The north-south line in the middle of the map area represents the boundary between two U.S. Geological Survey 1:24,000-scale topographic quadrangle maps.
Isolated networks may exist in any NHDPlus HR drainage area. To find the terminal flowlines (also known as network ends) of isolated networks, join the NHDPlusFlowlineVAA attribute table to the NHDFlowline feature class by using the NHDPlusID field in each. Then select all flowlines with NHDPlusFlowlineVAA.TerminalFl=1. The flowlines selected are considered by the NHDPlus to be terminal flowlines. Flowlines selected inside the VPU are the terminal flowlines of isolated networks. Note that because the VPUs were processed in batches from upstream to downstream, the outlet flowline(s) of some VPUs in large river systems are identified as network ends within a VPU dataset because at the time of processing the downstream VPU(s) had not yet been processed. The VAAs for these flowlines were later updated, but the VPU datasets were not re-released. See the “National Data Model and Release” section of this report for details on how this and other VAAs are updated and available in National Release 1, at https://doi.org/10.5066/P9WFOBQI (USGS, 2022b).
Differences Between Catchment Boundaries and WBD Boundaries for 12-Digit Hydrologic Units
The WBD is a baseline hydrologic drainage-boundary framework that accounts for all land surface areas of the United States; it was developed jointly by State and Federal agencies. A hydrologic unit is defined as a drainage area delineated to nest in a multilevel, hierarchical drainage system. Its boundaries are defined by hydrographic and topographic criteria that delineate an area of land upstream from a specific point on a river, stream, or similar surface-water feature.
A common goal of the NHD and WBD programs is to minimize the differences between NHDPlus catchment boundaries and WBD HU12 boundaries. The objective is to nest NHDPlus HR catchments within WBD 12-digit hydrologic (HU12) areas. This, in turn, would make it possible for catchment attributes to be aggregated up to any hydrologic-code level.
NHDPlus HR catchments are constructed by using a snapshot of the WBD. The HU12 drainage-area divide lines from the WBD are incorporated into the NHDPlus HR hydroenforced DEM as raised cells known as “walls” so that DEM-derived flow-direction cells (the NHDPlus HR fdr.tif raster) conform to the drainage divides in the WBD. Catchments for NHDFlowline features and sink features are created by using the NHDPlus HR fdr.tif raster and should conform to the WBD boundaries within the 10-m-cell resolution except at pour points, where streams cross from one HU12 to the next downstream HU12. In practice, however, catchments and WBD boundaries are not always closely aligned. At present, the catchment boundaries correspond well at ridge lines, but differences are common at the WBD pour points. Common data conditions that could result in differences between the catchment and WBD boundaries are as follows:
-
• The pour point of the catchment is upstream or downstream of the pour point of the WBD. This misalignment between the NHD and the WBD can occur at HU12 stream outlets where the segmentation of the NHD does not match outlets in the WBD. The result is a catchment, for example, extending into a part of the next downstream or upstream HU12 (fig. 13).
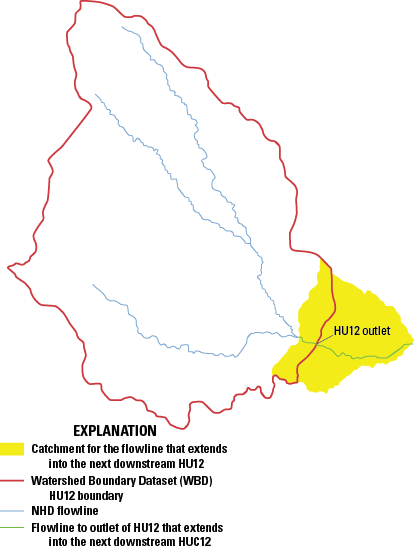
Figure 13. Map showing a catchment in one 12-digit hydrologic unit (HU12) extending into a part of the next downstream HU12 in the National Hydrography Dataset Plus High Resolution (NHDPlus HR). NHD, National Hydrography Dataset.
-
• The 10-m cell resolution can be a limiting factor for spatial correspondence between the NHDPlus HR catchments and WBD divides; this is true where an NHDFlowline feature is within one cell width of a WBD divide. This situation can result in the NHDFlowline feature incorrectly breaching the WBD wall feature in the hydroenforced DEM, where a breach is not appropriate. This processing artifact can cause the catchment for the NHDFlowline feature to extend beyond the WBD divide. An example of this is shown in figure 14, where the 10-m cell-size rasterization causes a series of NHDFlowline features to breach nearby WBD wall features.
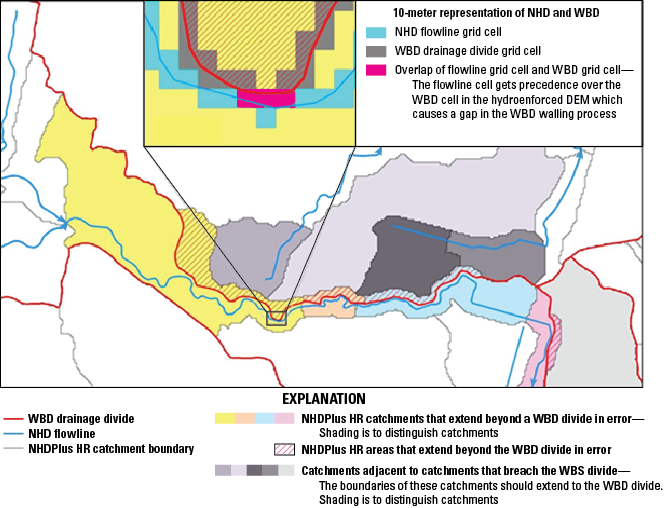
Figure 14. Map showing an example of flowlines from the National Hydrography Dataset (NHD), watersheds from the Watershed Boundary Dataset (WBD), and catchments in the National Hydrography Dataset Plus High Resolution (NHDPlus HR) to illustrate the limitation of a 10-meter-cell representation of the correspondence of NHD and WBD data in the NHDPlus HR. This processing artifact can cause the catchment for the NHDFlowline feature to extend beyond the WBD divide and breach nearby WBD wall features. DEM, digital elevation model.
-
• Where lake shorelines are used to define WBD boundaries (fig. 15), the NHDPlus HR catchments associated with artificial paths within the lakes will not match the WBD boundary. The representation of the artificial-path catchment features in the lake from the NHD includes contributing drainage from the surrounding HU12s.
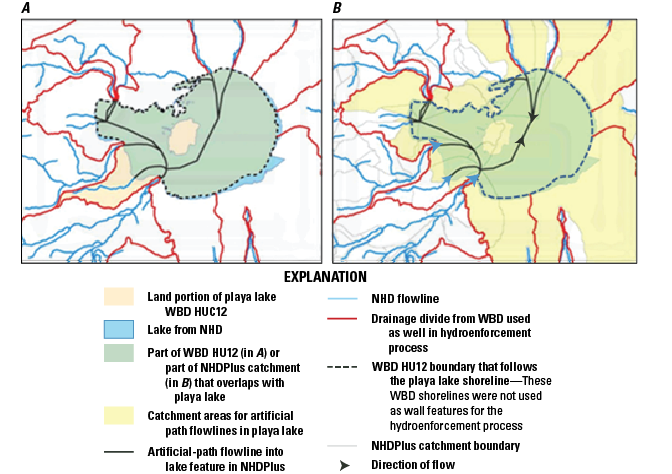
Figure 15. Maps showing an example of a lake shoreline used to define the Watershed Boundary Dataset (WBD) boundary. A, The shoreline WBD boundaries are not used in the National Hydrography Dataset Plus (NHDPlus) catchment delineation process and thus do not match B, the catchment boundaries in the NHDPlus High Resolution (NHDPlus HR) that use the artificial paths within the lakes. HU12, 12-digit hydrologic unit; NHD, National Hydrography Dataset.
-
• In arid areas, some HU12s may be “empty” (may not contain any NHDFlowline features or other water features). If the HU12 was not identified in WBD as a closed basin, the wall between the HU12 and the downstream HU12 was removed during the NHDPlus HR production process. In these cases, the catchments may not agree with the HU12 boundaries, such as the example in figure 16A, which shows two empty HU12s. A part of the boundary of each empty HU12 is removed from the Wall feature, hydrologically connecting the empty HU12 to the next downstream drainage. One empty HU12 flows into the next downstream empty HU12, which in turn drains to the next downstream HU12 that contains an NHDFlowline feature. The resultant catchment for the NHDFlowline feature is the area of the HU12 that includes the feature and the two upstream empty HU12s (fig. 16).
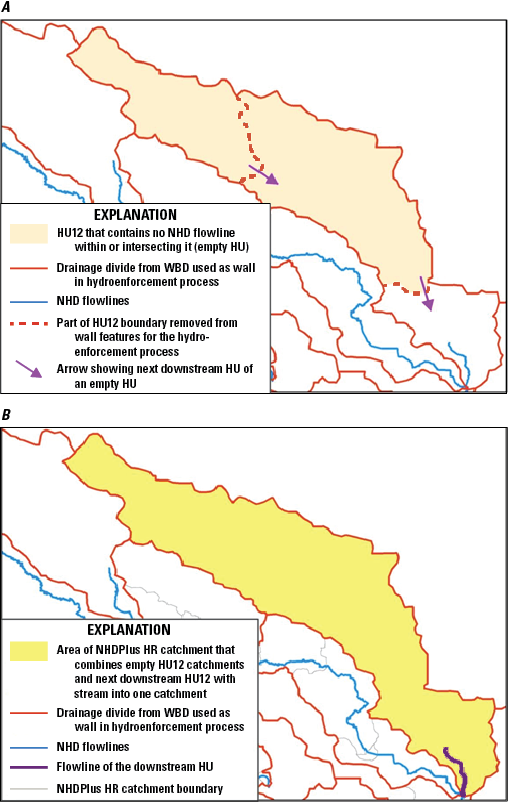
Figure 16. Maps showing A, two adjacent 12-digit hydrologic unit (HU12) drainage areas that do not contain flowline features in the National Hydrography Dataset (NHD) and B, a single catchment created from the three merged areas in the National Hydrography Dataset Plus High Resolution (NHDPlus HR). The resultant catchment for the NHDFlowline feature is the area of the HU12 that includes the feature and the two upstream empty HU12s. HU, hydrologic unit drainage area; WBD, Watershed Boundary Dataset.
-
• Arid areas can present isolated NHDFlowline networks within a HU12 with a sink at the downstream end of each isolated network. Within a HU12, there may exist an area downhill of the sink with no flowline connecting the area to an adjacent HU12 (fig. 17). If the HU12 is not identified as a closed basin in the WBD and has a downstream HU12 identified, then a section of the wall can be removed during NHDPlus HR processing. By removing the wall section, the downhill part of the HU12 drains to the downstream HU12. In these cases, the areas downhill of the sink will be assigned to a catchment in the downstream HU12. Figure 17 shows a catchment for an NHDWaterbody playa feature (the dry lakebed of an intermittent lake); the catchment of a sink labeled with a map identifier “1” includes the entire area for an upslope empty HU12 and a large part of another upstream HU12 that is otherwise partially allocated to catchments for an isolated network.
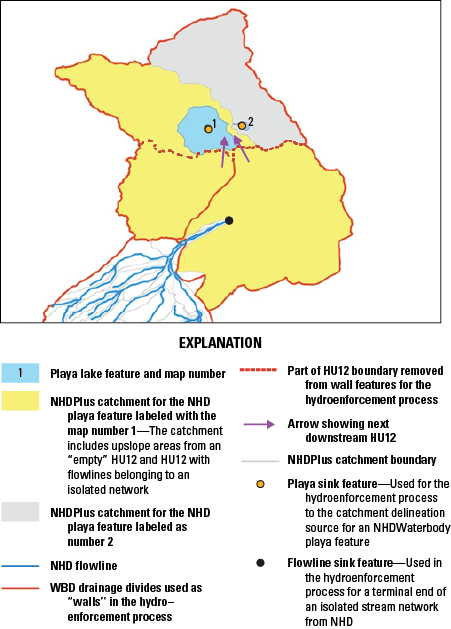
Map showing the catchment for a playa-lake NHDWaterbody feature (map identifier [ID] 1) originally from the National Hydrography Dataset (NHD) displayed in the National Hydrography Dataset Plus (NHDPlus) High Resolution (NHDPlus HR) so that it includes most of the area for an upslope empty 12-digit hydrologic unit (HU12) area (map ID 2). This adjustment was done through hydroenforcement of the NHDPlus HR catchment with the boundaries of the HU12 from the Watershed Boundary Dataset (WBD). The areas downhill of the sink will be assigned to a catchment in the downstream HU12. The catchment of a sink labeled with a map identifier “1” includes the entire area for an upslope empty HU12 and a large part of another upstream HU12 that is otherwise partially allocated to catchments for an isolated network.
All NHDFlowline headwater features are trimmed back by a small distance to reduce possible breaches of ridge lines in the HydroDEM.
In figure 18, a headwater NHDFlowline feature extends into an adjacent WBD HU12 in a manner that appears to contradict how the drainage should be as defined by the WBD. This situation may represent an error either in the NHD or in the WBD. Visual review of this example with high-resolution oblique aerial photography (fig. 18 inset) indicated that the headwater feature does extend into the adjacent HU12 through culvert and pipeline features. Correcting errors like this was previously addressed through the stewardship program sponsored by the USGS (https://www.usgs.gov/ngp-user-engagement-office).
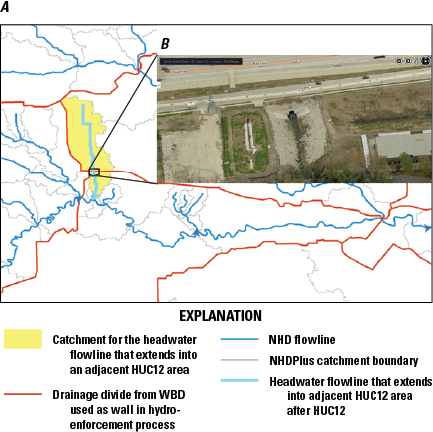
Map and aerial photograph of A, a headwater NHDFlowline feature in the National Hydrography Dataset Plus (NHDPlus) High Resolution (NHDPlus HR) that extends into an adjacent Watershed Boundary Dataset (WBD) 12-digit hydrologic unit (HU12) area. B, An aerial photograph (from the U.S. Geological Survey’s [USGS] The National Map) showing the culverted connection between the two areas that were shown in the WBD within two separate HU12 areas. The headwater NHDFlowline feature extends into an adjacent WBD HU12 in a manner that appears to contradict how the drainage should be, as defined by the WBD. This situation may represent an error either in the National Hydrography Dataset (NHD) or in the WBD. Correcting errors like this was previously addressed through the stewardship program sponsored by the USGS (https://www.usgs.gov/ngp-user-engagement-office).
NHDFlowline Features With and Without Catchments
In general, catchments are generated for networked NHD flowlines (InNetwork=“Yes”). However, in NHDPlus HR, some networked flowlines were intentionally removed from the set of features used for catchment generation. Examples included pipelines, elevated canals, headwater flowlines that conflicted with the WBD, and some other limited data conditions. The “Catchment” field in the NHDPlusBurnLineEvent feature class identifies the flowlines, which were designated as “N” (0) for “not used for catchment generation” or “Y” (1) for “used in catchment generation.”
A common cause of flowlines without catchments is the resolution of the 3DEP DEM data. The fine 10-m resolution of the DEM used to create NHDPlus HR greatly reduces this condition; however, this reduction is largely offset by the greater number of short flowlines in NHDPlus HR relative to the cell size of the DEM. For example, 1.6 percent of the flowlines in NHDPlus HR for the contiguous United States lacked catchments, compared with 2.0 percent for the contiguous United States in NHDPlus (30-m medium resolution), and with 1.1 percent for all of NHDPlus (30-m medium resolution). Catchments were not generated for many very short flowlines, whose lengths were defined 14 m or less (14 m is the diagonal distance across a 10-m raster cell). When flowlines longer than 14 m are within the same raster cells as a very short flowline, the raster cells are typically assigned to the longer flowlines unless another field has been used to give priority to the shorter flowlines, in which case a catchment may be delineated for the very short flowline.
In rare circumstances depending on the spatial configurations of multiple surrounding flowlines, flowlines longer than 14 m may not have been assigned a catchment. For example, flowlines may be parallel to each other within a given raster cell and may continue this way through additional raster cells that encompass the entire length of one of the flowlines. In this case, cells used as seeds to delineate the catchments may be assigned to one flowline within each cell, and it is possible for the other flowline to not be designated a seed for any cell.
Using the NHDPlus Value-Added Attributes for Non-Navigation Tasks
The attributes in the NHDPlusFlowlineVAA table provide several easily used and powerful capabilities. Below are examples of the use of the NHDPlusFlowlineVAA for non-navigation tasks.
Example 1. Using LevelPathIdentifierTo Generalize the Stream Network Based on Stream Length
The main stem of each stream is assigned a unique identifier as a value-added attribute called LevelPathI (alias LevelPathIdentifier). LevelPathI is set equal to the HydroSeq value of the most downstream flowline on that river. LevelPathI can be used in conjunction with the NHDFlowline feature LengthKM (defined in the NHDFlowline table) to build a table of the total lengths of all main stems of all networked streams and rivers. In ArcGIS Pro, follow these steps:
-
1. Join NHDPlusFlowlineVAA.NHDPlusID and NHDFlowline.NHDPlusID.
-
2. Summarize by NHDPlusFlowlineVAA.LevelPathI with sum (NHDFlowline.LengthKM).
The output table from the summary will contain each LevelPathI and the sum of the lengths of all the flowlines in the level path. Figure 19 highlights the main rivers whose lengths are equal to or greater than 100 km in length. A threshold criterion of any length can be used as desired.
Map showing streams with lengths greater than or equal to 100 kilometers for the Potomac River watershed within the mid-Atlantic region of the United States, in the National Hydrography Dataset Plus High Resolution (NHDPlus HR).
Example 2. Selecting an Individual River or Terminal River Basin
TerminalPa (alias TerminalPathIdentifier) is a value-added attribute that contains the same value for each of the NHDFlowline features in an entire drainage area. TerminalPathIdentifier is equal to the HydrologicSequence value of the terminal NHDFlowline feature in the drainage. For example, if the terminal feature of a river has a HydrologicSequence represented by a value A, then the LevelPathIdentifier for the river’s main stem has the value A (fig. 20). Also (not shown here), if this river ends in a network terminus, then the TerminalPathIdentifier for that river and all its tributaries has the value A.
Map showing the Potomac River watershed within the mid-Atlantic region of the United States as represented in the National Hydrography Dataset Plus High Resolution (NHDPlus HR). The main stem of the Potomac River has been set to LevelPathIdentifier=A; the river is highlighted in red. The tributary drainages of the selected river (TerminalPathIdentifier=B) are shown in purple. In this example, the value selected for A is the HydrologicSequence number (HydroSeq field) of the terminal flowline of the Potomac River and B is the HydrologicSequence number (HydroSeq field) of the terminal flowline of the Chesapeake Bay (not shown) in a vector-processing unit (VPU) downstream of the Potomac River.
Example 3. Profile Plots
Plots of an attribute value, such as elevation, along a river where the x-axis is the river distance (in kilometers) can be used for showing how the value changes along the river (fig. 21). The NHDPlus HR value-added attributes contain the basic information to readily develop such profile plots. LevelPathIdentifier can be used to select every flowline on a river, and the PathLength value-added attribute can be used to show the length from the downstream end (bottom) of the NHDFlowline feature to the end of the network. For instance, every flowline in the Missouri River drainage basin has a PathLength value that describes how far away the endpoint of the flowline is from the mouth of the Mississippi River.
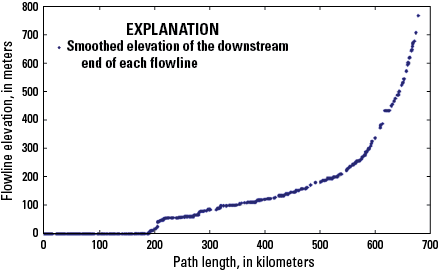
Plot showing the elevation-profile of the main stem of a hypothetical river in the National Hydrography Dataset Plus High Resolution (NHDPlus HR). The NHDPlusFlowlineVAA.PathLength (distance to network terminus) attribute of the main stem of a river is used as the x-axis and the NHDPlusFlowlineVAA.MinElev Smooth (minimum smoothed elevation) attribute as the y-axis. The elevation-change point near PathLength=180 is where the selected river changes from estuarine to free-flowing.
A basic method to create a profile plot is as follows:
-
1. Use the LevelPathIdentifier for the river of interest to select all records in that level path.
-
2. Create a plot of the selected records using the attribute of interest for the y-axis and PathLength for the x-axis.
-
3. Create a plot of the selected records using the attribute of interest for the y-axis (MinElevSmo) and PathLength for the x-axis.
Figure 21 uses the NHDPlusFlowlineVAA.PathLength (distance to network terminus) attribute of the main stem of a river as the x-axis and the NHDPlusFlowlineVAA.MinElev Smooth (minimum smoothed elevation) attribute as the y-axis. The elevation-change point near PathLength 180 is where the selected river changes from free-flowing to estuarine.
Example 4. Stream Order
The NHDPlus HR stream order is based on a modification of the Strahler method (Strahler, 1957). Stream order is used to rank streams according to relative position in the network. Mapping or classifying NHDFlowline features based on stream order can assist with ranking features by relative position within the network, selecting streams of only certain orders, or aggregating data by stream order. The metric “stream order” is in part influenced by the scale of the map from which the NHD flowline network is created. For example, a denser network (from mapping) results in more stream order 1, headwater flowlines.
Figure 22 shows the use of different color shades for each stream order for a selected area (in this example, the Potomac River watershed). The use of shades of blue may show how stream order can help rank streams by relative size. Figure 23 shows the same area but with streams of stream-order 1 removed. This is one method to “thin” the network based on the criterion of hydrologic stream order.
Map showing streams of different stream orders in the Potomac River watershed in the mid-Atlantic region of the United States in the National Hydrography Dataset Plus High Resolution (NHDPlus HR). The rankings of streams are symbolized by the thicknesses and shades of blue, with the streams of higher order represented by darker blues.
Map showing streams of different stream orders in the Potomac River watershed in the mid-Atlantic region of the United States as depicted in the National Hydrography Dataset Plus High Resolution (NHDPlus HR) with streams of stream-order 1 removed. The rankings of streams are symbolized by the thicknesses and shades of blue, with the streams of higher order represented by darker blues.
Example 5. Stream Level
The StreamLevel value-added attribute is often misunderstood or misused by users. Users commonly think of stream level “as the opposite of stream order,” which is incorrect. Stream level is its position within the network. The primary use of stream level is to distinguish the main stem from the tributary streams based on the inflows immediately upstream from the selected stream segment (fig. 24). The main stem is assigned the lowest stream level, and the higher stream-level values are assigned to the tributaries. For example, StreamLevel 1 would apply to the Mississippi River main stem but also to every stream, regardless of length or volumetric flow rate, that terminates at a coastline. In figure 24, the flowlines are labeled with the StreamLevel values. The NHDFlowline features flowing from north to south are StreamLevel 2, and the feature coming in from the west is StreamLevel 3. Therefore, the north-south features are the main stem, and the feature coming in from the west is the tributary.
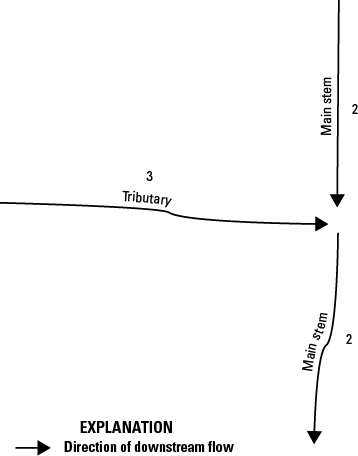
Schematic diagram showing the StreamLevel values in the National Hydrography Dataset Plus High Resolution (NHDPlus HR). The NHDFlowline features flowing from north to south are StreamLevel 2, and the feature coming in from the west is StreamLevel 3. Therefore, in this case, the north-south features are the main stem, and the feature coming in from the west is the tributary. In StreamLevel values, the lowest values refer to the main-stem rivers and the higher values to the tributaries.
Differences Between Flow Estimates from EROM and Gage-Reported Streamflow
EROM is a technique for computing mean streamflows. (Computation of mean annual flow estimates by EROM is included in “Step T—Enhanced Runoff Method (EROM) Streamflow Estimation, QAQC, and Jobson Velocity Estimation” section of this report.) This discussion is intended to address why the EROM gage-adjusted flow estimates (NHDPlusEROMMA.QE) may not match the flow reported at a given gage location.
To adjust the flow that is based on gage flows, EROM screens gages based on the number of years of record, the period of record, and a comparison of the NWIS-reported drainage area with the NHDPlus-calculated drainage area. Only gages that pass the screening are used in the gage-adjustment process of EROM. Consequently, if a gage does not pass the screening criteria, the EROM flow estimate may differ from the gage flow measurement. Additionally, gage flows and drainage areas are adjusted to the ends of flowlines (see “EROM Step T5—Gage-Based Flow Adjustment” section for more details.) This adjustment will cause small differences between EROM values and reported values for both flow and drainage areas. These differences may be most noticeable for gages located high on headwater streams with very small drainage areas.
NHDPlus HR Production Process Description
This section of this report is intended for NHDPlus HR users or developers who require more detailed information on the inner workings of the database to see how NHDPlus HR data are created and gain a greater understanding of NHDPlus HR and its strengths and capabilities. The NHDPlus HR production process (fig. 25) consists of a single application, which creates and manages the workflow of steps necessary to execute the NHDPlus HR production process. Additional setup and help tools are implemented by using an ArcGIS toolbox. Each run of the NHDPlus HR production process produces one VPU of NHDPlus HR data.
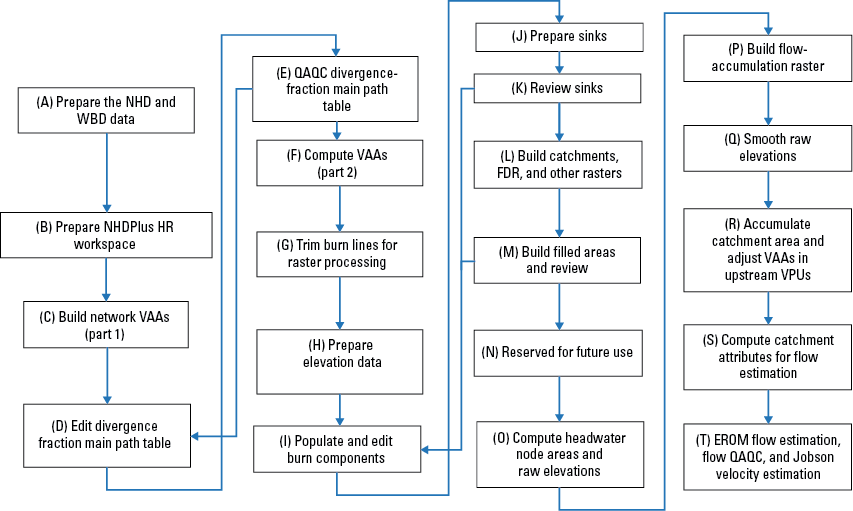
Flow chart showing the workflow for the production process steps outlined in the User’s Guide for the National Hydrography Dataset Plus High Resolution (NHDPlus HR). 3DEP, 3D Elevation Program; EROM, Enhanced Runoff Method; FDR, flow-direction raster; NED, National Elevation Dataset; NHD, National Hydrography Dataset; QAQC, quality assurance and quality control; VAAs, value-added attributes; VPU, vector-processing unit.
Step A—Prepare the NHD and WBD Data
This step builds a workspace that contains the appropriate NHD and WBD data. The data are put into a structure suitable for NHDPlus processing. If this is the first VPU to be processed in the drainage area, the HRNHDPlusGlobalData.gdb is configured for a drainage area. For this step, a script creates a filegeodatabase (.gdb extension) to contain the spatial definition of the drainage area and the divisions of the drainage area that define the VPU. The created file geodatabase also contains the overall hydrologic sequence of VPUs (upstream to downstream) and the specifics of how and where the VPUs connect to each other. During this step, a final QAQC check is done on the NHD data and, if necessary, minor edits are made to the NHD data.
Step B—Prepare the NHDPlus HR Workspace
In this step, the workspace created in step A is modified. The initial geodatabase created from the NHD and WBD data is transformed into the NHDPlus HR geodatabase. NHDPlusIDs are assigned as needed. The upstream and downstream VPU connections are stored in the NHDPlusGlobalData table.
Step C—Build Network Value-Added Attributes (Part 1)
This step partially populates the NHDPlusFlowlineVAA table. The first 10 value-added attributes are calculated. The value-added attributes are populated from the contents of the NHDPlusFlow table and the NHDFlowline feature class created in step A.
The value-added attributes are calculated only for NHD-Flowline features with NHDFlowline.InNetwork=“Yes.” The following attributes for the NHDPlusFlow and associated NHDPlusFlowlineVAA attributes are populated in this step. The NHDplusFlow attribute “Direction” indicates the position of a flowline within the network (table 32). It is populated in this step along with FromNodes and ToNodes.
-
1. A NHDFlowline feature that has a flow-table record with Direction=712 (a headwater flowline) has a FromNode that represents the top of the headwater.
-
2. A NHDFlowline feature that has a flow-table record with Direction=713 (a terminal flowline) has a ToNode that is the terminus of the network.
-
3. Other points between flowlines serve both as a FromNode and a ToNode: The “point” of flow exchange represented by a flow-table record with Direction=709 (a virtual node between two or more NHDFlowline features). The node ID is stored as a ToNode for the upstream flowline and as a FromNode for the downstream flowline.
-
4. Coastal flowlines also receive FromNode and ToNode values even though they do not pass streamflow. Coastal flowlines will have Direction=714 (nonflowing) records in the flow table.
-
5. FromNode/ToNode: The FromNode is the top (upstream end) of the NHDFlowline feature; the ToNode is the bottom (downstream end) of the NHDFlowline feature.
-
6. Each node is given a nationally unique number.
-
7. Nodes do not actually exist as a feature class but rather are pseudo nodes (numbered intersections) to mimic what would have existed if node topology existed. This feature is useful for modeling.
Table 32.
Values used for network nodes in the National Hydrography Dataset Plus High Resolution (NHDPlus HR).-
1. From measure: Set to the m-values at the top (upstream end) of the NHDFlowline feature.
-
2. Tomeasure: Set to the m-values at the bottom (downstream end) of the NHDFlowline feature. (Note: If “from measure” is 0 and “to measure” is 100, then there is just one flowline [NHDPlusID] along that reach [ReachCode]).
-
3. NHDPlusFlowlineVAA.StartFlag: Set to 1 if the NHDFlowline feature has a NHDPlusFlow table record with Direction=712 (headwater flowline), or if the Direction=714 and the FromNHDPlusID=0.
-
4. NHDPlusFlowlineVAA.TerminalFl: Set to 1 if the NHDFlowline feature has a NHDPlusFlow table record with Direction=713, or if the Direction=714 (nonflowing) and the ToNHDPlusID=0.
-
5. NHDPlusFlowlineVAA.VPUIn: Set to 1 if the NHDFlowline feature has a NHDPlusVAA table record with Direction=709 or 714, and the FromNHDPlusID is not in the VPU.
-
6. NHDPlusFlowlineVAA.VPUout: Set to 1 if the NHDFlowline feature has a NHDPlusVAA table record with Direction=709 (within network) or 714 (nonflowing), and the ToNHDPlusID is not in the VPU.
-
7. DnDrainCount: Set to the number of NHDPlusFlow table records where the NHDFlowline feature is the FromNHDPlusID and Direction=709 (within network).
-
8. ReachCode: Set to NHDFlowline.ReachCode of the NHDFlowline feature.
Step D—Edit Divergence-Fraction Main Path Table
During step D, the NHDPlusDivFracMP table is edited (manually, in ArcGIS Pro, when necessary) to specify main paths at points of flow divergence. If gaged-streamflow data are available, the NHDPlusDivFracMP table may also be manually entered to specify the percentage of streamflow that flows down each of the divergent paths.
Step E—QAQC Divergence-Fraction Main Path Table
Step E is an automated QAQC process that confirms that the sum of the divergence fractions for a given divergence (the set of NHDPlusDivFracMP records with the same NodeNumber) is 1.0.
Step F—Compute VAAs (Part 2)
Step F completes the VAA computation task started in step C. Each VAA is computed and compared with other VAAs to confirm that the VAAs are internally consistent. For step F to be considered successfully completed, all VAAs must pass their respective comparison checks. For the remainder of step F, only NHDFlowline features with InNetwork=“Yes” are assigned VAA values. The following VAA are populated:
-
1. NHDPlusFlowlineVAA.Divergence: Divergence is a flag that distinguishes between the main and minor paths at a network-flow split. At a network split, one NHDFlowline feature is designated as the major path (Divergence=1), and all other paths in the split are designated as minor paths (Divergence=2). All features that are not included in a flow split have Divergence=0. Divergence is always consistent with StreamLevel. This consistency ensures that upstream and downstream movements along the main path give the same navigation results. The main path at a flow split is selected from the outflowing NHDFlowline features by using these attributes to select the main path in this order of precedence:
-
a. an NHDFlowline feature that is part of a series of consecutive flowlines that share the same name and ultimately flows to a coast and has an FType (feature type) of StreamRiver, Artificial Path, or Connector; otherwise,
-
b. an NHDFlowline feature that is part of a series of consecutive flowlines and that does not ultimately flow to a coast and has an FType of StreamRiver, Artificial Path, or Connector; otherwise,
-
c. an NHDFlowline feature in the DivFracMP table that has a positive Divfrac value that is the maximum such value at the divergent node; otherwise,
-
d. any named stream, river, artificial path, or connector that ultimately flows to a coast; otherwise,
-
e. any unnamed stream, river, artificial path, or connector that does not ultimately flow to a coast; otherwise,
-
f. any named canal, ditch, or pipeline that ultimately flows to a coast; otherwise,
-
g. any NHDflowline feature that ultimately flows to a coast; otherwise,
-
h. any named stream or river, artificial path, or connector that does not ultimately flow to a coast; otherwise,
-
i. any unnamed stream or river, artificial path, or connector that does not ultimately flow to a coast; otherwise,
-
j. any named canal, ditch, or pipeline that does not ultimately flow to a coast; otherwise,
-
k. any flowline that does not ultimately flow to a coast.
If there is more than one NHDFlowline feature that matches the criterion or the rule, the one with the lowest NHDPlusID value is selected.
-
-
2. NHDPlusFlowlineVAA.ArbolateSu (alias UpstreamCumulativeStreamKm): The computation of ArbolateSu starts at the headwaters of the NHDFlowline network. The NHDFlowline.LengthKM is added along the network, so that each feature has an ArbolateSu of its length plus the length of every upstream feature.
-
3. NHDPlusFlowlineVAA.StreamLeve (alias StreamLevel): StreamLevel is a numeric code that traces the main paths of water flow upstream through the drainage network. The determination of StreamLevel starts at the terminus of a drainage network. If the terminus stops at a coastline NHDFlowline feature (at the Atlantic Ocean, the Pacific Ocean, or the Gulf of America), a stream level of 1 is assigned to the terminus and all the NHDFlowline features in the main path upstream to the headwater of the stream. If the terminus drains into the ground or stops at the Canadian or Mexican border, a stream level of 4 is assigned to the terminus and all the NHDFlowline features in the main path upstream to the headwater of the stream. After the initial stream level of 1 or 4 is assigned to the terminus and its upstream path, all tributaries to that path are assigned a stream level incremented by 1. Then the tributaries to those stream paths are assigned a stream level incremented by 1. This continues until the entire stream network has been assigned stream levels. The highest level assigned in NHDPlus HR is stream level 47. If possible, StreamLevel follows a named path. In other words, at any confluence, if there is an NHDFlowline feature immediately upstream with the same GNIS name, that feature is selected as the main path. If there is no matching name immediately upstream, the NHDFlowline feature with the maximum ArbolateSum value is selected. To ensure agreement with Divergence, StreamLevel assignment does not follow a minor path at or downstream of an NHDFlowline feature with Divergence equal to 2.
-
4. NHDPlusFlowlineVAA.HydroSeq (alias HydrologicSequence): HydroSeq is a nationally unique sequence number that places the flowline in hydrologic sequence. HydroSeq is calculated by first assigning temporary sequential numbers from the headwaters of the NHDFlowline network to the downstream end of the network. To begin, each headwater is assigned a value. Next, all flowlines receiving flow from the headwaters are assigned values. This process continues downstream until all network features have values. The features are sorted by ascending values from the lowest values for upstream locations to the highest values for downstream locations, and the final HydroSeq values are reassigned in the reversed order (from downstream to upstream) sequence. The final HydroSeq values are smallest at the downstream end of the network and largest at the upstream end of the network (fig. 26).
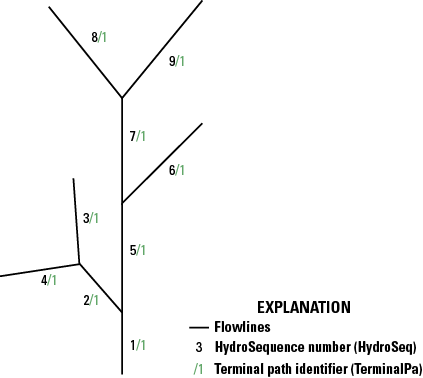
Figure 26. Schematic diagram showing the order of assigning HydroSeq (alias HydroSequence) values in the National Hydrography Dataset Plus High Resolution (NHDPlus HR). HydroSeq is a nationally unique sequence number that places the flowlines in hydrologic sequence. At any flowline, all upstream flowlines have higher hydrologic-sequence numbers, and all downstream flowlines have lower hydrologic-sequence numbers.
The primary characteristic of the HydroSeq value is that if the features are processed by descending HydroSeq values (upstream to downstream) then when one feature is processed, all the features upstream of that feature have already been processed. Following this sequence is important for modeling purposes.
-
5. NHDPlusFlowlineVAA.DnLevel: DnLevel is the value of StreamLevel of the main path NHDFlowline feature immediately downstream of an NHDFlowline feature. If DnLevel≠StreamLevel, the stream is about to discharge into another stream pathway. Some VPU data may not have this field populated because downstream VPUs may not yet have been processed. See the “National Data Model and Release” section of this report for more information.
-
6. NHDPlusFlowlineVAA.LevelPathI: LevelPathI is set to the HydroSeq value of the most downstream feature on the river (fig. 27). For example, all the features along the Mississippi River have the same value for LevelPathI. Some VPU data may have this field populated with temporary values because downstream VPUs may not yet have been processed. See the “National Data Model and Release” section of this report for more information.
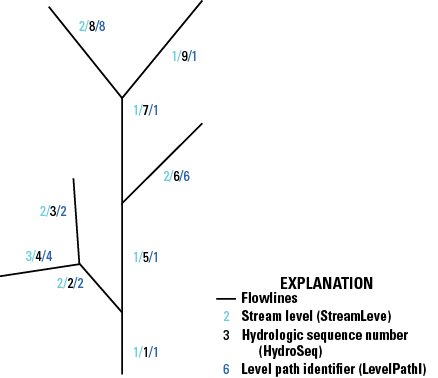
Figure 27. Schematic diagram showing the ordering of level-path identifiers (LevelPathI) and their relations to StreamLev (StreamLevel) and hydrologic-sequence numbers (HydroSeq) in the National Hydrography Dataset Plus High Resolution (NHDPlus HR). LevelPathI is set to the HydroSeq value of the most downstream feature on each river or tributary. Note: The TerminalPa (alias TerminalPathIdentifier) – (not shown) is a value-added attribute that contains the same value for each of the NHDFlowline features in an entire drainage area.
-
7. PathLength: PathLength is the sum of the NHDFlowline.LengthKM downstream values for each flowline along the main path to the terminus of the network. For example, the PathLength of the mouth of the Missouri River will be the distance to the mouth of the Mississippi River. Some VPU data may have this field populated with temporary values because downstream VPUs may not yet have been processed. See the “National Data Model and Release” section of this report for more information.
-
8. RTNDivergence: RTNDivergence is the returning divergence flag and is set to 1 when one or more of the paths from a split in an upstream flow return to the net- work at the upstream end of the NHDFlowline feature.
-
9. TerminalPa: TerminalPa is set to the HydroSeq value of the most downstream feature in the drainage system; in other words, the HydroSeq of the network terminus will become the TerminalPa of all the features that flow to that terminus (fig. 28). Note: A drainage system can contain multiple VPUs. For example, all the features that flow to the mouth of the Delaware River will have the same value for TerminalPa. Some VPU data may have this field populated with temporary values because downstream VPUs may not yet have been processed. See the “National Data Model and Release” section of this report for more information.
-
10. UpLevelPathID: UpLevelPathID is the LevelPathI of the main path NHDFlowline feature immediately upstream of an NHDFlowline feature.
-
11. UpHydroSeq: UpHydroSeq is the HydroSeq value of the main path NHDFlowline feature immediately upstream of an NHDFlowline feature.
-
12. DnMinorHydroSeq: When there is a flow split at the downstream end of a feature, DnMinorHydroSeq is the HydroSeq value of a minor path in that divergence. If there is more than one minor path in the divergence, DnMinorHydroSeq is set to the HydroSeq value of the path with the lowest NHDPlusID value.
-
13. PathLength: PathLength is the sum of the NHDFlowline.LengthKM downstream values for each flowline along the main path to the terminus of the network. For example, the PathLength of the mouth of the Missouri River will be the distance to the mouth of the Mississippi River.
-
14. RTNDivergence: RTNDivergence is the returning divergence and is set to 1 when one or more of the paths from a split in an upstream flow return to the network at the upstream end of the NHDFlowline feature.
-
15. StreamOrder and StreamCalculator: StreamOrder (fig. 28) in NHDPlus and NHDPlus HR is a modified version of stream order as defined by Strahler (1957). The Strahler stream-order algorithm does not account for flow splits in the network, whereas the algorithm used in NHDPlus and NHDPlus HR for stream order takes flow splits into consideration. The StreamCalculator value-added attribute is a modification of the StreamOrder value-added attribute. StreamCalculator is a variable created to assist with tracking divergences and is computed with StreamOrder. These value-added attributes are computed from upstream to downstream. The method used for assigning StreamOrder and StreamCalculator is as follows:
-
a. When a divergence is reached, the defined main path (Divergence=1) is assigned the same values for StreamOrder and StreamCalculator based on the inflows to the divergence.
-
b. The defined minor-path divergence (Divergence=2) is assigned the StreamOrder value based on the inflows to the divergence, but StreamCalculator is assigned the value “0.” As the minor-path divergence continues downstream, the StreamCalculator value remains “0,” and the StreamOrder value cannot increase until the flowline is combined with another flowline that has a StreamCalculator value greater than 0. This sequence allows multiple minor-path divergences to intertwine without increasing the StreamOrder of the minor path.
-
c. When two minor-path flowlines with StreamCalculator values equal to 0 and different StreamOrder values join, the larger StreamOrder value is maintained, and StreamCalculator remains equal to 0 (fig. 28).
-
d. Because StreamOrder cannot increase if StreamCalculator is equal to 0, when a minor path rejoins the main path, the main path StreamOrder value is maintained.
-
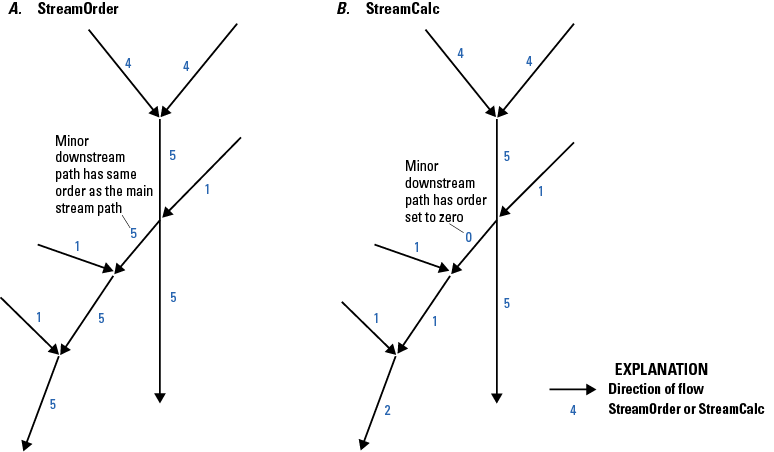
Schematic diagrams showing ordering of the A, StreamOrder (StreamOrde) and B, StreamCalculator (StreamCalc) values in the National Hydrography Dataset Plus High Resolution (NHDPlus HR). The StreamOrder value of a minor downstream path is the same as that of the main-stream path, whereas the StreamCalculator value of a minor downstream path is set to 0 (zero). The StreamCalculator value-added attribute is a modification of the StreamOrder value-added attribute.
Step G—Trim Burn Lines for Raster Processing
In step G, the lengths of some features in the NHDBurnLineEvent feature class are shortened to improve the hydroenforcement process. To lessen the possibility that headwater features will cut through the ridge lines in the elevation data, the headwater features are trimmed by 100 m (except for Alaska, for which headwater features are trimmed 50 m to accommodate the finer 5-m resolution of the elevation data [elev_cm]). To help ensure that the NHDPlus HR flow-direction rasters follow the main paths at flow divergences, the minor paths of divergences are also trimmed or shortened by the same amounts at their upstream ends. (For more information, see the “fdr.tif” section in this report).
Occasionally, a headwater feature or a minor divergent-path feature is shorter than 100 m (or 50 m in Alaska); such features are removed entirely from the NHDPlusBurnLineEvent feature class. Features removed from the NHDPlusBurnLineEvent feature class are not included in NHDPlus HR raster processing, are consequently not hydroenforced into the DEM, and do not receive catchments. When these features are headwater features, they will not have values for the attributes that depend upon the raster processing, such as endpoint elevations, slope, headwater-node area, and flow estimates.
Step H—Prepare Elevation Data
The purpose of step H is to extract, project (from geographic North American Datum of 1983 [NAD 83] in decimal degrees to one of the raster projections shown in table 1), and prepare elevation data from a snapshot of 3DEP DEM. The outputs of this tool are written to the NHDPlus HRRasters<vpuid> raster folder. They include elevation data (elev_cm.tif) in centimeters NAVD 88, a shaded relief raster (shdrelief.jp2), and a file geodatabase (elev_source.gdb and in some cases a GeoPackage) containing two polygon feature classes: the elevation-dataset clip extent (elev_clip) and polygons with source information metadata (elev_meta).
Step I—Populate and Edit Burn Components
In step I, the vector ingredient datasets that will be used in hydrologic conditioning in step L are prepared. This step includes a series of batch processing tools and requires interactive editing and verification steps. New in NHDPlus HR, these tools are called “helper tools” because they assist the developer (builder) in the creation of NHDPlus data. The processes that make up step I use a tool (“Create Features”) that does the following:
-
1. Create workspace and prepare feature classes: The Create Features tool creates a workspace for editing features in step I. Copies of the datasets to be used in hydroenforcement (NHDPlusWall, NHDPlusBurnLineEvent, NHDPlusBurnWaterbody, NHDPlusSink, NHDPlusAddLine, and NHDPlusAddWaterbody feature classes) are added to the workspace. The feature classes are prepared for later step I processing, and field values are assigned for later use in hydroenforcement (step L); for example, NHDPlusBurnLineEvent stream/rivers, artificial paths, canal ditches, and connector features (fcodes=460, 558, 336, and 334, respectively) are assigned Burn=“Y” for elevation burning and Catchment=“Y” for watershed seeding, while the default for pipelines (fcode=428) is to assign Burn=“Y and Catchment=“N.” It is possible to override these default assignments, but as of 2023, it was rarely done in the production of NHDPlus HR. Other field values are populated for use in the data review step (see “Find and Resolve Stream-Wall Conflicts” in this section). The NHDPlusBurnAddLine features that flow into and out of the VPU are identified.
-
2. Tag exit walls for empty HU12s: In this part of step I, HU12 polygons in WBD_HU12 that are not closed basins (as identified by the WBD ToHU field) and include no NHDPlusBurnLineEvent features are identified. HU12s that meet these criteria are termed “empty HUs” and lack any NHDFlowline connection to drain these areas correctly in the HydroDEM. These HU12 polygons are automatically identified when the Create Features tool is run.
Once the empty HU12s are identified, the WBD attribute ToHU in the polygon data is used to determine whether or not a downstream HU12 is identified. If it is, then the NHDPlusWall line feature between the empty HU12 and its identified downstream neighboring HU12 has the Burn field set to “N” to prevent the empty HU12’s downstream wall line from being included in hydroenforcement, allowing the flow to pass from the empty HU12 to the next one downstream.
-
3. Find and resolve stream-wall conflicts: The initial Create Features tool compares all NHDPlusBurnLineEvent features with the VPU boundary and finds any stream-wall conflicts, which can then be interactively resolved. The tool also sets the value of the EDGE field to the following values:
-
• “Y” if the feature crosses the VPU wall and is a headwater flowline,
-
• “X” if the feature crosses the VPU wall but is not a headwater flowline,
-
• “O” if the feature is entirely outside the VPU, and
-
• “I” if the feature is entirely inside the VPU.
Based on the codes defined in Create Features tool, the values of EDGE are used to assign Burn and Catchment values to each NHDPlusBurnLineEvent feature to eliminate conflicts. These automated choices may be reviewed interactively and modified if necessary.
In NHDPlus HR, most waterbodies used in hydroconditioning are treated as areas where the raster representation of the waterbody is assumed to pass water downstream; however, especially in karst or arid areas, some waterbodies are treated as “sinks” where surface-water flow cannot be traced downstream. In step I, this is accomplished by using a feature-class attribute called PurpCode (purpose code). Waterbodies coded as playa features in the NHD are automatically tagged as playa sinks (PurpCode=“SP”). In addition, other waterbodies may be tagged manually with PurpCode=“SC” (closed lakes) in step I. Many of the waterbodies tagged as closed lakes are in arid areas and are located over the internal drainage points of noncontributing (closed) HU12 polygon areas. (Many of these closed HU12 polygons are named for the waterbodies and playas that cover their internal drainage point.) In locations where a waterbody covers a HU12 drainage point, assigning closed lakes prevents the entire HU12 polygon from filling up in the hydroconditioning process.
Other sink-point locations are directly created in step I to stop flow in the hydroconditioning process. For example, a closed HU12 that does not have a playa or lake waterbody at its internal drainage point may require that a topographic depression sink be placed at the lowest point. These sink points are tagged with PurpCode values designating what they represent (for example, SK for karst sinkhole). A process was inadvertently introduced during the initial processing of NHDPlus HR datasets for Hydro Regions 02, 07, 10, 12, 14, 15, and 16 that caused closed waterbody sinks to be created in all off-network waterbodies, resulting in a very large number of extraneous sinks being used in those regions. Some of these regions subsequently have been reprocessed without the extraneous sinks.
-
-
4. Create burn components for international areas (if applicable): For VPUs along international borders, hydrographic data from Canadian or Mexican sources are included in the NHDPlus HR burn components NHDPlusBurnAddLine and NHDPlusBurnAddWaterbody. In some cases, these international data sources are part of harmonized (international) high-resolution NHD data, whereas other sources are datasets available from Canadian or Mexican agencies such as the National Hydrographic Network (NHN) of Canada (Natural Resources Canada, 2017). Additional hydrography is included in the NHDPlus HR to improve catchment delineations in locations where NHDFlowline features receive contributing drainage from international areas. In some noncontributing areas for which information is known, lake polygons in international areas are coded as closed lakes.
-
5. Add Burn Components at inter-VPU connections (if applicable): Wherever VPUs are connected (whether as an inflow to or outflow from an adjacent VPU), the connecting NHDPlusBurnLineEvent features from the adjacent VPU are added to the NHDPlusBurnAddLine feature class of the VPU being processed; this addition ensures that catchment delineations for the VPU being processed are constrained by the adjacent VPU flowlines. In addition, flowlines are needed in the NHDPlusBurnAddLine feature from downstream-associated VPUs to ensure proper hydroenforcement of the DEM. All downstream VPU flowlines are selected to extend to the edge of the DEM. Waterbodies from the adjacent VPUs are integrated into NHDPlusBurnAddWaterbody if features are at or near the connection areas between the VPUs.
-
6. Create NHDPlusLandSea polygons (for a coastal VPU): The NHDPlusLandSea feature class is created by using the NHD coastline features. A buffer polygon area is created for each side of the coastline: a polygon for the land side and a polygon for the ocean side. Estuary polygons are optional features that can be created where they are desired or needed to separate coastal bays from the ocean polygon areas. Separate polygons for each estuary would be useful for estuarine studies that use the NHDPlus HR network.
-
7. Prepare burn components: This is a tool that is run to erase nonconnecting NHDPlusAddLine and NHDPlusAddWaterbody features and set required fields (Burn, Catchment, RPUID, VPUID) in the temporary-sink feature class. The prepared datasets are added to the map to verify that the process ran correctly.
Step J—Prepare Sinks
Step J is an automated step that creates sink points from disconnected line features and polygon features (playas, closed HU12 polygons with no sinks or flow features). This step begins by using Update VPU workspace. This tool copies NHDPlus HR data back to the production workspace so that the data can be used in this and subsequent steps. Step J also assigns a unique identifier (NHDPlusID) to all non-NHD-derived burn components (including point sinks created in step I).
-
1. Create NHDPlusIDs for new features: This automated step populates NHDPlusIDs for all features lacking an identifier (ID). These features include NHDPlusAddLine and NHDPlusAddWaterbody features inside the VPU and any new manual sinks created in step I.
-
2. Populate OnOffNet for NHDPlusBurnWaterbody features: To create more realistic catchments, waterbodies on and off the network are handled differently in the creation of the hydrologically conditioned DEM (HydroDEM). For this reason, the OnOffNet fields in the NHDPlusBurnWaterbody and NHDPlusBurnAddWaterbody feature-class tables are populated. OnOffNet is used to differentiate waterbodies that intersect a burn line using either the NHDPlusBurnLineEvent or the NHDPlusBurnAddLine feature class. Only features in NHDPlusBurnLineEvent feature class with a “Burn=Y” are used in the spatial-intersect selection. All features in the NHDPlusBurnAddLine feature class are used in the spatial-intersect selection with the NHDPlusBurnWaterbody and NHDPlusBurnAddWaterbody feature classes. Open waterbodies (including lakes, ponds, and playas but excluding wetlands) that intersect a burn line are coded as “1” in the field OnOffNet. The hydroenforcement process for these features in step L is different from that for waterbody features that do not intersect burn lines (OnOffNet=0).
-
3. Create derived sink features: Derived sink features are created for the following scenarios:
-
a. Identify ends of isolated networks: Network ends are identified by finding NHDPlusPlusFlow records that have Direction=713 (tables 16 and 32). Sinks are created for the corresponding NHDPlusBurnLineEvent feature’s most downstream point. These NHDPlusSink features are assigned the following values:
-
• PurpCode=“SE” (network end)
-
• SourceFC=“NHDFlowline”
-
• FeatureID=“NHDPlusID” of the “NHDPlusBurnLineEvent” feature
-
• The value for the InRPU field of the network-end feature (identifying the RPU in which the feature is located) is carried over from the InRPU field of the NHDPlusBurnLineEvent feature
-
-
b. Remove sinks near flowlines: Sinks are removed if they are within two cells (this is a parameter for step J) of an NHDPlusBurnLineEvent or NHDPlusBurnAddLine feature that is not associated with the isolated network.
-
c. Identify nonspatially connected network ends: These ends are identified from the NHDPlusFlowline table where the values in the field GapDistKM exceed 0.03 km. The InRPU value is carried over from the NHDPlusBurnLineEvent feature into the InRPU field in the NHDPlusSink feature class table. These NHDPlusSink features are assigned the following values:
-
-
4. Create sinks for BurnWaterbody playas: Create sinks at the centroids of polygon features in the NHDPlusBurnWaterbody feature class that are classified as playas (36099<FCODE<36200). These playa-sink polygon features are assigned the following values:
-
• PurpCode=“SP” (playa)
-
• PurpDesc=“NHD Waterbody Playa”
-
• SourceFC=“NHDWaterbody”
-
• FeatureID=NHDPlusID of the NHDPlusWaterbody feature that the sink represents
-
• The value of the InRPU field is set by using a spatial-overlay intersect with the RPU polygons in the NHDPlusHRGlobalData\NHDPlusBoundaryUnit feature class
-
-
5. Create sinks for BurnWaterbody closed lakes: Create sinks at the centroids of polygon features in the NHDPlusBurnWaterbody feature class that were tagged as closed lakes in step I. These NHDPlusSink features are assigned the following values:
-
• PurpCode=“SC” (closed lake)
-
• PurpDesc=“NHD Waterbody closed lake”
-
• SourceFC=“NHDWaterbody”
-
• FeatureID=“NHDPlusID” of the “NHDPlusWaterbody” feature that the sink represents
-
• The value of the InRPU field is set by using a spatial-overlay intersect with the RPU polygons in the HRNHDPlusGlobalData.gdb\NHDPlusBoundaryUnit feature class
-
-
6. Create sinks for NHDPlusBurnAddWaterbody playas: Creates sinks at the centroids of polygon features in the NHDPlusBurnAddWaterbody feature class that are classified as playas (FCODE>36099 and FCODE<36200). These NHDPlusSink features are assigned the following values:
-
• PurpCode=“SP” (playa)
-
• PurpDesc=“NHDPlusBurnAddWaterbody playa”
-
• SourceFC=“NHDPlusBurnAddWaterbody”
-
• FeatureID=“PolyID” of the “NHDPlusBurn AddWaterbody” feature that the sink represents
-
• The value of the InRPU field is set by using a spatial-overlay intersect with the HRNHDPlus GlobalData\NHDPlusBoundaryUnit feature class
-
-
7. Create sinks for NHDPlusBurnAddWaterbody closed lakes: Creates sinks at the centroids of polygon features in NHDPlusBurnAddWaterbody that are classified as closed lakes in step I. These NHDPlusSink features are assigned the following values:
-
• PurpCode=“SC” (closed lake)
-
• PurpDesc=“BurnAddWaterbody closed lake”
-
• SourceFC=“NHDPlusBurnAddWaterbody”
-
• FeatureID=”PolyID” of the “NHDPlusBurnAddWaterbody” that the sink represents
-
• The value of the InRPU field is set by intersecting a spatial overlay with the HRNHDPlusGlobalData.gdb\NHDPlusBoundaryUnit feature class
-
-
8. Create sinks in closed HU12 polygons (if needed): Closed (noncontributing) HU12 polygons are coded in WBD as ToHU=“C” or ToHU=“CLOSED BASIN.” If no sinks have been placed in these closed HU12 polygons, sinks are placed at the minimum elevation point(s) within the HU12. The DEM created in step H (elev_cm.tif) is used to determine the minimum elevation within a given closed HU12. These NHDPlusSink feature-class fields are assigned the following values:
-
• PurpCode=“SH” (closed HU12 centroid or point of minimum elevation)
-
• PurpDesc=“WBD_Closed HU12”
-
• SourceFC=“WBD_Subwatershed”
-
• FeatureID=”NHDPlusID” of HU12 polygon
-
• The value of the InRPU field is set by using a spatial intersect with the HRNHDPlusGlobalData.gdb\NHDPlusBoundaryUnit feature class
-
Step K—Review Sinks
Step K is a manual step that provides an opportunity to interactively review the contents of the production workspace. If necessary, erroneously placed sinks created in Step J may be removed by manual editing.
Step L—Build Catchments, Flow-Direction Rasters, and Other Rasters
Step L processes the elevation raster assembled in Step H with burn component feature classes (flowlines and sinks, for example) prepared by the previous steps to create the HydroDEM and build raster flow-derivative raster datasets of flow direction and flow accumulation, and catchments for features in the NHDPlusBurnLineEvent and NHDPlusSink feature classes and sink features that are marked for catchment delineation (Catchment=“Y”). Finally, the raster catchments are converted to polygon features and added to the NHDPlusCatchment feature class.
Preparation for Catchment Delineation
The general procedure in preparing the input vector data from the NHDPlusBurnComponents folder is as follows:
-
1. Assign GridCode values: GridCode values are unique sequential numbers used to identify catchments for raster processing. Positive GridCode values have a 1:1 match with NHDPlusIDs. GridCode values are assigned to all flowlines in the NHDPlusBurnLineEvent feature class and all sink points in the NHDPlusSink feature class. Sequential negative GridCode values are assigned to all features in the NHDPlusBurnAddLine feature class that are outside the VPU. All positive GridCode values are recorded with their corresponding NHDPlusIDs in the NHDPlusIDGridCode table in the production workspace.
-
2. Extract features from the NHDPlusBurnLineEvent feature class where Burn=“Y.” Write selected records to a temporary TmpBurnLineEvent feature class.
-
3. Append all features from the NHDPlusBurnAddLine feature class to the TmpBurnLineEvent feature class. The TmpBurnLineEvent feature class is used in the stream-burning process (described in the “Stream burning using the AGREE method” section in the hydroenforcement part of this step) for hydrologic enforcement of the NHD streams and additional features from the NHDPlusBurnAddLine feature class.
-
4. Extract features from the NHDPlusBurnLineEvent feature class where Catchment=“Y.” Write selected records to a temporary TmpCatchLine feature class.
-
5. Select features from NHDPlusBurnAddLine with GridCode greater than 0. Append selected features to the TmpCatchLine feature class, which will be used to generate catchments.
-
6. Combine waterbodies from the NHDPlusBurnWaterbody and NHDPlusBurnAddWaterbody feature classes and assign them to a temporary feature class. This temporary feature class (TmpWaterbody) will be used for hydroenforcement of all waterbody features.
-
7. Select features from the NHDPlusBurnWaterbody and NHDPlusBurnAddWaterbody feature classes for which OnOffNet=“1” and assign them to the temporary TmpWBodyOn feature class, which will be used for the processing of waterbodies according to bathymetric gradient.
-
8. Select NHDPlusSink features with Burn=“Y” for hydroenforcement and create a temporary sink feature class of the selected sinks.
-
9. Calculate STEP values for each TmpBurnLineEvent feature for hydroenforcement. STEP values are based on the values of the NHDPlus value-added attribute HydroSeq field and act like stairsteps defining the elevation of the bottom of the burned-in canyon representing the stream. The riverbed is calculated to decrease in elevation when features are traced from upstream to downstream. The STEP value is used to enforce raster flow to follow the vector-network flow from upstream to downstream.
The next part of this process is to build the rasters for the HydroDEM for each RPU. The following is a general overview of the main raster-processing substeps in building the HydroDEM for each RPU. The procedure is intended for future versions of NHDPlus HR to be repeated for each RPU of the VPU being processed. At present (as of 2024) however, there is only one RPU comprising each VPU. The substeps for processing the primary rasters are as follows:
-
10. Clip the VPU vector data to the RPU buffer area.
-
11. Assign negative GridCode values to the TmpCatchLine features that are inside the VPU but do not belong to the RPU being processed.
-
12. Convert all flowlines (NHDPlusBurnLineEvent and NHDPlusBurnAddLine) to rasters. The StreamLevel field from the NHDPlusVAA table is used to prioritize the vector-to-raster processing so that main-stem flowlines take precedence at confluences in the merge operation. This conversion ensures correct representation of the flowline network in the raster-data model.
-
13. Assign negative GridCode values for non-negative sink features that do not belong to the RPU being processed.
-
14. Convert all sinks to a raster by using GridCode values as the cell values.
-
15. Merge the sink raster with the NHD raster; the merged raster is the catseed.tif raster (“Raster Datasets” section of this report) and the seed raster that is used as the source raster for catchment delineation.
Hydroenforcement
To create a flow-direction raster (used for catchment delineations), the raster DEM (elev_cm.tif) is altered to force alignment with streams, waterbodies, sinks, and watershed divides through a process called hydroenforcement. The overall process is the same as that used for NHDPlusV2. The python script for NHDPlusV2 catchment delineation is published as a supplement to Moore and Dewald (2016). The input-data to this process include TmpWaterbody, TmpBurnLineEvent, TmpSink, and NHDPlusLandSea. And the enforcement is described as follows.
-
1. Waterbody enforcement: Certain waterbody features from the NHD were used in the HydroDEM enforcement process; these features include the Lake/Pond, Playa, and Reservoir features from the NHDWaterbody feature class and the Stream/River polygon features from the NHDArea feature class. Step 6 of the NHDPlus and NHDPlus HR production process selects these features from both NHD feature classes and writes them to the NHDPlusBurnWaterbody feature class. In addition to NHD features in the BurnWaterbody feature class, any other waterbodies collected in the NHDPlusBurnAddWaterbody feature class are also enforced. For this processing, the features from both BurnWaterbody feature class and the BurnAddWaterbody feature class are combined into a temporary waterbody feature class.
The waterbody enforcement is a two-stage process that improves catchment delineations near waterbodies. In this process, all the waterbodies are enforced by determining the minimum DEM elevation and by setting the overlapping waterbody cells in the HydroDEM to the minimum DEM value for each waterbody. The elevations of these cells are then decreased (dropped) by subtracting 100 m from the previously set minimum elevation values. Decreasing the elevations of the waterbodies ensures that these cells are well below the surrounding terrain. When the Fill process is applied to the HydroDEM (in the “Final HydroDEM, Catchments, Flow Direction, Flow Accumulation, and Other NHDPlus HR Raster Outputs” section of this step), the waterbodies will fill and drain to one location, the result of which will lead to better alignment of catchments with these features.
The second stage process of the waterbody enforcement, termed “applying a bathymetric gradient,” is the same process used in NHDPlus versions 1 and 2 (Horizon Systems Corp, undated a, b). The bathymetric gradient ensures that the catchments generated for artificial path flowlines within waterbodies are based on a gradient directed toward the artificial path flowlines (fig. 29). This process involves enforcement of just the waterbodies that intersect the flowline network (OnOffNet=1) or have a sink within them.
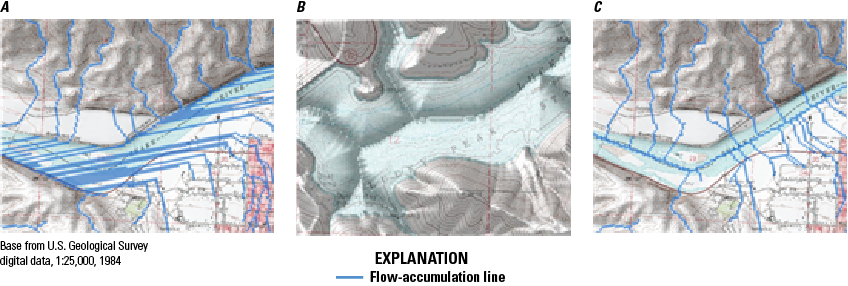
Figure 29. Maps showing A, flow-accumulation lines (blue) in a standard digital elevation model (DEM), B, bathymetric gradient of a waterbody and bathymetry, and C, flow-accumulation lines determined based on bathymetric-gradient values in the National Hydrography Dataset Plus High Resolution (NHDPlus HR). The bathymetric gradient ensures that the catchments generated for artificial path flowlines within waterbodies are based on a gradient directed toward the artificial path flowlines.
-
2. Stream burning using the AGREE method: Modifications were applied to the source DEMs (elev_cm.tif) to produce the HydroDEM. These modifications were considered necessary because often the drainage path (flow path) defined by the 3DEP DEM surface does not exactly match the NHD (fig. 30A). In many cases, the NHD streams and 3DEP-DEM-derived streams are parallel or offset from each other. If this offset distance is greater than one raster-cell width, then some cells may not be identified as being upslope from the NHD stream segment and therefore could be excluded from the delineated catchment in error (fig. 30B).
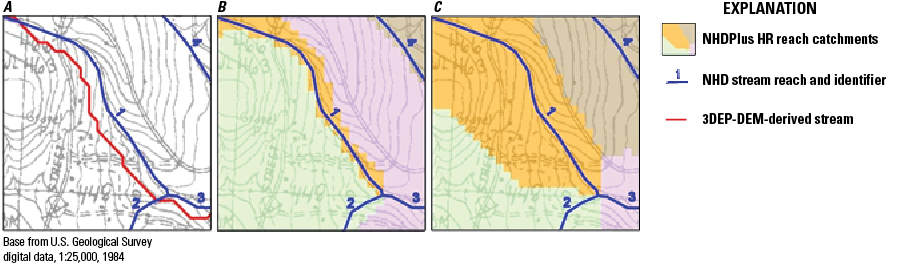
Figure 30. A, Displacement of a 3D-Elevation Program (3DEP) elevation model-derived stream from the National Hydrography Dataset (NHD)-delineated stream. Often the drainage path (flow path) defined by the 3DEP digital elevation model (DEM) surface (blue lines) does not exactly match the NHD. B, Errors in catchment delineations created by using unmodified 3DEP data. C, NHD catchment delineations corrected by using AGREE-modified 3DEP data for the National Hydrography Dataset Plus (NHDPlus) High Resolution. AGREE is a program originally written in ARC Macro Language (AML), converted into Python, and incorporated into the NHDPlus catchment delineation process.
To mitigate this mismatch of stream locations, the NHD vector drainage was integrated into the raster 3DEP DEM data, often referred to as “stream burning” (Saunders, 2000). This process uses computer algorithms originally written in the AGREE Arc Macro Language (AML) program (Hellweger and Maidment, 1997). The algorithms are now run in Python using ArcGIS ArcPy commands. Figure 30C illustrates how the AGREE program corrects for DEM flow path displacement errors when delineating catchments.
AGREE follows a procedure called “burning a canyon” into the DEM created from the 3DEP-DEM-derived data by subtracting a specified vertical distance from the elevation of the NHD vector streamlines. AGREE was modified to control the elevation of the bottom of the canyon by the values determined from the HydroSequence field of the flowlines to ensure that the flow-direction raster points downstream. (Lower HydroSequence values equate to lower channel-bottom elevations.)
AGREE also modifies the elevations adjacent to NHD stream-cell locations in the DEM within a buffer distance specified by the developer. Typically, the buffer distance is related to a common horizontal-displacement error between NHD and 3DEP-DEM-derived streams; this error is seldom exceeded. For NHDPlus HR HydroDEM production, the buffer distance was set to six cell widths (60 m or 30 m for Alaska) on each side of the line of the NHD stream (fig. 31). The smoothing process changes the DEM raster-cell elevations within the buffer area to create a downward-sloping gradient toward the modeled canyon beneath the NHD streams. The steepness of the slope within the buffer is controlled by the AGREE “Smooth Drop/Raise Distance” option. For the HydroDEM, a smooth drop distance of 500 m was specified, with acceptable results.
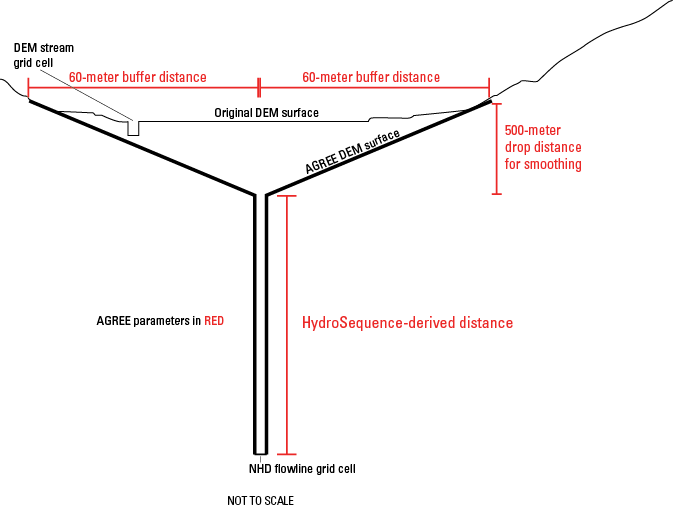
Figure 31. Schematic diagram showing a modified cross section of a digital elevation model (DEM) in the National Hydrography Dataset Plus High Resolution (NHDPlus HR) using the algorithms of the AGREE program for hydroenforcement. The smoothing process changes the DEM raster-cell elevations within the buffer area to create a downward-sloping gradient toward the modeled canyon beneath the National Hydrography Dataset streams. Modifications are shown in thick black lines. NHDPlusFlowline is the flowline feature class from the National Hydrography Dataset Plus.
The use of AGREE’s six-cell-smoothing buffer distance of the NHD streams may cause potential problems at headwater flowlines because they begin at or near drainage divides in the DEM. The six-cell buffer distance at these headwater streams may extend across the DEM drainage divides and into the adjacent watershed, thereby including areas outside the actual catchment area.
To minimize the problem of extending headwater streams into adjacent watersheds, these headwater streams were trimmed back in step G of the NHDPlus and NHDPlus HR production process (“Step G—Trim Burn Lines for Raster Processing” section of this report). In addition, headwater streams still in conflict with the divides of the WBD HU12s in the NHDPlusWall feature class were trimmed back to remove 70 percent of their original length (during step I of this NHDPlus and NHDPlus HR production process). The trimmed-back positions are noted in the ToMeas field of the NHDPlusBurnLineEvent table. These positions are retained in the NHDPlusBurnLineEvent feature class, whereas the NHDFlowline feature class remains unaltered.
-
3. Enforcement of WBD divides as walls: A seamless nationwide network of the HU12 drainage divides of the WBD are integrated into the HydroDEM as “walls” in the Wall feature class. The process of conditioning DEM data to WBD drainage divides is called walling, which vertically exaggerates DEM elevations corresponding to the locations of WBD ridge lines (fig. 32). The vertical distance used to exaggerate the cells is a specified constant added to the elevation raster cells above the WBD. Breaks in the walls were created where the stream network crosses the WBD to ensure proper passage of water from one WBD HU12 to another. A graphical three-dimensional (3D) representation of a hydrologically conditioned DEM with WBD walling and the NHD “burning” is shown in figure 32.
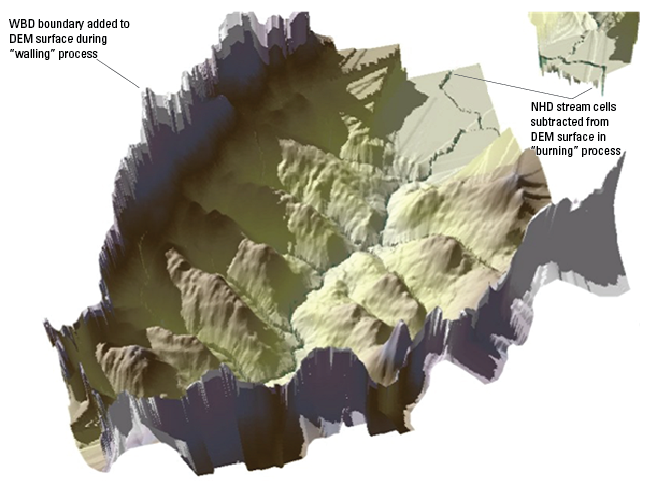
Figure 32. Perspective view of a modified digital elevation model (DEM) with “walling” of existing Watershed Boundary Dataset (WBD) boundaries and “burning” of National Hydrography Dataset (NHD) streams from hydroenforcement in the National Hydrography Dataset Plus High Resolution (NHDPlus HR). Walling vertically exaggerates DEM elevations corresponding to the locations of WBD ridge lines. The AGREE Arc Macro Language (AML) program (Hellweger and Maidment, 1997) follows a procedure called “burning a canyon” into the DEM created from the 3D elevation program 3DEP-DEM-derived data by subtracting a specified vertical distance from the elevation of the NHD vector streamlines.
-
4. Create elevation steps for flowlines: Modified from the original AGREE process (Hellweger and Maidment, 1997), NHDPlus HR computes the values of the elevations of cells within the NHD stream channel by using the values of the NHDPlus value-added attribute HydroSeq to compute a unique elevation value for each flowline, thus creating a stepping sequence within the burned-in stream canyon from AGREE. This improvement enhances the ability of the HydroDEM flow path to follow the main-path navigation defined by NHDPlus and resolves issues that sometimes occurred with NHDPlus version 1 (Horizon Systems Corp, undated a) flow-direction rasters, in which the Fill process forced uphill flow into an adjacent RPU or VPU inflow connection. Although catchment delineations are unaffected by the flow directions of cells in streams, the use of stepped values for the stream channels in NHDPlus HR greatly enhances the usability of the flow-direction raster for watershed delineations.
-
5. Enforcement along the NHD coastline: Another feature of NHDPlus HR is the hydroenforcement of NHD coastline areas, which are in the NHDPlusLandSea feature class. In NHDPlus HR, the ocean areas within a buffer area of the NHD coastline have elevation values lower than any NHD feature on land. For coastal estuaries of interest, a two-tiered stepping process was imposed in the HydroDEM to allow for DEM-based watershed delineation (post-NHDPlus HR production) allowing the selection of just one raster cell as the seed for the watershed delineation within the estuarine portion of the LandSea polygon.
The new NHDPlusBurn component of the feature class NHDPlusLandSea is used for coastal enforcement. The enforcement is only applied for VPUs with NHD coastline flowlines. NHDPlusLandSea is a polygon feature class that typically contains two or three unique polygon categories coded in the field named “Land.” The polygon coded as Land=1 is used to resolve any disparity of landward elevations in the HydroDEM between the NHD coastline and the coastline defined by the 3DEP DEM. The ocean polygon (Land=−2) in the NHDPlusLandSea feature class is used to drop the surface elevation of ocean cells in the HydroDEM below the imposed elevations of the NHD coastline. Estuary polygons (Land=−1) are optional features along the coast for those bays where it is preferable to have the estuary polygons differentiated from the ocean cells. In the final HydroDEM, the estuary cells are 1 cm higher than the ocean cells and 1 cm lower than the lowest NHD coastline in the VPU. By using the NHDPlusBurnAddLine feature class, flow paths can be imposed onto the estuary- and ocean-elevation cells in the form of burned-in canyons to direct the drainage paths through estuaries.
-
6. Enforcement of sink points—For VPUs with sinks, the points are converted to a raster wherein a sink is represented by one raster cell. These sink cells are set to NoData in the HydroDEM so that drainage from the sinks flows to these points. Later, when the NHDPlus flow-direction raster is created, these NoData cell values are replaced with 0 (zero) values in the flow-direction raster to ensure their usability with point-based watershed delineation.
Final HydroDEM, Catchments, Flow Direction, Flow Accumulation, and Other NHDPlus HR Raster Outputs
After the NHDPlusBurn components are processed through the various hydrological-conditioning steps, the HydroDEM for each RPU is finalized by applying the Fill process. Fill is used to resolve any depressions in the DEM by “filling” these areas so that the cells drain to the lowest surrounding raster cells. All low points are filled except for those areas designated in the HydroDEM as “NoData” cell sinks. The HRNHDPlusRaster filldepth.tif shows cells raised by the Fill process and is available along with the HydroDEM data (hydrodem.tif) for each RPU.
From the final filled HydroDEM, the flow-direction and flow-accumulation rasters are created and written to each HRNHDPlusRasters<vpuid> folder. Flow-direction and flow-accumulation rasters represent cells and cell counts only within the RPU (or VPU since there is only one RPU per VPU at present [as of 2023]); they do not include cells in upstream production units or buffer areas.
Another feature of NHDPlus HR is that there is a second version of this flow direction where the burned-in surface-water features (streams and waterbodies within the network) are replaced by NoData cells. This variant flow-direction raster is named fdroverland and is also written to the HRNHDPlusRasters<vpuid> folder. The fdroverland.tif raster can be used with the FlowLength function in the ArcGIS Spatial Analyst Toolbox to determine the overland flow-path length from each raster cell to a NoData stream, waterbody, or coastline. Flow-length rasters are useful for a variety of applications, including determining buffer areas on the banks of rivers or lakes.
The standard NHDPlus HR flow-direction raster (pointing to just one downstream direction) is used in conjunction with the NHDPlus HR catseed.tif raster to determine the catchments for the NHD flowlines and NHDPlus sinks. The SourceFC field indicates whether the catchment is delineated from an NHDPlusSink or NHDPlusBurnLineEvent feature.
The data on catchments are available in raster format (cat.tif) and as a vector-polygon feature class (catchment). The vector polygon was created in Python by using ArcGIS’s Raster to Polygon tool. It is important to note that catchment features in a feature class may be made up of one or more vector-polygon features. Multiple polygon features occur because of the 10-m raster-cell resolution of the source and the raster-to-vector conversion process. One or more cells with directional flow traveling diagonally into an adjacent cell along a catchment boundary may create a separate polygon in the vector-data model if these data are converted from a raster (fig. 33). These multiple polygons are merged, however, into a single multipart polygon, for each catchment.
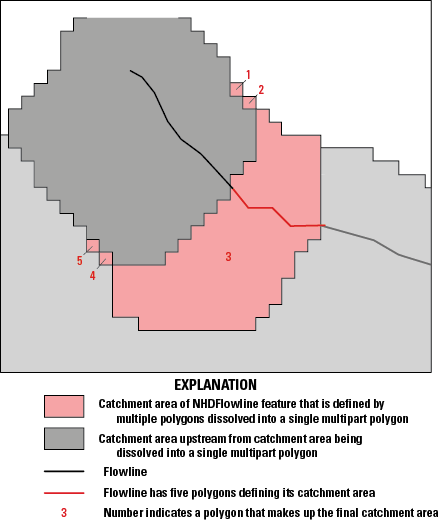
Schematic diagram showing a multipart feature (pink) defining a catchment area in the National Hydrography Dataset Plus High Resolution (NHDPlus HR). One or more cells, with directional flow traveling diagonally into an adjacent cell along a catchment boundary, may create a separate polygon in the vector-data model, if these data are converted from a raster. The final catchment is represented by a single multipart polygon.
Step L also determines the minimum elevations in the NED (elev_cm.tif) for each catchment and writes out the values to the NHDPlusElevSlope table found in the NHDPlusAttributes folder. The minimum elevation of the catchment is assumed to be at the outlet of the catchment and thus is also the value used for the minimum elevation of the stream or river represented by the flowline. These minimum elevations are recorded as the flowlines’ minimum raw elevations in field MinElevRaw; smoothed elevations are created later in the process and recorded in the field MinElevSmo.
Step M—Build Filled Areas and Review
The output from the processing in step L is checked in an automated manner to verify the results:
-
1. Verify that GridCode values were assigned for all burn components. This is a check for unanticipated data or software problems.
-
2. Check for gaps in the catchment mask (the area defining the catchments), ensuring that the catchments between RPUs are seamless. This is also a check for unanticipated data or software problems.
-
3. Check for large, filled areas. If these are found, they may indicate that there is an incompatibility between burn components and changes should be made to one of the components. Large, filled areas are not unusual and do not indicate a software problem; this can be fixed by going back to step I (to edit burn components, for example, by breaching walls) and rerunning steps J through L.
A tool called Step M Checks can be run to generate a log file and a map document showing the results of these checks. In addition, the Step M Flow Trace tool can be run to verify that the raster flow directions are consistent with the hydrography.
Step O—Compute Headwater-Node Areas and Raw Elevations
In this step, the catchment area of the upstream end (called the “headwater node”) of each headwater flowline and the “raw” (unsmoothed) elevations for the downstream end of each headwater flowline are determined. First, the part of the total catchment area that drains into the headwater node is determined. The minimum elevation within each headwater-node catchment is obtained from the elev_cm.tif and then used as the maximum raw elevation for the corresponding headwater flowline. Upstream and downstream flowlines are interpolated to assign elevations to flowlines that do not have catchments due to discretization (flowlines too small to receive a catchment), which is done in step G. The results of step O are stored in the NHDPlusFlowlineVAA table in the HWNodeSqKm (headwater-node catchment area), MaxElevRaw (maximum elevations of headwater-node catchments [generated from the upstream end of the headwater stream]), and MinElevRaw (minimum elevations) for all flowlines that are missing catchments. The values of the MaxElevRaw and MinElevRaw fields are inputs to step Q.
Step P—Build Flow-Accumulation Raster
The flow-direction raster built in step L is used to calculate a flow-accumulation raster for each RPU. The flow-accumulation raster records a count of all cells that flow into each cell across the dataset; the product of the cell size and the cell count is the raster drainage area to every cell within the RPU (assuming dendritic conditions).
Step Q—Smooth Raw Elevations
The raw flowline elevations developed in step O provide upstream elevations for most headwater flowlines and downstream elevations for most flowlines. (The situations where upstream and downstream elevations are not available are described in the “Special Consideration” part of this step.) Raw elevation values from step O may result in negative slopes where elevations increase as the flowlines are traversed from upstream to downstream. This problem is not uncommon when using DEMs for estimating flowline slopes. To develop non-negative slope estimates for all flowlines and consistent elevations at nodes, several steps are performed in elevation smoothing. The postprocessing and elevation smoothing take advantage of advanced NHDPlus network traversal capabilities.
-
1. First, because the minimum elevations for flowlines joining at a downstream node are independently developed in step O and thus may not be equal, the elevations at such nodes are made equal by using the minimum elevation of the one (or more) flowlines that are immediately upstream of the node.
-
2. Second, the node elevations are also assigned as the maximum elevation for each flowline that is immediately downstream of the node.
These two processes result in consistent node elevations for flowlines with catchments. When all the flowlines immediately upstream of a node are too short to generate catchments, the node will have an elevation equal to the downstream smoothed elevation.
-
3. Third, elevations are projected between upstream and downstream MinElevRaw elevations so that MinElevRaw elevations assigned to the flowlines have negative slopes. The result of the smoothing is that all the flowlines will have a positive (“downhill”) or 0 (zero) slope. NHDPlus HR slopes are constrained ≥0.00001 meter per meter (m/m) even when the elevation smoothing process produces equal upstream and downstream elevations on a flowline. Another important reason to perform smoothing is to ensure that all networked flowlines have elevations and slopes. For nodes with missing elevations, the smoothing process fills in these elevations and slopes based on the elevation values of the flowlines upstream and downstream. There are some cases where the smoothed elevations produce a 0 (zero) slope, but the slope is set to missing (−9998), which is described under the “Special Consideration” part of this section.
-
4. Fourth, because “raw” elevations are based on the values determined in the catchment building process, many flowlines are trimmed in step G, which leads to these elevations being computed based on the trimmed flowline. Therefore, the elevation smoothing length used for calculating slope (SlopeLenKM) uses the flowline lengths from the NHDPlusBurnLineEvent features.
The results of the elevation smoothing processing are stored in the MinElevSmo and MaxElevSmo fields in the NHDPlusFlowlineVAA table. One of the powerful features of NHDPlus HR is the ability to extract all the flowlines for a stream path and sort in an upstream or downstream order. This capability permits smoothing to be completed on a stream-level path basis (for example, the Ohio River main stem). Also, the elevation smoothing is done sequentially, going from the main stem to the tributaries.
-
• Smoothed elevations and slopes for NHDPlus: An upstream smoothing approach is employed to smooth flowline elevations at end nodes (fig. 34). The approach interpolates in the upstream direction and forms the upper envelope of the elevation profile.
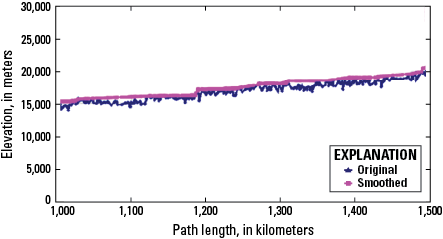
Figure 34. Graph showing upstream elevation smoothing in the National Hydrography Dataset Plus High Resolution (NHDPlus HR).
A relatively small number of flowline connections exist where elevations of all flowlines at a node are not consistent. These elevation inconsistencies occur only where some level paths meet, particularly in areas with complex divergences. As a result of elevation smoothing, most (>99 percent) flowlines in the network receive a slope ≥0.00001 m/m.
-
• Special consideration: Sometimes, headwater flowlines or minor path flowlines are trimmed back to the point where a catchment cannot be built. In these cases, both upstream and downstream raw elevations are missing (−9998). Also, where Catchment or Burn fields are set to “N,” the actual slope cannot be determined but should not be considered to be 0 (zero); in such cases, the slope is set to missing (−9998). In addition, in some cases where the downstream junction is a simple junction, the downstream flowline also has a slope set to missing; this is because there is no way to determine an upstream elevation, but there is no reason to expect it to be 0 (zero). The elevation smoothing process does assign elevations in these situations, but the upstream and downstream elevations are equal. In cases where the slope is missing, the streamflow velocity (discussed in the “Velocity Computation” section) is computed with the Jobson unknown slope regression equation (Jobson, 1996, eq. 14, p. 15).
Step R—Accumulate Catchment Area and Adjust VAAs in Upstream VPUs
Step R uses accumulation processes to establish the cumulative upstream catchment areas for each NHDFlowline feature in the current VPU where some of that upstream area comes from another VPU. Step R adjusts the upstream area for NHDFlowline features where NHDFlowline.InNetwork=“Y” and NHDFlowline.FType≠“Coastline.” Cumulative catchment areas are stored in the NHDPlusFlowlineVAA table. Step R also adjusts value-added attribute values for TerminalPa, LevelPathI, and StreamLevel where these values involve multiple VPUs.
Step S—Compute Catchment Attributes for Flow Estimation
Step S overlays NHDPlusCatchments on various attribute rasters to compute mean values of the attribute for each catchment. The following attributes are computed:
Step T—Enhanced Runoff Method (EROM) Streamflow Estimation, QAQC, and Jobson Velocity Estimation
Generally, step T is run for a VPU and all upstream VPUs that are within the same hydrologic region (two-digit hydrologic unit [HU2]). In very large HU2s, it is likely that processing all VPUs in a single run of step T may not be appropriate. This can be determined by reviewing the EROMQARpt table. When that is the case, a determination is made about which VPUs have similar climatological characteristics, and these are combined into single step T run. The group of VPUs must form a contiguous drainage but need not extend to the headwaters.
EROM Step T1—Unit Runoff Calculations
Step T1 uses the mean annual runoff provided by the U.S. Global Change Research Program (USGCRP, https://www.globalchange.gov/), which used a water-balance approach to estimate runoff. The water-balance approach takes precipitation, potential evapotranspiration (PET), evapotranspiration (ET), and soil moisture storage into account. The McCabe and Wolock (2011) water-balance model was run on each 1-km resolution grid cell raster representations of monthly precipitation and temperature from PRISM for the conterminous United States. The United States rasters were extended into Canada and Mexico using similar data from the Canadian Forest Service (McKenney and others, 2006). Newer NHDPlus HR VPU data released in 2022 used rasters based on the Daymet Version 3 1-km monthly precipitation and temperature datasets (Thornton and others, 2016) for North America, averaged over the 1990–2019 period. In this process, ET losses are not allowed to exceed precipitation. In step S, the mean annual runoff raster (fig. 35) is overlain with the NHDPlus HR catchments to compute runoff within each catchment. The catchment runoff values are conservatively routed downstream to arrive at the first estimate of streamflows for each networked NHDFlowline feature. For use in NHDPlus HR, the runoff raster was expanded to include areas of Canada and Mexico.
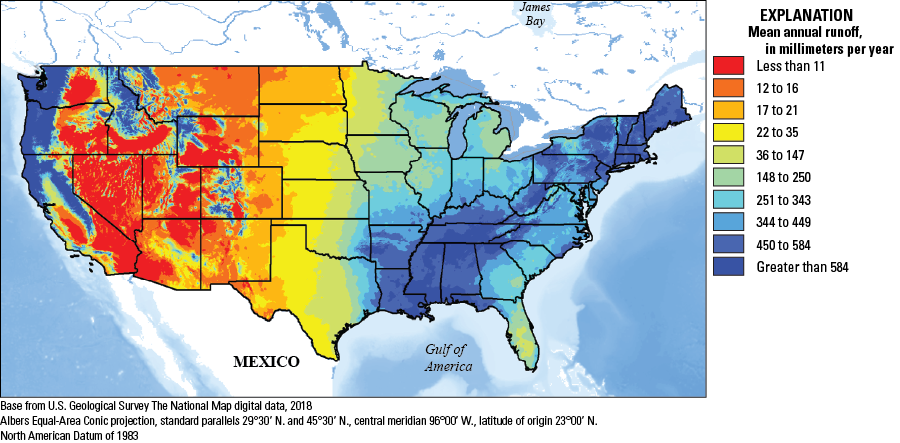
Map of the conterminous United States showing the mean annual-runoff raster image used in the National Hydrography Dataset Plus High Resolution (NHDPlus HR) step T1 of the Enhanced Runoff Method (EROM) process. The mean annual runoff raster is overlain with the NHDPlus HR catchments to compute runoff within each catchment. For use in NHDPlus HR, the runoff raster was expanded to include areas of Canada and Mexico.
Incremental runoff flows for each network NHDFlowline feature are stored in the QIncrAMA field. The QIncrAMA flows are routed and accumulated to produce the step T1 flow estimates that are labeled QAMA.
EROM Step T2—Excess Evapotranspiration Adjustment
Step T2 implements a method that takes “excess ET” into account. This method, developed by Dave Wolock of the USGS (McCabe and Wolock, 2011), considers the total available water in a given catchment to compute additional losses due to ET. The ET losses can exceed the total water available in a catchment, resulting in a net loss in streamflow.
As streamflow is routed through the NHDFlowline network, part of the flow can be “lost” in a downstream catchment through ET. The quantity of loss in streamflow is assumed to be a function, in part, of excess potential ET (PET), which is defined as the PET that is in excess of actual ET (AET). The model assumes that the excess PET within the river corridor itself places a demand on water entering the catchment from upstream flow and that the river corridor is 30 percent of the total catchment area (Fract1 variable in the model). Furthermore, it is assumed that the amount of upstream flow that can be lost to satisfy excess PET is limited to 50 percent of the total upstream flow (Fract2). These percentages were determined by subjective calibration of the model to measured streamflow in arid regions that clearly lose water in the downstream direction. Runoff consumption in a catchment occurs when locally generated streamflow computed from the water-balance model is less than streamflow loss due to excess PET.
There are situations, such as in temperate areas east of the Mississippi, where this step is not run and the step T2 flows are set equal to the step T1 flows. For mean annual flows, there is an option to not run this step. If the NHDPlusEROMQARpt error statistics for a VPU show that step T2 greatly increases the error terms, EROM can be rerun with the option to skip step T2. Input data are as follows:
-
• PrecipMA: mean annual precipitation in the catchment from precipitation rasters
-
• TempMA: mean monthly temperature of the catchment from temperature rasters
-
• LatMean: average latitude of the catchment for the NHDFlowline feature class
-
• QIncrAMA: incremental flow in the catchment from step T1
-
• Julian Day: for each month, the Julian calendar day for the middle of the month
-
• Fract1, Fract2: input parameters to step T; default values are 0.3 and 0.5, respectively
The calculation is carried out with the Hamon method (Hamon, 1961), by deriving total PET from the sum of the monthly PET values and then using the following equations:
where For headwater NHDFlowline features, QIncrBMA=QBMA.EROM Step T3—Reference Gage Regression Flow Adjustment
A log-log regression step using reference gages provides a further adjustment to the flow estimates. This regression improves the mean annual flow estimates that are intended to represent less anthropomorphically altered conditions. Through log-log regression analysis, the measured flow at the reference gages is evaluated compared with flow estimates from step T2. Based on the regression predictions, step T3 uses the results of the analysis to adjust the step T2 flows.
The regression step has been found to improve EROM flow estimates in some areas of the country based on VPUs, whereas in other areas, it has a marginal effect. To review the effects the regression step has on improving EROM flow estimates, refer to the EROMQAMARpt table.
The reference gage regression applies a regression-based adjustment to the QBMA flow, which is then referred to as QCMA. The regression is determined as follows:
-
• The reference gages are screened based on two criteria: (1) The NHDPlus HR drainage area for the gage must be within, plus or minus (±), a certain percentage (always within 25 percent, usually less than 5 percent) of the NWIS-reported drainage area. (2) The gage must have a required minimum number of 10 years or 120 months of complete record from 1971 to 2000 (or 1990 to 2019 for the data released in 2022). The criteria used for each VPU are listed in the EROMQAMARpt table.
-
• The screened reference gages are used to develop a log-log regression that compares the gage flow to the QBMA flow. The regression is of the form:
The regression uses the following variables and equations:
whereY
is the log-transformed value of the Falcone reference gage mean annual flow,
X
is the log-transformed value of the EROM QB mean annual flow,
i
is the gage being used, from 1 to n,
N
is the number of reference gages being used (summations are for all N reference gages),
Q_Fi
is the streamflow (Q) for the Falcone reference gage i adjusted to the bottom of the stream segment, and
QBMAi
is the QBMA flow for the NHDFlowline feature containing gage i.
To illustrate the process, the simplified features in figure 36 are used in this discussion. The calculations are carried out for NHDFlowline features 1 and 2 and all networked features above 1 and 2 (not shown on fig. 36). Also, all flows are ≥0; no negative flows are allowed. Incremental flows may be negative.
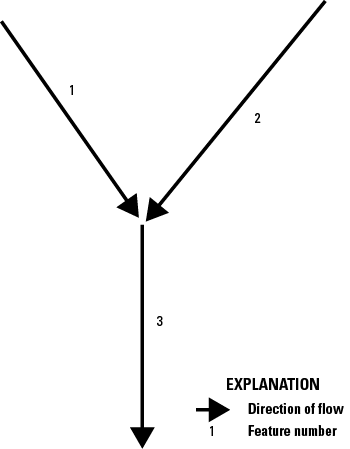
Schematic diagram showing a simplified junction with network features numbered 1, 2, and 3 in the National Hydrography Dataset Plus High Resolution (NHDPlus HR). The calculations are carried out for NHDFlowline features 1 and 2 and all networked features above 1 and 2 (not shown). Also, all flows are ≥0; no negative flows are allowed. Incremental flows may be negative.
QCMAn
is the flow on NHDFlowline feature n with the reference gage equation applied,
n
is the number of the feature; in figure 36, which in our example is feature 1, 2, and 3,
QBMAn
is the flow on NHDFlowline feature n from step T2 “Excess Evapotranspiration Adjustment” of the EROM processing,
QIncrCMAn
is the incremental flow on NHDFlowline feature, and
Divfracn
is the fraction of the upstream flow that would be routed to NHDFlowline feature n if feature n were part of a divergence (ignored or set to 1 in this example).
EROM Step T4—Human-Made Addition and Removal Adjustments
Human-made additions, removals, and transfers are found in the NHDPlusAdditionRemoval table; flow removals, additions, and transfers include irrigation and drinking water withdrawals, karst area flows, and losses or gains from groundwater from outside of the catchment. This table was envisioned to be built over time, based largely on user/developer input; however, to date (2023) the table has not been populated and this EROM step results in no change to the EROM flow estimates.
During step T4, these additions and removals are applied to step T3 flows. This table can hold, for instance, values of flow transfers from the Colorado River to other basins or locales (for example, Phoenix, Arizona, or California), flows withdrawn for irrigation, and irrigation return flows. As the EROM process steps route down the NHDFlowline network, flows are added and removed based on the addition and removal points and quantities in the NHDPlusAdditionRemoval table. The QIncrCMAn values are modified and saved as QIncrDMAn.
Situations arise where the total available flow is less than the flow that is to be transferred from a given NHDFlowline feature. In this case, all QDMA flow will be transferred or withdrawn, resulting in a 0 (zero) flow at that NHDFlowline feature.
The cumulative and incremental flows after the NHDPlusAdditionRemoval adjustments are referred to as QDMA and QIncrDMA, respectively. QDMA and QIncrDMA are computed as follows:
EROM Step T5—Gage-Based Flow Adjustment
In step T5, NHDPlus HR network features that are upstream from the gages are adjusted for gage-based flow. Step T5 is a way to provide much better flow estimates upstream from gages, and adjust flow estimates downstream from gages, to better reflect flow alterations not taken into account in the first four steps. The processing in step T5 adjusts streamflow estimates based on observed gaging station data. Only gaging stations linked to the NHDPlus HR network are used to adjust flows. The adjustment process includes the following steps:
-
1. Only gages where the drainage area of the NHDPlus HR gage is within ±20 percent of the drainage area of the NWIS-reported gage are used for gage adjustment. The drainage-area comparison removes gages that are incorrectly located on the minor path of a divergence or on a tributary rather than on a main stem (fig. 37; the two gage points along the x-axis of the graph are gages that would be removed in this process). The gage flows are computed from 1971 to 2000, or 1990 to 2019 for data released in 2022, and the record must include at least 10 complete years (for mean annual) of flow data in this period for the gage to be used in gage adjustment.
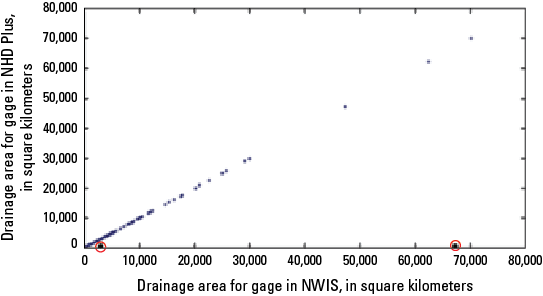
Figure 37. Graph showing a comparison of drainage areas for gages in the National Hydrography Dataset Plus High-Resolution (NHDPlus HR) and the National Water Information System (NWIS) to illustrate gage-mismatch exclusion for gage-flow adjustment in the NHDPlus HR. Data points past the 0.0 point on the x-axis represent gages that would be excluded from the gage-flow adjustment process. The drainage-area comparison removes gages that are incorrectly located on the minor path of a divergence or on a tributary rather than on a main stem; the two gage points along the x-axis of the graph (circled in red) are gages that would be removed in this process.
-
2. The gage flows and drainage areas are adjusted to reflect values at the downstream end of the NHDFlowline feature. Drainage area is adjusted by adding the catchment area downstream from (below) the gage to the gage drainage area. The gage flow is adjusted by taking the catchment unit runoff from step T1 (in [ft3/s]/km2) and adding that incremental flow based on the part of the catchment area that is below the gage.
-
3. Incremental flows are adjusted as follows:
-
a. For upstream gages (no other gages upstream):
-
i. The adjustment is apportioned in the incremental streamflows (QDMA) so that the NHDFlowline features that are closer to the gage receive more of the adjustments than NHDFlowline features farther away from the gage. The adjustment is apportioned based on the ratio of the drainage area of an NHDFlowline feature to the drainage area of the gage.
-
ii. Streamflow adjustment is made only where the cumulative drainage area of the NHDFlowline feature is ≥50 percent of the NHDPlus HR gage drainage area.
-
iii. A “flow balance” will usually be maintained so that the incremental flows from step T5 can be summed to get the step T5 streamflows.
-
-
b. For a gage that is downstream from another gage on the same main stem:
-
i. Main stems can be identified by the values of the LevelPathI field in NHDPlus HR (see NHDPlusFlowlineVAA.LevelPathI).
-
ii. The adjustments are apportioned to incremental flow so that the NHDFlowline features that are closest to the gage receive more of the adjustments than NHDFlowline features farther away from gage.
-
iii. The flows will be adjusted for all NHDFlowline features between the two gages regardless of the gage drainage ratios.
-
-
-
4. Gage-adjusted flows upstream from gages are routed downstream of the gages so that the gage adjustments will affect NHDFlowline features downstream from gages. This helps to improve flow estimates on all NHDFlowline features downstream from gages.
-
5. The gage flow adjustments are computed as follows:
-
a. Where there is no gage upstream:
-
i. The change in flow (ΔQ) necessary for the step T4 flow and the gage flow (Qgage) to match is calculated as follows:
-
ii. The NHDFlowline features to which ΔQ must be apportioned are found by navigating upstream from the gage and flagging all NHDFlowline features with a cumulative drainage area ≥0.5 times the gage drainage area. The cumulative drainage area for each NHDFlowline feature is referred to as “CumDA.”
-
iii. The sum of the cumulative drainage areas for the NHDFlowline features to be adjusted is computed. This will be referred to as “CumCumDA.”
-
iv. The incremental flow adjustment ΔIncQ for each of the NHDFlowline features from equation 2 is calculated as follows:
and
-
v. All the NHDFlowline features that are adjusted are flagged so that no further flow adjustments can be made to them.
-
-
b. Where the gage is downstream from another gage on the same LevelPathI:
-
i. The revised flow at the upstream gage(s) is routed and accumulated from the upstream gage down to this gage. The accumulation is based on the QIncrDMA values on the NHDFlowline features between the gages. At this gage, the ΔQ (eq. 24) is based on the downstream gage values.
-
ii. The NHDFlowline features are navigated from this gage to the next upstream gage(s). This routing includes all NHDFlowline features between the two gages as well as any tributary NHDFlowline features that have not already been flagged as being adjusted and tributary NHDFlowline features where the cumulative drainage area is ≥0.5 times the downstream gage drainage area.
-
iii. The drainage area criterion is not used for NHDFlowline features on the same LevelPathI between the gages. This ensures there are no “gaps” in the gage flow adjustments between gages on the same main stem, which is defined by the LevelPathI.
-
iv. The flow adjustment method described in equations 25 and 26 is used, where CumCumDA is the cumulative drainage area for all NHDFlowline features being adjusted. These adjustments include all NHDFlowline features between the gages on the LevelPathI and any tributary NHDFlowline features where the drainage area of the feature is ≥0.5 times the downstream gage drainage area.
-
v. Large rivers will have adjustments on most of NHDFlowline features, with adjustments usually occurring on large tributaries.
-
vi. Where there are no gages downstream on the LevelPathI, flows are accumulated to the bottom of the LevelPathI using the QIncrEMA values on the main stem and tributaries.
-
-
EROM Step T6—Gage Sequestration Computations
Because step T5 uses all gages, the flow estimates at the gages will always match the gaged flow values. This means that any statistical analyses on the step T5 flows compared with gage flows will always be a perfect match. Step T6 is designed to provide a measure of the accuracy of gage adjustment flow estimates on ungaged NHDFlowline features. The first step is to sequester (remove) a random set of gages, typically 20 percent, and repeat the gage adjustment process using the unsequestered gages (the remaining 80 percent). The EROM QEMA streamflow values are then used to compute the streamflow statistics for the sequestered gages (the 20 percent not used for gage adjustment).
This gage sequestration step is performed once, so the results are a snapshot of potential benefits of the gage adjustment step. The gage sequestration can also be performed multiple times, each time sequestering a different random set of gages. Averaging the streamflow results over these multiple runs would be a refinement of this streamflow estimation process.
Summary of Processing Steps Used for EROM Flow Estimation, Flow QAQC
-
1. and 2. Taken together, steps T1 and T2 are designed to provide the best consideration of the water-balance components that are currently available on a national scale.
-
3. In step T3, the reference gage regression adjustment takes into account factors not incorporated in the water balance, such as broad regional-scale groundwater effects.
-
4. In step T4, the NHDPlusAdditionRemoval adjustment has great potential to take water-use factors into account, including groundwater, drinking water withdrawals, sewerage discharges, and irrigation.
-
5. In step T5, gage adjustment takes into account other factors not covered in the first four steps, such as consumptive use from dammed reservoirs and flow augmentations not accounted for the NHDPlusAdditionRemoval tables.
-
6. In step T6, the accuracy of gage flow adjustments from step T5 is evaluated.
EROM Incremental Flows
EROM provides estimated flows and incremental flows for each networked flowline. The flow is equal to the sum of the incremental flows upstream from each NHDFlowline and on the flowline.
EROM Flow Estimation QAQC
The EROM QAQC step produces two outputs: (1) a tabular EROMQARpt (fig. 38) report, and (2) the EROMQAMA table. The EROMQARpt report contains comparisons of the EROM flow estimates and the observed gage flows. Two statistics are used for measuring how well the different flow estimates performed in relation to the gage flows:
-
1. The log10 mean flow at the gage as compared to the log10 of the EROM mean flow estimate.
-
2. The standard error of the estimate (SEE) in percent; two-thirds of the flow estimates will be within 1 SEE.
-
1. Table 1 reports statistics for all gages for flow values generated by the EROM steps A, B, C, and D (described in the first part of the “Step T—Enhanced Runoff Method (EROM) Streamflow Estimation, QAQC, and Jobson Velocity Estimation” section of this report).
-
2. Table 2 reports the statistics for only the sequestered gages.
-
3. Table 3 reports the statistics for only the reference gages.
-
4. Table 4 lists the statistics used in the reference gage regression step (flow value QCMA); these values are the log-log regression coefficients, the coefficient of determination (R2), and the standard error of the regression.
The best EROM flow and velocity estimates are the gage-adjusted values, QEMA. For natural flows, the best estimates are the reference gage regression values, QCMA.
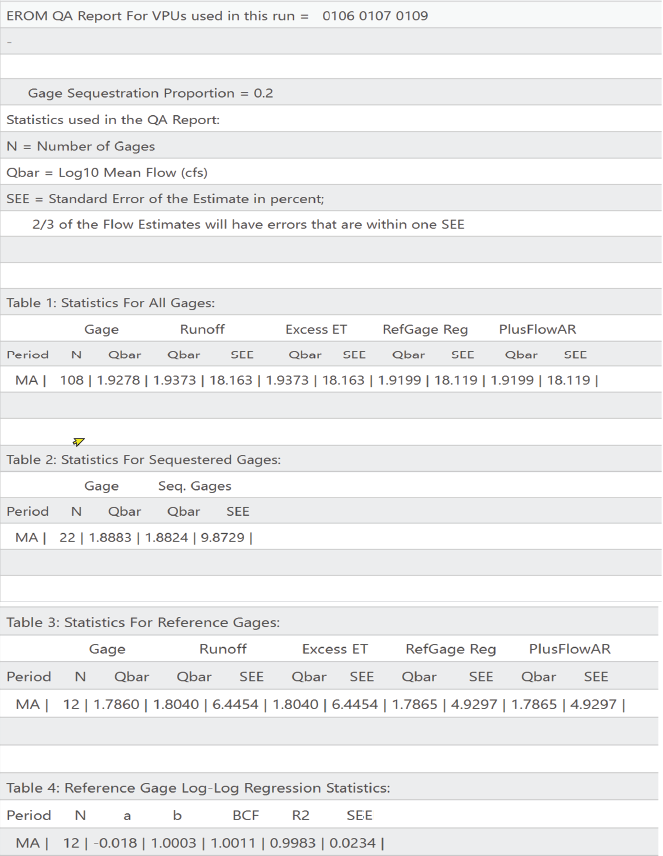
Example of a tabular EROMQARpt report distributed with the National Hydrography Dataset Plus High Resolution. The report contains comparisons of the Enhanced Runoff Method (EROM) flow estimates and the observed streamgage flows. For table 1, within the figure, the abbreviation MA means that the statistics are for the mean annual flow estimates; N is the number of gages within the selected group of vector-processing units (VPUs); the field “Qbar”, listed under the heading of “Gage” is the log base-10 of the gaged mean annual flow (with flow in cubic feet per second [cfs]) at all gaged reaches; “Qbar,” listed under the heading of “Runoff” is the log base-10 of the estimated mean annual flow for the same reaches after EROM step T1 (flows estimated from runoff estimates), and the accompanying SSE is the standard estimate of the error, in percent. Similar pairs of fields follow, after each step in the process: EROM Step T2, excess evapotranspiration (ET); Step T3, reference gage adjustment; and Step T4, PlusFlowAR (additions and removals) streamflow adjustments. Table 2 provides a comparison of gage flows and sequestered flows for a sequestered dataset, but with same statistics with the comparison made only after EROM Step T5, with the sequestered gaged reaches excluded from Step T5. Table 3 provides the same set of statistics as table 1, but only for a set of reference gaged reaches representing what is assumed to representative of streams and rivers with “natural,” less modified conditions. Table 4 provides the statistics used in the reference gage regression step. BCF is the bias correction factor, and a and b are regression coefficients.
Figure 39 shows a graph of gage flows versus EROM flows with gage flows on the x-axis and EROM flow estimates for runoff and the reference gage regression on the y-axis. (These data come from the NHDPlusEROMQAMA table.) The graph is in log-log coordinates to best show the range of flows. The blue dots are the runoff flow estimates, and the magenta dots are the flows adjusted with the reference gage regression. The red line is where the gage and EROM flows would be equal. Note how the runoff estimates consistently underestimate the (true) gage flows. The reference gage regression shifts the flows up to better match the gage flows.
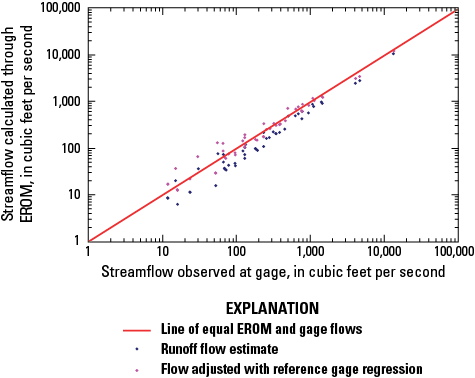
Plot showing an example of flow comparisons estimated by the Enhanced Runoff Method (EROM) in the National Hydrography Dataset Plus High-Resolution (NHDPlus HR) and flow data collected at streamgages. Gage flows are on the x-axis and EROM flow estimates for runoff and the reference gage regression on the y-axis. These data come from the NHDPlusEROMQAMA table. Note how the runoff estimates consistently underestimate the (true) gage flows. The reference gage regression shifts the flows upwards to better match the gage flows.
Velocity Computation
Velocities are estimated for EROM mean annual flow using the work of Jobson (1996). This method uses regression analyses on hydraulic variables from more than 980 time-of-travel studies, which represent about 90 different rivers in the United States. These rivers represent a range of sizes, slopes, and channel geometries. Four principal variables are used in the Jobson method: (1) drainage area, (2) flowline slope, (3) flow for which velocity is calculated, and (4) mean annual flow. Since we are calculating the velocity for mean annual flow, the two flow variables have the same value. Based on analyses using the Jobson method, regression equations were developed to relate velocity (in meters per second) to drainage area, a dimensionless drainage area, slope, flow, and a dimensionless relative flow.
The slope smoothing process does not permit 0 (zero) slopes on NHDFlowline features. If the elevation smoothing produces a 0 (zero) slope, the slope is set to a value of 0.00001. There are situations where the slope is set to “missing” (−9998), in which case the Jobson unknown slope method is used for the velocity calculation. For all NHDFlowline features with slope, velocities are calculated using the Jobson slope method.
The dimensionless relative discharge (; from Jobson, 1996) is expressed as follows:
where The dimensionless drainage area (from Jobson, 1996) is expressed as follows: whereDa
is the drainage area (in square meters [m2]),
g
is the acceleration of gravity (9.8 meters per second squared [m/s2]), and
Qa
is the mean annual flow (in m3/s).
Selected References
Arnold, D.E., 2014, The National Map hydrography data stewardship—What is it and why is it important?: U.S. Geological Survey Fact Sheet 2014–3084, 2 p., accessed July 9, 2024, at https://doi.org/10.3133/fs20143084.
Dewald, T., 2015, Making the digital water flow (rev. June 2017): U.S. Environmental Protection Agency, 8 p., accessed January 27, 2019, at https://www.epa.gov/waterdata/making-digital-water-flow.
Duan, N., 1983, Smearing estimate—A nonparametric retransformation method: Journal of the American Statistical Association, v. 78, no. 383, p. 605–610. [Also available at https://doi.org/10.1080/01621459.1983.10478017.]
Falcone, J.A., Carlisle, D.M., Wolock, D.M., and Meador, M.R., 2010, GAGES—A stream gage database for evaluating natural and altered flow conditions in the conterminous United States: Ecology, v. 91, no. 2, p. 621. [Also available at https://doi.org/10.1890/09-0889.1.]
Fontaine, R.A., Wong, M.F., and Matsuoka, I., 1992, Estimation of median streamflows at perennial stream sites in Hawaii: U.S. Geological Survey Water-Resources Investigations Report 92–4099, 37 p. [Also available at https://doi.org/10.3133/wri924099.]
Hamon, W.R., 1961, Estimating potential evapotranspiration: Journal of the Hydraulics Division, v. 87, no. 3, p. 107–120. [Also available at https://doi.org/10.1061/JYCEAJ.0000599.]
Hellweger, F., and Maidment, D., 1997, AGREE–DEM surface reconditioning system: University of Texas database, accessed June 12, 2022, at https://www.ce.utexas.edu/prof/maidment/gishydro/ferdi/research/agree/agree.html.
Horizon Systems Corp, [undated]a, NHDPlus version 1 (archive): Horizon Systems Corp. NHDPlus website, accessed October 12, 2018, at http://www.horizon-systems.com/NHDPlus/NHDPlusV1_home.php. [Now (2024) available at https://www.epa.gov/waterdata/nhdplusv1-documentation.]
Horizon Systems Corp, [undated]b, NHDPlusV2 documentation: Horizon Systems Corp. NHDPlus website, accessed October 12, 2018, at http://www.horizon-systems.com/NHDPlus/NHDPlusV2_documentation.php. [Now (2024) available at https://www.epa.gov/waterdata/learn-more.]
Horton, R.E., 1945, Erosional development of streams and their drainage basins—Hydrophysical approach to quantitative morphology: Geological Society of America Bulletin, v. 56, no. 3, p. 275–370, accessed July 9, 2024, at https://doi.org/10.1130/0016-7606(1945)56[275:EDOSAT]2.0.CO;2.
Instituto Nacional de Estadística y Geografía, [undated], Red Hidrográfica escala 1:50,000 edición 2.0: Instituto Nacional de Estadística y Geografía natural resources database, accessed 2018 at https://www.inegi.org.mx/geo/contenidos/recnat/hidrologia/regiones_hidrograficas.aspx [Now (2024) available at http://geoportal.conabio.gob.mx/metadatos/doc/html/redsub84gw.html].
Jobson, H.E., 1996, Prediction of travel time and longitudinal dispersion in rivers and streams: U.S. Geological Survey Water‐Resources Investigations Report 96–4013, 69 p. [Also available at https://doi.org/10.3133/wri964013.]
McCabe, G.J., and Wolock, D.M., 2011, Independent effects of temperature and precipitation on modeled runoff in the conterminous United States: Water Resources Research, v. 47, no. 11, article W11522, 11 p., accessed 2018 at https://doi.org/10.1029/2011WR010630.
McKenney, D.W., Papadopol, P., Campbell, K.L., Lawrence, K.M., and Hutchinson, M.F., 2006, Spatial models of Canada- and North America-wide 1971/2000 minimum and maximum temperature, total precipitation and derived bioclimatic variables: Natural Resources Canada Frontline Technical Notes no. 106, 9 p. [Also available at https://d1ied5g1xfgpx8.cloudfront.net/pdfs/26775.pdf.]
Moore, R.B., and Dewald, T.G., 2016, The road to NHDPlus—Advancements in digital stream networks and associated catchments: Journal of the American Water Resources Association, v. 52, no. 4, p. 890–900, accessed February 11, 2016, at https://doi.org/10.1111/1752-1688.12389.
Moore, R.B., Johnston, C.M., Robinson, K.W., and Deacon, J.R., 2004, Estimation of total nitrogen and phosphorus in New England streams using spatially referenced regression models: U.S. Geological Survey Scientific Investigations Report 2004–5012, 42 p. [Also available at https://doi.org/10.3133/sir20045012.]
Moore, R.B., McKay, L.D., Rea, A.H., Bondelid, T.R., Price, C.V., Dewald, T.G., and Johnston, C.M., 2019, User’s guide for the national hydrography dataset plus (NHDPlus) high resolution: U.S. Geological Survey Open-File Report 2019–1096, 66 p., accessed December 6, 2019, at https://doi.org/10.3133/ofr20191096.
Natural Resources Canada, 2008, Hydrology—Drainage areas (version 6.0): Natural Resource Canada Atlas of Canada 1,000,000 National Frameworks Data, accessed 2022 at https://lwbin-datahub.ad.umanitoba.ca/dataset/atlca-funddra.
Natural Resources Canada, 2016, Canadian digital elevation data: Natural Resources Canada GeoBase Series web page, accessed March 23, 2016, at http://www.geobase.ca/geobase/en/data/cded/description.html. [Database has been moved at time of publication; a digital elevation model that uses these data is available at https://open.canada.ca/data/en/dataset/7f245e4d-76c2-4caa-951a-45d1d2051333.]
Natural Resources Canada, 2017, National hydro network: Natural Resources Canada GeoBase Series web page, accessed August 16, 2017, at http://www.geobase.ca/geobase/en/data/nhn/description.html. [Database has been moved at time of publication to https://open.canada.ca/data/en/dataset/a4b190fe-e090-4e6d-881e-b87956c07977.]
North Pacific Landscape Conservation Cooperative [LCC] Data Coordinator, 2014, Canadian national hydro network (NHN)—GeoBase web mapping service (WMS): The North Pacific Landscape Conservation Cooperative, Data Basin dataset, accessed October 18, 2018, at https://databasin.org/datasets/dda81e7c146049259097c1e7aade60ba.
Open Geospatial Consortium, [2018], GeoPackage: Open Geospatial Consortium web page, accessed 2025 at https://www.geopackage.org/.
Parameter-Elevation Regression on Independent Slopes Model Climate Group [PRISM Climate Group], 2006, PRISM climate data: PRISM Climate Group database, accessed 2006 at http://www.prismclimate.org. [Website has been updated and moved at time of publication to https://prism.oregonstate.edu/.]
Saunders, W., 2000, Preparation of DEMs for use in environmental modeling analysis, in Maidment, D., and Djokic, D., eds., Hydrologic and hydraulic modeling support with geographic information systems: Redlands, Calif., Environmental Systems Research Institute [Esri], Inc., p. 29–51. [Also available at https://proceedings.esri.com/library/userconf/proc99/proceed/papers/pap802/p802.htm.]
Strahler, A.N., 1957, Quantitative analysis of watershed geomorphology: Eos, Transactions, v. 38, no. 6, p. 913–920. [Also available at https://doi.org/10.1029/TR038i006p00913.]
Thornton, M.M., Thornton, P.E., Wei, Y., Mayer, B.W., Cook, R.B., and Vose, R.S., 2016, Daymet—Monthly climate summaries on a 1-km grid for North America, Version 3: Oak Ridge, Tenn., National Aeronautics and Space Administration, Oak Ridge National Laboratory Distributed Active Archive Center, accessed 2020 at https://doi.org/10.3334/ORNLDAAC/1345.
U.S. Environmental Protection Agency [EPA], [2014], NHDPlus (National hydrography plus dataset): U.S. Environmental Protection Agency and U.S. Geological Survey database, accessed June 18, 2018, at https://www.epa.gov/waterdata/nhdplus-national-hydrography-dataset-plus.
U.S. Geological Survey [USGS], 2018a, NHDPlus high resolution: U.S. Geological Survey The National Map website, accessed October 12, 2018, at https://nhd.usgs.gov/NHDPlus_HR.html. [Website has been moved at time of publication to https://www.usgs.gov/national-hydrography/nhdplus-high-resolution.]
U.S. Geological Survey [USGS], 2018b, Watershed boundary dataset (WBD): U.S. Geological Survey National Hydrography website, accessed October 12, 2018, at https://www.usgs.gov/national-hydrography/watershed-boundary-dataset.
U.S. Geological Survey [USGS], 2019a, 3D elevation program: U.S. Geological Survey website, accessed September 20, 2019, at https://www.usgs.gov/3d-elevation-program.
U.S. Geological Survey [USGS], 2019b, National hydrography: U.S. Geological Survey website, accessed September 20, 2019, at https://www.usgs.gov/core-science-systems/ngp/national-hydrography.
U.S. Geological Survey [USGS], 2022a, National Hydrography Dataset Plus High Resolution Data Model v.2.1: U.S. Geological Survey, National Geospatial Program (NGP) Standards and Specifications poster, accessed January 14, 2022, at https://www.usgs.gov/media/files/national-hydrography-dataset-plus-high-resolution-data-model-v21.
U.S. Geological Survey [USGS], 2022b, USGS National hydrography dataset plus high resolution national release 1 FileGDB: U.S. Geological Survey data release, accessed July 7, 2022, at https://doi.org/10.5066/P9WFOBQI.
U.S. Geological Survey [USGS], 2023a, National Hydrography Dataset (NHD) Data Model (v2.3.1): U.S. Geological Survey poster, 3 sheets, accessed February 14, 2025, at https://www.usgs.gov/media/files/national-hydrography-dataset-nhd-data-model-v231.
U.S. Geological Survey [USGS], 2023b, National Hydrography Dataset Plus High Resolution (NHDPlus HR) National Data Model v2.01 poster: U.S. Geological Survey poster, 1 sheet, accessed February 14, 2025, at https://www.usgs.gov/media/files/national-hydrography-dataset-plus-high-resolution-nhdplus-hr-national-data-model-v201.
U.S. Geological Survey [USGS], 2023c, National Hydrography Dataset Plus High Resolution (NHDPlus HR) Vector Processing Unit (VPU) Distribution Data Model v2.0: U.S. Geological Survey poster, 1 sheet, accessed February 14, 2025, at https://www.usgs.gov/media/files/national-hydrography-dataset-plus-high-resolution-nhdplus-hr-vector-processing-unit-vpu.
U.S. Geological Survey [USGS], 2023d, Watershed Boundary Dataset (WBD) Data Model (v2.3.1) poster: U.S. Geological Survey poster, 1 sheet, accessed February 14, 2025, at https://www.usgs.gov/media/files/watershed-boundary-dataset-wbd-data-model-v231-poster.
U.S. Geological Survey [USGS], [undated]a, National hydrography dataset: U.S. Geological Survey website, accessed September 20, 2019, at https://www.usgs.gov/national-hydrography/national-hydrography-dataset.
U.S. Geological Survey [USGS], [undated]b, National Hydrography Dataset (NHD) data dictionary feature domains: U.S. Geological Survey web page, accessed February 14, 2025, at https://www.usgs.gov/ngp-standards-and-specifications/national-hydrography-dataset-nhd-data-dictionary-feature-domains.
U.S. Geological Survey [USGS], [undated]c, Watershed Boundary Dataset (WBD) data dictionary: U.S. Geological Survey web page, accessed February 14, 2025, at https://www.usgs.gov/ngp-standards-and-specifications/watershed-boundary-dataset-wbd-data-dictionary.
Viger, R.J., Rea, A., Simley, J.D., and Hanson, K.M., 2016, NHDPlusHR—A national geospatial framework for surface-water information: Journal of the American Water Resources Association, v. 52, no. 4, p. 901–905, accessed May 20, 2016, at https://doi.org/10.1111/1752-1688.12429.
Glossary
- 3D Elevation Program (3DEP)
A U.S. Geological Survey (USGS) program that provides nationwide elevation coverage of the United States, through The National Map at various resolutions; see also digital elevation model (DEM).
- artificial path
A National Hydrography Dataset (NHD) flowline feature type that represents a flow path through a waterbody in the surface water network of the NHD.
- burn line
A line used to carry out hydroenforcement of the DEM during step L of the National Hydrography Dataset Plus High Resolution (NHDPlus HR) production process. Burn lines are stored in the NHDPlusBurnlineEvent feature class if they are NHDFlowline features within the vector-processing unit (VPU) or in NHDPlusBurnAddLine if they are additional lines that are not NHDFlowline features within the VPU.
- catchment
The land surface area that flows directly to a National Hydrography Dataset Plus (NHDPlus) or NHDPlus HR feature. For most networked surface-water linear features, the catchment represents the incremental area that drains directly to each feature or flowline. Exceptions include coastline features, where the catchments represent the total drainage area to each individual coastline segment. For off-network sink features, the catchment represents the total drainage area to the sink because there are no upstream features. Similarly, because there are no upstream features, the catchments for headwater linear features represent the total drainage area as well as the incremental drainage area.
- cumulative drainage area
The total upstream or upslope area that flows to an NHDPlus feature. For surface water network linear features, this is the catchment area for a specific flowline combined with the catchment areas for all upstream flowlines.
- closed basin
A watershed or basin where there are no surface water outlets.
- digital elevation model (DEM)
A raster dataset representing elevation.
- divergence-routed accumulation
A method of accumulating attributes downstream along the surface-water network features where the attribute is divided into parts at each flow split in the network and where the total of the parts equals 100 percent.
- drainage-area divide
The boundary line between two different drainage areas (or watersheds) along a topographic ridge or divide.
- flow table
See NHDPlusFlow table.
- flow-path displacement
The horizontal positional offset between a mapped stream in the NHD and that of a synthetic stream derived from a DEM.
- flowline
A mapped stream segment or a path through a waterbody in the NHD; this is the basic unit of the NHD and NHDPlus linear surface-water network and is uniquely identified by an NHDPlusID.
- hydroenforcement
A process of altering a DEM to force alignment with streams, waterbodies, sinks, and watershed divides for the creation of a flow-direction raster.
- hydrologic unit
A standardized classification system for streams and rivers in the United States developed by the USGS. Hydrologic units are watershed areas organized in a nested hierarchy by size. The largest subdivisions are assigned a 2-digit code from 01 through 22. Four-digit codes are assigned to subdivisions of the 2-digit code areas; 6-digit codes, to the 4-digit code areas; and so on into 8, 10, and 12-digit code areas (see Watershed Boundary Dataset).
- National Elevation Dataset (NED)
A seamless mosaic of best-available elevation data at various resolutions for the conterminous United States, Hawaii, Alaska, and the island territories; see also 3D Elevation Program and DEM.
- National Hydrography Dataset (NHD)
A comprehensive set of digital spatial data that represent the surface waters of the United States using common features such as lakes, ponds, streams, rivers, canals, and oceans.
- National Water Information System
A principal USGS repository of national water resources data.
- NHD reach
A uniquely identified linear feature that consists of one or more flowlines; see also reach.
- NHDPlus
An integrated suite of application-ready geospatial datasets that incorporate many of the best features of the NHD, the 3DEP, and the Watershed Boundary Dataset (WBD). NHDPlus is currently [2023] distributed at medium (NHDPlus version 2) and high (NHDPlus HR) resolutions.
- NHDPlusFlow table
A database table that contains the interconnections between flowlines in the NHD.
- raster
A matrix of cells organized into rows and columns, where each cell contains a value such as land surface elevation, mean annual temperature, or mean annual precipitation. In geographic information system (GIS) applications the cells represent mapped locations on the earth surface.
- reach
A uniquely identified linear feature that consists of one or more flowlines; see also NHD reach.
- ReachCode
A unique, permanent identifier in the NHD associated with an NHD reach.
- Spatially Referenced Regression on Watershed Attributes (SPARROW)
A modeling tool for the regional interpretation of water-quality monitoring data. The model relates in-stream water-quality measurements to spatially referenced characteristics of watersheds, including contaminant sources and factors influencing terrestrial and aquatic transport. SPARROW empirically estimates the origin and fate of contaminants in river networks and quantifies uncertainties in model predictions.
- stream burning
A process of overlaying a mapped stream network onto a DEM and creating “trenches” where the stream network exists. Stream burning improves how accurately the resulting DEM flow paths match the streams to ensure DEM-derived catchment boundaries fit the stream network.
- stream segment
Part of a stream, often extending between tributary confluences; see also flowline.
- streamflow
The volume of water flowing past a fixed point in a fixed unit of time.
- Total Upstream Accumulation
A method of accumulating attributes downstream along the surface water network features where the accumulated value at any NHDFlowline feature is the total amount of the attribute that is upstream of the network feature.
- walling
Using a representation of the known drainage boundaries to build up or mathematically modify a DEM to more accurately represent the locations of the known drainage boundaries. First developed for the New England SPARROW model.
- Watershed Boundary Dataset (WBD)
A baseline hydrologic drainage boundary framework that accounts for all land and surface areas in the United States. Watersheds are organized by hydrologic unit; see also hydrologic unit.
Conversion Factors
U.S. customary units to International System of Units
International System of Units to U.S. customary units
Temperature in degrees Celsius (°C) may be converted to degrees Fahrenheit (°F) as follows: °F = (1.8 × °C) + 32.
Datums
Vertical coordinate information is referenced to the North American Vertical Datum of 1988 (NAVD 88).
Horizontal coordinate information is referenced to the North American Datum of 1983 (NAD 83).
Elevation, as used in this report, refers to distance above the vertical datum.
Abbreviations
3DEP
3D Elevation Program
AET
actual evapotranspiration
DEM
digital elevation model
EPA
U.S. Environmental Protection Agency
EROM
Enhanced Runoff Method
ET
evapotranspiration
HU2
two-digit hydrologic unit
HU4
four-digit hydrologic unit
HU8
eight-digit hydrologic unit
HU12
12-digit hydrologic unit
NED
National Elevation Dataset
NGP
National Geospatial Program
NHD
National Hydrography Dataset
NHDPlus HR
National Hydrography Dataset Plus High Resolution
NWIS
National Water Information System
PET
potential evapotranspiration
PRISM
Parameter-Elevation Regressions on Independent Slopes Model
QAQC
quality assurance and quality control
RPU
raster-processing unit
SPARROW
Spatially Referenced Regression on Watershed Attributes
TIFF
tag image file format (extension .tif)
USGS
U.S. Geological Survey
VAA
value-added attributes
VPU
vector-processing unit
WBD
Watershed Boundary Dataset
For more information, contact
Director, National Geospatial Program
Core Science Systems
U.S. Geological Survey
12201 Sunrise Valley Drive, MS 511
Reston, VA 20192
Disclaimers
The database, identified as the National Hydrography Dataset Plus High Resolution, has been approved for release by the U.S. Geological Survey (USGS). Although this database has been subjected to rigorous review and is substantially complete, the USGS reserves the right to revise the data pursuant to further analysis and review. Furthermore, the database is released on condition that neither the USGS nor the U.S. Government shall be held liable for any damages resulting from its authorized or unauthorized use.
Any use of trade, firm, or product names is for descriptive purposes only and does not imply endorsement by the U.S. Government.
Although this information product, for the most part, is in the public domain, it also may contain copyrighted materials as noted in the text. Permission to reproduce copyrighted items must be secured from the copyright owner.
Suggested Citation
Moore, R.B., McKay, L.D., Rea, A.H., Bondelid, T.R., Price, C.V., Dewald, T.G., and Hayes, L., 2025, User’s guide for the National Hydrography Dataset Plus High Resolution (NHDPlus HR): U.S. Geological Survey Scientific Investigations Report 2025–5031, 78 p., https://doi.org/10.3133/sir20255031. [Supersedes USGS Open-File Report 2019–1096.]
ISSN: 2328-0328 (online)
| Publication type | Report |
|---|---|
| Publication Subtype | USGS Numbered Series |
| Title | User’s guide for the National Hydrography Dataset Plus High Resolution (NHDPlus HR) |
| Series title | Scientific Investigations Report |
| Series number | 2025-5031 |
| DOI | 10.3133/sir20255031 |
| Publication Date | September 30, 2025 |
| Year Published | 2025 |
| Language | English |
| Publisher | U.S. Geological Survey |
| Publisher location | Reston, VA |
| Contributing office(s) | National Geospatial Program, New England Water Science Center |
| Description | Report: xiii, 78 p.; 2 Data Releases; Project Site |
| Online Only (Y/N) | Y |
| Additional Online Files (Y/N) | N |