

Effects of Beaver Dams and Ponds on the Transport and Deposition of Suspended Sediment in Urban Streams of the Tualatin River Basin, Northwestern Oregon
Links
- Document: Report (5.9 MB pdf) , HTML , XML
- Larger Work: This publication is Chapter C of Beavers in the Tualatin River Basin, northwestern Oregon
- Data Releases:
- USGS data release - Computed and estimated streamflow in Bronson and Fanno Creeks, OR, 2016-2017
- USGS data release - Elevation data to support estimations of stored sediment depths and volume in a beaver pond along Fanno Creek, western Oregon, 2016
- USGS data release - Hydraulic models of two beaver affected reaches in the Tualatin Basin, Oregon
- Download citation as: RIS | Dublin Core
Acknowledgments
The authors thank Carol Murdock, Rajeev Kapur, Bob Baumgartner (retired), Kenneth Williamson, Matthew Brennan, Anil Devnani, John Goetz, and Anne MacDonald of Clean Water Services for their assistance and insights. The authors are thankful for the assistance of several people and organizations. James White, Erin Leahy, and Stewart Rounds (retired) (part of the U.S. Geological Survey [USGS] beaver team) provided useful discussions and support for the data collection and analyses. Field assistance was provided by USGS employees, including Mackenzie Keith, Erin Leahy, Laurel Stratton Garvin, David Weathers, Norman Buccola, Matthew Smith, Sean Payne, Whitney Hapke, Chris Galvin, Matthew Yates, Ann McGowan, and Gabriel Gordon. USGS employees Scott Deweese, Greg Lind, Adam Stonewall, and Marc Stewart helped develop the water level-streamflow rating curves.
Preface
This is the third of four reports in a multichapter volume assessing the capacity of the stream network to support beaver dams and evaluating the effects of beaver dams and ponds on urban streams. These reports document the data collection from 2016–17 and the findings of these studies, which were done in partnership with Clean Water Services. Chapter A (White and others, 2025a) documents the locations of beaver dams in the Tualatin River Basin and how many beaver dams the stream network could support with existing and improved riparian vegetation. Beaver dam capacity was estimated by modifying existing tools to account for the low gradient of many streams in the Tualatin River Basin. Chapter B (White and others, 2025b) describes the effects of beaver dams and ponds on hydrologic and hydraulic responses of storm flows. Hydrologic and hydraulic responses for two urban stream reaches were compared with and without beaver dams and ponds and for a range of streamflow conditions using two-dimensional hydraulic models. Chapter C (this report) characterizes the effects of beaver dams and ponds on the transport and deposition of suspended sediment. Continuous turbidity, discrete suspended-sediment samples, and streamflow measurements collected during storms and base-flow periods were used to assess: (1) suspended-sediment loads upstream and downstream from two beaver-affected reaches, and (2) seasonal and longitudinal turbidity patterns. Chapter D (Smith and others, 2025) describes the effects of beaver dams and ponds on longitudinal, spatial, and seasonal water-quality patterns. Continuous and synoptic water-quality data were collected along urban stream reaches, and net ecosystem production was calculated for two beaver-affected reaches. The findings of these studies illustrate that the effects of beaver dams and ponds on hydrology, hydraulics, suspended-sediment transport and deposition, and water quality are dependent on the characteristics of a stream reach (for example, channel gradient, groundwater exchange, and riparian vegetation) and the characteristics of beaver dams and ponds along that reach. This information can be used to consider the implications of beaver-assisted restoration in the Tualatin River Basin and the effects of beaver dams and ponds in urban streams.
Significant Findings
This study investigated the effects of natural beaver dams and ponds on sediment transport and deposition in two urban beaver-affected reaches in the Tualatin River Basin, northwestern Oregon. Data were collected during 2016–17 from Fanno Creek at Greenway Park (between SW Hall Boulevard and SW Pearson Court) and Bronson Creek (between NW Laidlaw Road and NW Kaiser Road); each study reach contained multiple beaver dams. Continuous turbidity, discrete suspended-sediment samples, and streamflow measurements were collected during storms and baseflow periods to calculate suspended-sediment loads (SSLs) and to compare differences in SSLs upstream and downstream from the two beaver-affected reaches. Turbidity was measured continuously upstream, within, and downstream from these reaches to evaluate seasonal and longitudinal turbidity patterns and fluctuations. The volume and mass of sediment deposited in a large pond along the Fanno Creek study reach were also estimated. Study results include:
-
• Instantaneous SSLs at the upstream reach boundaries often were greater at Bronson Creek compared to Fanno Creek during storm events. These differences were likely caused by the greater mean basin slope upstream from the Bronson Creek reach and its proximity to the headwaters in the Tualatin Mountains.
-
• In contrast, the frequency of sediment transport events was greater at the upstream boundary of the Fanno Creek study reach than at the upstream boundary of the Bronson Creek study reach, likely because Fanno Creek has a larger upstream contributing area and more frequent streamflow runoff events typical of urban streams.
-
• During water year 2017, approximately 140 metric tons (t) of sediment (11 percent of the total incoming load) were deposited in the Fanno Creek study reach, and 1,420 t of sediment (89 percent of the total incoming load) were deposited in the Bronson Creek study reach.
-
• Longitudinal reductions in turbidity were observed in both study reaches but varied among the two reaches. Turbidity reductions along the Fanno Creek study reach were associated with sediment deposition and storage in the south pond, a large floodplain pond formed by a beaver dam. Turbidity decreased gradually along the Bronson Creek study reach, indicating that sediment was deposited between the upstream and downstream boundaries.
-
• Differences in decreases in SSLs and turbidity among the two study reaches were attributed to reach characteristics, such as beaver dam characteristics, stream-floodplain hydraulic connections, and the type and density of the vegetation.
-
• The eastern part of the south pond in the Fanno Creek study reach trapped approximately 1,100 cubic meters of sediment (estimated 250 t) from 2012 to 2016 (the period between when beaver dams were first built in the reach and when topographic surveys were collected for this study). This amount is equivalent to about one seventh of the mean annual SSL moving through Fanno Creek as estimated by a previous study at the downstream U.S. Geological Survey streamgage at Fanno Creek at Durham Road (14206950).
-
• Beaver dams and ponds in urban streams can reduce SSLs and trap sediment. Consideration of reach-specific factors influencing the effects of beaver dams on sediment transport could help create realistic expectations for restoration programs about this potential benefit associated with beaver activity.
Introduction
American beavers (Castor canadensis; hereafter referred to as “beavers”) build dams that create ponds in which they live, store vegetation for sustenance, and rear their young. Beaver dams cause ecological transformations that can be beneficial for many aquatic, riparian, and terrestrial species and assemblages (Bouwes and others, 2016). Beaver dams and their associated ponds can substantially affect the geomorphology, hydrology, water quality, and ecology of streams (Naiman and others, 1988; Pollock and others, 2018; Larsen and others, 2021). The dams are barriers that affect stream dynamics and alter fluvial processes. For example, ponds can hold water within the stream reach for longer periods, increasing baseflows and elevating water tables (Pollock and others, 2003; Puttock and others, 2017, 2020; Pilliod and others, 2018). Beaver dams and resulting ponds can alter stream channel morphology and form side channels and wetland areas (Nyssen and others, 2011; Wohl and others, 2021). Beaver dams also can affect the water quality of streams by reducing suspended sediment, altering water temperature, enhancing nutrient cycling, and storing sediment and contaminants (Gurnell, 1998; Pilliod and others, 2018; Pollock and others, 2018). The construction and failure of beaver dams result in a mosaic of terrestrial, riparian, and aquatic habitat types (such as ponds, collapsed ponds, marshes, and beaver meadows; Burchsted and others, 2010; Pollock and others, 2018).
Beaver dam building activity and associated ponds have many effects on stream hydraulics, such as (1) storing water during peak flows, (2) gradually releasing water during low-flow periods, (3) influencing wetland development, and (4) reducing stream velocity that can affect suspended-sediment (SS) transport, sediment-deposition, and the dynamics of riparian vegetation (Majerova and others, 2015; Puttock and others, 2017; Stout and others, 2017). As stream velocity decreases, the transport capacity of the stream can become insufficient to carry sediment particles in suspension, resulting in the deposition of fine sediment in the channel and in ponded areas upstream from beaver dams (Naiman and others, 1986; Butler and Malanson, 1995; Pollock and others, 2007). Sediment storage and sedimentation rates are affected by pond surface area (Naiman and others, 1986), upstream sediment sources, and water velocities capable of eroding and transporting sediment (Pollock and others, 2014).
Estimates of sediment volumes stored by beaver dams provide insights into the amount of sediment stored over some specific period, which for this study is from the start of dam construction to the date of field-data collection. This information can be combined with data on suspended-sediment loads (SSLs) to understand how beaver dams and ponds affect sediment trapping and transport dynamics along beaver-affected reaches. Previous studies have reported that beaver dams and ponds can trap relatively large amounts of sediment moving through streams, and that the amount of sediment stored by beaver dams and ponds can vary widely, depending on many factors and pond characteristics, such as pond surface area, the amount and size of woody debris, and the type and quality of organic material in the area (Naiman and others, 1986). For example, beaver dams stored 35–6,500 cubic meters (m3) of sediment on second- to fourth-order streams in Quebec, Canada (Naiman and others, 1986), and 11–5,000 m3 or more of sediment on lower order streams draining Glacier National Park, Montana (Butler and Malanson, 1995). Beaver dams reduced SSLs by more than 62 percent during spring runoff and 70 percent during baseflow in tributaries to the South Fork Snake River, Idaho (Allred, 1980). A series of 13 beaver dams along a 200-meter stream reach in England reduced SSLs by more than 65 percent (Puttock and others, 2017), with individual dams storing about 2–17 tons of sediment over approximately 5-years (Puttock and others, 2018). Silt loads decreased by 90 percent after beaver dams were built along Currant Creek in Wyoming (Brayton, 1984), and annual deposition rates of 14 centimeters (cm) per year have been estimated in beaver ponds in southeastern Poland (Giriat and others, 2016).
Many studies have focused on understanding the effects of beaver dams and ponds on sediment transport and deposition in rural, forested, and mountain streams (for example, Naiman and others, 1986; Butler and Malanson, 1995; Pollock and others, 2007). However, studies of the effects of beaver dams in urban streams are rare (Santora, 2017). Beaver dams and ponds in urban streams are expected to reduce local stream velocities, leading to the creation of in-channel or floodplain ponds and deposition of sediment. These changes associated with beaver dams may mitigate some of the common effects of urbanization on streams, such as elevated SSLs (Trimble, 1997; Nelson and Booth, 2002) and increased runoff ratios that lead to channel widening, channel incision, bank erosion, and reduced channel complexity (Booth, 1990; Booth and Jackson, 1997; Richards and others, 2010). Quantifying the effects of beaver dams and ponds on sediment deposition and transport along urban streams is important to understand the potential magnitude of their effects on fluvial geomorphic processes and to inform the management and restoration of urban streams.
This study was conducted by the U.S. Geological Survey (USGS) in cooperation with Clean Water Services, the primary wastewater treatment and stormwater management utility for the urban areas of Washington County, Oregon (fig. 1). Clean Water Services also restores and enhances riparian, wetland, and stream habitat in the Tualatin River Basin, Oregon. The goal of the study was to assess the effects of beaver dams and ponds on sediment transport and deposition in two urbanized beaver-affected reaches with multiple beaver dams (Fanno Creek at Greenway Park and Bronson Creek between NW Laidlaw and NW Kaiser Roads) in the Tualatin River Basin during 2016–17 (figs. 1–3). Related studies assessed current beaver-dam distributions and modeled beaver-dam capacity in the basin (White and others, 2025a), assessed the effects of beaver dams and ponds on water quality (Smith and others, 2025), and modeled peak-flow attenuation and other hydraulic effects because of beaver dams and ponds (White and others, 2025b). These studies were conducted because beavers are recolonizing streams throughout the Tualatin River Basin (Smith, 2017), and Clean Water Services is interested in understanding the quantitative and qualitative effects of beaver dams and ponds on stream hydraulics, sediment transport, and water quality to incorporate these effects in its riparian, stream, and wetland restoration and enhancement activities.
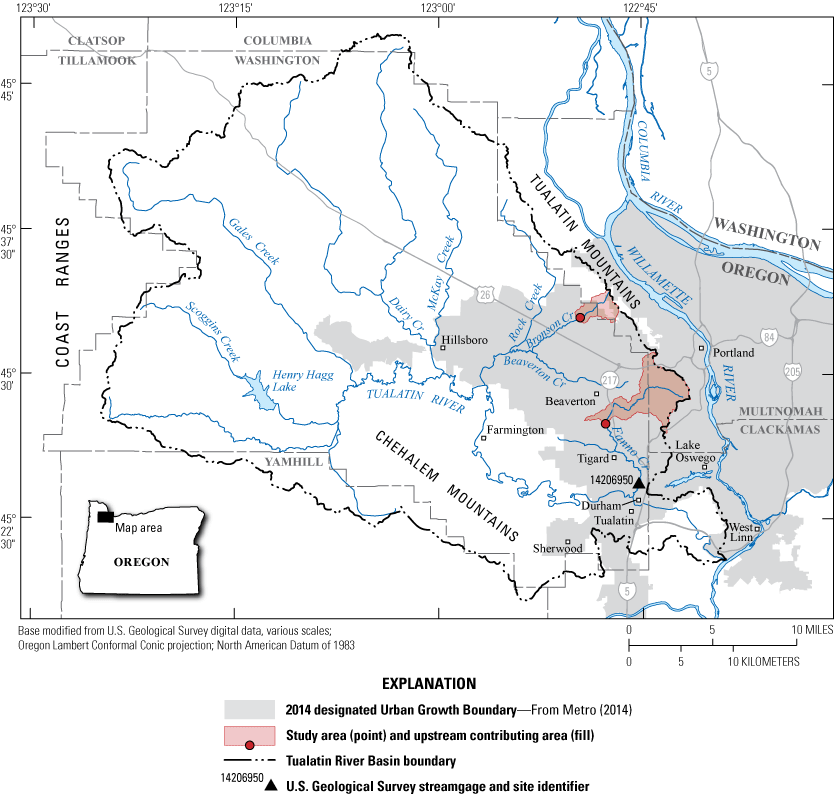
Tualatin River Basin, northwestern Oregon in the urbanized Portland metropolitan area and surrounding counties with the upstream contributing areas of the Fanno and Bronson Creek study areas delineated.
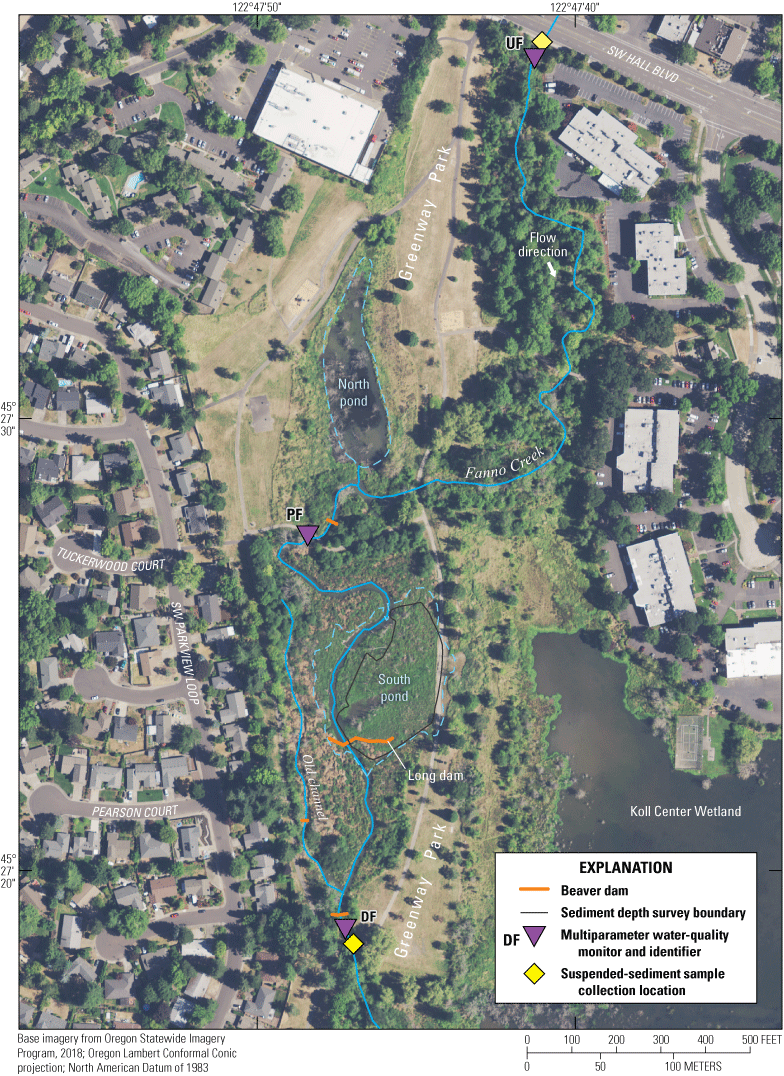
Fanno Creek study area, suspended-sediment sample collection locations, known beaver dams, and locations where continuous multiparameter water-quality monitors were deployed at the monitoring sites: Upstream at Fanno Creek (UF), Ponded at Fanno Creek (PF), and Downstream at Fanno Creek (DF). Additional site information is available in table 1.
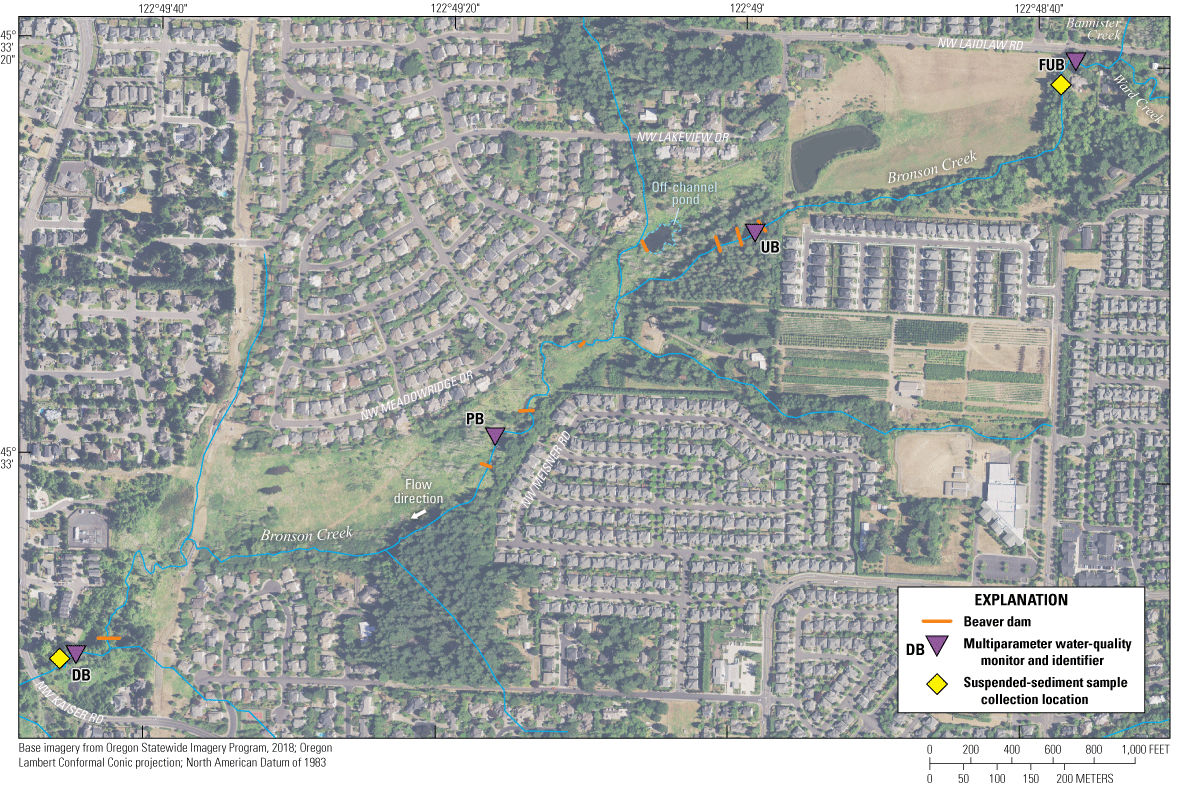
Bronson Creek study area, suspended-sediment sample collection locations, known beaver dams, and locations where continuous multiparameter water-quality monitors were deployed at the monitoring sites: Further Upstream at Bronson Creek (FUB), Upstream at Bronson Creek (UB), Ponded at Bronson Creek (PB), and Downstream at Bronson Creek (DB). Additional site information is available in table 2.
Purpose and Scope
The purpose of this report is to document the effects of beaver dams and ponds on sediment transport and deposition in two urban beaver-affected reaches in the Tualatin River Basin, northwestern Oregon (fig. 1). The scope comprises: (1) evaluating seasonal and longitudinal patterns in turbidity using continuously deployed monitors, (2) calculating streamflow and SSLs based on the relation between turbidity and discrete measurements of suspended-sediment concentration (SSC), (3) comparing differences in SSLs upstream and downstream from the two beaver-affected reaches, and (4) estimating the sediment storage in a pond in the Fanno Creek reach and describing key findings and implications relevant to the management and monitoring of beaver dams in urban streams.
Tualatin River Basin and Study Reach Descriptions
The headwaters of the Tualatin River begin in the Coast Ranges west of Portland, Oregon. The Tualatin basin covers parts of Washington, Multnomah, and Clackamas Counties. The Tualatin River drains about 1,840 square kilometers (km2) before its confluence with the Willamette River near West Linn, Oregon (fig. 1) (Risley and Doyle, 1996). Tributaries of the Tualatin River generally flow through forested, agricultural, suburban, and urban areas from upstream to downstream. The Urban Growth Boundary (fig. 1) restricts urban development in the lower Tualatin Valley. As of 2018, more than 600,000 people lived in the Tualatin River Basin (U.S. Census Bureau, 2020). Beavers are native to the basin, and despite being nearly extirpated by hunting and trapping over the last 150 years, they are beginning to recolonize waterways in the Tualatin River Basin. Prior to widespread Euro-American settlement, beavers created many ponds and swamps in the valley bottom streams of the Tualatin River Basin (Shivley, 1993).
Fanno Creek Study Reach
Fanno Creek, one of several major tributaries to the Tualatin River, originates within the City of Portland and flows for about 24 kilometers (km) through the Washington County suburbs of Beaverton, Tigard, and Durham before its confluence with the Tualatin River (fig. 1). The Fanno Creek Basin is approximately 86-percent developed, 13-percent forest and shrubs, and 1-percent wetlands (U.S. Geological Survey, 2011). The soils generally are highly consolidated silts and clays, and infiltration rates are relatively low, with moderately high soil phosphorus availability (Kurahashi and Associates, Inc., 1997).
The streamflow in Fanno Creek is typical of an urban stream in the Pacific Northwest, with flashy, high flows occurring during winter rain events and low summer flows dominated by groundwater inputs (McCarthy, 2000; Sobieszczyk and others, 2018). Mean monthly streamflow measured at the Fanno Creek at Durham, Oregon streamgage (14206950; U.S. Geological Survey, 2020; fig. 1) in December and January (the typical high-flow months) for water years 1994–2019 was 2.9 and 2.7 cubic meters per second (m3/s), respectively, with a maximum peak streamflow of 47.6 m3/s. Low streamflows typically occur in July and August, with mean monthly flows of 0.2 m3/s in both months and a minimum daily mean flow of 0.03 m3/s.
The Fanno Creek study reach is at the upstream section of Greenway Park (fig. 2). Greenway Park is an urban park frequented by bikers, commuters, and nearby residents. Keith and others (2014) reported that the Greenway Park segment of Fanno Creek was one of the largest potential sinks for fine sediment along Fanno Creek, owing to its low and wide floodplain and vegetation that increases channel roughness and decreases stream velocity. The study reach begins at the bridge on SW Hall Boulevard (Upstream at Fanno Creek [UF]) and has a drainage area of 26.7 km2 at this upstream boundary (U.S. Geological Survey, 2021; table 1). The reach extends 560 meters (m) downstream to the ponded site at SW Tuckerwood Court (Ponded at Fanno Creek [PF]), then 390 m to the farthest downstream site at SW Pearson Court (Downstream at Fanno Creek [DF]; fig. 2) for a total length of about 940 m. The channel between SW Hall Boulevard and the south pond is narrow (2–3 m), with mean depths of about 1.5 m, and is shaded by some riparian vegetation.
From 2008 to 2012, Clean Water Services re-meandered the channel (once straightened for agricultural purposes), creating a new channel and leaving the remnant old channel (referred to as the “old channel”; fig. 2) as a floodplain feature. The old channel is shaded, narrow, and generally can be waded, except for some areas upstream from the two beaver dams. The entire old channel remains wet year-round, owing to stormwater run-off, contributions from groundwater, and backwater from the two beaver dams. Water velocity throughout the study reach and old channel is slow during low-flow periods (less than 0.01 meter per second [m/s]; White and others, 2025b). As part of restoration efforts, large woody debris also was added to the main channel, and native vegetation was planted (Smith and Ory, 2005). Starting in 2012, beavers began colonizing the reach and built several dams and a beaver lodge.
One dam (referred to as the “long dam”) was 30-m long and extended onto the floodplain, creating a large pond (referred to as the south pond; fig. 2). During high-flow events, the south pond can flood the main channel, nearby paths, riparian areas, and the old channel. The north pond and adjacent Koll Center Wetland are other floodplain features in the reach that were present prior to the construction of beaver dams. The long dam creates the south pond, which is approximately 7,900 square meters (m2) in wetted surface area (Smith and others, 2025). Here, the main channel is still narrow and deep, and the ponded area is generally shallow (0.5 m on average) with some riparian shade. Downstream from the south pond to the end of the study reach, the channel is again narrow, deep, and shaded by riparian vegetation with one beaver dam that spans the channel upstream from DF (fig. 2).
Table 1.
Fanno Creek study area sites, Tualatin River Basin, northwestern Oregon.[Basin metrics estimated using StreamStats (U.S. Geological Survey, 2021). Refer to figure 2 for site locations. Site abbreviation: DF, Downstream at Fanno Creek; PF, Ponded at Fanno Creek; UF, Upstream at Fanno Creek. NWIS site name and NWIS site number: NWIS, National Water Information System; Blvd, Boulevard; Ct, Court; SW, Southwest (U.S. Geological Survey, 2020). Abbreviation: km2, square kilometer]
During high flows, Fanno Creek occasionally overtops its banks, and water flows into the Koll Center Wetland to the southeast (fig. 2), as observed during suspended-sediment sample collection and streamflow measurements. This high-flow, overland connection between Fanno Creek and the Koll Center Wetland complicated the ability to obtain representative SS samples and streamflow measurements and may lead to some underestimation of the SSLs at DF during those events. The overland flow occurred during an estimated 6 days during the study (Poor, 2018).
Bronson Creek Study Reach
Bronson Creek originates in the Tualatin Mountains on the eastern part of the Tualatin River Basin (fig. 1). It flows for about 10.5 km before it merges with Beaverton Creek, which flows into Rock Creek, and then continues to the confluence with the Tualatin River near Hillsboro. The Bronson Creek drainage encompasses an urbanizing region of Washington County and is about 67-percent developed land, 23-percent forest and shrubs, 4-percent herbaceous, 1-percent wetland, and 5-percent other land uses (U.S. Geological Survey, 2011). Unlike the Fanno Creek Basin, the Bronson Creek Basin does not have a long-term USGS streamflow station, and hence no available record of streamflow data. However, like the Fanno Creek Basin, increasing flows in Bronson Creek occur during rainfall runoff events primarily in the fall and winter months. The Bronson Creek Basin is about 12.7 km2 and includes parts of the cities of Portland, Beaverton, and Hillsboro (U.S. Geological Survey, 2021). Downstream from the confluence with Beaverton Creek, the channel gradient decreases, and the floodplain widens, causing sediment deposition into the basin and adjacent wetland areas.
Clean Water Services planted riparian vegetation and added large woody debris to the channel within the study reach from 2004 to 2019 to improve water quality and enhance the stream and floodplain habitats (Smith and Ory, 2005). Beaver dam building is believed to have begun sometime around 2010 following restoration activities. Between NW Laidlaw and NW Kaiser Roads, at least six beaver dams were present along the main channel at the start of the study, and beavers built a new dam during the study near NW Laidlaw Road (fig. 3). The total number of beaver dams between the monitoring site at Upstream at Bronson Creek (UB) to NW Kaiser Road is unknown, owing to the dense stand of reed canary grass (Phalaris arundinacea) that hindered site access.
The Bronson Creek study reach has an upstream contributing area of about 5.2 km2 at its upstream boundary (U.S. Geological Survey, 2021; table 2) and continues downstream through a 2,300-m reach surrounded by a vegetated riparian zone and residential properties (fig. 3). The study reach begins at the monitoring site at Farther Upstream at Bronson Creek (FUB) and flows for about 650 m to the first continuous monitoring location at Upstream at Bronson Creek (UB), then 630 m to the ponded site at Ponded at Bronson Creek (PB), and then 980 m to the final monitoring location at NW Kaiser Road (Downstream at Bronson Creek [DB]; fig. 3). The upstream part of the Bronson Creek drainage basin near the forested foothills is confined to a narrow (2-m wide) channel with various depths and ponded by multiple beaver dams (fig. 3). In the downstream part of the reach, Bronson Creek splits into braided channels across the wide floodplain and wetland area near Northwest Kaiser Road (fig. 3). While water velocity is slow during low flows (0.01 m/s; White and others, 2025b), the stream banks often remained full at PB and DB.
Table 2.
Bronson Creek study area sites, Tualatin River Basin, northwestern Oregon.[Basin metrics estimated using StreamStats (U.S. Geological Survey, 2021). Refer to figure 3 for site locations. Site abbreviation: DB, Downstream at Bronson Creek; FUB, Farther Upstream at Bronson Creek; PB, Ponded at Bronson Creek; UB Upstream at Bronson Creek. NWIS site name and NWIS site number: NWIS, National Water Information System; Ct, Court; Dr, Drive; Ln, Lane; NW, Northwest; Rd, Road (U.S. Geological Survey, 2020). Abbreviation: km2, square kilometer]
Methods
Methods used by the USGS to obtain continuous turbidity and streamflow data, collect discrete SS samples, and to measure sediment deposition in a large beaver pond (7,900 m2 surface area) along Fanno Creek at Greenway Park are described in this section. Four types of datasets were collected (continuous turbidity, continuous water levels, streamflow, and SS samples) upstream, within, and downstream from the beaver-affected reaches along Fanno and Bronson Creeks (figs. 2–3). Data were collected from May 2016 through November 2017. Continuous turbidity and streamflow data were used as surrogates to estimate continuous SSCs and loads.
Continuous Turbidity Data Collection
Turbidity is affected by the intensity, duration, and amount of precipitation and runoff; particle size of transported material; slope of the river channel; geomorphic structure of the channel; and the origin of the water, including point and nonpoint sources. The components that affect the turbidity observed in rivers and streams potentially can increase sediment loads in waterbodies. Increases in turbidity readings regularly occur during storm events when rainfall and storm runoff mobilize particles from the riparian zone and the stream network (Chen and Chang, 2019).
Multiparameter water-quality monitors (model 6920-V2 instruments from Yellow Springs Instruments, Inc. [YSI], Yellow Springs, Ohio) were outfitted to measure turbidity (YSI, Inc. 6136 and 6026 turbidity sensors). Different models of turbidity sensors were deployed at the two study reaches; therefore, the output of these two sensors is not directly comparable among reaches. Data initially were collected at hourly intervals, and data-collection frequency was increased to 30-minute readings in October 2016. Monitors were deployed to capture turbidity conditions in free-flowing water upstream, within, and downstream from the beaver-affected reaches at Fanno and Bronson Creeks. Each water-quality monitor was secured in acrylonitrile butadiene styrene pipe, which was perforated with multiple 2.5-cm-diameter holes to allow water to flow freely over the sensors. A channel strut was driven into the riverbank and streambed, and the acrylonitrile butadiene styrene pipe was attached to the struts at an angle. The bottom of the pipes and the ends of the sensors were positioned to measure the middle of the water column while ensuring that sensors remained submerged during the summer low-flow conditions. Housing and infrastructure for continuous turbidity data collection were similar among the deployment locations, and an example of a deployment site (UF) is shown in figure 4.
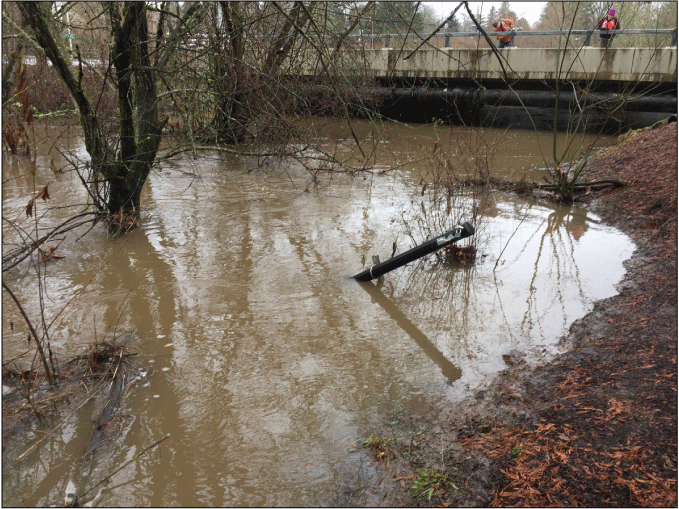
Water-quality monitor deployed at Fanno Creek at Greenway Park, Southwest Hall Boulevard (Upstream at Fanno Creek site) during high-flow conditions, Tualatin River Basin, northwestern Oregon. Photograph taken by Erin Leahy (U.S. Geological Survey) during storm event on March 15, 2017.
Operation and maintenance of the monitors and the application of data corrections followed standard USGS methods and protocols (Wagner and others, 2006). Sites were visited approximately every 4 weeks to clean the sensors and every 8 weeks to clean and check sensor calibration. Sensors were calibrated with formazin standards to 0 and 100 formazin nephelometric units (FNU), and then calibration linearity was checked with 10 and 200 FNU standards. Site-visit frequency was increased for sites along Fanno Creek during winter to decrease sensor fouling due to the deposition and accumulation of SS on the sensors. Data were loaded and archived in the USGS National Water Information System (NWIS) and are available through the online NWIS-Web system (U.S. Geological Survey, 2020). Data also are available through USGS Data Grapher and Data Tabler (https://or.water.usgs.gov/grapher/).
In August 2016, beavers built a dam 20 m downstream from the UB monitor, turning the free-flowing section into a slow-moving, narrow pond that began to accumulate sediment and organic matter. The sensors were temporarily buried by sediment during a large storm in November 2016, and the water-quality monitor was repositioned above the new streambed to measure mid-water column in December 2016. As a result of the beaver dam, a site farther upstream along Bronson Creek (Bronson Creek at NW Laidlaw Road; FUB) was selected to collect SS samples and streamflow measurements (fig. 3; table 2).
Continuous Water-Level Measurements
Continuous stream water level was measured near the upstream and downstream boundaries of the Fanno Creek study reach at UF and DF (fig. 2) and the original upstream and downstream boundaries of the Bronson Creek study reach at UB and DB (fig. 3). When the beaver dam was built near UB, the pressure transducer was not relocated and remained co-located with the water-quality monitor at UB. Water level was measured using unvented and submersible pressure transducers (Solinst level logger, model 3001 Levelogger Edge LT M5 F15, Georgetown, Ontario, Canada). The pressure transducers were programmed to continuously record water level at 30-minute intervals through December 2016, and at 15-minute intervals for the rest of the study. The site elevations were surveyed using Trimble R8 GNSS (Trimble Inc., Sunnyvale, California) and the Oregon Department of Transportation Real-Time Network (RTN)-Global Positioning System (GPS). Horizontal precision was less than 0.05 m, and vertical precision was less than 0.1 m. Water-level measurements are available in the USGS NWIS database (U.S. Geological Survey, 2020).
Streamflow Measurements
Streamflow was measured simultaneously while SS samples were collected at UF, DF (fig. 2), and FUB (fig. 3). Streamflow was not measured at UB because of the beaver dam built in the area during the study period but instead was measured at FUB where the SS samples were collected. Bronson Creek was not wadable at DB, so streamflow was measured using a Sontek River Surveyor acoustic Doppler current profiler. Two additional measurements were collected at UF as part of this study during low-flow conditions but were not associated with SSC collection (totaling 11 streamflow measurements at UF). All streamflow measurements and rating curves were calculated and developed using established USGS techniques and protocols (Rantz, 1982; Turnipseed and Sauer, 2010). Streamflow rating tables and computed continuous streamflow data are published in ScienceBase (Doyle and others, 2025).
Suspended-Sediment Sample Collection and Quality Assurance
Suspended-sediment samples were collected at FUB, DB, UF, and DF to measure SSCs upstream and downstream from the beaver-affected reaches. Most samples were collected during storm events when rainfall and storm runoff mobilized sediment particles. Samples were collected at different flow conditions and water levels (fig. 5A–D) to assess sediment transport under a range of streamflow conditions.
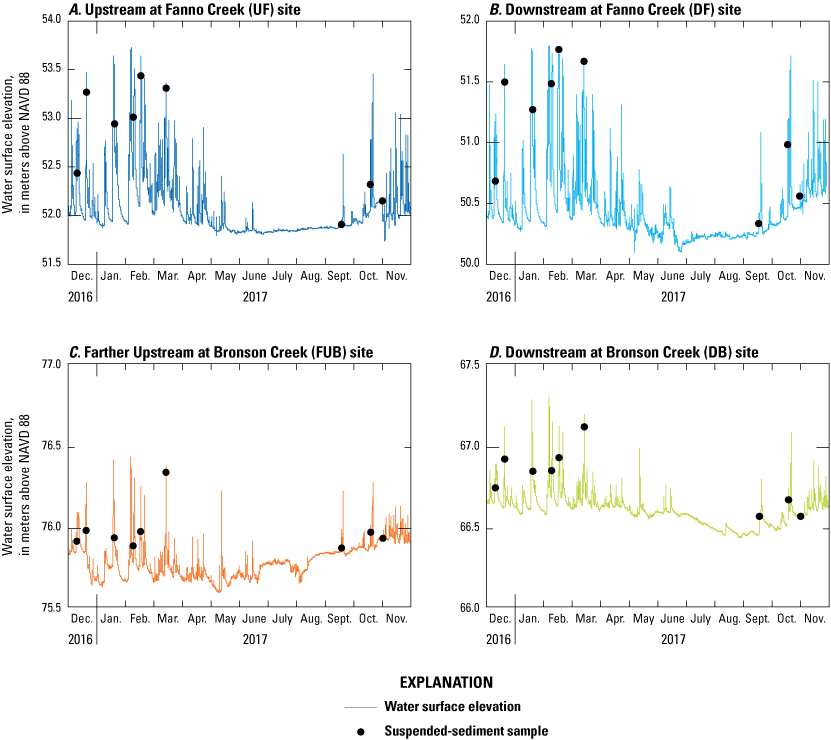
Suspended-sediment sample collection points relative to water surface elevations referenced to the North American Vertical Datum of 1988 (NAVD 88) at Fanno Creek study reach sites and Bronson Creek study reach sites, Tualatin River Basin, northwestern Oregon, December 2016–November 2017 (Doyle and others, 2025). Refer to figures 2 and 3 for site locations and tables 1 and 2 for site details.
Sample collection sites were collocated with continuous turbidity sensors, except at FUB. Two field crews collected suspended-sediment samples simultaneously in both study reaches. Within a reach, samples were collected sequentially, beginning at the upstream sites (FUB and UF) then moving to the downstream sites (DB and DF). Turbidity values recorded by the site water-quality monitor during SS collection were averaged. These average turbidity values were used to develop the turbidity-SSC relations, like Stonewall and Bragg (2012).
Nine SS samples were collected at each site from December 2016 to November 2017 (resulting in a total of 36 samples). The first eight samples were collected during storm events from December 10, 2016, to October 19, 2017, and the ninth sample was collected during baseflow conditions on November 1, 2017. A total of eight additional concurrent replicate samples were collected for quality assurance (QA) to assess sample-collection and laboratory reproducibility, precision, and accuracy. Analytical results of primary and QA samples are listed in appendix 1, and storm sampling details are provided in appendix 2. Information from appendixes 1–2 is incorporated in the uncertainty assessment documented in appendix 3.
Samples were collected using the equal width increment (EWI) sample collection method (Edwards and Glysson, 1998; Gray and Landers, 2014). The collection of samples using the EWI method captures the spatial variability of sediment, resulting in a sample that is representative of the channel cross-section. Sediment samples were analyzed by the USGS Cascades Volcano Observatory Sediment Laboratory in Vancouver, Washington, using analytical methods detailed in Fishman and Friedman (1989). All samples were analyzed for SSCs and were not analyzed for grain size. However, field observations by the study team noted that fine sand, silt, and clays were deposited on the Fanno Creek floodplain, whereas more sand was deposited on the Bronson Creek floodplain near the monitoring locations. SSC data are available in the USGS NWIS database (U.S. Geological Survey, 2020).
Bed Elevations and Elevation-at-Refusal in the South Pond along Fanno Creek
Bed elevations and elevation-at-refusal (EAR; an elevation dataset used to calculate sediment depth) were collected to estimate the volume of sediment stored in the south pond along the Fanno Creek study reach (fig. 2). Sediment volumes were not estimated for the Bronson Creek study reach, owing to site access and project scope limitations.
The bed-elevation survey was completed in May 2016 and covered the entire Fanno Creek study reach (White, 2025). An RTN-GPS was used to record the coordinates and elevations of the wetted channel and banks. Measurements were collected while wading or from a kayak. In the upstream part of the reach, where the stream is confined to the channel, elevation measurements were collected along a centerline and at cross-sections roughly every 10 m. In the areas of the study reach most noticeably affected by the beaver dams, bed-elevation points were measured every 1–3 m2, with greater point densities near dams and in areas with abrupt elevation changes. Downed trees and large woody debris, such as those in the south pond, prevented surveying in some locations. White and others (2025b) describe how these coordinate and elevation data were combined with existing high-resolution lidar from 2014 to create a continuous surface map of the wetted channel and floodplain.
Initial EAR survey data were collected during the bed-elevation survey in May 2016 and matched the exact latitude and longitude of corresponding bed-elevation points (Jones and others, 2025). Additional EAR data were collected in September 2016 to improve the spatial coverage of measurements in the south pond, using methods from other beaver-related sediment studies (Butler and Malanson, 1995; Puttock and others, 2018). A stadia rod with a pointed foot was pushed into the unconsolidated sediment until the resistance changed noticeably, indicating that the rod had contacted the underlying floodplain material (fig. 6). RTN-GPS survey equipment was used to record the coordinates and elevation of each EAR point.
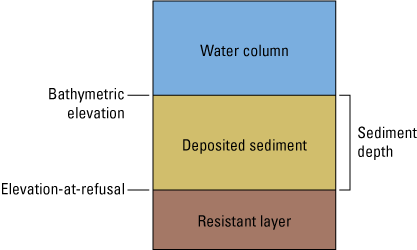
Schematic showing the water column, deposited sediment, and the underlying resistant floodplain material.
Data Analysis
Comparisons of Turbidity Within the Study Reaches
Turbidity data were evaluated for each study reach to gain insights into the effects of beaver dams on longitudinal changes in sediment transport. Differences from upstream to downstream sites could indicate whether the dams were acting as a sink (positive difference) or source (negative difference) for turbidity and SS.
The peak turbidity values measured at the continuous monitoring sites during storm events were compared for a given reach. A discrete storm event was characterized by a rising limb and falling limb in the hydrograph and a peak streamflow that exceeded 5.7 m3/s at Fanno Creek at Durham, Oregon (USGS streamgage 14206950; U.S. Geological Survey, 2020). A storm event was not included in the comparison if one continuous site along a reach was missing the potential maximum turbidity measurement because of sensor fouling or equipment malfunction that resulted in missing data. Because Bronson Creek does not have a USGS streamgage, a visual inspection of the time-series water-level data measured at DB during an event verified that a corresponding storm event hydrograph occurred in the Bronson study area as well.
Estimations of Suspended-Sediment Loads
Many studies have used continuous turbidity measurements, streamflow measurements, and SSC samples to calculate suspended-sediment loads (SSLs) in rivers (Wass and others, 1997; Anderson, 2007; Bragg and others, 2007; Chanson and others, 2008; Schenk and Bragg, 2014; Sobieszczyk and others, 2015). This process involves continuously measuring turbidity and streamflow while simultaneously collecting water samples, which are later analyzed for SSC.
Ordinary least squares (OLS) regression analysis was used to describe the relation between continuous turbidity and SSC. Site-specific linear regression models were developed, and models within a reach were tested for statistical significance. The resulting reach- or site-specific regression subsequently was used to calculate continuous SSC (Rasmussen and others, 2008). The SSC and streamflow values were used to compute monthly and annual SSLs by multiplying the calculated SSC by the respective streamflow (Rasmussen and others, 2009).
Ideally, at least 25–30 SSC samples would be used for a given sediment-turbidity regression to provide sufficient statistical power (Rasmussen and others, 2009). For this investigation, we collected nine samples at each site along both study reaches. Although the total number of samples is relevant, the distribution of data over the range of observed turbidity, SSC, and streamflow values for the site is most important (Rasmussen and others, 2009). SSC samples collected from the four sites are representative of conditions during low, medium, and high streamflows (fig. 5A–D) and cover the full range of turbidity and SSC during the study period.
For this study, the analyses necessary to compute SSLs upstream and downstream from the study reaches included:
-
• Estimating missing turbidity data to provide a continuous turbidity dataset for the period of record,
-
• Developing relations between discrete SSC samples and continuous turbidity data to estimate continuous SSC,
-
• Developing water-level-streamflow rating curves to relate continuous water-level data to continuous streamflow, and
-
• Calculating SSLs at the upstream and downstream sites within each study reach.
Estimation of Turbidity Data Gaps
Data values were deleted or are missing from the continuous turbidity datasets from both reaches owing to sensor fouling, sensor failure, or other equipment malfunctions, which created gaps in the continuous record. Most instances of missing data occurred on falling limbs of the hydrographs following a storm event that transported sediment and resulted in sensor fouling or burial. Deleted and missing data were less than 20 percent of the data at each monitoring site: UF, 18 percent; DF, 13 percent; UB, 13 percent; and DB, 19 percent.
Multiple approaches were considered to fill the turbidity data gaps for the Fanno Creek sites, including relating the site turbidity (for example, at UF) with streamflow data from Fanno Creek at Durham, Oregon (fig. 1), local water-level data, and site turbidity from PF and DF. Site turbidity and streamflow at the Durham station were fairly well correlated (UF, coefficient of determination [R2]=0.60; DF, R2=0.59), as was site turbidity and local water-level data (UF, R2=0.67; DF, R2=0.62). However, the strongest correlations were between turbidity measurements at the upstream, ponded, and downstream locations (fig. 7). Thus, turbidity data gaps at UF were first filled using the ordinary least squares (OLS) regression between turbidity at PF and UF (R2=0.92; mean absolute error [MAE]=5.03; fig. 7A). After that step, 4 percent of turbidity data were still missing from the UF dataset, which occurred when turbidity data were missing from UF and PF. The regression between DF and UF turbidity (R2=0.78; MAE=8.80; fig. 7B) was used to estimate the remaining missing values at UF. Similarly, missing turbidity data at DF were filled using the regression between turbidity at PF and DF (R2=0.79; MAE=7.24; fig. 7C), when possible, and then the UF-DF regression (R2=0.78; MAE=8.01; fig. 7D), when needed. After applying these regression equations to fill turbidity data gaps, UF and DF were missing less than 1 percent of the turbidity dataset, which occurred when data were missing from all three sites.
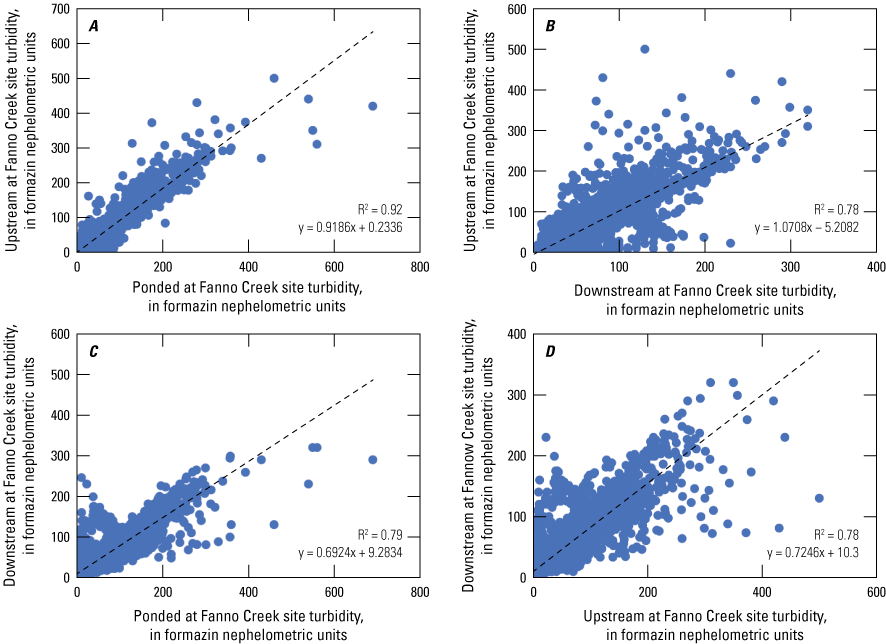
Ordinary least squares regressions of continuous turbidity data at the Fanno Creek study reach sites (UF, Upstream at Fanno Creek; PF, Ponded at Fanno Creek; DF, Downstream at Fanno Creek), Tualatin River Basin, northwestern Oregon. Dots represent corresponding turbidity readings at each site, and the regression formula was used to compute missing turbidity values on the y-axis. Refer to figure 2 for site locations and table 1 for additional site information.
Like the Fanno Creek sites, turbidity was not strongly correlated with water level for the UB and DB sites (OLS regression R2=0.03 and 0.14, respectively). The lack of correlation between water level and turbidity at UB may have been a result of the beaver dam located just downstream from the continuous monitor. DB was in a wide floodplain, and the creek within the channel was near bank full capacity, even during low-flow periods. Therefore, when water level increased at the DB site, water likely spread over the wide floodplain and sediment dropped out of suspension, changing the expected water-level-turbidity relation for a free-flowing stream.
Methods used to fill turbidity data gaps for the Fanno Creek reach were applied to the Bronson Creek reach, and regression equations of turbidity measurements among sites were developed (fig. 8). Data gaps at UB were first filled using the regression between turbidity at UB and PB (R2=0.69, fig. 8A). If PB data also were missing, the regression equation between turbidity at UB and DB (R2=0.30) was used to estimate missing turbidity values at UB (fig. 8B). Turbidity gaps at DB were filled using the regression between turbidity at DB and PB (R2=0.45; fig. 8C), when possible, and then using the regression between turbidity at DB and UB (R2=0.30) if PB turbidity data were unavailable (fig. 8D). Final UB and DB turbidity datasets were missing less than 1 percent of a complete dataset. Estimated turbidity values for the Fanno Creek and Bronson Creek sites introduced uncertainty in the turbidity dataset and, therefore, in the SSL calculations (app. 3).
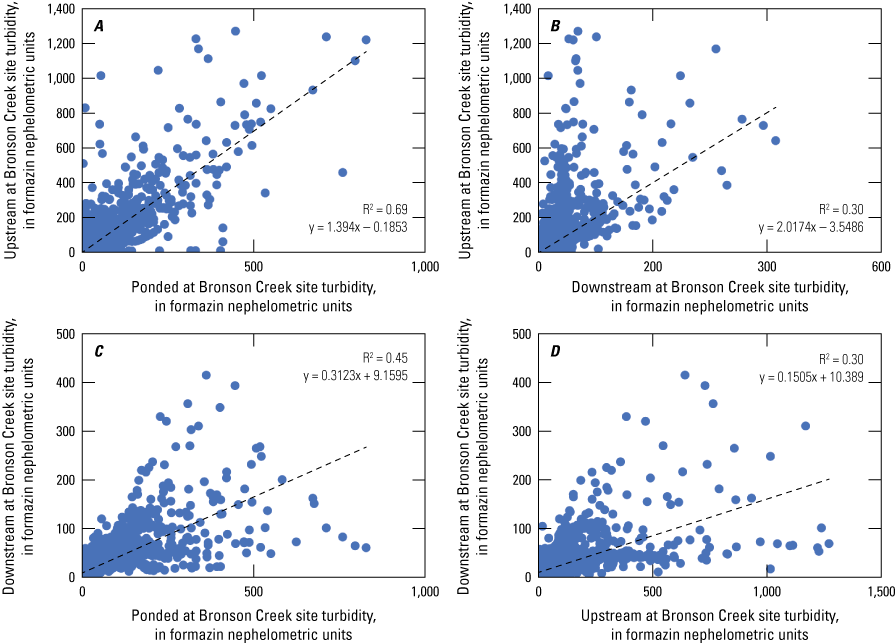
Ordinary least squares regressions of continuous turbidity data at the Bronson Creek study reach sites, Tualatin River Basin, northwestern Oregon. Dots represent corresponding turbidity readings at each site, and the regression formula was used to compute missing turbidity values on the y-axis. Refer to figure 3 and table 2 for site locations in the study area.
Relation Between Suspended-Sediment Concentrations and Turbidity
OLS regressions were used to compare SSCs, and average turbidity values measured during the water sample collection period from each site (Fanno and Bronson Creeks, upstream and downstream locations), creating four regression models. All regressions were forced to fit through zero to remove negative results. An Analysis of Covariance (ANCOVA) test was used to compare relations among upstream and downstream sites (significance level α=0.05). The null hypothesis stated that there was no difference between the simple linear regression models; in other words, the data from upstream and downstream sites within the study reach could be described using one regression line. For an ANCOVA test, the data are assumed to be independent and normally distributed with the same variance. Some statistical-test assumptions were violated because measurements collected from upstream to downstream were not independent. Despite the violation of assumptions, ANCOVA tests were used to accentuate the relative differences among groups.
Similar regression slopes at UF and DF (1.04 and 1.01, respectively; fig. 9A) indicate that the relation between SSC and turbidity does not change along the beaver-affected reach and that the same type of suspended material (such as clay) is found at both sites. ANCOVA results showed that the two regressions were not significantly different (probability value p=0.58), and that the data could be explained with one model. ANCOVA results were used as another piece of evidence that, when considered with the very similar slopes, indicate that the regressions are not significantly different. Therefore, the UF and DF datasets were combined to increase sample size (fig.9B; R2=0.83; MAE=39.91; sample size n=18).
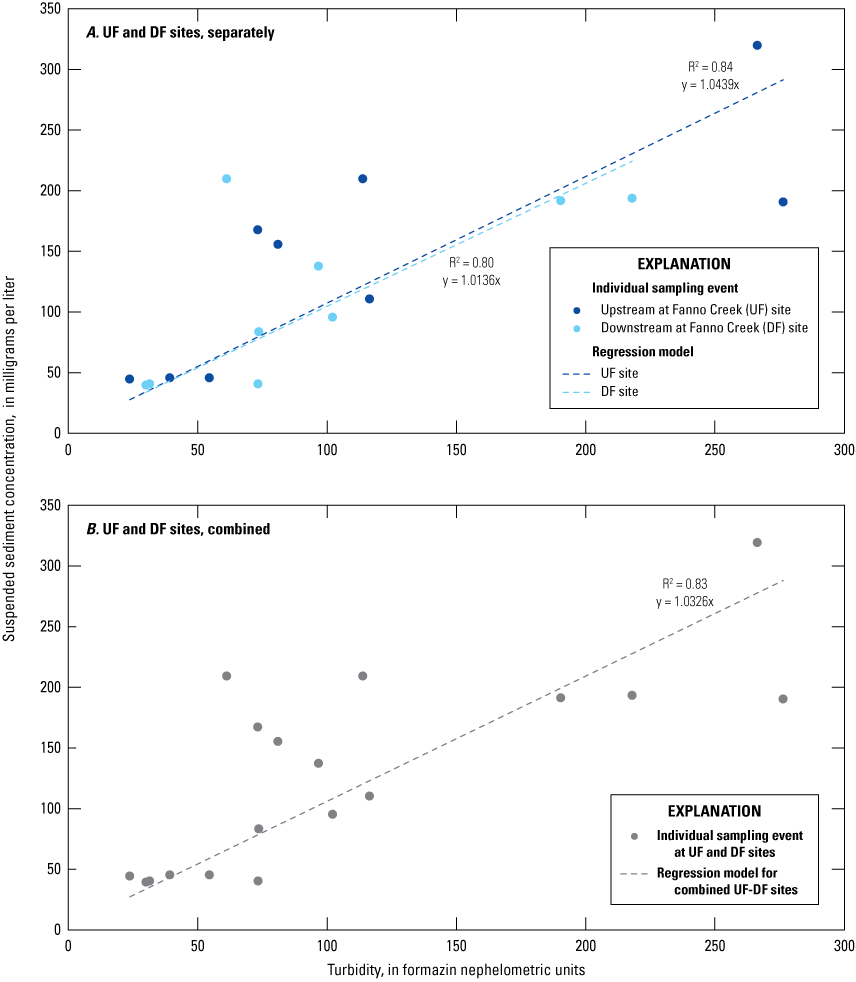
Ordinary least squares regression of suspended-sediment concentrations as a function of turbidity measured during nine sampling events in the Fanno Creek study area, Tualatin River Basin, northwestern Oregon. Refer to figure 2 for site locations in the study area.
The site regression that was formed with SSC data collected at FUB and turbidity data collected at UB is referred to as the UB regression. Two pairs of SSC/turbidity values were not included in the UB regression because the site turbidity sensor was fouled when the SS samples were collected. However, an additional SS sample was collected at the upstream site on February 16, 2017, approximately 1 hour after the primary sample was collected. This sample was included in the UB regression because conditions were changing quickly, and it represented a different sample.
At Bronson Creek, the upstream and downstream regressions differed significantly from each other (p=0.02); this difference can be seen visually in figure 10 and was confirmed with the ANCOVA test. These different regressions indicate that the beaver reach affected the SSC/turbidity relation, potentially by altering the particle-size distributions. The expansive floodplain, reed canary grass, and multiple beaver dams in the reach affected the suspended material as the water flowed from upstream to downstream. Less sediment was flowing past DB than UB per unit of turbidity, and the suspended material at DB may have been mostly fine material in contrast to larger particles that likely would drop out of suspension as stream velocity decreased over the period of the storm hydrograph. These datasets were not combined, resulting in separate regressions for UB (R2=0.91; MAE=127.30; n=8) and DB (R2=0.94; MAE=7.31; n=9; fig. 10). The applicable regression model was used with each site’s continuous turbidity data to compute continuous SSCs.
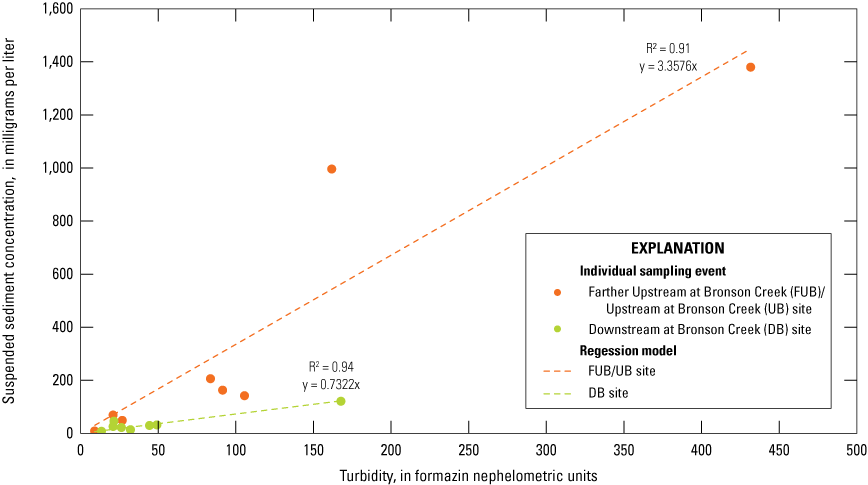
Ordinary least squares regression of suspended-sediment concentrations as a function of turbidity measured during nine sampling events in the Bronson Creek study area, Tualatin River Basin, northwestern Oregon. Refer to figure 2 for site locations.
The high SSC value (1,380 milligrams per liter [mg/L]) at UB may seem erroneous, but it was included in the analyses for two reasons. First, the sample was collected at FUB while the corresponding turbidity value was measured onsite at UB; the sample and turbidity measurement indicate that it was a high SS event. Second, the sample was collected on March 15, 2017, and the SSCs at DB and UF on that date were also the highest measured during the study at those sites. The sample was collected on the falling limb of the hydrograph at UB, and the concentration and turbidity values could have potentially been higher if the sample had been collected a few hours earlier during the rising limb of the storm hydrograph.
Water-Level-Streamflow Rating Curves
Most USGS rating curves are developed over time, and the rating is continually modified and updated as additional streamflow measurements are collected. However, ratings curves for this project were developed using only the streamflow measurements and water-level readings collected during the study period. Water levels collected with pressure transducers were paired with corresponding streamflow measurements. Water-level-streamflow rating curves were developed using the USGS rating-development tool.
A water-level-streamflow rating curve could not be developed using the continuous water-level data collected at UB and the streamflow measurements collected at FUB because of the beaver dam constructed downstream from the pressure transducer at UB. The dam resulted in an inconsistent relation between water level and streamflow, making the use of a rating curve unsuitable for this study. Thus, streamflow at UB was estimated by using the drainage-area ratio method (DARM) based on the rating developed at DB (eq. 1). The DARM assumes that the streamflow for a site of interest can be estimated by applying the ratio of the drainage area for the site of interest to the drainage area of a nearby site (Emerson and others, 2005). Because of the upstream influence of the south pond and long dam in the Fanno Creek study reach (fig. 2), the DARM also was used to estimate streamflow at the downstream Fanno Creek site (DF) using the rating developed at UF (eq. 2). Thus, the DARM used to estimate streamflow at UB is given by:
whereUBQ
is the streamflow at UB in cubic meters per second,
AUB
is the drainage area, in square kilometers for UB,
ADB
is the drainage area, in square kilometers for DB, and
DBQ
is the streamflow at DB in cubic meters per second.
The DARM used to estimate streamflow at DF is given by:
whereDFQ
is the streamflow at DF in cubic meters per second,
ADF
is the drainage area, in square kilometers for DF,
AUF
is the drainage area, in square kilometers for UF, and
UFQ
is the streamflow at UF in cubic meters per second.
The drainage areas of DB and UB are 8.05 and 5.30 km2, respectively, and a ratio of 0.66 was applied to the continuous streamflow at DB for estimating streamflow at UB. The drainage areas of UF and DF are 3.98 and 4.05 km2, respectively, and a ratio of 1.02 was applied to the continuous streamflow at UF for estimating streamflow at DF. Streamflow measurements from both study reaches are listed in appendixes 2 and 3.
Suspended-Sediment Load Calculations
SSLs were calculated from the modeled SSCs and estimated streamflow using the following equation:
whereSSL
is the suspended-sediment load in kilograms,
SSC
is the suspended-sediment concentration in milligrams per liter,
Q
is the streamflow in cubic meters per second, and
time interval
is either 3,600 seconds for hourly readings or 1,800 seconds for half-hourly readings.
Loads were summed by month and water year (2017) for comparison purposes. Potential sources of error in the computed SSLs were assessed and documented in appendix 3. Sources of error in this analysis included:
-
• Suspended-sediment sampling and laboratory analyses,
-
• sensor accuracy,
-
• turbidity standard accuracy,
-
• sampling during changing conditions,
-
• timing of sensor drift corrections,
-
• models relating SSC and turbidity,
-
• models used to fill in missing turbidity data, and
-
• models relating measured and computed streamflow.
Probable overall error associated with the daily computations of SSLs was 59.8, 56.4, 69.4, and 52.3 percent at UF, DF, FUB/UB, and DB, respectively (table 3.1). For all sites, most of the error in the daily SSL calculations was a result of the regression models relating SSC to turbidity (table 3.1). The second greatest source of error was the relation used to develop continuous estimates of streamflow. Error associated with the annual load computations ranged from 1.8 to 4.3 percent (table 3.1).
Calculation of Stored Sediment in the South Pond of the Fanno Creek Reach
The volume of sediment stored in the south pond along the Fanno Creek reach (fig. 2) was determined using bed elevation and EAR surveys. Initial inspection of the two datasets indicated that changes in bed elevation occurred in the main channel and western and northern sides of the pond during the 4 months between the two surveys. These changes likely were a result of ongoing beaver activity in the study reach. Thus, subsequent analyses were limited to the eastern part of the south pond (fig. 11) where changes in bed elevation were not evident in the data. The area of analysis captured about 60 percent of the pond wetted surface area. The bed elevation points and EAR survey points within the area of analysis were converted to triangulated irregular networks and then converted to a raster using standard tools in ArcGIS. The EAR raster was then subtracted from the bed elevation raster (refer to fig. 6) to create a sediment-depth raster.
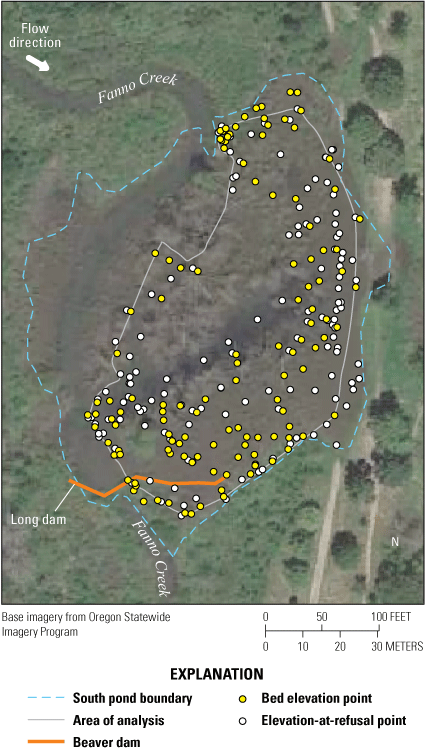
Bed elevation and elevation-at-refusal (EAR) measurement points on the eastern side of the south pond in the Fanno Creek study reach, Tualatin River Basin, northwestern Oregon (Jones and others, 2025; White, 2025).
Sediment volumes in the eastern part of the south pond of Fanno Creek were estimated using two methods. First, the volume of stored sediment was determined by multiplying the sum of the sediment depths by the 0.5-meter resolution raster, using linear interpolation. Second, the volume of stored sediment was estimated by multiplying the pond area by mean sediment depth so that results could be compared to those reported previously by Butler and Malanson (2005). These two estimates of sediment volume were converted to mass (in metric tons) by applying a bulk density of 0.23 grams per cubic centimeter (g/cm3). A bulk density of 0.23 g/cm3 was selected based on site knowledge and reported literature values for similar sites (Puttock and others, 2018).
Results
Within-Stream Turbidity, SSC, and SSL Responses
Fanno Creek Study Reach
For the period of record, turbidity values measured at UF and PF were similar and overlapped (fig. 12). However, turbidity values measured at PF and DF varied substantially. Turbidity was affected by the differences in stream characteristics along the reach. The stream remained within the channel between UF and PF, which likely explains the similar turbidity measurements in these sections of Fanno Creek. In contrast, the beaver dams downstream from PF caused the creek to overflow its banks and form the large south pond (fig. 2) upstream from DF.
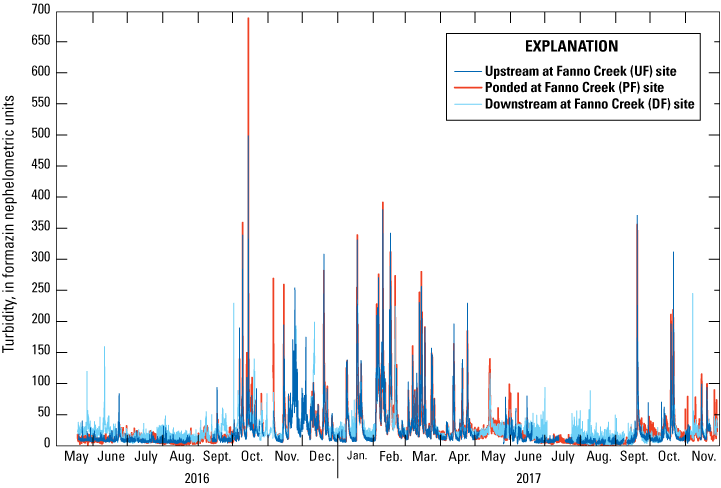
Continuous turbidity measured upstream, in the ponded reach, and downstream of a beaver-affected reach along Fanno Creek, Tualatin River Basin, northwestern Oregon, May 2016–November 2017. Refer to figure 2 and table 1 for additional descriptions of the monitor locations.
During storm events (n=25), the peak turbidity values measured at DF were substantially less than at PF (fig. 13). The median peak turbidity values measured during storm events were 197, 212, and 138 FNU at UF, PF, and DF, respectively (fig. 13). Additional evidence of this pattern can be seen during a storm event on March 15, 2017, where the peak turbidity values were 257, 281, and 204 FNU from upstream to downstream (fig. 14). These peak storm values suggest that sediment was dropping out of suspension in the large south pond between PF and DF.
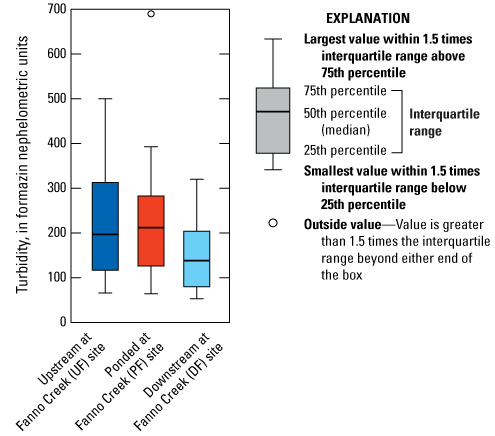
Maximum instantaneous turbidity measured during storm events (n=25) at sites along Fanno Creek, Tualatin River Basin, northwestern Oregon, May 2016–November 2017. Refer to figure 2 and table 1 for additional descriptions of the monitor locations.
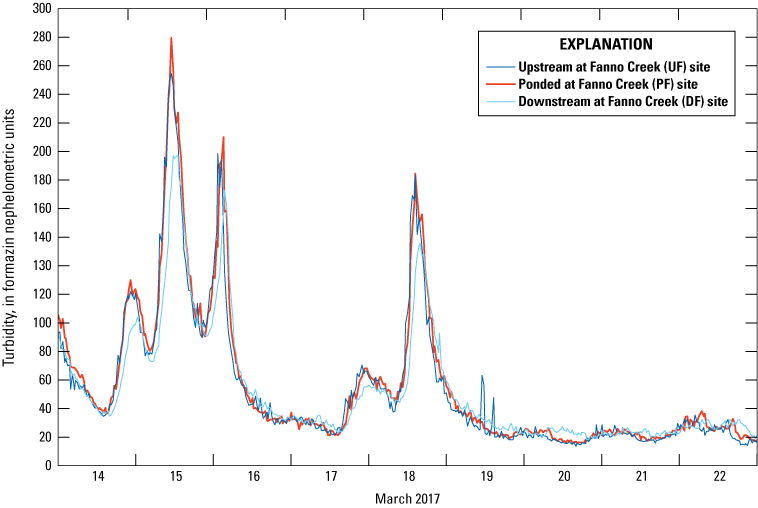
Continuous (30-minute) turbidity measured during storm events upstream, in the ponded reach, and downstream from a beaver-affected reach along Fanno Creek, Tualatin River Basin, northwestern Oregon, March 14–22, 2017. Refer to figure 2 and table 1 for descriptions of the monitoring locations.
A pronounced diel pattern of higher turbidity during the night and early morning was observed in DF data during periods of low flow compared to UF and PF turbidity data (fig. 15). The pattern suggests that the area between PF and DF was affected by nocturnal animal activity and bioturbation, such as dam building and maintenance by beavers and nutria. Although the turbidity values were higher and suggested that more sediment was in suspension at DF, this activity occurred during baseflow conditions when streamflow and velocity were very low.
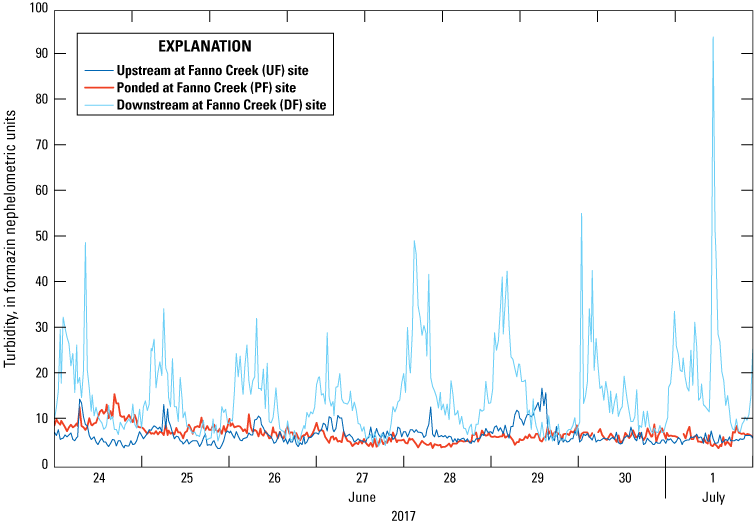
Continuous (30-minute) turbidity measured during a low-flow period upstream, in the ponded reach, and downstream from a beaver-affected reach along Fanno Creek, Tualatin River Basin, northwestern Oregon, June 24–July 1, 2017. Refer to figure 2 and table 1 for descriptions of the monitor locations.
Bronson Creek Study Reach
Turbidity values generally decreased from UB to DB along the Bronson Creek reach during storm events (figs. 16–18) suggesting that SS was deposited on the floodplain between the UB and PB sites and between the PB and DB sites. Turbidity values at UB were often much greater than DB values (for example, 1,000 FNU higher), suggesting substantial sediment deposition along the reach between UB and DB. The decreasing downstream turbidity values suggest that beaver dams in the Bronson Creek study reach, especially dams at the two downstream sites, served as a sink for sediment.
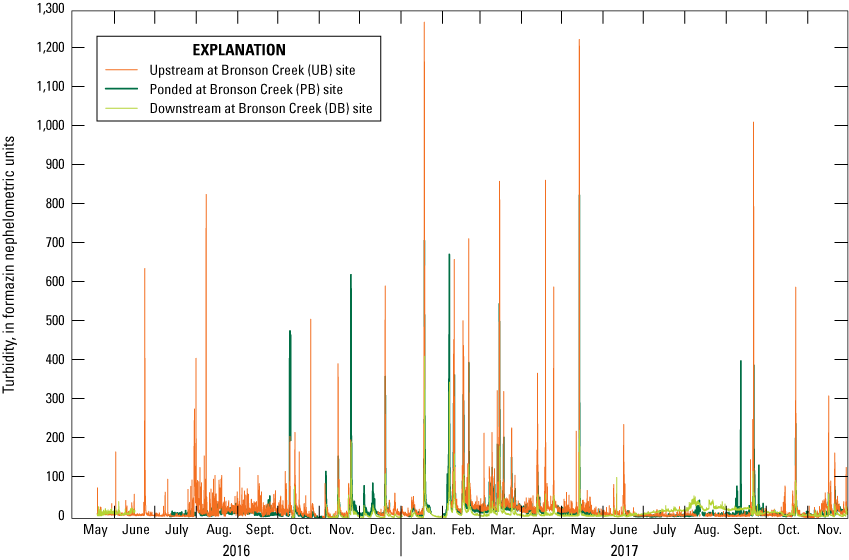
Continuous (hourly or 30-minute) turbidity measured upstream, in the ponded reach, and downstream from a beaver-affected reach along Bronson Creek, Tualatin River Basin, northwestern Oregon, May 2016–November 2017. See figure 3 and table 2 for descriptions of the monitoring locations.
Peak turbidity values measured during storm events (n=23) at UB were higher than at PB and DB (fig. 17). Median peak turbidity values measured during storm events were 327, 159, and 62 FNU at UB, PB, and DB, respectively. Further evidence of decreasing turbidity from upstream to downstream can be observed during a storm event on March 15, 2017, where turbidity peaked at 864 FNU at UB, 550 FNU at PB, and 185 FNU at DB (fig. 18). The timing of the turbidity peak varied among the sites indicating the travel time of water through the 1,610-m study reach. During the March 15 event, stormwater traveled from UB to PB (630 m) in about 30 minutes and then from PB to DB (980 m) in about 2.5 hours (Smith and others, 2025).
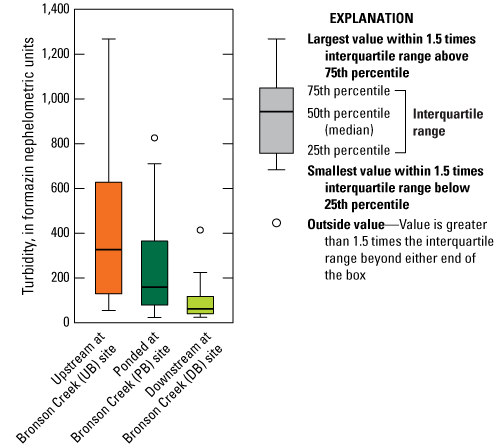
Maximum instantaneous turbidity measured during storm events (n=23) at sites along Bronson Creek, Tualatin River Basin, northwestern Oregon, May 2016–November 2017. Refer to figure 3 and table 2 for descriptions of the monitoring locations.
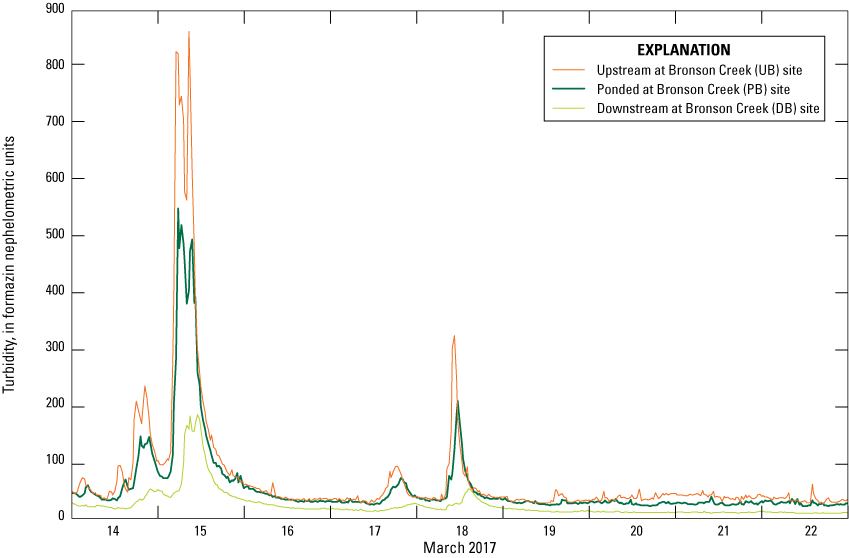
Continuous (30-minute) turbidity measured during storm events upstream, in the ponded reach, and downstream from a beaver-affected reach along Bronson Creek, Tualatin River Basin, northwestern Oregon, March 14–22, 2017. Refer to figure 3 and table 2 for descriptions of the monitoring locations.
Turbidity measured at DB during low-flow conditions (July–September 2017) was higher than turbidity measured at PB and UB (fig. 16). The diel pattern in turbidity observed in the Fanno Creek study area (fig. 15) was not observed in the Bronson Creek study area. The specific cause of the elevated turbidity readings during summer conditions (and negligible streamflow) at DB is unknown but could be attributed to beaver activity or increased phytoplankton in the warmer, slower-moving water (Carpenter and others, 2022).
Suspended-Sediment Concentrations
Fanno Creek Study Reach
SSCs for UF and DF are shown in figure 19A and listed in appendix 2. The first eight samples collected at UF and DF were collected at estimated streamflows of 0.06–8.60 m3/s and 0.09–7.10 m3/s, respectively, and during the rising and falling limbs of storm events (fig. 5). Suspended-sediment concentrations for the storm events (samples 1–8) ranged from 27 to 301 mg/L at UF and 21 to 191 mg/L at DF (fig. 19A). Concentrations for the UF and DF sites were similar during four storm events (samples 1, 2, 5, 7). However, concentrations at the UF site were 72–126 mg/L higher than those at DF during three storm events (samples 3, 4, 6) but 42 mg/L lower than at DF during one storm event (sample 8). The greater SSC measured at DF in sample 8 was likely an artifact of sampling at UF and then DF as the streamflow increased. Overall, there was an average decrease of about 20 percent between the upstream and downstream sites. The baseflow sample (sample 9) at UF and DF had comparable SSCs (26 and 22 mg/L, respectively; fig. 19A) and streamflows (0.06 at UF and 0.09 m3/s, respectively; fig. 5). Because there was only one sample to compare SSCs during baseflow, it is unclear if this similarity in SSC was consistent during all baseflow conditions. However, the volume of sediment transported during baseflow conditions is a small fraction compared to sediment transport during storm events and higher streamflow conditions.
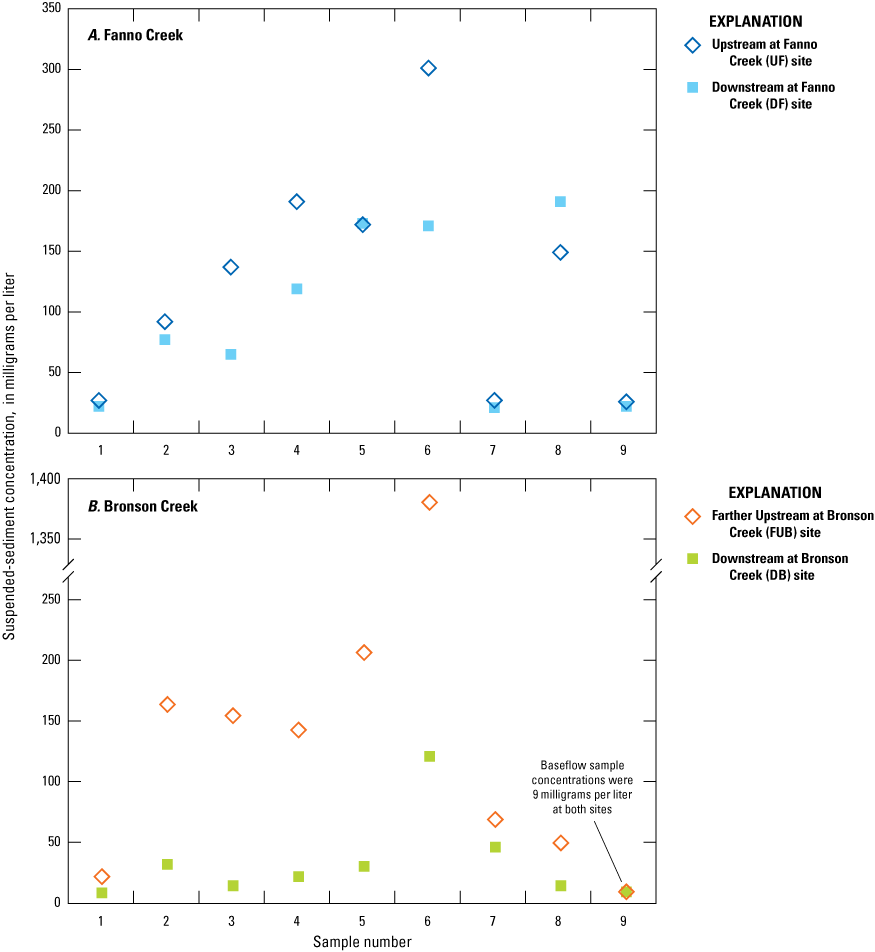
Comparison plots showing suspended-sediment concentrations of samples collected on nine days from December 2016 to November 2017, Tualatin River Basin, northwestern Oregon. Samples (for example, sample number 1) were collected from all four study sites on the day. Refer to table 2 and figure 3 for site details and locations.
Bronson Creek Study Reach
The SSC results for FUB and DB are shown in figure 19B and listed in appendix 2. The first eight samples collected at FUB and DB were collected during storm events with estimated streamflows of 0.01–1.66 m3/s and 0.05–2.35 m3/s, respectively, and during the rising and falling limbs of storm events (fig. 5). The SSC values for the storm events (samples 1–8) ranged from 22 to 1,380 mg/L at FUB and 8 to 121 mg/L at DB. Concentrations at the upstream and downstream sites were similar during three storm events (samples 1, 7, 8). Concentrations at the upstream site ranged from 142 to 206 mg/L during four storm events (samples 2, 3, 4, 5) and measured 1,380 mg/L during one storm event (sample 6; app. 2). Overall, there was an average decrease of about 67 percent between upstream and downstream sites. The baseflow samples (sample 9) at the upstream and downstream sites were both 9 mg/L and were collected during estimated flows of 0.01 at FUB and 0.05 m3/s at DB.
Quality Assurance of Suspended-Sediment Samples
Replicate samples were submitted to the USGS Cascades Volcano Observatory Sediment Laboratory to assess accuracy and reproducibility of analytical SSC results. The replicate samples were collected concurrently using EWI methods to eliminate the potential error of splitting or subsampling the primary sample. A total of eight replicate samples were submitted for analyses. The relative percent difference between the samples ranged from 1 to 12.2 percent with a mean of 6.4 percent (app. 1). The highest two relative percent difference comparisons were from replicate samples collected in October 2017 from FUB (12.2 percent) and at DF (12.0 percent), and the lowest was from UF in March 2017 (1.0 percent). The remaining comparisons were all 7.1 percent or less. Overall, analytical results of the replicate samples showed good reproducibility by the Cascades Volcano Observatory Sediment Laboratory.
Suspended-Sediment Loads
Fanno Creek Study Reach
SSLs were calculated for the Fanno Creek study reach when both water level and turbidity data were collected (June 22, 2016–November 29, 2017; fig. 20A). High SSLs occurred during autumn 2016 through spring 2017 and in autumn 2017, showing that the loads were associated with the effects of increased stream velocity and shear stress. In water year 2017, estimated monthly SSLs ranged from 1 to 578 t at UF and 1 to 519 t at DF (fig. 20B). Monthly SSLs often were greater at UF than DF during October–April, and SSLs were small to negligible at both sites during summer months. During water year 2017, the estimated total SSLs at UF and DF were 1,370±27.4 t and 1,230±22.1 t, respectively (table 3; app. 3). The difference in SSLs shows that about 11 percent (about 140 t) of the SS entering the Fanno Creek study area deposited within the reach.
Suspended-sediment loads for study sites along Fanno Creek, Tualatin River Basin, northwestern Oregon. Refer to table 1 and figure 2 for site details and locations.
Table 3.
Suspended-sediment loads entering and exiting the Fanno Creek and Bronson Creek study reaches in the Tualatin River Basin during water year 2017 (October 2016–September 2017).[Data from U.S. Geological Survey (2020) and Doyle and others (2025). Abbreviation: t, metric tons]
Bronson Creek Study Reach
SSLs were calculated for the Bronson Creek reach from July 1, 2016, through November 29, 2017 (fig. 21A). Like the Fanno Creek reach, SSLs in Bronson Creek were higher in the wetter months (October–April) than in summer months. Estimated monthly SSLs in water year 2017 ranged from 1 to 534 t at UB and 1 to 62 t at DB (fig. 21B). Monthly SSLs were substantially greater at UB than at DB in all months except for July and August 2017. The highest monthly load calculated at UB was in February, and that load was more than eight times greater than at DB. The SSLs at UB and DB in July and August were minimal (less than 2 t at both sites) when streamflow was lowest and resulted in minimal sediment transport.
In water year 2017, approximately 1,600±69 t entered the Bronson Creek study reach and approximately 180±5.8 t exited the study reach, indicating that 89 percent of the sediment entering the Bronson Creek study area was deposited within the reach (table 3; app. 3). The high percentage of deposition is likely a result of floodplain characteristics: (1) an abundance of reed canary grass which increases channel roughness, slowing water velocity and leading to increased deposition (Martinez and McDowell, 2016); (2) change in slope through the reach; (3) depositional and wetland areas; and (4) the presence of several beaver dam complexes within the reach (fig. 3).
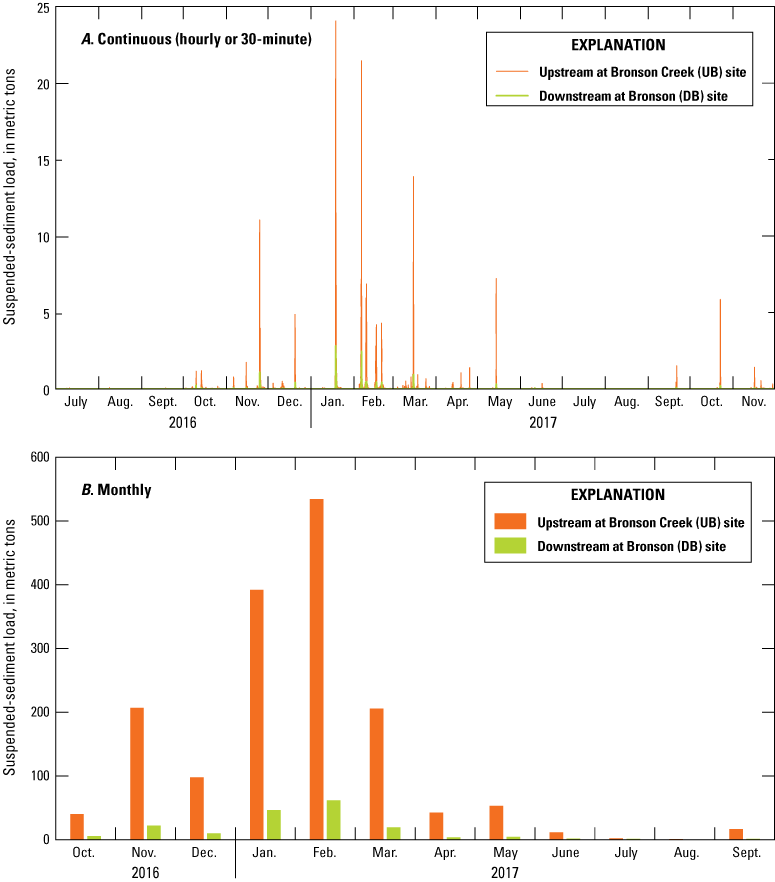
Suspended-sediment loads for study sites along Bronson Creek, Tualatin River Basin, northwestern Oregon. Refer to table 2 and figure 3 for site details and locations.
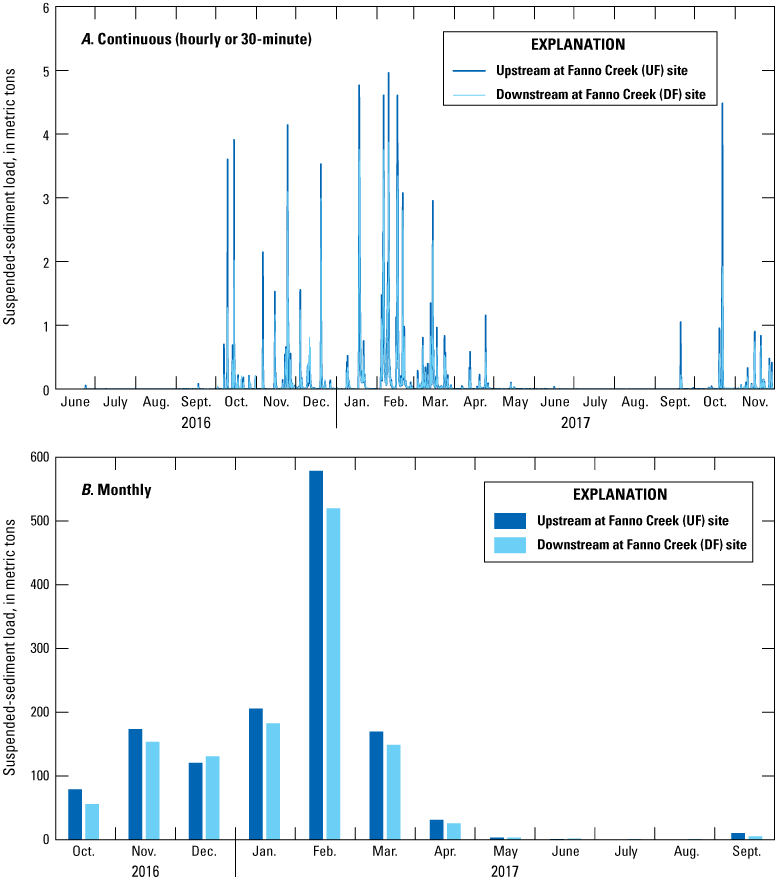
There were notable instances when instantaneous SSLs were substantially greater entering the Bronson Creek study reach compared to the Fanno Creek study reach (fig. 22A). However, moderate to high streamflow events occurred more frequently in the Fanno Creek reach (fig. 22B), owing to the reach’s position in the valley bottom and higher percentage of impervious area (tables 1–2). Although instantaneous loads were sometimes much higher at UB than UF, the magnitude of SSLs entering the two reaches during water year 2017 were comparable owing to the frequency and duration of storm runoff events in Fanno Creek (table 3).
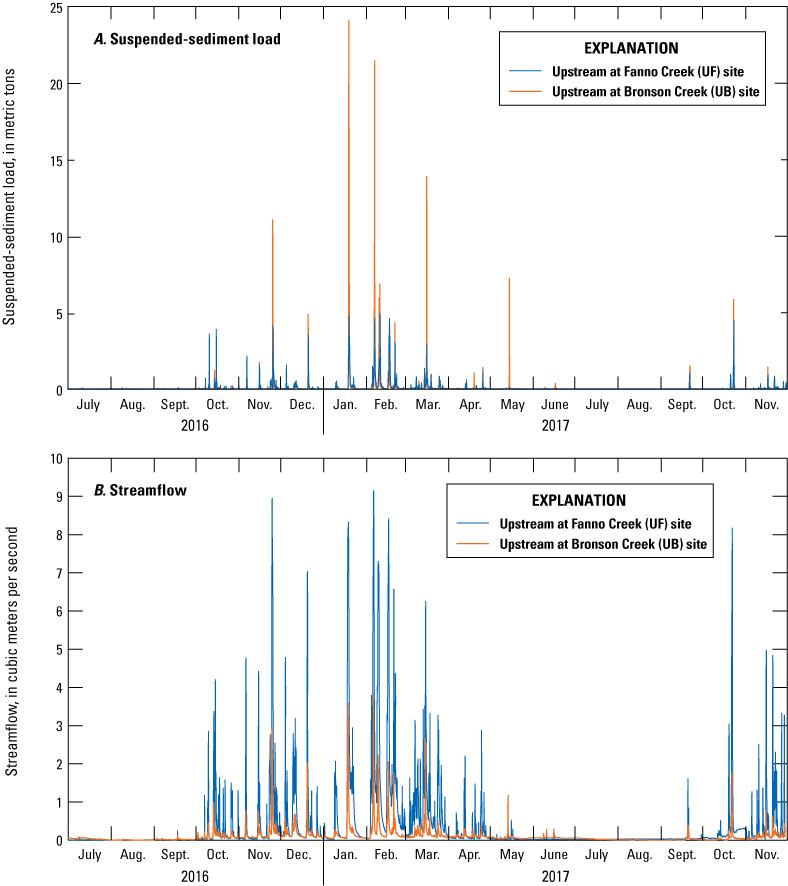
(A) Continuous suspended-sediment loads and (B) continuous streamflow for upstream sites along Bronson Creek and Fanno Creek, Tualatin River Basin, northwestern Oregon, July 2016–November 2017. Refer to tables 1–2 and figures 2–3 for site details and locations.
Sediment Deposition in the South Pond of the Fanno Creek Reach
Sediment deposition was assessed for 4,730 m2 of the south pond, or 60 percent of its wetted area. Sediment depths were 0.24 m on average and reached a maximum depth of 0.44 m (fig. 23). Sediment depths were the greatest in the area upstream from fallen trees in the south pond, where the increased roughness provided by the trees likely reduced stream velocity and increased rates of sediment deposition. Sediment depths generally were less than 0.15 m immediately upstream from the long dam (fig. 2) where beavers were actively excavating sediment in summer 2016. In three locations (with a total area less than 8 m2), sediment depth values were negative, meaning the bed elevation was less than that of the EAR points. These differences are likely caused by a combination of survey error and some localized differences in pond topography that occurred during the 4 months between the original streambed-elevation and EAR surveys. An estimated 250 t of sediment (with an estimated volume of 1,100 m3) were deposited in the eastern part of the south pond between 2012 and 2016.
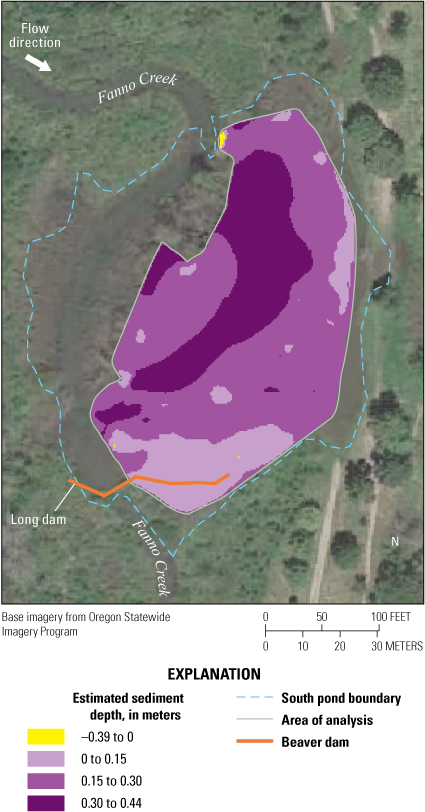
Estimated sediment depths in the eastern part of the south pond along Fanno Creek, Tualatin River Basin, northwestern Oregon. Refer to figure 2 and table 1 for additional descriptions of the monitor locations.
Discussion
Results from this study show that (1) a substantial amount of sediment was deposited along these two beaver-affected reaches, and (2) beaver dams and associated ponds result in reductions in turbidity, SSCs, and SSLs downstream from the two beaver-affected reaches. These findings were expected because beaver dams and ponds store water during peak flows (White and others, 2025b); recharge groundwater through infiltration, elevating the water table and extending the area of riparian habitat and inundation (Bailey and others, 2019); and reduce water velocity, resulting in sediment deposition (Butler and Malanson, 1995; Westbrook and others, 2011). These study results suggest that transported sediment loads and the percentages of deposited sediment vary with reach characteristics, such as reach position in the river network and channel and floodplain morphology. The following are comparisons of findings for the two study reaches and some reach characteristics that explain the measured differences:
-
• Instantaneous SSLs at the upstream reach boundaries were higher at UB compared to UF during storm events. The SSLs computed during storm events (fig. 22A) likely were a result of differences in reach position in the river network, slope at the upstream part of the reach, and their combined effect on water velocity entering the reaches. The Fanno Creek study reach was in the lower gradient and valley bottom portion of the basin, whereas the Bronson Creek study reach was in the upper portion of the basin near its headwaters in the Tualatin Hills (fig. 1). Mean basin slope at the upstream sediment collection locations was 5.75 degrees at UF and 10.2 degrees at FUB (U.S. Geological Survey, 2021). The greater slope at FUB contributed to the higher stream velocities compared to those measured at UF during storm events (apps. 2–3).
-
• The total SSLs entering both reaches during water year 2017 were similar. Although the magnitude of instantaneous SSLs sometimes was substantially greater at UB compared to UF during storm events, streamflow and the frequency of sediment-transport events were greater at UF (fig. 22A–B). Stream responses to storm events were more frequent for the Fanno Creek study reach, owing to the larger upstream contributing area and higher percentage of impervious surface area.
-
• SSLs showed that 89 percent of incoming sediment was deposited in the Bronson Creek study reach compared to 11 percent in the Fanno Creek study reach (table 3). Differences in sediment deposition likely were a result of reach characteristics (such as the number and configuration of beaver dams, stream-floodplain hydraulic connectivity, and vegetation). The continuous turbidity data and estimated sediment volume data for the south pond were helpful in analyzing these differences. Turbidity values at UF and PF were similar, but turbidity decreased substantially between PF and DF during storm events (figs. 13–14). The Fanno Creek reach was a predominantly single-threaded and incised channel except for the south pond and its connection with the Koll Center Wetland at high flows (fig. 2). The decrease in turbidity between PF and DF was attributed to the south pond, a large floodplain pond that formed upstream from a channel-spanning beaver dam and stored more than 250 t of sediment between 2012 and 2016 (fig. 13). In contrast, turbidity and SSC decreased progressively between UB, PB, and DB (figs. 17–18). Although the Bronson Creek study reach lacked a large floodplain pond feature like the south pond, this reach was 670 m longer than the Fanno Creek study reach and seemed to be hydraulically connected with its floodplain, as indicated by sediment deposition on the floodplain in the upper section of the reach after storm events and water-saturated floodplain soils throughout the multi-thread section. The dense reed canary grass in the multi-thread section likely increased channel roughness, slowed water velocity, and caused sediment to drop out of suspension. Based on insights from these sites, we hypothesize that reach characteristics (such as the type of ponds formed by beaver dams [in-channel or floodplain], reach length, vegetation, and hydraulic connections between the stream and floodplain) will affect the relative magnitude of sediment retention in beaver-affected urban streams.
-
• Turbidity downstream from beaver-affected reaches may be elevated during periods of low flows because of bioturbation. Animal activity may have locally increased turbidity at DF, compared to UF and PF, as seen in a diel pattern during low-flow conditions (fig. 15). This animal activity may have occurred in the south pond or between the south pond and the DF water-quality monitor (fig. 2). Turbidity at DB also was higher than UB and PB during low-flow conditions, but diel patterns were not observed in the DB data. Factors that may contribute to elevated turbidity during low flows were not investigated in this study.
The methods used in this study to quantify sediment transport and deposition along these two beaver-affected reaches had several limitations. For example, the continuous turbidity sensors were prone to fouling, and missing data had to be estimated. Because of logistical constraints and a short study duration, only nine suspended-sediment samples were collected at each site during the study period. SSL calculations required the use of multiple regressions with associated uncertainty, with the greatest sources of uncertainty being the relation between SSC and turbidity and streamflow estimates (app. 3). In addition, not all elevation-at-refusal measurements were collected during the streambed-elevation survey, resulting in the exclusion of about 40 percent of the pond surface area from the sediment volume calculations. Despite the study limitations, the results were supported through multiple lines of evidence. Future studies could benefit from increasing the number of SSC samples used to develop the SSC-turbidity correlations, pairing sites with USGS streamgages, and analyzing SS samples for grain size distribution.
Implications for Monitoring and Management
Beaver dams and ponds result in increased sediment deposition because they reduce stream velocity (Butler and Malanson, 1995; Naiman and others, 1986; Pollock and others, 2007; Stout and others, 2017). In this study, beaver dams and ponds decreased downstream turbidity, SSCs, and SSLs during storms in urban stream reaches. Individual beaver dams and ponds may trap substantial amounts of sediment, as indicated by the estimated 250 t trapped by the south pond along Fanno Creek over 4 years. For comparison, Keith and others (2014) reported that Fanno Creek at the Durham station (2.4 km upstream from its confluence with the Tualatin River; USGS streamgage 14206950; U.S. Geological Survey, 2020; fig. 1) had an average annual export of 1,800 t of SS from 2004 to 2013. Annual loads at this station ranged from 1,110 t in water year 2005 to 2,990 t in water year 2006 (Keith and others, 2014). These loads were calculated for a period when beaver dams were present in the Fanno Creek Basin. This comparison indicates that the beaver-created south pond trapped about one-seventh of the average annual SSL moving through the Fanno Creek Basin. Depending on dam size and location relative to the channel and floodplain, multiple beaver dams along the river network would cumulatively trap substantial amounts of sediment.
However, sustained, elevated sediment deposition can have negative implications for aquatic ecosystems. Smith and others (2025) showed that sediment accumulation in the Fanno and Bronson Creeks study reaches leads to decreased dissolved-oxygen concentrations in the water column, likely owing to sediment-oxygen demand (Caldwell and Doyle, 1995; Rounds and Doyle, 1997). Low dissolved-oxygen (DO) concentrations can lead to impaired fish development and maturation, fish mortality, and macroinvertebrate habitat degradation. Low DO conditions are also known to promote the formation of sulfate and nitrate compounds in anoxic waters along with the methylation of mercury (Roy and others, 2009). Additionally, contaminants and nutrients can sorb to fine sediment. A sediment repository may be a sink for contaminants and nutrients (Larsen and others, 2021), and it could be a source for contaminants if the sediment is resuspended and transported downstream during a high-flow event that resulted in dam failure.
Although beaver dams and ponds can store substantial amounts of sediment and reduce SSLs, sediment transport from beaver-affected reaches also occurs during low-flow periods, albeit at a much lower magnitude than transport during storm events. For example, during this study, beavers excavated sediment and modified the topography of the southeastern corner of the south pond in the Fanno Creek study reach (fig. 2). Elevated turbidity was documented at DF during low-flow conditions from June 24 to July 1, 2017 (fig. 15). About 0.2 t of SS exited the reach during that week of elevated turbidity, but SSLs often exceeded 1 t during storm events occurring between October 2016 to April 2017 (fig. 20). Effects of elevated turbidity and SSCs during baseflow conditions are likely to be localized to reaches immediately downstream because of low streamflows.
Sediment also may be released from beaver dams and ponds when dams fail during high-flow events or are breached by humans to minimize potential human-beaver conflicts (such as residential or landscape flooding). During this study, most beaver dams along the Fanno and Bronson Creeks study reaches seemed relatively stable. Exceptions to this stability were the long dam that created the south pond at Fanno Creek (fig. 2), which increased in length during the study, and a small dam upstream from PF, which was notched to reduce flooding of a nearby pedestrian and bike path. After the study concluded, the long dam creating the south pond was removed to reduce flooding of a nearby pedestrian and bike path. In the valley bottoms of the Tualatin River Basin where floodplains are wide and channel gradients are low, the effects of dam failure or breaching on downstream SSLs and turbidity may be temporary and comparable to values during high-flow events. Sediment likely would be mobilized from within the channel and stored temporarily by downstream beaver dams or in other downstream depositional reaches. Vegetation establishment on exposed sediment on the floodplain may form meadows or other riparian habitats (for example, Burchsted and others, 2010; Larsen and others 2021). However, riparian planting efforts may be needed to minimize the establishment of non-native vegetation on the exposed, moist soils after dam failure or breaching. Additional studies could assess the geomorphic and biological effects of removing or breaching beaver dams or the effects of beaver-management strategies, such as pond levelers, on sediment transport and deposition. For example, studies on removing or breaching beaver dams could estimate the volume of released sediment, identify factors that influence the magnitude of released sediment (such as streamflow conditions during removal or breaching), and assess riparian and aquatic habitat responses.
Conclusions
This study investigated the effects of natural beaver dams and ponds on sediment transport and deposition during 2016–17 along two urban stream reaches with multiple beaver dams. Methods included (1) calculating suspended-sediment loads (SSLs) using relations between discrete suspended-sediment samples and streamflow measurements made during storms and baseflow periods, (2) comparing continuous turbidity data to examine seasonal and longitudinal patterns along the reaches, and (3) estimating the volume and mass of sediment deposited in a large pond along the Fanno Creek study reach. Findings include (1) a greater magnitude of computed SSLs entering the Bronson Creek study reach, but a greater frequency of sediment transport events for the Fanno Creek study reach, (2) greater sediment capture along the Bronson Creek study reach compared to the Fanno Creek study reach, (3) reductions in turbidity along both study reaches, and (4) storage of approximately 1,100 cubic meters of sediment (or an estimated 250 t) from 2012 to 2016 in a portion of the south pond in the Fanno Creek study reach.
Within the Tualatin River Basin, urban streams are in the valley bottoms and tend to be locations of sediment deposition, owing to their low channel gradients and wide floodplains. Beaver dams and ponds along these streams can reduce SSLs and turbidity and store sediment. The magnitude of these reductions and sediment storage will depend on reach characteristics, including the types of beaver ponds (in-channel or floodplain ponds), stream-floodplain hydraulic connections, vegetation, and reach location within the watershed. Incorporating beaver dams and their effects on SSLs in habitat restoration will require consideration of benefits such as increased diversity of water depths and velocities.
References Cited
Anderson, C.W., 2007, Influence of Cougar Reservoir drawdown on sediment and DDT transport and deposition in the McKenzie River Basin, Oregon, water years 2002–04: U.S. Geological Survey Scientific Investigations Report 2007–5164, 42 p. [Also available at https://doi.org/10.3133/sir20075164.]
Bailey, D.R., Dittbrenner, B.J., and Yocom, K.P., 2019, Reintegrating the North American beaver (Castor canadensis) in the urban landscape, WIREs Water, v 6, no. 1, 15p. p. accessed June 26, 2024, at https://doi.org/10.1002/wat2.1323.
Booth, D.B., 1990, Stream-channel incision following drainage-basin urbanization: Water Resources Bulletin, v. 26, no. 3, 407–417 p., accessed September 23, 2021, at https://onlinelibrary.wiley.com/doi/abs/10.1111/j.1752-1688.1990.tb01380.x.
Bouwes, N., Weber, N., Jordan, C., Jordan C., Sanders W., Tattam I., Volk C., Wheaton J., and Pollock M., 2016, Ecosystem experiment reveals benefits of natural and simulated beaver dams to a threatened population of steelhead (Oncorhynchus mykiss): Scientific Reports, v. 6, 12 p., accessed September 8, 2021, at https://doi.org/10.1038/srep28581.
Carpenter W., Goodwiller B., Wren G., Taylor J., AuBuchon J., and Brown J., 2022, Field testing high-frequency acoustic attenuation system for measuring, fine suspended sediments and algal movements: Applied Acoustics, v. 198, article 108980, accessed June 26, 2024, at https://doi.org/10.1016/j.apacoust.2022.108980.
Chanson, H., Takeuchi, M., and Trevethan, M., 2008, Using turbidity and acoustic backscatter intensity as surrogate measures of suspended sediment concentration in a small subtropical estuary: Journal of Environmental Management, v. 88, no. 4, p. 1406–1416, accessed February 17, 2017, at https://doi.org/10.1016/j.jenvman.2007.07.009.
Chen, J., and Chang, H., 2019, Dynamics of wet season turbidity in relation to precipitation, streamflow, and land cover in three urbanizing watersheds, Oregon: River Research and Applications, v. 35, no. 7, p. 892–904, accessed September 19, 2021, at https://doi.org/10.1002/rra.3487.
Doyle, M.C., Smith, C.D., Jones, K.L., and Costello, A.E., 2025, Computed and estimated streamflow in Bronson and Fanno Creeks, OR, 2016–2017, U.S. Geological Survey data release, https://doi.org/10.5066/P9SPNYKJ.
Emerson, D.G., Vecchia, A., and Dahl, A.L., 2005, Evaluation of drainage-area ratio method used to estimate streamflow for the Red River of the North Basin, North Dakota and Minnesota: U.S. Geological Survey Scientific Investigations Report 2005–5017, 13 p., accessed December 13, 2024, at https://doi.org/10.3133/sir20055017.
Giriat, D., Gorczyca, E., and Sobucki, M., 2016, Beaver ponds’ impact on fluvial processes (Beskid Nidki Mts., SE Poland): Science of the Total Environment, v. 544, p. 339–353, accessed September 24, 2020, at https://doi.org/10.1016/j.scitotenv.2015.11.103.
Gurnell, A.M., 1998, The hydro geomorphological effects of beaver dam-building activity: Progress in Physical Geography, v. 22, no. 2, p. 167–189, accessed September 8, 2021, at https://doi.org/10.1177/030913339802200202.
Jones, K.L., Leahy, E.K., and Costello, A.E., 2025, Elevation data to support estimations of stored sediment depths and volume in a beaver pond along Fanno Creek, western Oregon, 2016: U.S. Geological Survey data release, https://doi.org/10.5066/P13FZKVG.
Larsen, A., Larsen, J.R., and Lane, S.N., 2021, Dam builders and their works—Beaver influences on the structure and function of river corridor hydrology, geomorphology, biogeochemistry and ecosystems: Earth-Science Reviews, v. 218, 46 p. accessed December 21, 2021, at https://doi.org/10.1016/j.earscirev.2021.103623.
Majerova, M., Neilson, B., Schmadel, N., Wheaton, J., and Snow, C., 2015, Impacts of beaver dams on hydrologic and temperature regimes in a mountain stream: Hydrology and Earth System Sciences, v. 19, no. 8, p. 3541–3556, accessed, September 8, 2021, at https://doi.org/10.5194/hess-19-3541-2015.
Martinez, A.E., and McDowell, P.F., 2016, Invasive reed canarygrass (Phalaris arundinacea) and native vegetation channel roughness: Invasive Plant Science and Management, v. 9, no. 1, p. 12–21, accessed December 13, 2024, at https://doi.org/10.1614/IPSM-D-15-00046.1.
Metro, 2014, Urban growth boundary: Oregon Metro Regional Land Information System geographic information system (GIS) data, accessed June 2018, at https://www.arcgis.com/home/item.html?id=e3a9453a1ce547a7b2ee4baac037540e.
Pollock, M.M., Lewallen, G.M., Woodruff, K., Jordan, C.E., and Castro, J.M., eds., 2018, The beaver restoration guidebook—Working with beaver to restore streams, wetlands, and floodplains (version 2.01): U.S. Fish and Wildlife Service, Portland, Oregon, 218 p., accessed, July 25, 2019, at https://www.fws.gov/oregonfwo/ToolsForLandowners/RiverScience/Beaver.asp.
Poor, E., 2018, Effects of beaver dams on urban stream hydraulic response during storm events: Portland, Oregon, Portland State University, Master of Environmental Management project report, 4-2018, 43 p., accessed September 29, 2021, at https://doi.org/10.15760/mem.8.
Puttock, A., Graham, H.A., Cunliffe, A.M., Elliott, M., and Brazier, R.E., 2017, Eurasian beaver activity increases water storage, attenuates flow and mitigates diffuse pollution from intensively-managed grasslands: Science of the Total Environment, v. 576, p. 430–443, accessed June 2, 2023, at https://doi.org/10.1016/j.scitotenv.2016.10.122.
Rantz, S.E., 1982, Measurement and computation of streamflow: U.S. Geological Survey Water-Supply Paper 2175, accessed December 13, 2024, at https://doi.org/10.3133/wsp2175.
Rasmussen, T.J., Lee, C.J., and Ziegler, A.C., 2008, Estimation of constituent concentrations, loads, and yields in streams of Johnson County, northeast Kansas, using continuous water-quality monitoring and regression models, October 2002 through December 2006: U.S. Geological Survey Scientific Investigations Report 2008–5014, 103 p.
Richards, K.D., Scudder, B.C., Fitzpatrick, F.A., Steuer, J.J., Bell, A.H., Peppler, M.C., Stewart, J.S., and Harris, M.A., 2010, Effects of urbanization on stream ecosystems along an agriculture-to-urban land-use gradient, Milwaukee to Green Bay, Wisconsin, 2003–2004: U.S. Geological Survey Scientific Investigations Report 2006–5101–E, 210 p.
Risley, J.C., and Doyle, M.C., 1996, Water-temperature, specific-conductance, and meteorological data for the Tualatin River Basin, Oregon, 1994–95: U.S. Geological Survey Open-File Report 96–315, 124 p. [Also available at https://doi.org/10.3133/ofr96315.]
Santora, A.J., 2017, Stream sedimentation patterns in an urban beaver system—Fanno Creek, Oregon: Portland, Oregon, Portland State University, Geography Masters Research Papers, v. 21, 41 p., accessed September 20, 2021, at https://pdxscholar.library.pdx.edu/cgi/viewcontent.cgi?article=1020&context=geog_masterpapers.
Schenk, L.N., and Bragg, H.M., 2014, Assessment of suspended-sediment transport, bedload, and dissolved oxygen during a short-term drawdown of Fall Creek Lake, Oregon, winter 2012–13: U.S. Geological Survey Open-File Report 2014–1114, 80 p., accessed September 19, 2021, at https://pubs.er.usgs.gov/publication/ofr20141114.
Smith, C.D., 2017, Beaver dam locations and beaver activity in the Tualatin Basin, Oregon (ver. 2.0, November 2019): U.S. Geological Survey data release, accessed September 23, 2021, at https://doi.org/10.5066/F7PZ57QP.
Smith, K., and Ory, J., 2005, Healthy streams plan: Hillsboro, Oregon, Clean Water Services, 59 p., accessed April 8, 2020, at https://www.ci.oswego.or.us/sites/default/files/archives/projects/planningprojects/PP09-0011_Sensitive_Lands_Outreach/Second_Look_Task_Force/12-17-09_ Packet_Part-4_Healthy_Streams_Plan.pdf.
Smith, C.D., Leahy, E.K., Jones, K.L., and Rounds, S.A., 2025, Effects of beaver dams and ponds on water quality in urban streams of the Tualatin River Basin, northwestern Oregon, chap. D of Jones, K.L., and Smith, C.D., eds., Beavers in the Tualatin River Basin, northwestern Oregon: U.S. Geological Survey Scientific Investigations Report 2025–5039–D, 48 p., https://doi.org/10.3133/sir20255039D.
Sobieszczyk, S., Bragg, H.M., and Uhrich, M.A., 2015, Water-quality conditions and suspended-sediment transport in the Wilson and Trask Rivers, northwestern Oregon, water years 2012–14: U.S. Geological Survey Scientific Investigations Report 2015–5109, 32 p., accessed February 12, 2018, at https://doi.org/10.3133/sir20155109.
Sobieszczyk, S., Jones, K.L., Rounds, S.A., Nilsen, E.B., and Morace, J.L., 2018, Prioritization framework for ranking riverine ecosystem stressors using example sites from the Tualatin River Basin, Oregon: U.S. Geological Survey Scientific Investigations Report 2018–5153, 40 p., accessed June 24, 2020, at https://doi.org/10.3133/sir20185153.
Stonewall, A.J., and Bragg, H.M., 2012, Suspended-sediment characteristics of the Johnson Creek Basin, Oregon, water years 2007–10: U.S. Geological Survey Scientific Investigations Report 2012–5200, 42 p., accessed January 18, 2022, at https://doi.org/10.3133/sir20125200.
Stout, T.L., Majerova, M., and Neilson, B.T., 2017, Impacts of beaver dams on channel hydraulics and substrate characteristics in a mountain stream: Ecohydrology, v. 10, no. 1, p. 10, accessed September 9, 2021, at https://doi.org/10.1002/eco.1767
Topping, J., 1972, Errors of observation and their treatment (4th ed.): London, United Kingdom, Chapman and Hall, 119 p., accessed March 28, 2021, at https://doi.org/10.1007/978-94-011-6928-8.
Turnipseed, D.P., and Sauer, V.B., 2010, Discharge measurements at gaging stations: U.S. Geological Survey Techniques and Methods, book 3, chap. A8, 87 p. [Also available at https://doi.org/10.3133/tm3A8.]
U.S. Census Bureau, 2020, QuickFacts—Washington County, Oregon: U.S. Census Bureau website, accessed January 25, 2021, at https://www.census.gov/quickfacts/washingtoncountyoregon.
U.S. Geological Survey, 2011, National land cover 2006 statistics: Multi Resource Land Consortium database, accessed January 6, 2018, at https://www.mrlc.gov/data/statistics/national-land-cover-database-2006-nlcd2006-statistics.
U.S. Geological Survey, 2020, USGS water data for the Nation: U.S. Geological Survey National Water Information System database, accessed November 12, 2020, at https://doi.org/10.5066/F7P55KJN.
U.S. Geological Survey, 2021, The StreamStats program: U.S. Geological Survey web page, accessed October 7, 2021, https://www.usgs.gov/mission-areas/water-resources/science/streamstats/.
Wagner, R.J., Boulger, R.W., Jr., Oblinger, C.J., and Smith, B.A., 2006, Guidelines and standard procedures for continuous water-quality monitors—Station operation, record computation, and data reporting: U.S. Geological Survey Techniques and Methods, book 1, chap. D3, accessed September 10, 2018, at https://pubs.water.usgs.gov/tm1d3.
Westbrook, C.J., Cooper, D.J., and Baker, B.W., 2011, Beaver assisted river valley formation: River Research and Applications, v. 27, no. 2, p. 246–256, accessed September 13, 2022, at https://doi.org/10.1002/rra.1359.
White, J.S., 2025, Hydraulic models of two beaver affected reaches in the Tualatin Basin, Oregon: U.S. Geological Survey data release, https://doi.org/10.5066/P1VZGC3Z.
White, J.S., Smith, C.D., Jones, K.L., and Rounds, S.A., 2025a, Stream network capacity to support beaver dams in the Tualatin River Basin, northwestern Oregon, chap. A of Jones, K.L., and Smith, C.D., eds., Beavers in the Tualatin River Basin, northwestern Oregon: U.S. Geological Survey Scientific Investigations Report 2025–5039–A, 20 p., https://doi.org/10.3133/sir20255039A.
White, J.S., Jones, K.L., and Rounds, S.A., 2025b, Effects of beaver dams and ponds on hydrologic and hydraulic responses of storm flows in urban streams of the Tualatin River Basin, northwestern Oregon, chap. B of Jones, K.L., and Smith, C.D., eds., Beavers in the Tualatin River Basin, northwestern Oregon: U.S. Geological Survey Scientific Investigations Report 2025–5039–B, 38 p., https://doi.org.10.3133/sir20255039B.
Wohl, E., Castro, J., Cluer, B., Merritts, D., Powers, P., Staab, B., and Thorne, C., 2021, Rediscovering, reevaluating, and restoring lost river-wetland corridors: Frontiers in Earth Science, v. 9, p. 21, accessed September 21, 2021, at https://doi.org/10.3389/feart.2021.653623.
Appendix 1. Quality Assurance for Suspended-Sediment Samples
Table 1.1.
Results and comparisons of primary and replicate suspended-sediment samples, Tualatin River Basin, northwestern Oregon.[Refer to figures 2 and 3 and tables 1 and 2 for site locations and information. Site abbreviation: FUB, Farther Upstream at Bronson (National Water Information System [NWIS] site Bronson Creek at NW Laidlaw Road); DB, Downstream at Bronson Creek (NWIS site Bronson Creek above Northwest Kaiser Road); UF, Upstream at Fanno Creek (NWIS site Fanno Creek at Greenway Park, at Southwest Hall Boulevard; DF, Downstream at Fanno Creek (NWIS site Fanno Creek at Greenway Park, near Southwest Pearson Court). Sample type: Primary, suspended-sediment concentration sample result from laboratory analysis; Replicate, sample collected for comparison to primary used to determine laboratory analytical reproducibility. (U.S. Geological Survey, 2020). Abbreviations: SSC, suspended-sediment concentration; hh:mm, hours, minutes; mg/L, milligrams per liter; RPD, relative percent difference; --, not applicable]
Appendix 2. Supplemental Data for Discrete Suspended-Sediment Samples
Table 2.1.
Supporting information for nine suspended-sediment samples collected Upstream at Fanno Creek, Tualatin River Basin, northwestern Oregon.[Refer to table 1 and figure 2 for site details and location. Abbreviations: FNU, formazin nephelometric units; SSC, suspended-sediment concentration; m3/s, cubic meter per second; mg/L, milligram per liter; m, meter; m/s, meter per second; F, falling; R, rising; NA, no data available]
Table 2.2.
Supporting information for nine suspended-sediment samples collected Downstream at Fanno Creek, Tualatin River Basin, northwestern Oregon.[Refer to table 1 and fig. 2 for site details and location. Abbreviations: FNU, formazin nephelometric units; SSC, suspended-sediment concentration; m3/s, cubic meter per second; mg/L, milligram per liter; m, meter; m/s, meter per second; F, falling; R, rising; NA, no data available]
Table 2.3.
Supporting information for suspended-sediment samples collected Farther Upstream at Bronson Creek, Tualatin River Basin, northwestern Oregon.[Refer to table 2 and fig. 3 for site details and location. Abbreviations: *, additional sample; FNU, formazin nephelometric units; SSC, suspended-sediment concentration; m3/s, cubic meter per second; mg/L, milligram per liter; m/s, meter per second; m, meter; NA, no data available; F, falling; R, rising]
Table 2.4.
Supporting information for nine suspended-sediment samples collected Downstream at Bronson Creek, Tualatin River Basin, northwestern Oregon.[Refer to table 2 and figure 3 for site details and location. Abbreviations: FNU, formazin nephelometric units; SSC, suspended-sediment concentration; m3/s, cubic meter per second; mg/L, milligram per liter; m/s, meter per second; m, meter; F, falling; R, rising; NA, no data available]
Appendix 3. Estimating Uncertainty Through the Sediment-Load Calculations
Methods
In the following analysis, error terms are either positive or negative and may sometimes negate other error. Total overall error values are represented statistically as a standard deviation, thus recognizing that (1) error for any individual part of the calculation or subsection of the time series could be larger or smaller, and (2) some errors may reinforce or cancel each other depending on the direction of each source of error (positive or negative). An assumption when quantifying error using the root mean square error propagation approach (eq. 3.1; Topping, 1972) is that the sources of error (table 3.1) are independent. Equation 3.1 was used to represent the probable overall error in the sub-daily load computations, and equation 3.2 was used to estimate uncertainty for the annual loads.
Table 3.1.
Sources of error in the sub-daily and annual estimates of suspended-sediment load for the Fanno and Bronson Creek study reaches, Tualatin River Basin, northwestern Oregon.[Refer to tables 1–2 and figs. 2–3 for site details and locations. Abbreviations: UF, Upstream at Fanno Creek site; DF, Downstream at Fanno Creek site; FUB/UB, Farther Upstream at Bronson Creek and Upstream at Bronson Creek sites; DB, Downstream at Bronson Creek site]
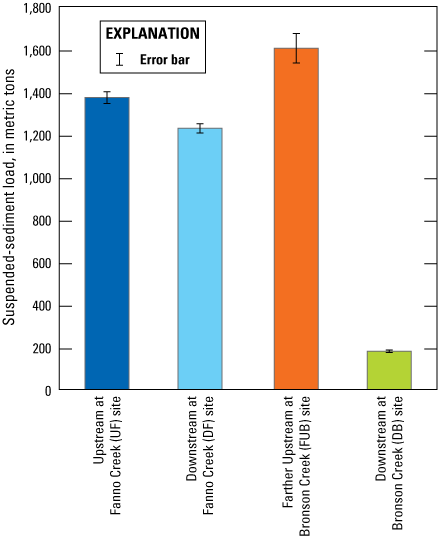
Graph showing suspended-sediment loads and error at the upstream and downstream study sites along beaver-affected reaches, Tualatin River Basin, northwestern Oregon, water year 2017 (October 2016–September 2017). Refer to tables 1–2 and figures 2–3 for site details and locations.
EP
is the probable overall error in the sub-daily load computations,
n
is the number of sources of error, and
Ei
is the error from each source.
Eannual
is the probable error in the annual load computation,
Ep
is the probable overall error in the sub-daily load computations, and
Ldaily
is the daily load.
Sources of Error
An examination of the sampling and measurement methods of collecting data, and the calculations required to compute suspended loads from those data, indicates the following potential sources of error in the daily computations:
-
1. Suspended-sediment sampling and laboratory analyses. Eight replicate samples were collected concurrently with primary samples (app. 1). The percent error between the primary and replicate samples includes the error associated with sampling and laboratory reproducibility. The percent error determined (6.4 percent) was applied for all four sites.
-
2. Sensor accuracy. YSI 6-series turbidity sensors (Yellow Springs Instruments, Inc. [YSI], Yellow Springs, Ohio) have a reported accuracy of ±2.0 percent.
-
3. Accuracy of turbidity standard. Hach StablCal formazin standards are verified at the U.S. Geological Survey (USGS) Hydrologic Instrumentation Facility and have an accuracy of ±5.0 percent.
-
4. Sampling during rapidly changing conditions. Suspended-sediment samples usually were collected on the rising or falling limb of the hydrograph as conditions were rapidly changing. An error of 1.0 percent was estimated to account for the streamflow and suspended-sediment variability that may have occurred during the time required to collect the sample.
-
5. Timing of sensor drift corrections. Turbidity sensor drift was quantified multiple times throughout the study and corrections were applied to the raw data to compute the final time-series turbidity datasets. However, USGS protocols assume that drift occurs linearly from site visit to site visit. Information is not available to verify this assumption regarding the timing of sensor drift between site visits. The drift corrections (as percentages ranging from 1.6 to 7.0 percent) applied at each site during the study were averaged to determine this site-specific percent error.
-
6. Models relating SSC and turbidity. Linear regression models were developed to relate measured suspended-sediment concentrations to turbidity values recorded at the sites (figs. 9–10). For each model, residuals were expressed as percentages, and then the standard deviation of the distribution of those percent errors was calculated.
-
7. Models filling gaps in continuous turbidity data. At each site where suspended-sediment loads were calculated (UF, DF, UB, DB), two models were used to fill gaps in the continuous turbidity data. The error associated with each model only applies to the time periods in which missing data were filled with that model.
-
a. UF:
-
i. Model relating UF turbidity and PF turbidity (fig. 7A) filled gaps that accounted for 7.2 percent of the sediment load calculated at UF. The model had an estimated 41.3-percent error. A 3.0-percent error (0.072×0.413) was added to this process for UF to account for this gap-filling model.
-
ii. Model relating UF turbidity and DF turbidity (fig. 7B) filled gaps that accounted for 0.7 percent of the sediment load calculated at UF. The model had an estimated 100- percent error. A 0.7-percent error (0.007×1.00) was added to this process for UF to account for this gap-filling model.
-
-
b. DF:
-
i. Model relating DF turbidity and PF turbidity (fig. 7C) filled gaps that accounted for 1.3 percent of the sediment load calculated at DF. The model had an estimated 41.8-percent error. A 0.5-percent error (0.013× 0.418) was added to this process for DF to account for this gap-filling model.
-
ii. Model relating DF turbidity and UF turbidity (fig. 7D) filled gaps that accounted for 3.1 percent of the sediment load calculated at DF. The model had an estimated 41.0-percent error. A 1.3-percent error (0.031×0.41) was added to this process for DF to account for this gap-filling model.
-
-
c. UB:
-
i. Model relating UB turbidity and PB turbidity (fig. 8A) filled gaps that accounted for 33.1 percent of the sediment load calculated at UB. The model had an estimated 54.8-percent error. An 18.1-percent error (0.331×0.548) was added to this process for UB to account for this gap-filling model.
-
ii. Model relating UB turbidity and DB turbidity (fig. 8B) filled gaps that accounted for 0.1 percent of the sediment load calculated at UB. The model had an estimated 237-percent error. A 0.2-percent error (0.001×2.37) was added to this process for UB to account for this gap-filling model.
-
-
d. DB:
-
i. Model relating DB turbidity and PB turbidity (fig. 8C) filled gaps that accounted for 4.2 percent of the sediment load calculated at DB. The model had an estimated 62.8-percent error. A 2.6-percent error (0.042×0.628) was added to this process for DB to account for this gap-filling model.
-
ii. Model relating DB turbidity and UB turbidity (fig. 8D) filled gaps that accounted for 1.2 percent of the sediment load calculated at DB. The model had an estimated 59.1-percent error. A 0.7-percent error (0.012×0.591) was added to this process for DB to account for this gap-filling model.
-
-
-
8. Models relating measured and computed streamflow.
-
a. A streamflow rating curve was developed for UF, and then the drainage-area ratio method (DARM) was used to computed DF streamflow from the continuous UF streamflow. Model error was calculated from observed and predicted values that were greater than 0.03 m3/s (1 ft3/s). The streamflow rating curve had an estimated 23.8-percent error for UF, and the DARM had an estimated 11.5-percent error for DF.
-
b. A streamflow rating curve was developed for DB, and then DARM was used to computed FUB streamflow from the continuous DB streamflow. Model error was calculated from observed and predicted values that were greater than 0.03 m3/s (1 ft3/s). The streamflow rating curve had an estimated 26.5-percent error for DB, and the DARM had an estimated 39.2-percent error for FUB.
-
Results of Probable Error Computations
Probable overall error for sub-daily load computations were comparable for DF and DB at 56.4 and 52.3 percent, respectively (table 3.1). Probable overall error for sub-daily load computations was 59.8 percent for UF and 69.4 percent for FUB/UB. For all sites, most of the error in the sub-daily load calculations were a result of the regression models relating SSC to turbidity (table 3.1). The second greatest source of error was the relations used to develop continuous estimates of streamflow for the reaches. Error associated with the relation between SSC and turbidity could be reduced by collecting additional suspended-sediment samples. Error associated with streamflow could be minimized by using continuous hourly streamflow data from a USGS streamgage, which typically has a presumed uncertainty of 5 percent.
Probable overall error for the annual load computations ranged from 1.8 to 4.3 percent (table 3.1). Suspended-sediment loads calculated at the four sites for water year 2017 are shown with the estimated errors in figure 3.1.
Conversion Factors
International System of Units to U.S. customary units
Datums
Vertical coordinate information is referenced to the North American Vertical Datum of 1988 (NAVD 88) unless otherwise noted.
Horizontal coordinate information is referenced to the North American Datum of 1983 (NAD 83).
Elevation, as used in this report, refers to distance above the vertical datum.
Supplemental Information
Concentrations of chemical constituents in water are given in milligrams per liter (mg/L).
A water year is the 12-month period from October 1, for any given year, through September 30 of the following year. The water year is designated by the calendar year in which it ends.
Abbreviations
ANCOVA
Analysis of Covariance
DARM
drainage-area ratio method
DB
Downstream at Bronson Creek
DF
Downstream at Fanno Creek
EAR
elevation-at-refusal
EWI
equal width increment
FNU
formazin nephelometric unit
FUB
Farther Upstream at Bronson Creek
GPS
Global Positioning System
MAE
mean absolute error
NWIS
(USGS) National Water Information System
OLS
ordinary least squares
n
sample size
p
probability value
PB
Ponded at Bronson Creek
PF
Ponded at Fanno Creek
QA
quality assurance
RTN
Real-Time Network
R2
coefficient of determination
SS
suspended sediment
SSC
suspended-sediment concentration
SSL
suspended-sediment load
UB
Upstream at Bronson Creek
UF
Upstream at Fanno Creek
USGS
U.S. Geological Survey
YSI
Yellow Springs Instruments, Inc.
For information about the research in this report, contact
Director, Oregon Water Science Center
U.S. Geological Survey
601 SW 2nd Avenue, Suite 1950
Portland, Oregon 97204
https://www.usgs.gov/centers/oregon-water-science-center
Manuscript approved on April 24, 2025
Publishing support provided by the U.S. Geological Survey
Science Publishing Network, Tacoma Publishing Service Center
Edited by John Osias, Nathan Severance, and Esther Pischel
Illustration support by Teresa A. Lewis and JoJo Mangano
Layout and design by Luis Menoyo and JoJo Mangano
Disclaimers
Any use of trade, firm, or product names is for descriptive purposes only and does not imply endorsement by the U.S. Government.
Although this information product, for the most part, is in the public domain, it also may contain copyrighted materials as noted in the text. Permission to reproduce copyrighted items must be secured from the copyright owner.
Suggested Citation
Doyle, M.C., Smith, C.D., Jones, K.L., and Costello, A.E., 2025, Effects of beaver dams and ponds on the transport and deposition of suspended sediment in urban streams of the Tualatin River Basin, northwestern Oregon, chap. C of Jones, K.L., and Smith, C.D., eds., Beavers in the Tualatin River Basin, northwestern Oregon: U.S. Geological Survey Scientific Investigations Report 2025–5039–C, 41 p., https://doi.org/10.3133/sir20255039C.
ISSN: 2328-0328 (online)
Study Area
| Publication type | Report |
|---|---|
| Publication Subtype | USGS Numbered Series |
| Title | Effects of beaver dams and ponds on the transport and deposition of suspended sediment in urban streams of the Tualatin River Basin, northwestern Oregon |
| Series title | Scientific Investigations Report |
| Series number | 2025-5039 |
| Chapter | C |
| DOI | 10.3133/sir20255039C |
| Publication Date | September 30, 2025 |
| Year Published | 2025 |
| Language | English |
| Publisher | U.S. Geological Survey |
| Publisher location | Reston, VA |
| Contributing office(s) | Oregon Water Science Center |
| Description | Report: x, 41 p.; 3 Data Releases |
| Country | United States |
| State | Oregon |
| Other Geospatial | Tualatin River Basin |
| Online Only (Y/N) | Y |