

Factors Affecting the Distribution of Water-Bearing Fractures in the Bedrock Aquifers of West Virginia
Links
- Document: Report (23.4 MB pdf) , HTML , XML
- Data Release: USGS data release - Data from 126 logged groundwater wells analyzed to assess geologic, topographic, and physiographic controls on the occurrence and distribution of fractures and transmissivity of water-bearing fractures in West Virginia
- NGMDB Index Page: National Geologic Map Database Index Page
- Download citation as: RIS | Dublin Core
Acknowledgments
The U.S. Geological Survey would like to acknowledge Brian A. Carr, currently employed by the West Virginia Department of Health and Human Resources but was employed by the West Virginia Department of Environmental Protection at the time the project was funded, and Patrick V. Campbell (retired) of the West Virginia Department of Environmental Protection for their assistance in and dedication to funding the multi-year effort resulting in the publication of this report. This study would not have been possible without their long-term support.
Abstract
Bedrock aquifers cover 23,601 square miles within the State of West Virginia and comprise 97.4 percent of the surficial area within the State; the remaining 2.6 percent (621 square miles) consists of alluvial sand-and-gravel and glacial outwash aquifers bordering the State’s major rivers. While West Virginia’s alluvial aquifers have been studied extensively, bedrock aquifers have only been characterized for studies completed in a few areas in Jefferson, McDowell, and Monroe Counties. Bedrock aquifers are water supplies for public supply, agriculture, industry, and residential homeowner use. In this study, the U.S. Geological Survey, in cooperation with the West Virginia Department of Environmental Protection Division of Water and Waste Management, provides a statewide assessment of the occurrence and distribution of fractures within bedrock aquifers of the State and the various topographic, physiographic, and lithologic influences controlling the occurrence and distribution of bedrock fractures. The results of this study provide an increased understanding of the distribution of fractures in bedrock aquifers in West Virginia and help to verify trends that have been suspected for many years but were never well documented or verified by data.
The results confirmed that the density of fractures and those that were determined to be water bearing decrease significantly with depth. A statistically significant difference in the density of fractures was observed at a depth of 215 feet for wells in the Appalachian Plateaus Physiographic Province’s and in the Valley and Ridge Physiographic Province’s aquifers; a higher density of fractures and water-bearing fractures were above a depth of 215 feet than below that depth. This is an important consideration when drilling wells for residential, commercial, industrial, or agricultural water supply.
Abandoned underground coal mines are commonly believed to form large pools of water in the interconnected mine entries in abandoned room and pillar coal mines. Such pools of water can and do exist in abandoned underground coal mines, but many mines lack open entries and are held up by overburden strata and pillars that can collapse and form aquifers comprised of vast interconnected rubble zones (gob), especially in older mines.
Data assessed for this study showed that shale-corrected values of effective porosity for limestone aquifers in West Virginia had a median value of 2 percent and an average value of 4 percent and generally are mineralized with low effective porosity. Argillaceous or sandy limestone has a median shale-corrected porosity of 4 percent and an average shale-corrected porosity of 5 percent. The median and average shale-corrected porosity of sandstone aquifers was estimated to be 14 percent, but the median shale-corrected porosity for argillaceous or calcareous sandstone was 5 percent and the average shale-corrected porosity for argillaceous or calcareous sandstone was 6 percent. Even though shale has a relatively high total sonic porosity compared to other lithologies, shale and siltstone had relatively low shale-corrected porosity, ranging from 0 to 2 percent.
Well yields were previously documented to be highest in valley settings, lowest on hilltops, and intermediate on hillsides. Transmissivity data provided by this study confirm this general pattern within the Appalachian Plateaus Province; however, the Valley and Ridge Province does not follow this pattern. While still lowest on hilltop settings, the highest well yields were in hillside settings. The trend for the Valley and Ridge Province was likely skewed because of 9 high-yield wells specifically targeting deeper thin limestone units, such as the Tonoloway and Helderberg Limestones, at depths with transmissivity in excess of 2,000 feet squared per day in Mineral County, West Virginia, or targeting karst aquifers in Berkeley, Jefferson, or Greenbrier Counties, West Virginia.
Finally, water-bearing fractures have been hypothesized to comprise a small number of all fractures within a typical bedrock well in West Virginia. Data collected for this study support this theory. A total of 3,403 fractures were identified during this study; 3,151 (92.6 percent) of those fractures are low-transmissive, and only 252 (7.4 percent) fractures are water-bearing. Even though a well may contain many fractures, less than 8 percent are considered water-bearing fractures.
Introduction
Bedrock aquifers comprise more than 97 percent of West Virginia; the remaining area is underlain by alluvial and glacial outwash aquifers along the State’s major rivers. West Virginia’s bedrock aquifers and factors influencing the distribution of water-bearing fractures are the focus of this study. Alluvial and glacial aquifers in West Virginia were assessed in previous studies (Kozar and McCoy, 2004; McAdoo and Connock, 2024; McAdoo, 2024; Carlston and Graeff, 1956; Cross and Schemel, 1956).
The West Virginia Groundwater Protection Act (West Virginia Legislature, 2023) catalyzed this study. This Act authorized the West Virginia Department of Environmental Protection, Bureau for Public Health, and the Department of Agriculture to “encourage, participate in, or conduct or cause to be conducted studies, scientific or other investigations, research, experiments and demonstrations relating to the maintenance and protection of groundwater, and to collect data with respect thereto, all as may be deemed advisable and necessary to carry out the purposes of this article, and to make reports and recommendations” (West Virginia Legislature, 2023, section 22-12-6, subsection c3). This act also provided authorization “to conduct groundwater sampling, data collection, analyses and evaluation with sufficient frequency so as to ascertain the characteristics and quality of groundwater and the sufficiency of the groundwater protection programs established pursuant to this article” (West Virginia Legislature, 2023, section 22-12-6, subsection c4).
The West Virginia Department of Environmental Protection entered into a cooperative agreement with the U.S. Geological Survey (USGS) to undertake a statewide borehole geophysical logging project with the goal of documenting and increasing the understanding of the geologic, lithologic, topographic, and physiographic processes governing the occurrence and distribution of fractures and flow of groundwater in West Virginia’s complex fractured-bedrock aquifers. This cooperative agreement was in response to requirements of the West Virginia Groundwater Protection Act and because of a lack of substantive studies of bedrock aquifers in West Virginia.
This project assessed the effects of topographic, stratigraphic, lithologic, depth, and physiographic factors on the distribution of water-bearing fractures in the bedrock aquifers of West Virginia. It generally is understood that (1) topography affects well yields and aquifer transmissivity and (2) the occurrences of water-bearing fractures decrease with depth (Kozar and others, 2020). However, these relations with topography have only been partially investigated and corroborated by previous research. Therefore, the U.S. Geological Survey, in cooperation with the West Virginia Department of Environmental Protection, began a multi-year study to investigate factors affecting the overall hydraulic properties of fractured-rock aquifers within West Virginia.
Purpose and Scope
The purpose of this report is to summarize the findings of this study, including descriptions of the topographic, lithologic, physiographic, and structural controls on fracture occurrence and distribution. Understanding these processes controlling fracture distribution across West Virginia can help to better assess potential depths of active fracturing of the bedrock, the depth at which fractures diminish or become so tight as to preclude storage or yield of water to a well, for assessing the potential fate and transport of contaminants within fractured-rock aquifers in the event of an unanticipated contamination event, and to guide management and protection of fractured-rock aquifer resources within the State.
Description of Study Area
West Virginia encompasses an area of 24,230 square miles (fig. 1; Cardwell and others, 1968). The region is largely present in two physiographic provinces, the Appalachian Plateaus Physiographic Province to the west and the Valley and Ridge Physiographic Province to the east (Fenneman and Johnson, 1946). Along the West Virginia and Virginia border in Jefferson County, West Virginia, there is also a thin outcropping of rocks within the Blue Ridge Physiographic Province. Elevation is highly variable across West Virginia. In the western part of the State and within the Appalachian Plateaus Province, there are flat-lying but extensively eroded rocks (Fenneman and Johnson, 1946). The eastern part of the Appalachian Plateaus Province in the central part of the state includes higher elevations above 3,000 feet (ft) above mean sea level. The Valley and Ridge Province in the eastern part of the State is characterized by long parallel ridges and valleys (Fenneman and Johnson, 1946) resulting from past orogenic (mountain building) events in the area, having moderate to high elevations along the ridges above 3,000 ft above mean sea level. The Blue Ridge Province in West Virginia only occupies a small strip of land separating West Virginia from Virginia (Fenneman and Johnson, 1946). The highest point in West Virginia is 4,863 ft above mean sea level on Spruce Knob in Pendleton County, and the lowest point is 240 ft above mean sea level along the Potomac River near Harpers Ferry in Jefferson County (fig. 1; U.S. Geological Survey, 2023).
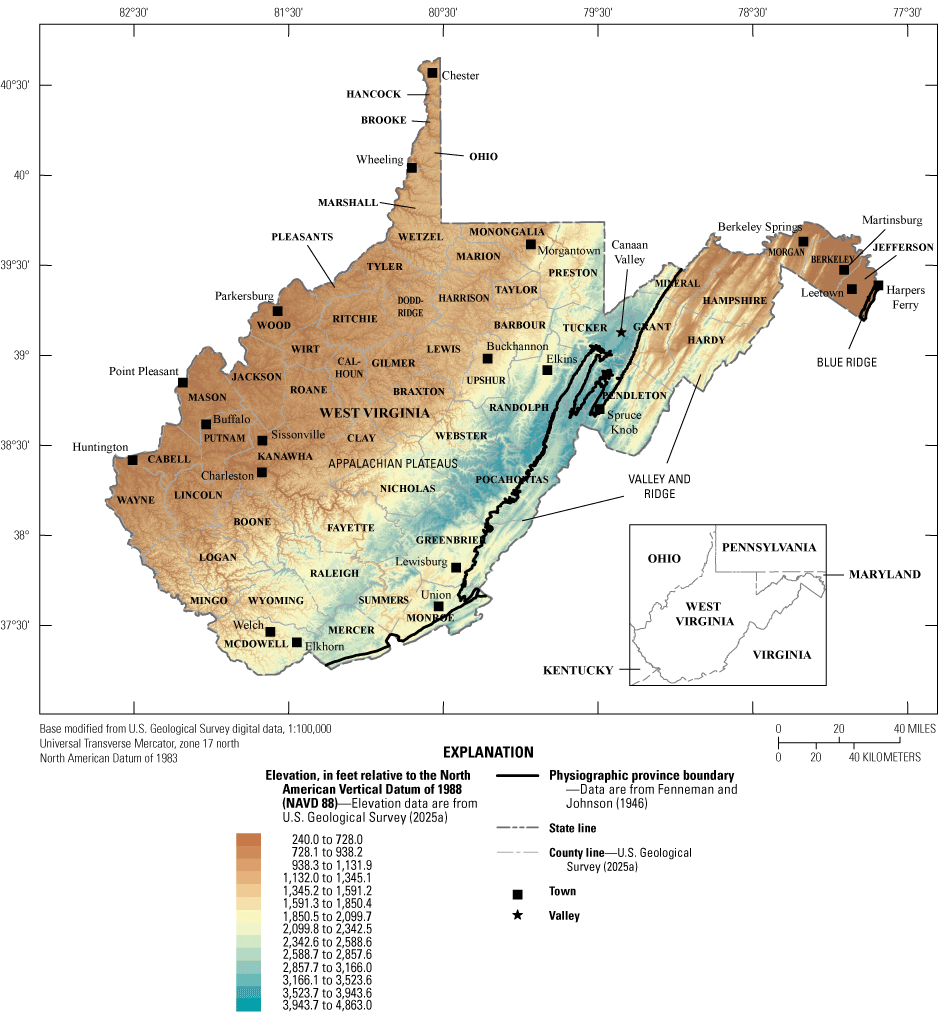
Map showing the State of West Virginia, elevations throughout the State, and locations of the three physiographic provinces within the State.
Physiographic Provinces
West Virginia has three physiographic provinces (fig. 2)—the Appalachian Plateaus, Valley and Ridge, and Blue Ridge (figs. 1, 2). The Appalachian Plateaus Province occupies about two-thirds of West Virginia, and the Valley and Ridge Province comprises the additional one-third. The Blue Ridge Province is limited in exposure to a thin strip along the West Virginia and Virginia border in Jefferson County, West Virginia.
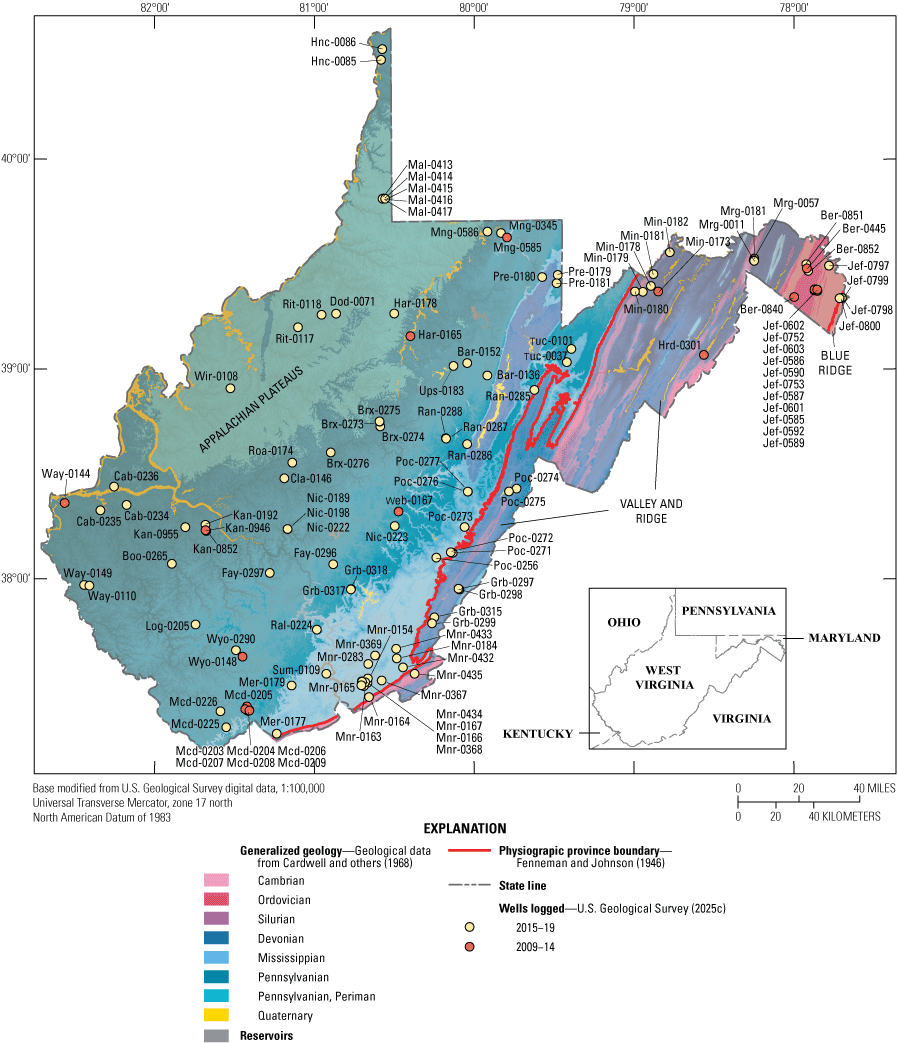
Map showing the physiographic provinces, simplified geology by geologic age, and sites logged for past and present studies in West Virginia.
Topography
Topography is a major factor affecting the yield and depth of water-bearing fractures within West Virginia, especially in areas within the Appalachian Plateaus Province. The effects of topography on well yields vary greatly among hilltop, hillside, and valley settings within the Appalachian Plateaus Province in southern West Virginia (Kozar and others, 2020). Kozar and others (2020) determined that for 777 wells in southern West Virginia, median well yields were 2.9 gallons per minute (gal/min) for hilltop wells, 12 gal/min for hillside wells, and 30 gal/min for valley wells. This correlation between location and yield was first discussed by Ferguson (1967) and by the research of Wyrick and Borchers (1981). Ferguson (1967) and Wyrick and Borchers (1981) postulated that stress relief caused by erosional unloading of weight of eroded rock above valleys resulted in upward arching of bedrock in valley bottoms accompanied by vertical stress-relief fracturing on hillsides was responsible for the variance in well yield (fig. 3). The groundwater-flow system is extensively modified where active or abandoned mines are present (fig. 4). Groundwater in interconnected abandoned mine workings typically flows down-dip below overlying ridges, which leads to inter-basin transfer of groundwater from one surface watershed to another (fig. 4).
However, the effect of stress-relief fracturing processes on well yields common in the southern Appalachian Plateaus Province was unknown elsewhere in the State. The topography in northern West Virginia is not as steep as in the southern part. A primary focus of this study was to investigate the effects of topography on the occurrence and distributions of fractures in the State’s bedrock aquifers, especially for wells in the Valley and Ridge Province that previously lacked data for assessing such trends.
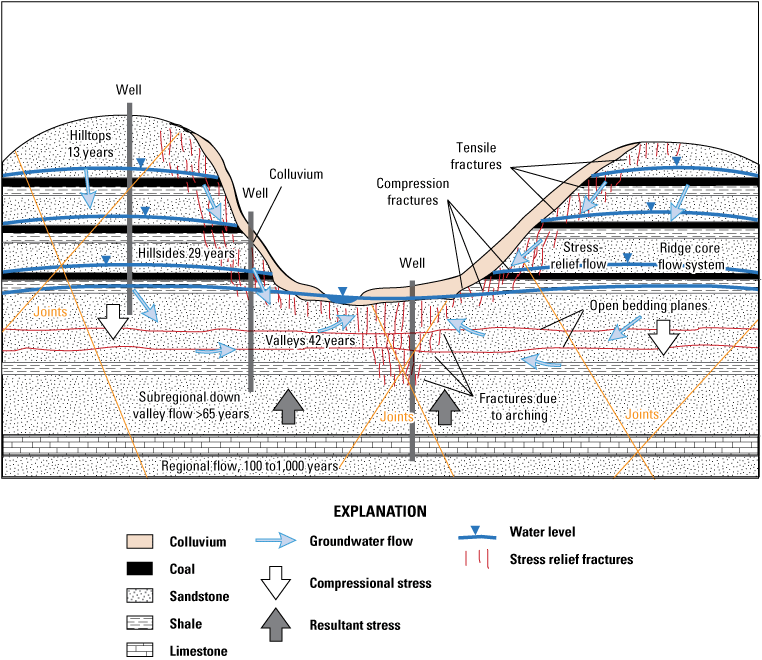
Cross section showing the conceptual flow of groundwater in an unmined Appalachian Plateaus Province fractured-rock aquifer, including the apparent age of groundwater. Figure modified from Kozar and Paybins (2016).
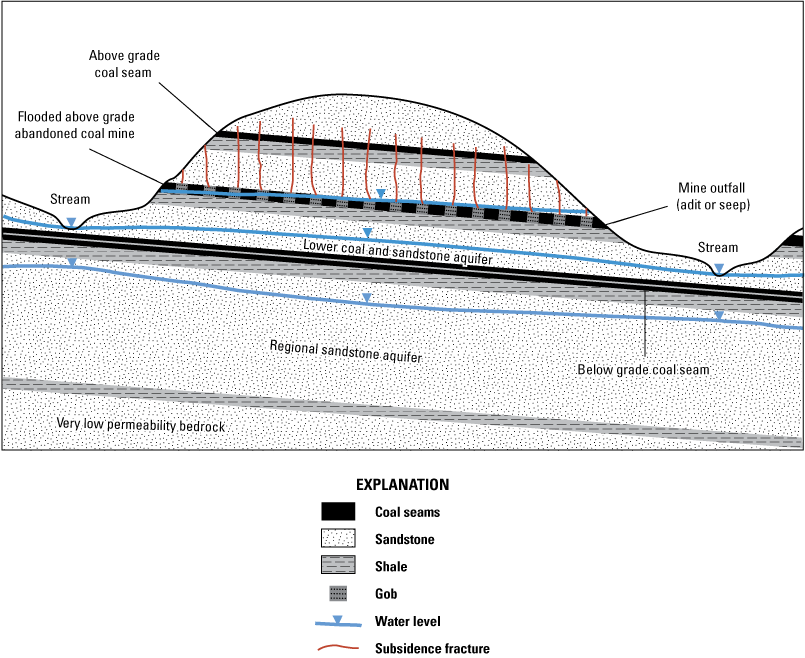
Cross section showing the conceptual model of fractured bedrock aquifer modified by the creation of anthropogenic secondary permeability features within a room and pillar type underground coal mine. Figure modified from Kozar and Paybins (2016).
Geology
West Virginia geology is complex with sedimentary rocks of Mississippian to Permian age outcropping in the Appalachian Plateaus Physiographic Province, sedimentary rocks of Cambrian to Mississippian age outcropping within the Valley and Ridge Physiographic Province, and moderately metamorphosed sedimentary rocks and a few rocks of igneous origin of Neoproterozoic to Cambrian age cropping out in the Blue Ridge Province (figs. 2 and 5; Cardwell and others, 1968). This geologic complexity is related to past orogenic processes that resulted in the State’s major physiographic provinces. Generally, rocks within West Virginia are predominantly sedimentary in origin and consist of alternating sequences of sandstone, shale, siltstone, mudstone, limestone, dolomite, and coal. Various gradations exist among these primary rock types within the Appalachian Plateaus Province, but higher percentages of shale, siltstone, and limestone are in the Valley and Ridge Province. The Blue Ridge Province consists of various slightly metamorphosed sedimentary rocks such as schist, phyllite, and gneiss but contains a few igneous plutonic rocks, such as greenstone (Cardwell and others, 1968). Limestone and, to a lesser degree, dolomite bedrock form various carbonate units that are often karstic and crop out in various areas within the State. The more important limestone units are the Ordovician age units in the Shenandoah Valley and thinner units such as the Tonoloway and Helderberg limestones that crop out in thin bands of Silurian and Devonian age rocks within the Valley and Ridge Province. The various formations within the Greenbrier Group crop out mostly within the Greenbrier valley in Monroe, Greenbrier, and Pocahontas Counties, and in Canaan Valley in Tucker County, West Virginia.
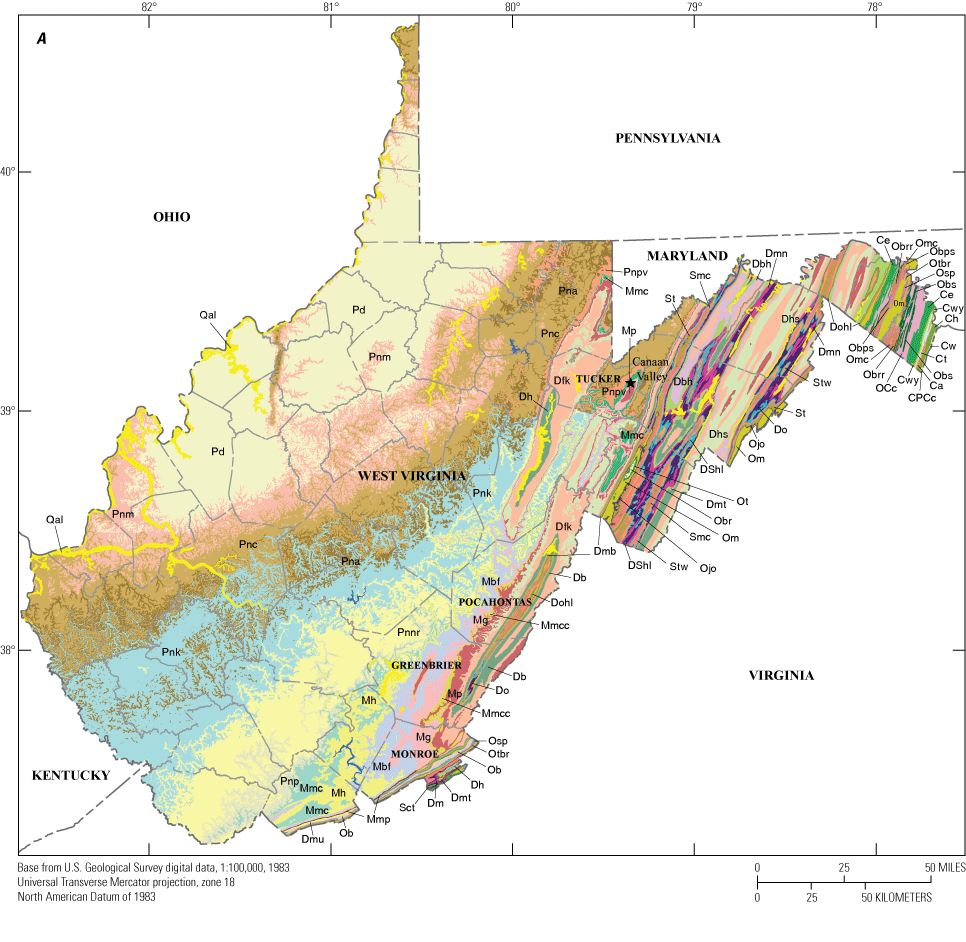
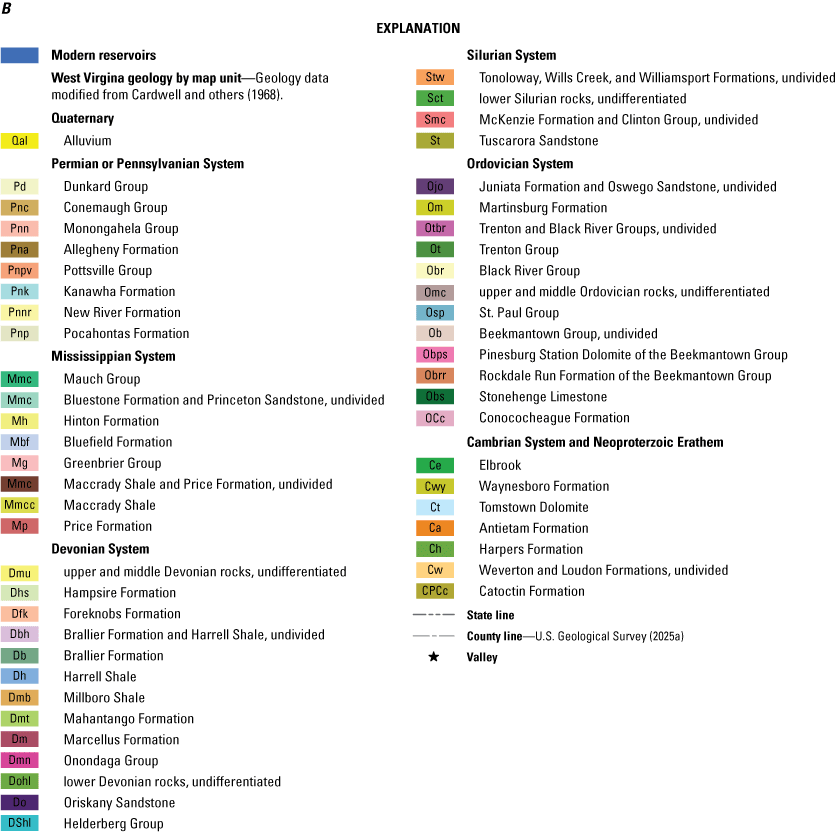
Geologic map showing the major formation or geologic groups in West Virginia. A, Geologic map. B, Geologic map explanation.
Hydrogeologic terrain, a concept first applied in West Virginia by Schwietering (1981) and adopted as standard nomenclature by Puente (1985), is one of the most important factors for assessing whether an aquifer is intrinsically susceptible to contamination from near-surface processes. Kozar and Paybins (2016) defined hydrogeologic terrains as bedrock or alluvial aquifers within a physiographic province that share similar hydraulic properties, groundwater-flow processes, recharge rates, groundwater ages and residence times, lithology, and water quality. Hydrogeologic terrains are commonly used to differentiate aquifers within West Virginia. Kozar and Paybins (2016) also state that in addition to the three distinct physiographic provinces within the State, the Appalachian Plateaus, Valley and Ridge, and Blue Ridge (fig. 1), there are also three primary rock types and alluvial sand-and-gravel deposits in the State and compose the State’s principal aquifers. Kozar and Paybins (2016) defined the five major hydrogeologic terrains in West Virginia (fig. 6) as
-
(1) alluvial aquifers bordering the Ohio and Kanawha Rivers and other major tributary streams;
-
(2) karst aquifers in the Shenandoah River Valley of West Virginia’s eastern panhandle and in the Greenbrier River valley, and thin limestone outcrops in the Valley and Ridge Province;
-
(3) fractured crystalline metamorphic and igneous rock aquifers in a thin band within the Blue Ridge Province in Jefferson County, in the easternmost part of West Virginia;
-
(4) abandoned underground coal-mine aquifers in southern West Virginia (fig. 7); and
-
(5) fractured sandstone, shale, coal, thin limestone, and associated sedimentary-rock aquifers in most of the State, including parts of the Appalachian Plateaus and Valley and Ridge Provinces (fig. 6).
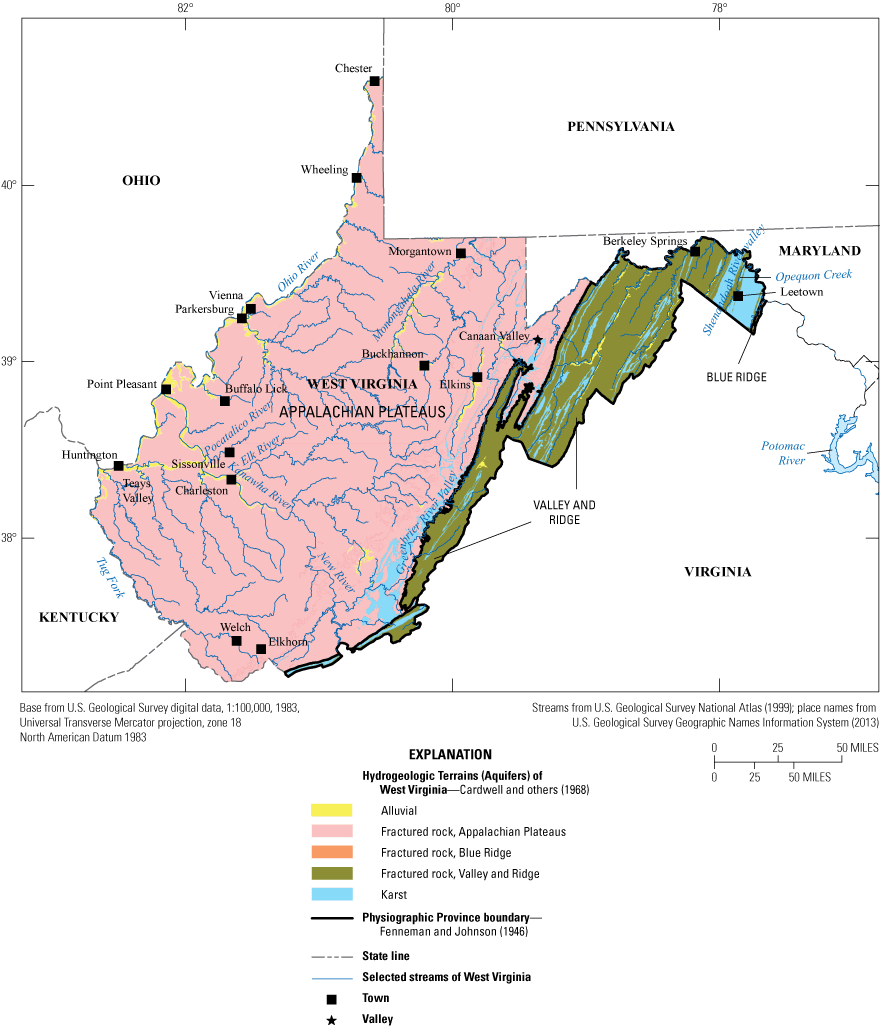
Map showing the physiographic provinces and major hydrogeologic terrains in West Virginia. Figure modified from Kozar and Paybins (2016).
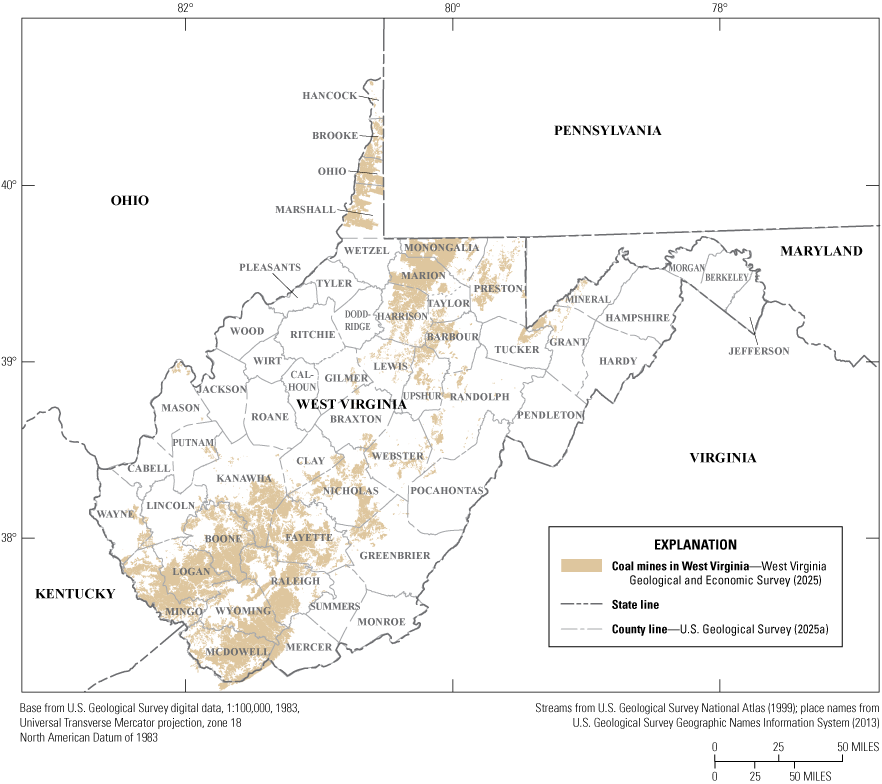
Map showing the extent of abandoned underground coal mines in West Virginia.
Previous Investigations
A sparse number of previous borehole investigations have been completed in West Virginia. A borehole geophysical assessment of lithologic and structural controls on groundwater flow processes was studied for the USGS facility at Leetown, West Virginia (Kozar and others, 2007). This study defined a complex flow system consisting of a highly permeable epikarstic zone underlain by fractured but less extensively solutioned limestone and dolomite. A sparser network drains this flow system of interconnected strike-parallel and cross-strike faults and fractures commonly enlarged by the dissolution of the limestone that acts as drains for the broader fracture-dominated parts of the aquifer. Borehole geophysics was used to document the overall orientation of dominant fractures within the study area and determined that rocks in the area had been subjected to folding and faulting, resulting in bedrock fractures with moderate to high-angle dip commonly exceeding 60 degrees (°). Dominant fracture orientation is parallel to bedrock strike at approximately N. 15° E. and perpendicular to strike at S. 70° E.
A second borehole geophysical assessment was undertaken on abandoned underground coal mine aquifers in the Elkhorn area of McDowell County, West Virginia (Kozar and others, 2012). This Elkhorn area borehole geophysical assessment documented large-scale dewatering of overburden strata and subsequent concentration of groundwater flow at depth within the Pocahontas Number (No.) 3 and, to a lesser extent, the Pocahontas No. 4 coal seams. The Pocahontas No. 3 coal seam has been largely mined out in the area and left to collapse as overburden strata and remaining coal pillars collapsed (gob) because of the weight of overburden rock above the mined coal seam. Overburden collapse has created a large network of interconnected underground abandoned mine workings that function similarly to deeply buried coarse alluvial aquifers. The dominant orientation of fractures mapped was N. 0–30° E. and N. 20–45° W. Most of the dip angles were relatively flat at 0–40°, but a few were higher angle fractures, 50–90°. The trends are generally aligned with the strike of bedding. Most of the fractures are strike-parallel joints and cleavage that dips generally 15–60°. Bedding-plane fractures noted in caliper logs had shallower dips and were less common than the dominant trends shown by joint and cleavage fractures. Hydrologically active high-angle joints and cleavage likely provide pathways for groundwater flow linking them to more horizontally oriented bedding-plane partings. Logs collected for the Elkhorn study suggest sandstones in the study area are poorly fractured and limit vertical flow between more permeable yet finer grained units and coal seams. Coal seams or abandoned underground coal mines are the major aquifers in the region.
Borehole geophysical logs are routinely collected by private entities to support the needs for subsurface oil and gas exploration and for assessing coal reserves for potential mining operations. These borehole geophysical surveys are largely proprietary and unavailable for public access. Kozar and others (2007) and Kozar and others (2012) are the only known publicly available published studies containing significant geophysical data collection and interpretation within West Virginia.
Studies of Silurian and Devonian fractured-carbonate units in West Virginia have shown that these systems may produce abundant water for public and domestic use (Rega, 2011; Donovan, 2012). Rega (2011) described lineament density in Silurian and Devonian carbonate aquifers in Mineral County, West Virginia, and concluded that lineaments were associated with groundwater discharges and groundwater discharges from carbonate aquifers were higher than from adjacent groundwater discharges from siliciclastic rocks such as shale, siltstone, and sandstone. Donovan (2012) found that drilling wells through overlying siliciclastic formations along the east side of an anticline into the underlying Silurian and Devonian fractured carbonate aquifers produced the greatest yield for public supply wells along Knobley Road in Mineral County, West Virginia.
Methods
Various methods were used to collect and analyze the various geophysical logs required to assess the occurrence and distribution of fractures in West Virginia’s bedrock aquifers. Specific descriptions of the methods used to collect and analyze the geophysical logs collected for this study follow.
Geophysical Methods
Multiple borehole geophysical logs were collected during this study. These geophysical logs are described in this section and summarized in table 1. Geophysical tools included a mechanical 3-arm caliper, an electromagnetic (EM) induction tool, a multi-parameter E-logging tool, acoustic (ATV) and optical (OTV) televiewer tools, an EM-flowmeter tool, and a full-wave sonic waveform tool.
Table 1.
Types of borehole geophysical logs used for the statewide assessment of bedrock aquifers in West Virginia.[Modified from Keys, 1990. EM, electromagnetic; ATV, acoustic televiewer; OTV, optical televiewer]
| Type of borehole geophysical log | Description and application |
|---|---|
| Caliper log | Mechanical calipers with spring-loaded arms record the borehole diameter and change in depth. Acoustic calipers calculate the distance to the borehole wall for the travel time of an acoustic signal from an ATV (Keys, 1990). These caliper logs are then used in conjunction with ATV, OTV, fluid resistivity, fluid temperature, and heat-pulse flowmeter logs to identify fractures or flow zones in the borehole. |
| Natural gamma log | The natural gamma log records the total gamma radiation emitted by rocks surrounding the borehole (Keys, 1990). Clay minerals within rocks may be indicated by elevated gamma responses. Gamma logs are commonly used for lithologic correlations. A primary use of gamma logs for this study was in identifying shale bedrock units. |
| Fluid resistivity log | The fluid-resistivity log records the electrical resistivity of water in a borehole and is related to its dissolved solids concentration (Williams and Conger, 1990). Logs are collected under pumping and ambient conditions to identify zones where water moves into and out of the borehole. |
| Fluid temperature log | The fluid-temperature log records the water temperature in the borehole as a function of depth. Temperature contrasts, if present, provide information to support water movement into or out of the borehole at discrete fracture zones (Keys, 1990). |
| Electromagnetic flowmeter log | The EM-flowmeter log is used in the environmental and hydrology industries to measure fluid movement in a borehole. The instrument measures flow rates using the principle of Faraday's law of induction. The downhole probe consists of an electromagnet and two electrodes located 180 degrees apart and 90 degrees to the magnetic field inside of a hollow cylinder. The voltage induced by a conductor moving at right angles through the magnetic field is directly proportional to the velocity of the conductor (water) through the field. The tool can measure low-velocity flow rates down to less than 50 ml/min and higher velocity flow rates to 40 liters/min through the tool's 1-inch inside diameter sensor, which is used to determine which fractures are accepting or contributing water to the borehole under pumping and non-pumping conditions (Century Geophysical, LLC, 2023). |
| Spontaneous potential log | The spontaneous-potential log records the naturally occurring electrical potential differences along the borehole wall and are used to identify changes in lithology and bed thickness (Keys, 1990). |
| Electromagnetic induction log | The electromagnetic induction log records the electrical conductivity of the rocks and water surrounding the borehole. Induction logs are used for lithologic interpretations and in delineations of porosity and dissolved-solid concentrations of water in the rock matrix (Williams and others, 1993). |
| Acoustic televiewer log | The acoustic televiewer log provides high resolution, magnetically oriented, 360° image of acoustic energy reflection and travel time. Fractures of greater than 0.1 in. can be detected and their orientation determined on ATV images (Keys, 1990). |
| Optical televiewer log | The optical televiewer provides high-resolution 360° optical image of the borehole (Williams and Lane, 1998). The OTV log can be used to produce a virtual core to permit visualization of fractures as they are found in the borehole. Fractures apertures and orientation can be determined from OTV logs. |
| Full wave sonic porosity log | Sonic-logging methods can either measure (1) seismic-wave transmission (that is, sonic, acoustic, acoustic waveform, and full-waveform sonic), (2) cement bonding, or (3) acoustic reflections via acoustic televiewer logging. Sonic-logging tools mainly consider how seismic waves propagate through formations to estimate porosity and saturation and (or) identify fluid-filled or potentially transmissive fractures. |
| Single-point resistivity log | Single-point resistance refers to the resistance, in ohms, between an electrode in the well and an electrode at the land surface or between two electrodes in the well. Single-point resistivity logs are useful for helping to differentiate lithologic changes in a borehole. |
| Normal resistivity log | Normal resistivity is probably the most widely used measurement in groundwater hydrology. The electrode spacing, from which the normal curves derive their names, is the distance between two electrodes, and the depth reference is at the midpoint of this distance. The most common spacings are 16 and 64 in. Normal resistivity logs are used for lithologic identification of logged intervals. |
| Borehole video camera log | Downhole video cameras can help assess the locations of major fractures or fracture zones in the wellbore. They are often run to assess the integrity of the wellbore prior to logging to ensure that conditions within the wellbore are suitable for logging. The camera used for this study included a pan and tilt function, allowing visual inspection of the side of the borehole and a 360° visual examination of the borehole. |
| Deviation log | Deviation logs are used for correcting the strike and dip of borehole logs caused by the deviation from true vertical that often happens in wells. The deviation log available on both the acoustic televiewer and optical televiewer tools uses a 3-axis flux gate magnetometer to measure and record the orientation of the tool in the borehole in 3-dimensional space and to correct fracture and depth data accordingly (Century Geophysical, LLC, 2023). |
Caliper Logs
Caliper tools were used to document the diameter of the borehole along its entire length and to verify casing depths and casing and borehole diameter (Keys, 1990). A three-arm caliper was used for this study. The three arms of the caliper are equidistantly spaced around the core of the logging tool and are spring-loaded. As the tool traverses up the borehole, the mechanical spring-loaded arms open and close, yielding an average diameter of the borehole. Because fractures in sedimentary rocks are often enlarged where they intersect the borehole during the drilling process, the caliper logs can indicate potential fractures within the borehole. Caliper logs frequently correlate with weathered or easily eroded bedrock layers, such as shale, that are interlayered between more competent rock, such as sandstone, where the rugosity of the borehole tends to increase where the tool traverses from harder, more competent rocks to softer, more easily eroded rocks.
Natural Gamma Logs
Gamma logs are the record of the total gamma radiation emitted by rocks surrounding the borehole (Keys, 1990). Elevated gamma responses may indicate clay minerals within rocks. Gamma logs are mostly used for lithologic correlations. For this study, gamma logs were used to delineate sandstone and shale intervals and various transitional lithologies such as siltstone, argillaceous sandstone, and calcareous sandstone.
Fluid Temperature Logs
Temperature logs show the measurements of the borehole's ambient temperature and the delta temperature, or change in temperature, over short intervals of the borehole. Temperature gradients smaller than the geothermal gradient may indicate intervals of flow into or out of the wellbore; the geothermal gradient is the rate of temperature increase relative to increasing depth into the Earth. Temperature logs were used to delineate possible changes in wellbore flow.
Electromagnetic Flow Logs
Flow logs are records of the direction and rate of vertical flow in the borehole. Flow-log measurements were collected using an EM-flowmeter from most boreholes under ambient conditions and while pumping at a constant low rate with a quasi-steady-state drawdown. The EM-flowmeter (Young and Pearson, 1995) measures fluid velocity based on Faraday’s Law, which states that the flow of an electrically conductive fluid through an induced magnetic field generates a voltage gradient that is proportional to its velocity. The EM-flowmeter, which was configured with a flexible rubber diverter to concentrate flow through the center of the EM-flowmeter, has a measurement range from 0.05 to 15 gal/min. Stationary flow measurements were made at selected depth stations. They were interpreted with the OTV, ATV, and fluid resistivity and temperature logs to identify transmissive fractures and the direction and rate of flow between fractures under ambient and pumped conditions.
Spontaneous Potential Logs
A spontaneous-potential log (sometimes called an SP or self-potential log) is a record of potentials or voltages that develop at the contacts between lithologies of varying composition, such as between shale or clay beds and a sand aquifer, where a borehole penetrates them. The log is also an effective method of spotting differences in salinity within a borehole. Spontaneous-potential logs help determine lithology, bed thickness, and the salinity of formation water.
Electromagnetic-Induction Logs
Electromagnetic induction logs are a record of the combined electrical conductivity of the rock matrix and fluids (water or drilling fluids) within the borehole. Those logs are often used for lithologic interpretations (Williams and others, 1993). This study used the EM-induction tool to identify lithology or rock type in the borehole.
Acoustic-Televiewer Logs
Acoustic televiewers produce a sound pulse transmitted by an internal rotating transmitter. The sound pulse, generated by the ATV tool, bounces off the borehole wall, producing an echo that is detected by internal receivers (Williams and Johnson, 2004). The gathered acoustic data produce a 360° image of the borehole and associated fractures. Because the ATV image is a conical 360° image, the mapped fractures appear as sine waves on the image when the image is unwrapped to produce a flat image. The amplitude of the sine wave corresponds with the degree of dip of the fracture; the larger the sine wave, the larger the dip of the fractures.
Optical-Televiewer Logs
Optical televiewers take a 360° digital image of the borehole wall. Optical televiewers can be collected above the water level and in clear water. The OTV logs were used to identify and inspect the base of the casing and to characterize well construction and lithologic, structural, and solution features penetrated by the wells below the well casing. The OTV logs were used to determine the strike and dip of planar structural features (bedding and fractures). Fracture delineations from OTV and ATV logs of near-vertical wells may over-sample low-angle fractures and under-sample high-angle fractures.
Full-Waveform Sonic Logs
Full-waveform sonic logs record the measurements of the amplitude and transit time of acoustic waves transmitted through rocks and water surrounding the borehole. Compressional-wave slowness, in units of microseconds per foot (the inverse of velocity) was estimated from the acoustic travel times. Slowness is affected primarily by rock elastic properties and commonly correlates with density. Slowness also increases substantially where rocks are highly fractured. For this study, the sonic logs were especially useful in distinguishing between sandstone and limestone intervals because sandstone and limestone have similar gamma content.
Single-Point Resistance Logs
Single-point resistance logs show the resistance in ohms between an electrode in the well and an electrode at the surface or between two electrodes on the logging tool (Keys, 1990). Single-point resistance logs are useful for delineation of fractures and identification of lithology and were used to differentiate between highly resistive lithologies, like limestones and sandstones, and lower resistivity lithologies, such as shales and siltstones.
Normal-Resistivity Logs
Normal-resistivity logs, commonly referenced as 16-inch (in.; short-normal) resistivity and 64-in. (long-normal) resistivity, measure the resistivity of the formation between two sensors on the logging tool spaced either 16 (short-normal resistivity) or 64 in. apart (long-normal resistivity; Keys, 1990). Long-normal resistivity logs have a larger volume of investigation into the formation than do short-normal resistivity logs, which are focused around the immediate borehole and adjacent aquifer material. Both logs are commonly used for lithologic determination and assessment of varying water quality within the aquifer (Keys, 1990). For this study, short and long-normal resistivity logs were used for lithologic identification.
Borehole Video Camera Logs
Downhole or borehole video cameras are used to assess the integrity of the wellbore prior to borehole logging and to ensure that conditions within the wellbore are suitable for logging. The camera used for this study was equipped with a pan and tilt function that allowed a 360° visual examination of the borehole. A primary use of the camera was to identify significant fracture zones or discrete fractures within the borehole. Changes in lithology were also noted during the video camera inspection of the wellbores assessed for this study.
Deviation Logs
Deviation logs show the measurements of the tilt and azimuth of the logging tool in the wellbore from vertical in degrees. A vertical wellbore has a deviation of 0 degrees. Borehole-deviation logs were collected with three-axis fluxgate magnetometers and vertical inclinometers that are incorporated in the OTV and ATV tools. Typically, the azimuth and tilt data derived from the ATV tool are used for correcting strike and dip of borehole logs caused by the deviation from true vertical that are often observed in wells. The tool uses a 3-axes flux gate magnetometer to measure and record the orientation of the tool in the borehole in 3-dimensional space. The data on the 3-dimensional orientation of the tool in space is then used to correct fracture orientation and depth data accordingly.
Field Methods
Specific sequential procedures were followed for every well logged. Prior to initiating borehole geophysical logging, each well was visually inspected with a borehole camera equipped with a pan and tilt revolving camera head. The camera was lowered down the wellbore to document the depth and condition of cased- and open-hole intervals in the well, identify fractures and fracture zones penetrated by the wellbore, and assess the wellbore’s suitability for logging (wells with pumps, wiring, drop pipe, or other obstructions were not acceptable candidate wells for logging). Numerous wells were not logged after camera inspection for various reasons, mostly because of obstructions in the well or liners in the well that would prevent the use of the ATV or OTV tools for assessing fractures.
Upon completion of the camera inspection, the EM-induction tool and the 3-arm caliper were calibrated prior to collecting borehole log data. The remaining tools did not require on-site calibration and were maintained according to manufacturer’s specifications. The magnetometers on the ATV or OTV tools were checked periodically with a compass and protractor to ensure they were operating according to the manufacturer’s specifications, and the EM-flowmeter tool was calibrated annually at the beginning of the logging season to ensure the tool was collecting accurate flow readings. Appropriately sized rubber diverters were installed on the EM-flowmeter tool to seal tightly against the wellbore, thus forcing water to flow through the core of the flowmeter tool.
Site and date-specific information was also recorded for each well logged and included the following information:
-
(1) the date the well was logged,
-
(2) the latitude and longitude of the well’s location,
-
(3) the depth intervals logged for each log collected,
-
(4) the depth settings at which the EM-flowmeter tool was parked for stationary measurements of borehole flow,
-
(5) the flow rate of the submersible pump and depth of the pump setting in the wellbore for the trolling and stationary measurements of borehole flow assessed with the EM-flowmeter tool, and
-
(6) which of the seven aforementioned borehole logging tools were used for logging the well (not all tools were applicable for every well).
Borehole geophysical investigations were completed for 126 wells (fig. 2; Kozar and others, 2025) using multiple borehole geophysical tools. Fractures were assessed in 115 of 126 wells (Kozar and others, 2025). Water-bearing fractures were identified in 109 of the 115 assessed wells; 6 wells contained no identified water-bearing fractures ( Kozar and others, 2025). Data collected for the borehole geophysical surveys are summarized in a USGS data release (Kozar and others, 2025) and include lithologic interpretations, the logged interval for each tool deployed, the USGS 15-digit station number, the USGS local well number, the latitude and longitude location of the well logged, the date the well was logged, the water level in the well at time of logging, the elevation of land surface at the well, the magnetic declination for the location on the date the wells were logged, and the geologic unit and type of rock in which the well was completed.
All logs were archived in the USGS Virginia-West Virginia Water Science Center borehole log computer archives. The original logs are also available on the USGS GeoLog Locator website (U.S. Geological Survey, 2025b). All well construction data and other miscellaneous site data are stored in the USGS NWIS database (U.S. Geological Survey, 2025c). A list of the wells logged is presented in the data release (Kozar and others, 2025).
Methods of Geophysical Log Analysis
Various methods were used to analyze borehole geophysical data collected for this study, including processing the borehole data using WellCAD (Advanced Logic Technology, 2023), a borehole geophysical analysis software package that allows for processing and analyzing of borehole geophysical data, and by graphical and statistical analysis of the data resulting from the processed data derived from the WellCAD analysis. For this study, WellCAD was used for several purposes, including fracture mapping analysis, lithologic identification, and computation of porosity within the wells logged.
Data from prior USGS studies were augmented by logging 100 additional wells between 2015 and 2019. Of the 126 wells available for analysis, 115 had sufficient logs to aid in the analysis of fracture distribution and the assessment of geologic, lithologic, topographic, and physiographic processes controlling fracture occurrence and distribution for fractured-rock aquifers.
Fractures
The ATV, OTV, and caliper logs were used to identify fractures within the borehole. The magnetometer in the ATV and OTV tools records the data with respect to magnetic north and the tilt and deviation direction of the borehole to allow for correction of the true vertical depth as well as strike and dip of features penetrated by the borehole. All fractures identified were corrected for borehole deviation and magnetic declination using the WellCAD software.
Lithology
Data from the various logs were analyzed to assess the lithology penetrated by the borehole. The primary logs used for lithologic identification for this study were the 16-in. and 64-in. normal resistivity logs, spontaneous potential—which can be used for detecting changes in lithology in a borehole; gamma log—which can be used for differentiating shale layers from other types of rock, and the slowness value obtained from the full-waveform sonic porosity log—which can be used for differentiating between sandstone and limestone which have similar resistivity and gamma content, as well as the ATV and OTV image logs—used to identify and characterize the fracture data summarized in this report. A machine learning algorithm based on cluster analysis was used to help with the lithologic identification of the logs collected. This machine learning algorithm used all available logs to look for patterns associated with specific lithologies and to make preliminary lithology identifications for each log that were then visually inspected and adjusted as needed, but few adjustments were necessary because, overall, the cluster analysis provided a good initial assessment. The only area where the cluster analysis underperformed was in differentiating sandstone from limestone. Numerous logs were adjusted manually based on visual examination of the logs and interpretation of the logs, especially based on the slowness data from the full wave sonic porosity logs, which was used to differentiate between sandstones and limestones or argillaceous sandstone and argillaceous limestones.
Transmissivity
The ambient and pumped flow logs were analyzed using the method described by Paillet and others (1987) and Paillet (2000) to estimate the transmissivity and hydraulic head of individual fractures identified in the logged wells. In this method, a best-fit match is developed between measured and model-calculated ambient and pumped flows by iterative adjustment of flow-zone transmissivity and hydraulic head in a numerical or analytical model. The flow-log analysis method generally detects and quantifies the hydraulic properties of fracture zones whose transmissivities are within 1.5 to 2 orders of magnitude of the most transmissive zone penetrated by the hole (Paillet, 1998). The computer model FLASH (flow-log analysis of single holes) developed by Day-Lewis and others (2011) was used to estimate the flow-zone transmissivity and head. The FLASH model code is based on a multi-layer application of the Thiem equation, which is an analytical solution for steady-state radial flow to a single hole. The solution requires that the transmissivity of the borehole or the hydraulic radius of influence be independently estimated. The total transmissivity of the wells was estimated through the application of the computer program of Bradbury and Rothschild (1985), which is based on the relation between specific capacity and transmissivity described by Theis and others (1963). Specific capacity, which is calculated by dividing the pumping rate by the drawdown, was determined by pumping the wells at a constant rate and measuring the water level until a quasi-steady-state drawdown was achieved.
Transmissivity was originally defined by Theis (1935) as the rate of flow of water at the prevailing temperature, in gallons per day, through a vertical strip of the aquifer one foot wide extending the full saturated height of the aquifer under a hydraulic gradient of 100 percent. In simpler terms, it is the ability of an aquifer to transmit water, and, as such, can be used for assessing how much water an aquifer will yield to a well.
Porosity
Estimating porosity with full-waveform sonic data requires processing to evaluate the slowness of the compressional wave (also called transit time or p-wave slowness) through the formation and fluid within the porosity of the rock matrices intersected by the borehole. Slowness represents the transit time of an acoustic wave to propagate through the rock matrix and interstitial fluids and is presented in units of foot per microseconds (ft/µs). Values for slowness generally are lower in the source-rock matrix and higher in the fluid-filled pores because waves travel faster through consolidated material (Paillet and Cheng, 1991). Values of slowness used for different rock matrixes in this study were 52 ft/µs for sandstone, 47 ft/µs for limestone, and 43 ft/µs for dolomite. The interstitial fluid within the porosity of the formations was assumed to be fresh. A value of 217 ft/µs was used for the fluid slowness. Detailed information about wave mechanics and full-waveform semblance processing can be found in Paillet and Cheng (1991).
The Raymer-Hunt-Gardner equation (Raymer and others, 1980; eq. 1) was used to compute the sonic porosity of formations intersected by the borehole.
wherevlog
is the compressional-wave velocity from the sonic log,
∅
is the porosity,
vma
is the compressional velocity of the formation, and
vfl
is the compressional velocity of the formation fluid.
∅sonic
is the total porosity computed from the sonic log,
tma
is the slowness of the formation,
tf
is the slowness of the formation fluid, and
tlog
is the compressional-wave slowness computed from processing the sonic data.
Equation 2 requires the compressional-wave slowness that was obtained by processing the full waveform through the Velocity Analysis Module in WellCAD 5.7 (Advanced Logic Technology, 2023). Processing full-waveform sonic data includes estimating slowness by looking for similarity across the receiver array and measuring similarity in waveforms, which is then expressed as a semblance value (Advanced Logic Technology, 2023; eq. 3).
whereSt
is the semblance at a specified time,
i
is a specific receiver at some distance from the transmitter,
t
is the time the wave takes to reach a specified receiver,
xti
is the amplitude at time t and receiver i, and
t+jΔt
is the time the wave takes to reach a second receiver j.
Compressional-wave slowness obtained from the velocity analysis was then input into equation 2 to compute the sonic porosity, which represents the total porosity of the formation. Total porosity represents all the void space within the rock matrix. This includes voids that are connected to the active groundwater-flow system and fluid-filled voids that may be closed and not effectively able to yield fluid to the groundwater-flow system. In groundwater-flow studies, the effective porosity fractional volume of connected pores represents the portion of the total porosity that can yield water (Freeze and Cherry, 1979).
Effective porosity commonly decreases with increases in the proportion of clay in rock formations, which is referred to as the shale fraction or shale volume. Porosity logs calculated by the Raymer-Hunt-Gardner equation (Raymer and others, 1980) give total porosity and may have high porosity values in shale with bound water that is not connected to the flow system. Therefore, the sonic porosity was corrected for the shale volume to assess the effective proportion of porosity and was calculated with the gamma ray log for this study (eq. 4; Makar and Kamel, 2011).
whereVsh
is the shale volume,
γlog
is the gamma ray reading of the log,
γcn
is the gamma ray value for a clean formation within the borehole, and
γsh
is the gamma ray value for a shale formation within the borehole.
Correcting the Raymer-Hunt-Gardner-derived (Raymer and others, 1980) sonic porosity for the shale volume gives an estimation of the effective porosity of the borehole formations (eq. 5).
whereStatistical and Graphical Analysis
The statistical software package SAS-JMP (JMP Statistical Discovery LLC, 2022) was used to analyze the data, which included preparing summary data tables that present mean, median, maximum, minimum, quantile, and standard deviations for the available data with respect to topography, depth in the borehole, physiographic province, lithology, and transmissivity of water-bearing fractures. Wilcoxon signed-rank tests were used to assess statistically significant differences in the characteristics of fractures with respect to depth in the boreholes logged for the study.
Graphical analyses include preparing x-y plots, histograms, and bar charts summarizing fracture data with respect to associated topography, depth in the borehole, physiographic province, lithology, and transmissivity of water-bearing fractures. Graphical analyses of available data using boxplots, x-y scatter plots, histograms, and cumulative frequency distribution plots were created using SAS-JMP (JMP Statistical Discovery LLC, 2022) and were used in this report to assess the roles of physiography, topography, lithology, and their influences on fracture distribution.
Transmissivity and Hydraulic Head
Transmissivity was originally defined by Theis (1935) as the flow rate of water, at the prevailing temperature, in gallons per day, through a vertical strip of the aquifer 1 foot wide that extends the full saturated height of the aquifer under a hydraulic gradient of 100 percent (Theis, 1935), but more recent transmissivity data are presented in terms of feet squared per day (ft2/d). In simpler terms, transmissivity is the ability of an aquifer to transmit water and, as such, is a useful parameter for assessing how much water an aquifer will yield to a well. For this study, water-bearing fractures were identified as those fractures with appreciable measurable transmissivity, typically greater than 0.02 ft2/d. Fractures with transmissivity less than 0.02 ft2/d were generally considered poorly transmissive or non-transmissive. Within this report, the terms water-bearing fractures and low-transmissive fractures will be used to describe these end members. The fracture data are analyzed with respect to numerous parameters, including depth, the number of water-bearing and low-transmissive fractures, the geologic formation in which the well was completed, the lithology of fractures encountered, and topography for both the Appalachian Plateaus and Valley and Ridge physiographic provinces in West Virginia.
A total of 126 wells were logged for this study and were available for analysis. Of those 126 wells, 11 had sufficient logs to allow for lithologic identification of intervals within the wellbore. A total of 115 wells also had adequate ATV or OTV data to allow assessing the occurrence and distribution of water-bearing fractures within the boreholes logged. A total of 252 water-bearing fractures were identified from the 115 logged wells (Kozar and others, 2025). Of those 115 logged wells, 109 had sufficient EM-flowmeter and pump discharge data to allow analysis of 189 water-bearing fractures using the USGS FLASH software (Day-Lewis and others, 2011). Flow-log analysis of single-hole (FLASH) analyses for the 189 water-bearing fractures provides a robust dataset of the transmissivity of the water-bearing fractures identified during the analysis of the borehole geophysical data collected for the study.
The USGS FLASH software analyzes borehole vertical flow logs to estimate fracture (or layer) transmissivities and far-field hydraulic heads (Day-Lewis and others, 2011). Fractures identified via either the ATV or OTV tools are then evaluated based on potential flow from data collected by the EM-flowmeter tool and on periodic groundwater level measurements made as part of the EM-flowmeter borehole logging process. Heads derived from the FLASH analyses can then be used to assess the direction of flow within a borehole either upward or downward. These directions of flow are useful for assessing potential recharge and discharge areas because downward flow is common in upland recharge areas and upward flow is common in lowland discharge areas. The geologic structure can complicate this simple relation of the direction of groundwater flow within a borehole and will be discussed in more detail later in the report.
Factors Affecting Distribution of Water-Bearing Fractures
Results of the study are discussed in the following sections of the report. Factors that affect the distribution of fractures and their water-bearing properties include topography, physiography, depth below land surface, stratigraphy, and geologic structure (for example, bedding planes, joints, faults, high-angle fractures, anticlines, and synclines). Each of these factors affecting the distribution of all mapped fractures and those identified as water bearing are discussed in the following sections of this report. The location of the 126 wells logged for the study and previous studies are shown in figure 2.
Topography
Topography has long been known to be a primary factor governing the yield of wells in hilltop, hillside, and valley settings in the Appalachian Plateaus Province of West Virginia (Wyrick and Borchers, 1981; Kozar and others, 2020). Wyrick and Borchers (1981) found that isostatic rebound, resulting from erosion of overburden strata, causes an upward arching of beds in valley bottoms and corresponding high-angle stress-relief fractures on hillsides, resulting in higher well yields in valley settings, intermediate yields on hillsides, and lowest well yields in hilltop settings. Kozar and others (2020) examined 777 wells in southern West Virginia and found this general pattern of well yields to be true with respect to topographic setting. The highest median well yield for the 777 wells of 30 gal/min was in valley settings, the lowest median well yield of 2.9 gal/min for wells in hilltop settings, and an intermediate median well yield of 12 gal/min for wells on hillside settings (fig. 8).
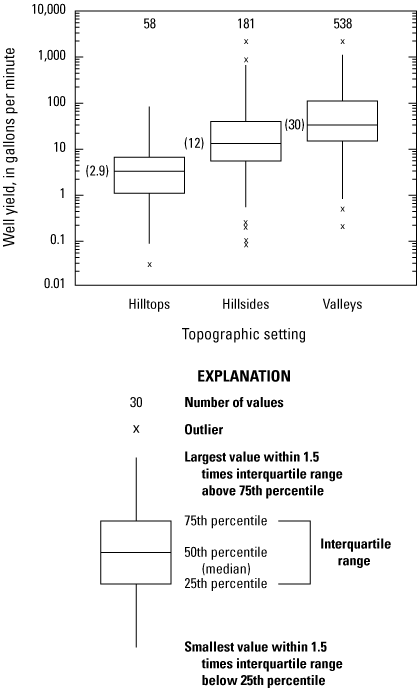
Boxplots showing the distribution of well yields with respect to topographic setting based on reported yields of 777 wells in 13 counties in southern West Virginia. Figure modified from Kozar and Paybins (2020).
The yield of wells in fractured-rock aquifers is dependent on the transmissivity of water-bearing fractures within the aquifer. Data collected for this study have provided considerable additional evidence to support earlier work by Ferguson (1967), Wyrick and Borchers (1981), and Kozar and others (2020). A plot of transmissivity derived for 84 wells that contained sufficient data from analysis of discrete-zone borehole fracture and flowmeter data for mapped water-bearing fractures using the USGS FLASH software (fig. 9) shows this same classic pattern of highest well transmissivity in valley settings, intermediate transmissivity in hillside settings, and lowest transmissivity in hilltop settings (fig. 9).
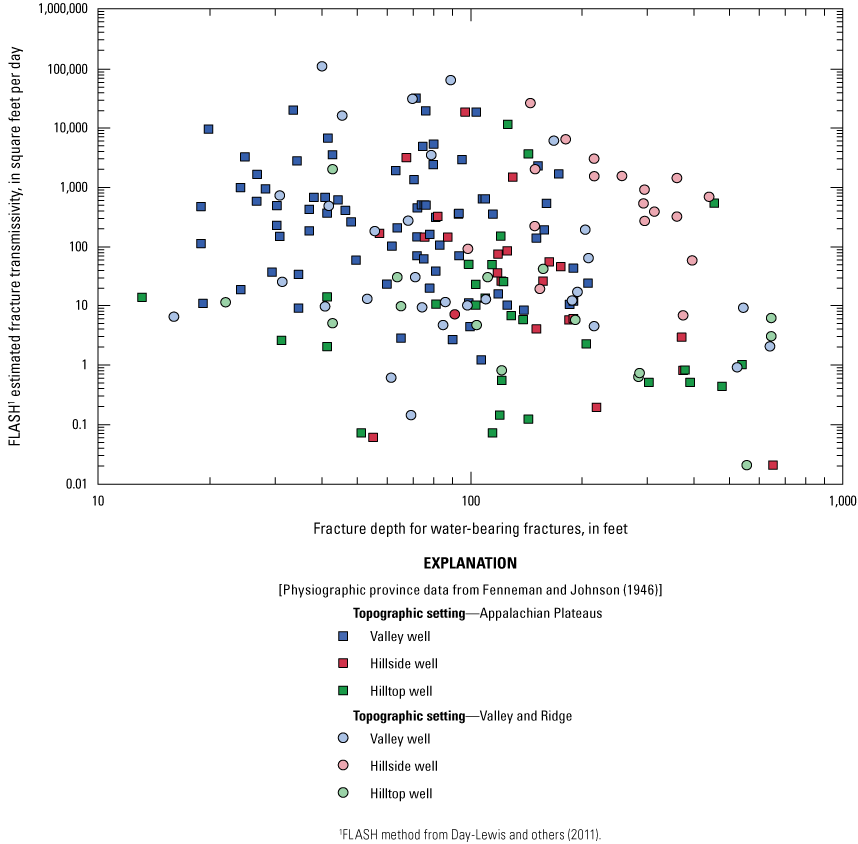
Scatterplot showing the flow-log analysis of single holes (FLASH) estimated transmissivity of water-bearing fractures in the Appalachian Plateaus and Valley and Ridge Physiographic Provinces classified by topographic setting. [Valley and Ridge Province data include data from two wells in the adjacent Blue Ridge Province.]
Transmissivity data from wells in the Appalachian Plateaus Province assessed with the USGS FLASH software (fig. 10) indicate similar topographic influence on transmissivity for wells with highest median well transmissivity (355 ft2/d) in valley settings, intermediate median transmissivity (45 ft2/d) in hillside settings, and lowest median transmissivity (6.7 ft2/d) in hilltop settings (fig. 10). Of water-bearing fractures for valley wells in the Appalachian Plateaus Province, 51 of 75 (68 percent) have transmissivity that equals or exceeds 100 ft2/d, but most hilltop wells (15 of 20 or 75 percent) and hillside wells (15 of 22 or 68 percent) have transmissivity less than 100 ft2/d.
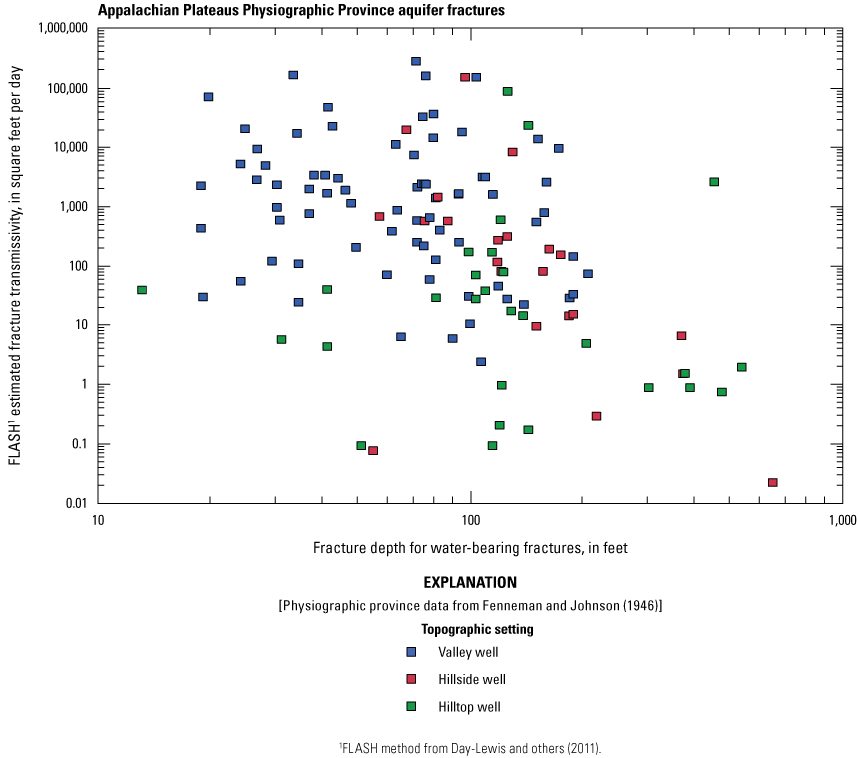
Scatterplot showing flow-log analysis of single holes (FLASH) calculated transmissivity for all aquifer fractures mapped in the Appalachian Plateaus Physiographic Province identified with respect to the topographic setting of the well.
Transmissivity data from wells in the Valley and Ridge Province show similar topographic controls as was observed in wells of the Appalachian Plateaus Province (fig. 11) with one major exception. For Valley and Ridge wells, 11 of 30 valley wells (37 percent) had water-bearing fractures with transmissivity in excess of 100 ft2/d, 14 of 19 hillside wells (74 percent) had fractures with transmissivity in excess of 100 ft2/d, and for hilltop wells only 1 of 15 water-bearing fractures (7 percent) had a transmissivity in excess of 100 ft2/d. In the Valley and Ridge Province (fig. 11), wells on hillsides had the highest median transmissivity (528 ft2/d), wells on hilltop settings had the lowest median transmissivity (5.7 ft2/d), and wells in valley settings had intermediate median transmissivity (16.9 ft2/d).
For this study, the data for wells on hillside settings were skewed toward high-yield wells, specifically within thin limestone units such as the Tonoloway and Helderberg Limestone Formations at depth, and may not be indicative of similar trends in transmissivity of fractures for other hillside wells completed within siliciclastic rocks within the Valley and Ridge Province.
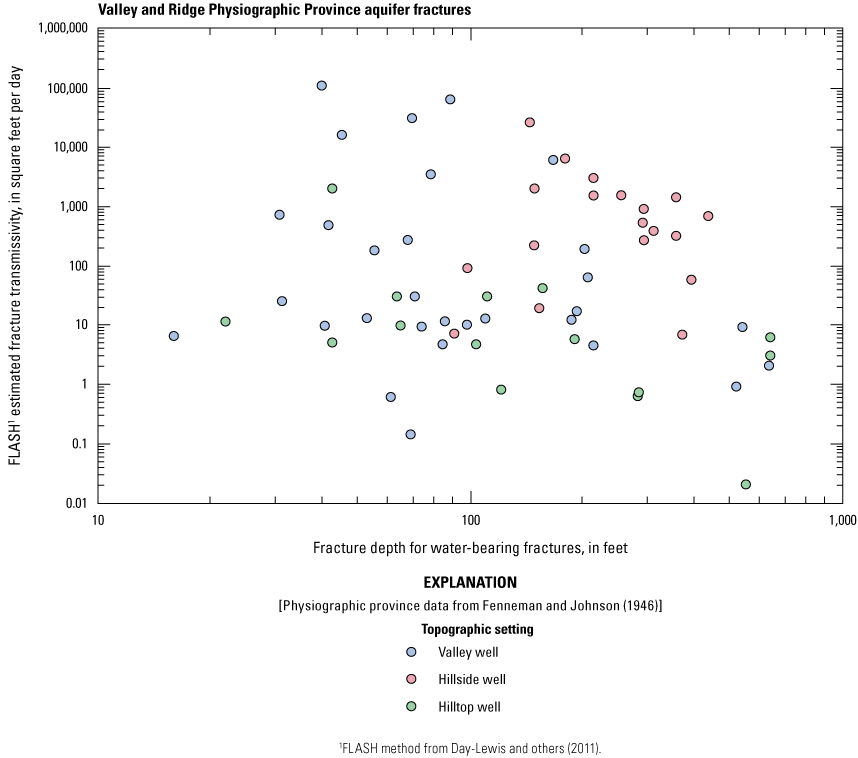
Scatterplot showing flow-log analysis of single holes (FLASH) calculated transmissivity for all aquifer fractures mapped in the Valley and Ridge Physiographic Province identified with respect to the topographic setting of the logged well. [Valley and Ridge Province data include data from two wells in the adjacent Blue Ridge Province.]
Physiography
Physiography strongly affects fracture distribution. For this study, data for 2,253 discrete fractures identified in 77 wells with mapped fractures logged in the Appalachian Plateaus Province were graphically compared with 1,150 discrete fractures identified in 38 wells with mapped fractures logged in the Valley and Ridge Province. Tadpole plots were used to show the distribution of fractures for the wells logged for the study and show the dip of the fracture from 0° to 90° and the direction of the dip of the fracture indicated by the tail on the tadpole from 0° to 360°. Tadpole plots for the 77 wells assessed in the Appalachian Plateaus Province show several trends (fig. 12). A large concentration of fractures has low dip angles of less than 30°. This pattern of fracturing is not unexpected because bedrock within the Appalachian Plateaus is typically flat to slightly dipping, and a preponderance of low-angle fractures consistent with the dominance of bedding planes on control of fractures is expected. Mapped fracture dips ranged from 0° to 360°. Because the dataset is statewide and variability in regional stress fields caused fracturing, faulting, and folding of the rocks within the State, such a wide distribution in apparent direction of fractures is to be expected. The distribution of water-bearing fractures mapped shows a decreasing trend with depth. Fewer water-bearing fractures are below depths of 215 ft than at shallower depths.
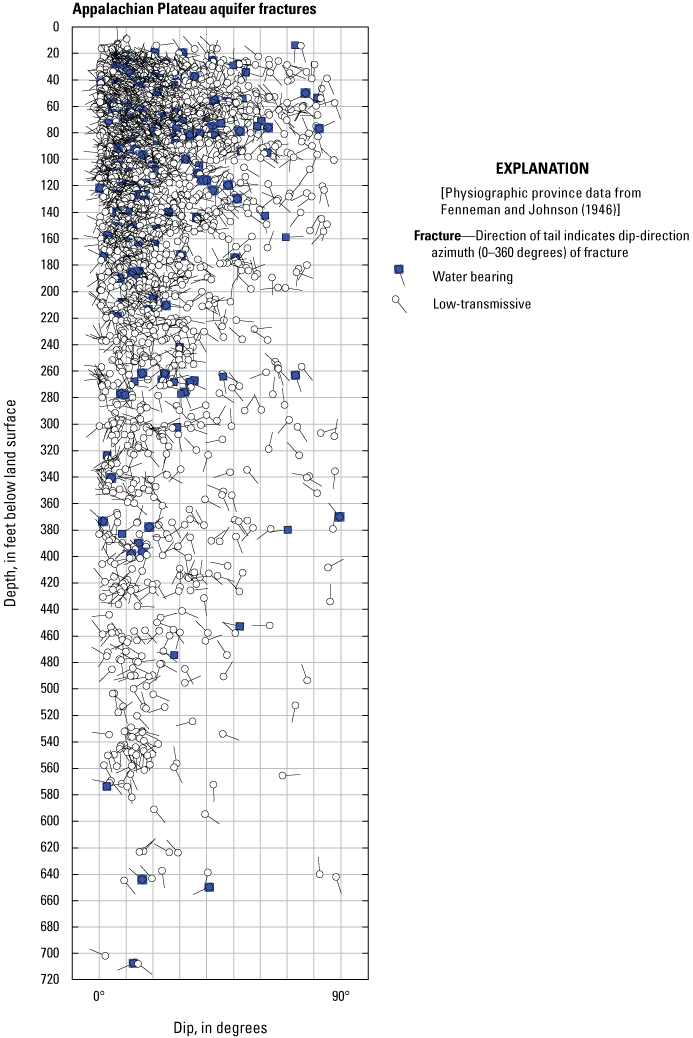
Tadpole plots showing distribution of water-bearing and low-transmissive fractures with dip angle shown on x-axis of plot and dip direction indicated by direction of tadpole tail (0–360°) for 2,253 discrete aquifer fractures from wells logged in the Appalachian Plateaus Physiographic Province in West Virginia.
The same fracture data plotted in the tadpole plots can be assessed by plotting the fracture data on a stereographic projection of poles to planes, commonly referred to as polar plots. In a polar plot, the fracture data are plotted as poles at a 90° angle to the fracture or bedding plane. To visually display a planar surface such as a bedding plane in bedrock with a northerly strike dipping due west at 45° (Lisle and Leyshon, 2004), a plot of poles to planes would place the pole at a 90° angle to the bedding plane, pointing downwards, and would plot in the southern hemisphere of the polar stereographic projection due east at 45°. A more rigorous explanation of stereographic projections of fracture data is provided in Lisle and Leyshon (2004).
A polar plot of fracture data for the Appalachian Plateaus Province (fig.13) shows wide variability in dip direction and angles. This was expected because of the major tectonic stress resulting in bedrock folding, faulting, and fracturing changes from the southern to the northern part of the State within the Appalachian Plateaus Province. However, the gently dipping bedding characteristic of the Appalachian Plateaus Province is evident in the plot by the large cluster of points near the center of the plot dipping from 0° to 40°. Overall, no other trends appeared in fracture orientation visible on the plot. Fracture patterns are more distinct within the abandoned underground coal mine aquifers and karst aquifers in the Greenbrier valley because fracture distribution is specific to the areas analyzed, whereas overall data distribution for the entire Appalachian Plateaus Province is highly variable as is consistent with the data shown on figures 12 and 13. Additional details about Greenbrier valley fractures will be discussed in the “Selected Areas of Specific Investigation” section of this report.
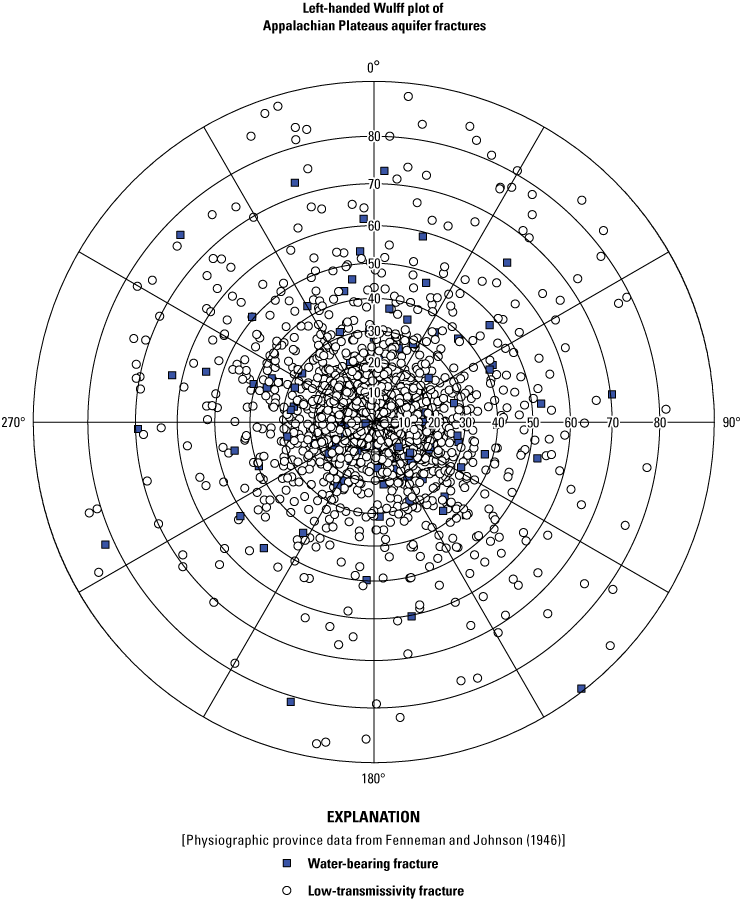
Polar plot showing all fractures identified for the statewide assessment of fracture controls on the occurrence and distribution of water-bearing and low-transmissive fractures within the Appalachian Plateaus Physiographic Province of West Virginia.
Tadpole plots for the 38 wells assessed in the Valley and Ridge Province also show several trends (fig. 14). There is a higher distribution of high-angle fractures in the Valley and Ridge Province than for fractures assessed in the Appalachian Plateaus Province. This is expected because the Valley and Ridge Province experienced significant folding and faulting during orogenic (mountain building) events. This folding and faulting resulted in long linear ridges and valleys in the Valley and Ridge Province rather than the slightly dipping strata characteristic of the Appalachian Plateaus. Additionally, the dip direction of strata in the Valley and Ridge Province is more consistent than the Appalachian Plateaus, and trend dominantly northwest to southeast, perpendicular to the general northeast-to-southwest strike of bedrock. Finally, the distribution of water-bearing fractures decreases with depth. Few water-bearing fractures are below a depth of 215 ft, and even fewer below a depth of 400 ft.
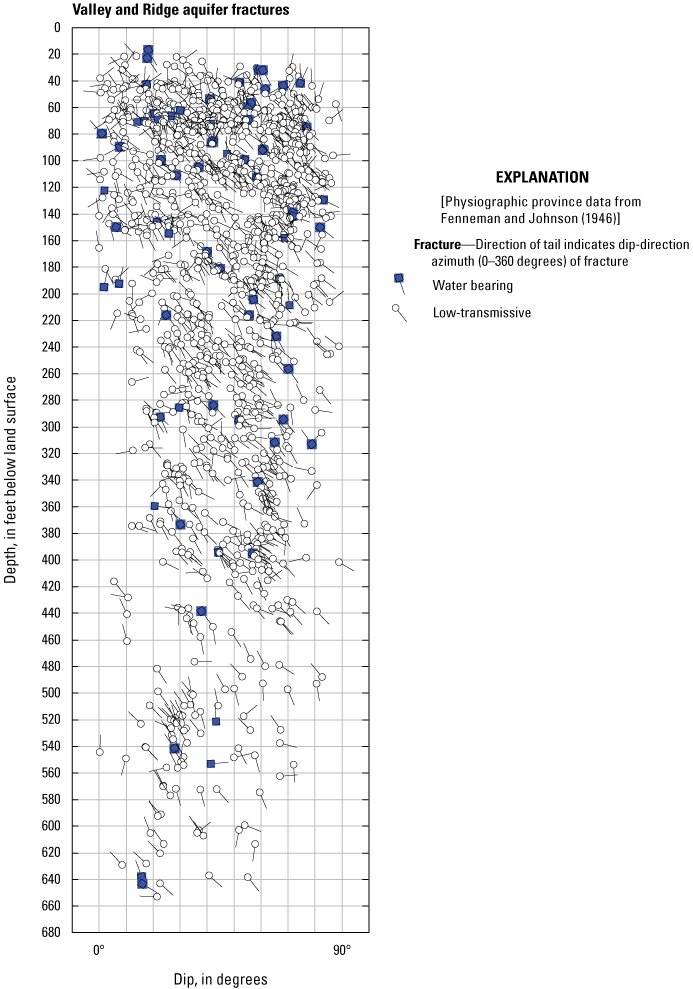
Tadpole plots showing distribution of water-bearing and low-transmissive fractures with dip angle shown on x-axis of plot and dip direction indicated by direction of tadpole tail (0–360°) for 1,150 discrete fractures from wells logged in the Valley and Ridge Physiographic Province in West Virginia. [Valley and Ridge Province data include data from two wells in the adjacent Blue Ridge Province.]
A polar plot of fracture data for the Valley and Ridge Province (fig.15) shows less variability in dip direction and angles and a strong clustering of points in the southwest and northwest quadrants of the plot. This is characteristic of the dip of bedding being primarily at right angles to the strike or major orientation of bedrock ridges within the Valley and Ridge Province, which trend southwest to northeast. This was expected because the major tectonic stress resulting in bedrock folding and faulting was from the southeast. Another trend in the fracture data visible on the plot is the larger distribution of fractures with steeper dip. Much of the bedrock in the Valley and Ridge Province has been subject to extreme stress caused by folding and faulting of the rock during orogenic processes. Overall, several apparent trends in fracture orientation are visible on the plot resulting from extensive folding and faulting due to past orogenic activity within the region. The large clustering of points in the northwest quadrant of the plot is indicative of the southeast dip of bedding prevalent within the study area.
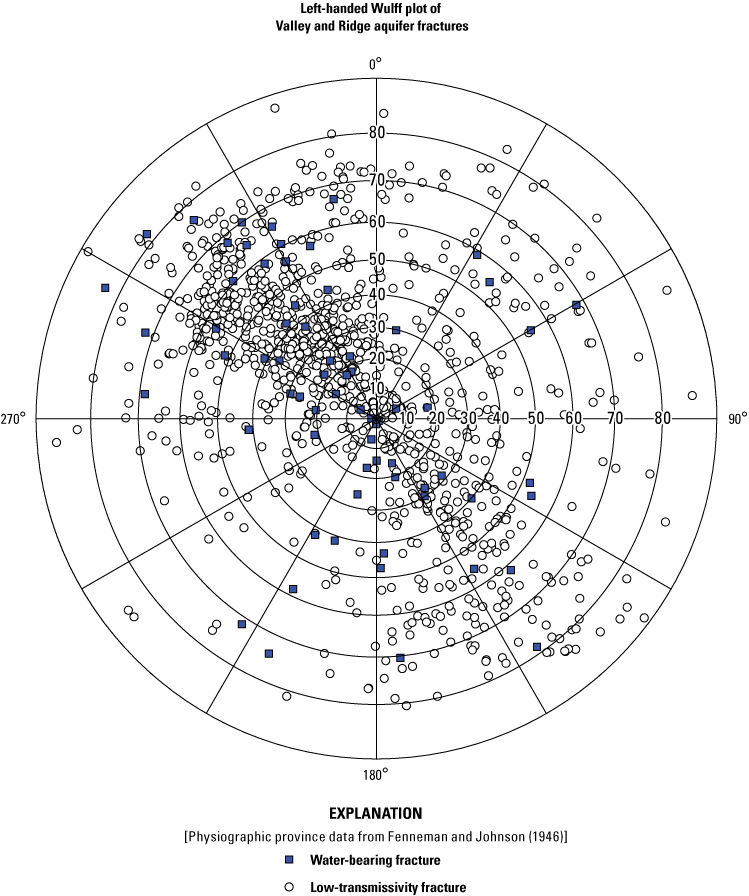
Polar plot showing all fractures identified for the statewide assessment of fracture controls on the occurrence and distribution of water-bearing and low-transmissive aquifer fractures within the Valley and Ridge Physiographic Province of West Virginia. [Valley and Ridge Province data include data from two wells in the adjacent Blue Ridge Province.]
Rose diagrams were used to assess dip angle (fig. 16) and dip direction (fig. 17) for fractures assessed within the Appalachian Plateaus Province. A rose diagram shows the predominant dip angle for fractures assessed within the Appalachian Plateaus Province are low-angle dips (fig. 16) with a large percentage of dip angles less than 15°. A rose diagram for dip azimuth (fig. 17) shows the wide distribution of dip azimuth for fractures assessed within the Appalachian Plateaus Province, owing to the low-angle dip of fractures within the province (mean dip angle of 2.2°) and variability in tectonic stress fields that varies across the State.
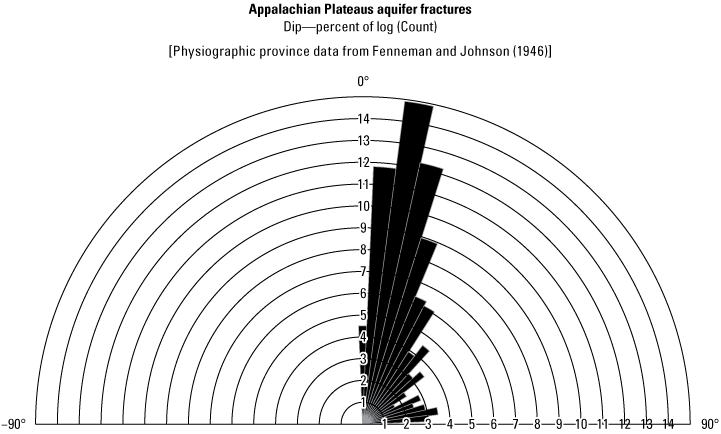
Rose diagram showing dip count and angles of dip for 2,253 discrete aquifer fractures mapped within the Appalachian Plateaus Physiographic Province in West Virginia.
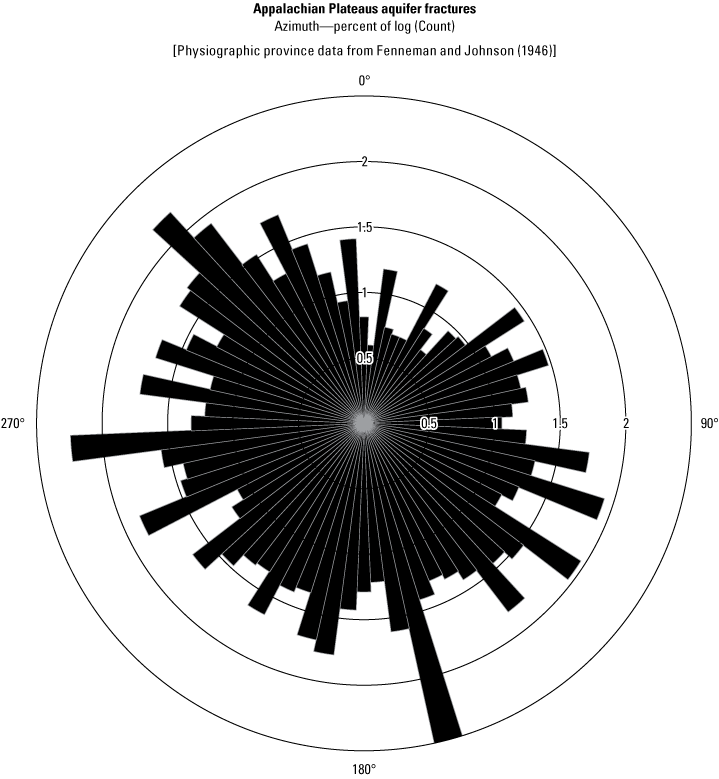
Rose diagram showing azimuth of fractures for 2,253 discrete aquifer fractures mapped within the Appalachian Plateaus Physiographic Province in West Virginia.
A rose diagram of the dip angle for fractures assessed within the Valley and Ridge Province revealed a large percentage of high-angle fractures, showing more than 50 percent of the fractures have a dip angle between 55° and 85° (fig. 18). Additionally, the rose diagram of dip directions for fractures in the Valley and Ridge Province shows a strong trend between 120° and 150°, perpendicular to the general strike of bedrock, which trends northeast to southwest (fig. 19). A smaller proportion of fractures trend 180° opposite to the general trend between 315° and 325°.
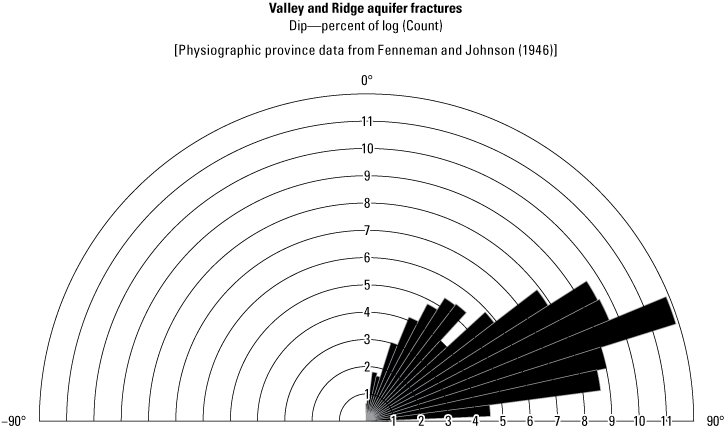
Rose diagram showing dip count and angles of dip for 1,150 discrete aquifer fractures mapped within the Valley and Ridge Physiographic Province in West Virginia. [Valley and Ridge Province data include data from two wells in the adjacent Blue Ridge Province.]
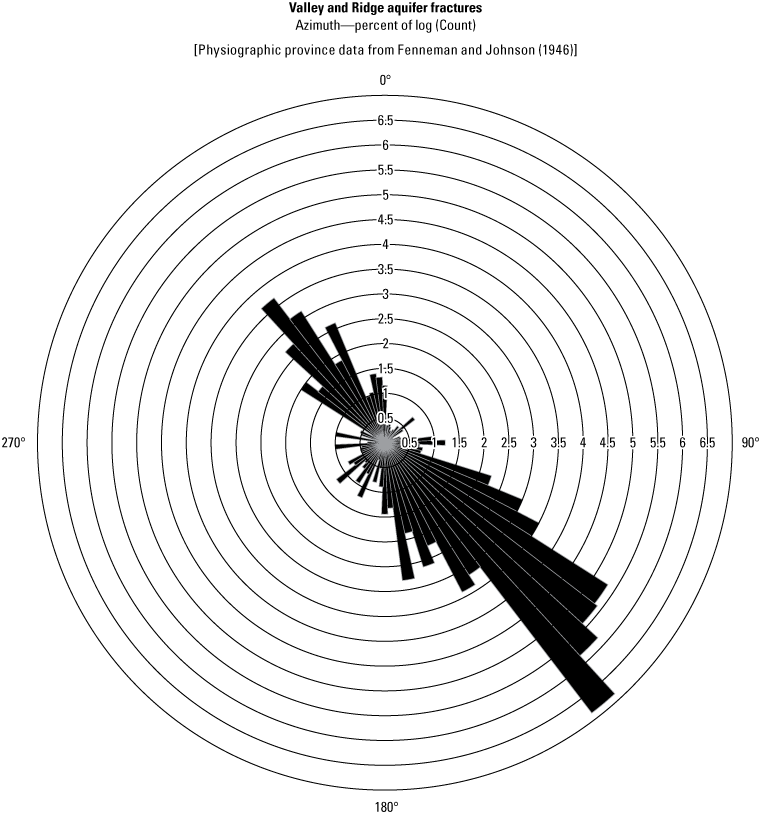
Rose diagram showing southeast to northwest trend in azimuth of aquifer fractures for 1,150 discrete fractures mapped within the Valley and Ridge Physiographic Province in West Virginia. [Valley and Ridge Province data include data from two wells in the adjacent Blue Ridge Province.]
The dip angle and the azimuth of water-bearing fractures are heavily skewed with respect to the physiographic province, showing much steeper fracture dips in the Valley and Ridge Province and mean fracture dips of 42.0 and median fracture dips of 41.9 degrees, than in the Appalachian Plateaus Province, with mean fracture dips of 23.9 and median fracture dips of 17.5 degrees. Fracture depth is slightly higher in the Valley and Ridge Province (mean fracture depth of 180.5 ft and median fracture depth of 133.3 ft) than within the Appalachian Plateaus Province (mean fracture depth of 140.9 ft and median fracture depth of 99.1 ft). These trends are also evident in the data plotted in figures 13, 14, 15, and 16.
Transmissivity also varies with respect to topographic and physiographic controls (fig. 20). Boxplots of water-bearing fractures with quantifiable transmissivity show distinct differences in transmissivity between hilltop, hillside, and valley wells (fig. 20A). Grouping fractures by physiographic province reveals an obvious difference in the distribution of water-bearing fractures (fig. 20B). The plot for transmissive water-bearing fractures for wells logged in the Appalachian Plateaus Province (fig. 20B) looks similar to the plot for well yields for 777 wells in 13 counties within the Appalachian Plateaus Province in southern West Virginia (fig. 8; Kozar and others, 2020). Median transmissivity was 355 ft2/d for valley, 45.0 ft2/d for hillside, and 6.7 ft2/d for hilltop wells for wells logged in the Appalachian Plateaus Province. Median transmissivity was 16.9 ft2/d for valley, 528 ft2/d for hillside, and 5.7 ft2/d for hilltop wells for wells logged in the Valley and Ridge Province.
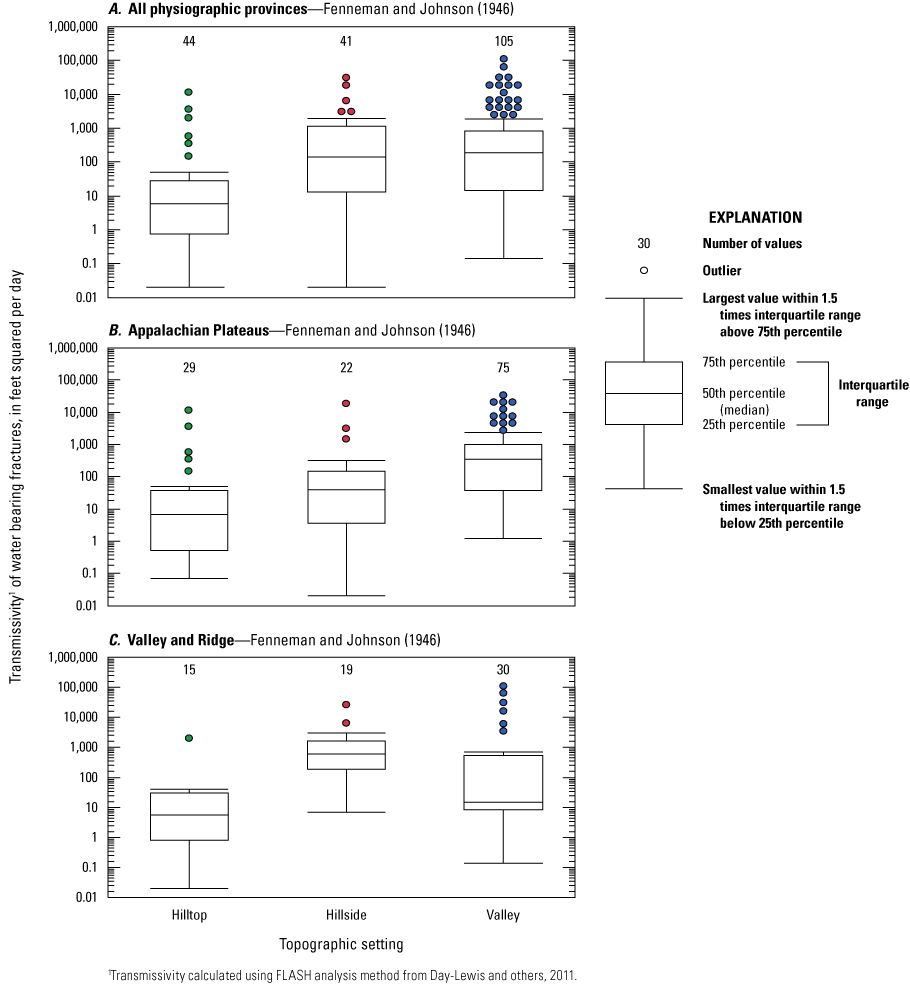
Boxplots showing the distribution of flow-log analysis of single holes (FLASH) calculated transmissivity for water-bearing fractures for, A, all physiographic provinces, B, within the Appalachian Plateaus Physiographic Province only, and, C, within the Valley and Ridge Physiographic Province only. [Valley and Ridge data include data from two wells in the adjacent Blue Ridge Province.]
The distribution of transmissivity as a function of topography is different for water-bearing fractures in the Valley and Ridge Province than in the Appalachian Plateaus Province (fig. 20C). Within the Valley and Ridge Province, transmissivity for water-bearing fractures is highest in hillside wells, having a higher median transmissivity than either hilltop or valley wells. The reason for this distribution is that the dataset of wells logged for the Valley and Ridge Province contained several wells that were drilled on hillsides, specifically targeting thin limestone units such as the Tonoloway and Helderberg Limestone Formations at depth. Therefore, some bias may be in the dataset of water-bearing fractures for hillside wells within the Valley and Ridge Province. Hilltop wells in the Valley and Ridge Province show similar lowest median transmissivity for hilltop wells, similar to that for the Appalachian Plateaus Province wells logged (fig. 20B). Additional discussion of these thin Silurian and Devonian carbonate aquifers will be discussed in more detail in the “Selected Areas of Specific Investigation” section of this report.
Depth Below Land Surface
Statistical results showing the total number of low transmissive and water-bearing fractures are summarized in table 2. A total of 3,403 fractures were identified based on this study’s analyses. Only 252 (7.4 percent) were identified as water-bearing. For the Appalachian Plateaus Province, 2,253 total fractures were identified, 2,072 (92.0 percent) of those fractures are low-transmissive fractures, and only 181 (8.0 percent) are water-bearing fractures. For the Valley and Ridge Province, 1,150 total fractures were identified, 1,079 (93.8 percent) of those fractures being low-transmissive fractures and only 71 (6.2 percent) being water-bearing fractures.
Table 2.
The distribution of low-transmissive and water-bearing fractures and their corresponding lithology for wells logged in the Appalachian Plateaus and Valley and Ridge Physiographic Provinces in West Virginia.[Physiographic province data from Fenneman and Johnson (1946). Valley and Ridge Provinces data include data from two wells in the adjacent Blue Ridge Provinces. —, not applicable]
A histogram of the distribution of mapped fractures for the Appalachian Plateaus (fig. 21A) and the Valley and Ridge Provinces (fig. 21B) clearly shows that most of the fractures are shallow features, typically less than 250 ft in depth. A similar histogram for only water-bearing fractures for the Appalachian Plateaus (fig. 22A) and the Valley and Ridge (fig. 22B) shows a similar pattern with most water-bearing fractures for Appalachian Plateaus aquifers and Valley and Ridge aquifers being less than 250 ft.
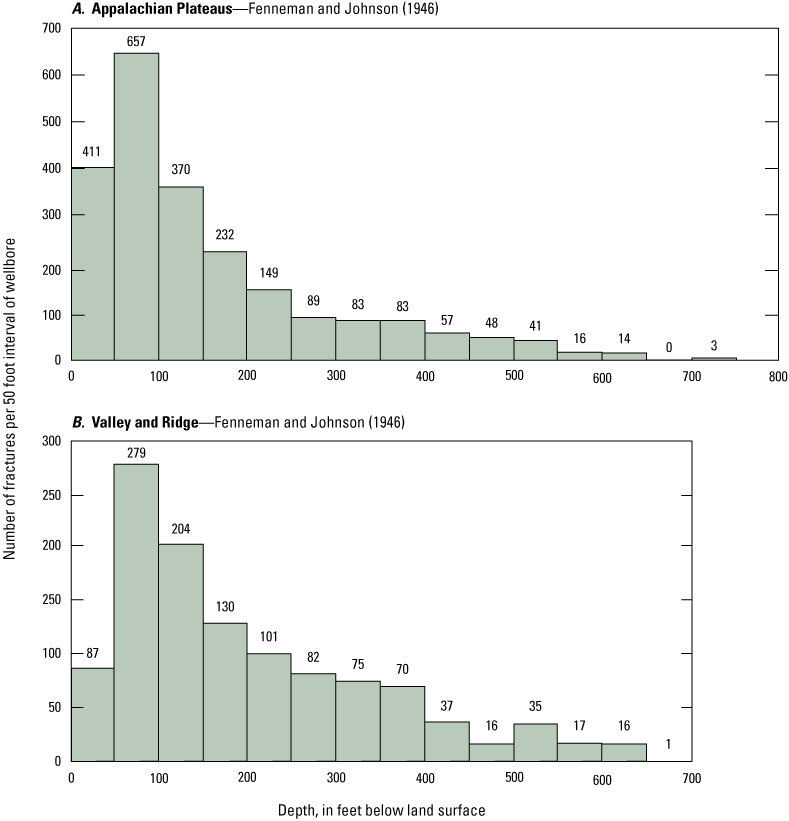
Histogram showing the distribution of water-bearing and low-transmissive fractures for each 50 feet of well depth for fractures mapped in, A, the Appalachian Plateaus Physiographic Province, and, B, the Valley and Ridge Physiographic Provinces (Valley and Ridge data include data from two wells in the adjacent Blue Ridge province).
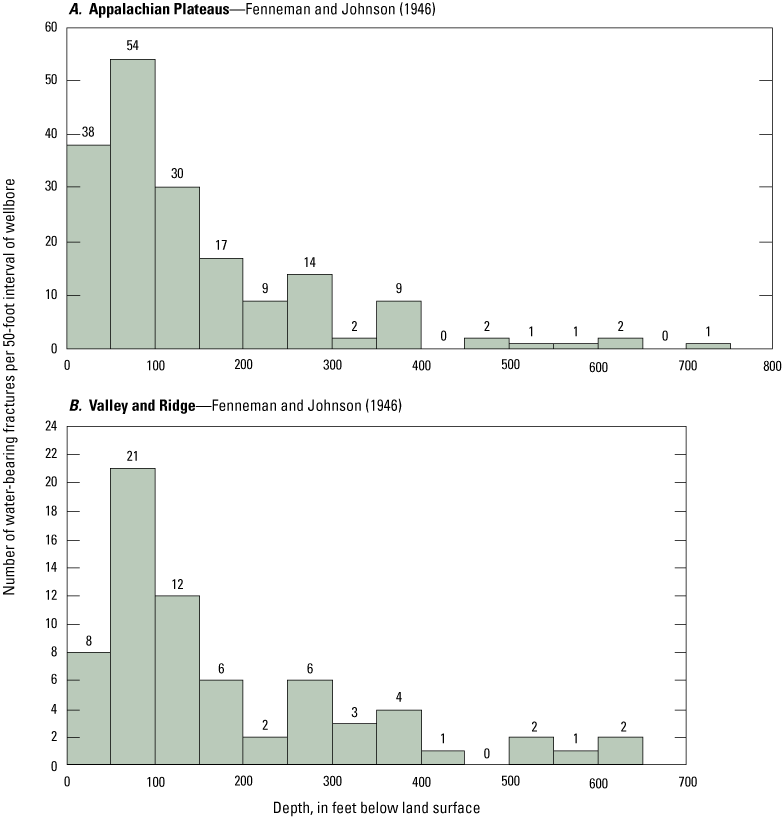
Histogram showing the distribution of water-bearing fractures only for each 50 feet of well depth for fractures mapped in, A, the Appalachian Plateaus Physiographic Province, and, B, the Valley and Ridge Physiographic Province (Valley and Ridge data include data from two wells in the adjacent Blue Ridge Physiographic Province).
Results of comparisons between characteristics of water-bearing fractures at depth in logged wells in the Appalachian Plateaus and the Valley and Ridge Provinces were assessed by Wilcoxon signed-rank tests for statistical significance. The tests indicate a statistically significant difference (p-value=0.001) in the number of water-bearing fractures in the depth range from 0 to 215 ft in contrast to the number of fractures at depths greater than 215 ft. Histograms of the fracture data alone do not allow a full assessment of the depth at which water-bearing fracture distribution begins to decrease. Cumulative distributions of water-bearing fractures with depth of well were prepared to better assess at what depth fractures, especially water-bearing fractures, start to diminish significantly. The cumulative distribution plots indicate a distinct break in slope beginning at a depth of 215 ft for the Appalachian Plateaus (fig. 23A) and Valley and Ridge (fig. 23B) Provinces, below which the number of water-bearing fractures diminishes quickly. Most water-bearing fractures are found at depths shallower than 215 ft within the Appalachian Plateaus (81 percent; fig. 23A) and Valley and Ridge (72 percent; fig. 23B) Provinces. These statistically significant differences observed in each cumulative frequency distribution plot were confirmed by Wilcoxon signed-rank tests of statistical significance (JMP Statistical Discovery LLC, 2022). In the Appalachian Plateaus Province, differences in frequencies of water-bearing fractures, above and below the 215-ft threshold, were found to be statistically significant, having probability values (p-values) of less than 0.0001 (p<0.0001). Similarly, differences in frequencies of water-bearing fractures in the Valley and Ridge Province were also found to be statistically different above and below a depth of 215 ft, having probability values (p-values) of less than 0.0001 (p<0.0001). In both instances, the small p-values indicate significant differences in frequencies of water-bearing fractures above and below a depth of 215 ft.
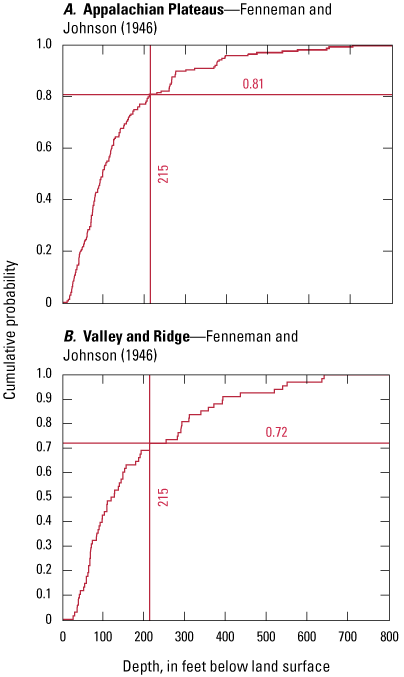
Cumulative frequency distribution plots showing probability of encountering water-bearing fractures with respect to well depth for fractures mapped in, A, the Appalachian Plateaus Physiographic Province, and, B, the Valley and Ridge Physiographic Province in West Virginia. Valley and Ridge data include data from two wells in the adjacent Blue Ridge Physiographic Province.
Lithostratigraphy
The distribution of fractures mapped for the wells logged within the Appalachian Plateaus Province for this study shows the overall distribution, water-bearing, and low-transmissive fractures with their corresponding lithology (fig. 24), and detailed summaries of the data with respect to lithology are shown in table 2. Lithology was determined by interpretation of the borehole geophysics logs collected for the study as previously discussed in the “Methods” section of the report. Four lithologies dominate the overall occurrence of fractures within the Appalachian Plateaus Province, argillaceous or shaly sandstone, massive sandstone, shale, and siltstone or silty shale. The distribution of the number of fractures for each lithologic unit is summarized in table 2. Statistical summaries of the data by major rock type and the ratio of the number of water-bearing to low-transmissive fractures are summarized in table 3. The highest ratio of water-bearing to low-transmissive fractures are found within coal seams within the Appalachian Plateaus Province (table 3), which emphasizes the importance of these relatively thin but prolific aquifers—typically only present in areas of active or legacy underground coal mining in the southern part of West Virginia.
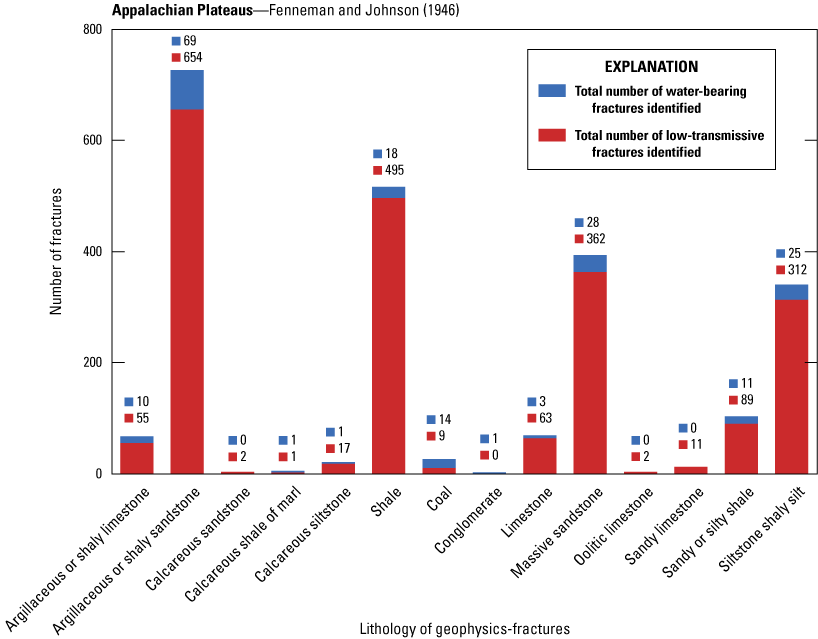
Bar graph showing the total water-bearing and low-transmissive fractures with their corresponding lithology for wells logged in the Appalachian Plateaus Physiographic Province in West Virginia.
Table 3.
Table showing the distribution of low-transmissive and water-bearing fractures with their corresponding lithology for wells logged in the Appalachian Plateaus and Valley and Ridge Physiographic Provinces in West Virginia.[Physiographic province data from Fenneman and Johnson (1946). Valley and Ridge Province data include data from two wells in the adjacent Blue Ridge Province. —, not applicable]
The distribution of fractures mapped for the wells logged within the Valley and Ridge Province (fig. 25) shows the overall distribution of low-transmissive and water-bearing fractures and the corresponding lithology for the fractures. Limestone is the dominant lithology for low-transmissive and water-bearing fractures within the Valley and Ridge Province, but argillaceous or shaly limestone and shale also play a prominent role with respect to producing low-transmissive and water-bearing fractures within the region. The Valley and Ridge Province contains prolific karst limestone aquifers of Ordovician age within the eastern panhandle (fig. 5) of West Virginia. Shale bedrock fractures easily and is commonly thought of as an aquitard, but the preponderance of fractures in shale units often results in them being prolific aquifers.
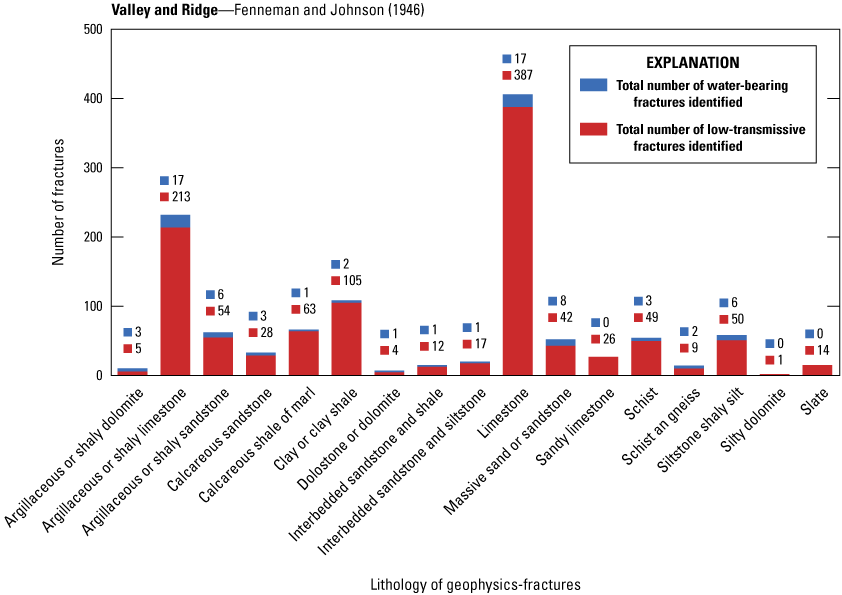
Bar graph showing the total water-bearing and low-transmissive fractures with their corresponding lithology for wells logged in the Valley and Ridge Physiographic Province in West Virginia. [Valley and Ridge Province data include data from two wells in the adjacent Blue Ridge Province.]
Patterns exist among fracture distribution and five West Virginia rock types—sandstone, shale, carbonates (limestone and dolomite), and metamorphic rocks (table 3). Regardless of rock type, the overall distribution of water-bearing fractures to the total number of all fractures assessed by rock type is low, ranging from 4.0 to 11.0 percent. Thus, only 1 in 10 to 1 in 20 fractures, depending on rock type and physiographic province, are water-bearing fractures, except coal seams.
Even though the total number of fractures mapped for wells logged within the Appalachian Plateaus Province for coal seams is low (only 1.0 percent of all fractures mapped), the ratio of water-bearing to the total number of fractures for coal seams is high (60.9 percent), which demonstrates the importance of these relatively thin but prolific aquifers.
Sandstone is the dominant rock type within the Appalachian Plateaus Province, comprising 49.5 percent of all fractures and 54.1 percent of water-bearing fractures. Shale or siltstone rocks hold 43.1 percent of all mapped fractures and 30.9 percent of water-bearing fractures. Finally, carbonate rocks comprise 6.4 percent of all mapped fractures and 7.2 percent of identified water-bearing fractures.
For logged wells in the Valley and Ridge Province, carbonate rocks are the dominant rock type, comprising 58.6 percent of all identified fractures and 53.5 percent of water-bearing fractures. Sandstone comprises 15.0 percent of all identified fractures but 26.8 percent of water-bearing fractures. Shale and siltstone comprise 19.7 percent of all identified fractures and 12.7 percent of water-bearing fractures. Finally, metamorphic rocks comprise 6.7 percent of all identified fractures and 7.0 percent of water-bearing fractures.
Prior to this study, sparse information was available to definitively link water-bearing fractures, or the distribution of highly transmissive fractures, to specific lithology across West Virginia. Work completed by the USGS in the Leetown (Kozar and others, 2007) area in Jefferson County found that certain carbonate-dominant geologic formations, especially those containing limestone with a high calcium carbonate content, could have wells with fractures exhibiting extremely high transmissivity. However, other limestone formations with lower carbonate content produced wells with much lower or little-to-no effective transmissivity. The same study showed that the Martinsburg Shale Formation, which is highly fractured in Jefferson County, produced relatively high median transmissivity when compared to the other geologic formations in the area but lacked the extremely high transmissivity that could be found in the more karstic limestone formations. Data collected for this study expands on the trends previously determined in earlier studies.
Stratigraphy can control the distribution of water-bearing fractures. Groundwater commonly flows from stress-relief fractures or bedding-plane partings (Wyrick and Borchers, 1981) where a permeable unit, such as a fractured sandstone or karstic limestone unit, sits atop a low-permeable bed, such as an unfractured shale or chert unit (fig. 26). Before this study, the prevalence or occurrence and distribution of such stratigraphic controlled water-bearing fractures within West Virginia was only based on anecdotal references. For this study, each water-bearing fracture was viewed with respect to its location in stratigraphic boundaries to determine the role of stratigraphy in controlling the occurrence and distribution of water-bearing fractures (Kozar and others, 2025). Of 252 identified water-bearing fractures with corresponding lithology, only 33 (13.1 percent) were located at an identifiable contact at or near two lithologies. Most fractures (205 of 252 or 81.3 percent) were within an individual lithologic unit. Coal mines were a special category having 10 fractures (4 percent) associated with abandoned coal mine workings and another 14 fractures (5.6 percent) attributed to mine subsidence fractures above mined coal seams. These results support the hypothesis that stratigraphy influences the overall distribution and occurrence of water-bearing fractures, but stratigraphic contacts may not be as important as previously thought.
The Appalachian Plateaus and Valley and Ridge Province have wide lithologic variability. Fourteen lithologic types were identified for the Appalachian Plateaus Province wells assessed (fig. 24), and 17 lithologic types were identified for the Valley and Ridge wells assessed (fig. 25). Other than schist, gneiss, and slate (which are all metamorphic rocks and are found solely in the Blue Ridge Province) and coal (which is of sedimentary origin in the Appalachian Plateaus Province) the type of rocks for which water-bearing fractures were identified were similar in the Appalachian Plateaus and Valley and Ridge Provinces (table 3). However, the distribution of carbonate rocks (argillaceous or shaly dolomite, argillaceous or shaly limestone, dolomite, and limestone) was dominant in the Valley and Ridge Province, having 674 of 1,150 (58.6 percent) fractures being in carbonate rocks whereas in the Appalachian Plateaus Province, sandstone (comprising 49.5 percent of all identified fractures and 54.1 percent of water-bearing fractures) and shale or siltstones (comprising 43.1 percent of all identified fractures and 30.9 percent of water-bearing fractures) were dominant. Basic statistical summaries of the water-bearing fracture data are presented in table 4 and can provide insight into the occurrence and distribution of water-bearing fractures in the complex fractured bedrock aquifers within the State of West Virginia.
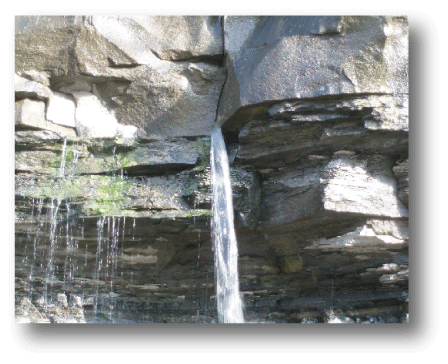
Photograph of groundwater flowing from vertical stress-relief fractures in a massive sandstone underlain by a low permeability shale layer in the Kopperston area, Wyoming County, West Virginia. Photograph by Mark D. Kozar, U.S. Geological Survey.
Table 4.
Table showing the fracture depth, dip, and transmissivity for wells logged in the Appalachian Plateaus and Valley and Ridge Physiographic Provinces in West Virginia.[Physiographic province data from Fenneman and Johnson (1946). Valley and Ridge Province data include data from two wells in the adjacent Blue Ridge Province. ft, foot; ft2/d, square foot per day; —, not applicable; std dev, standard deviation]
Computed transmissivity ranged widely for the 189 identified water-bearing fractures assessed using the USGS FLASH software, from a minimum of 0.02 ft2/d to a maximum of 109,600 ft2/d (table 4). The mean and median computed transmissivities also varied greatly because of the non-normal distribution of the dataset with the mean transmissivity being 2,508 ft2/d and the median transmissivity being 63.0 ft2/d. The standard deviation of the dataset was large at 10,268 ft2/d (table 4). The median transmissivity of water-bearing fractures was highest for wells logged in the Appalachian Plateaus Province (102 ft2/d) and lowest in the Valley and Ridge Province (30 ft2/d). Mean well yields were reversed. Valley and Ridge wells had a higher mean transmissivity (4,307 ft2/d) than wells in the Appalachian Plateaus (1,565 ft2/d). Wells in the Valley and Ridge Province have a higher percentage of wells drilled in karst carbonate aquifers, which can often exhibit extremely high transmissivity (maximum of 109,600 ft2/d) compared to wells within the Appalachian Plateaus Province (maximum of 31,800 ft2/d) and is responsible for the vast difference between median and mean transmissivities for the two principal physiographic provinces within the study area. Two fracture trace and lineament analysis studies were completed in Jefferson and Berkeley Counties in West Virginia (McCoy and others 2005a; 2005b) and clearly show the substantial variability of transmissivity for wells in karst aquifers of the Shenandoah Valley.
Porosity of Fractured-Rock Aquifers
There are two types of porosity. The first is primary porosity, which is associated with the intergranular spaces between individual grains of clay, silt, sand, or gravel, and the second is secondary porosity, which is associated with fractures such as bedding planes, joints, cleavage planes, and faults that store and yield water to wells (Freeze and Cherry, 1979). In West Virginia, the only rock types that typically contain appreciable primary porosity are shales, siltstones, sandstones, and varying degrees of rock grading between these end members. While the primary porosity between the individual grains of clay or silt can be high in siltstones and shales, the rocks themselves typically do not yield water readily from these pore spaces, so the effective porosity is low. Sandstone and conglomerate rocks can have high porosity up to 30 percent, but many are so well cemented with silica cement as to have very low primary porosity (Freeze and Cherry, 1979). Most carbonate rocks such as limestone and dolomite are so well cemented with calcite or lithified that they also have little to no primary porosity. Shale and siltstone have a high primary porosity, but their pore spaces are so small that their effective porosity is low (Freeze and Cherry, 1979). This study concluded that fractured-rock aquifers in West Virginia have secondary porosity features such as bedding planes, joints, cleavage planes, faults, and other fractures in the rock, which provide most of the appreciable porosity for the siliciclastic and carbonate rocks comprising them.
Borehole geophysical analyses completed for this study provided the first comprehensive assessment of aquifer porosity for the fractured-rock aquifers in West Virginia. The primary borehole geophysics tool employed for these investigations was the full-wave sonic porosity tool. The tool emits a pulse of sound into the borehole, and return echoes are recorded at three separate receivers on the tool. The return times or echoes received by these three receivers can provide estimates of primary and secondary porosity.
Sonic porosity was evaluated in 74 boreholes in fractured-rock aquifers across West Virginia. Median and average values of porosity were assessed for formations greater than 5 ft in thickness and grouped into seven rock types (table 5). Sandstone rock type represents aquifers primarily composed of sandstone and sand-sized particles with less than 10 percent shale volume. The median and average total shale-corrected sonic porosity of sandstone aquifers was estimated to be 14 percent. The argillaceous or calcareous sandstone aquifers are composed of sandstone with fine-grained or calcareous proportions greater than 10 percent. Shale-corrected sonic porosity calculated for fine-grained lithologies had lower values ranging from 5 percent in argillaceous sandstones to 0 percent porosity calculated for siltstones and shales. This shows that sandstone aquifers in West Virginia likely have higher effective porosity than fine-grained or mineralized aquifers such as those with substantial argillaceous or calcareous proportions.
Table 5.
Summary of shale-corrected sonic porosity for selected lithologies in West Virginia.Total and shale-corrected values of porosity for carbonate aquifers, including limestone and dolomite, had median and average values of less than 4 percent and generally can be considered mineralized with low effective porosity. Porosity slightly increased to 4 to 5 percent for argillaceous or sandy limestone in contrast to clean limestone (2 to 4 percent), but these values may be affected by a high shale content. Shales and siltstones had a relatively high total sonic porosity when compared to other lithologies, but the compared lithologies often have bound water that is not effectively part of the groundwater flow system. Considering the shale-corrected values for shale and siltstone (0 to 2 percent), fine-grained lithologies should be considered minimally effective or not effective at yielding water beyond that produced as secondary porosity in bedding planes and associated fractures such as joints, faults, and cleavage planes.
Hydraulic Head
Hydraulic head was calculated based on results of EM-flowmeter logs, monitored pump discharge rates, and groundwater-level measurements made prior to and during the pumping of wells logged for EM-flowmeter analysis. Head estimates derived from FLASH analysis of EM-flowmeter logs, pumping rates, and water-level measurements made assessing whether water was moving upward or downward within a borehole possible. Flow, either upward or downward within the borehole, was assessed by topographic setting and physiographic province (table 6).
Directions of flow were assessed for 118 borehole intervals; downward flow was exhibited for 61 intervals, and upward flow was exhibited for 57 intervals overall. In simple hydrogeologic systems, areas receiving active recharge often have a downward flow, and groundwater discharge areas often have an upward flow. However, complex lithostratigraphic influences and geologic structure make this simple assessment less obvious. For example, valley settings are commonly thought to be groundwater discharge areas, so upward flow would be expected in valley settings. Conversely, hilltops are commonly thought to be groundwater recharge areas, so downward flow would be expected in hilltop areas. Hillside settings could exhibit either upward or downward flow, depending upon local geologic and lithostratigraphic controls.
Generally, the data in table 6 show a much larger number of intervals (52) exhibiting upward flow in valley or hillside settings than in hilltop settings (only 5 intervals with upward flow). When the data are parsed with respect to physiographic province, the relations between upward and downward flow and topographic setting become more complex.
For the Appalachian Plateaus Province, in valley settings, 22 of 61 borehole intervals (36 percent) exhibit upward flow, and 39 of 61 borehole intervals (64 percent) exhibit downward flow. In hillside settings, 11 of 12 borehole intervals (92 percent) exhibit upward flow, and 1 of 12 borehole intervals (8 percent) in hillside settings exhibit downward flow. In hilltop settings, 3 of 9 (33 percent) borehole intervals exhibit upward flow, and 6 of 9 (67 percent) borehole intervals exhibit downward flow. Thus, downward flow is dominant in hilltop and valley settings within the Appalachian Plateaus Province. The dominant number of borehole intervals with upward flow in hillside settings within the Appalachian Plateaus Province was unexpected but may simply indicate the dominance that perched aquifers have on the overall hydrogeologic setting within the Appalachian Plateaus Province, given that perched intervals are common in bedrock aquifers within the Appalachian Plateaus. Within the Appalachian Plateaus Province in West Virginia, the alternating sequences of sandstone, shale, siltstone, coal, and limestone often result in perched aquifers. Downward flow in valley settings may represent recharge to deeper subregional or regional aquifers.
For the Valley and Ridge Province, in valley settings, 7 of 15 borehole intervals (47 percent) exhibit upward flow, and 8 of 15 borehole intervals (53 percent) exhibit downward flow. In hillside settings, 12 of 14 borehole intervals (86 percent) exhibit upward flow, and 2 of 14 borehole intervals (14 percent) exhibit downward flow. In hilltop settings, 2 of 7 (29 percent) borehole intervals exhibit upward flow and 5 of 7 (71.4 percent) exhibit downward flow. Thus, downward flow is dominant in hilltop settings within the Valley and Ridge Province. Groundwater flow processes within the Valley and Ridge are governed by flow down dip along bedding that then discharges upward near valley floors or in hillsides immediately adjacent to valley bottoms, and the water often undergoes geothermal heating as it flows to depth within the bedding of permeable layers such as thin limestones of the Helderberg or Tonoloway Limestone Formations or within permeable sandstones such as the Oriskany sandstone (Hobba and others, 1979; Lessing and others, 1991). Thus, the high percentage of borehole intervals exhibiting upward flow in hillside settings within the Valley and Ridge Province may be characteristic of the deep circulation of groundwater along bedding.
Table 6.
Summary of head distribution for fractures having transmissivity greater than 1.0 feet squared per day segregated by topographic setting and direction of flow (either upward or downward).Selected Areas of Specific Investigation
Abandoned underground coal mine aquifers in southern West Virginia and karst carbonate aquifers within the Shenandoah valley and Greenbrier valley aquifers were examined in more detail because of the complexity of groundwater-flow processes in these areas. These aquifers are heavily relied on as a source of water for municipal, residential, commercial, and industrial supply, and the karst carbonate aquifers are a source of water for agricultural supply (Kozar and others, 2023; Kozar and others, 2025).
Abandoned Underground Coal Mine Aquifers
Abandoned underground coal mine aquifers have been a prolific source of groundwater for public supply in southern West Virginia and elsewhere (fig. 7; Kozar and others, 2012). The deep interconnected passageways in the underground mines provide substantial storage for groundwater and are commonly referred to as “mine pool aquifers” or simply “mine pools.” However, this study has documented that mine pool aquifers often are not pools of water at all, but rather collapsed overburden strata and pillars that form a very high-porosity rubble zone commonly referred to as gob. Therefore, the term “mine pool” or “mine pool aquifers” is not accurate. “Abandoned underground coal mine aquifer” is a more representative term because it covers not only the recently abandoned mines where pools of water may actually exist, but also most older mines where overburden strata and pillars have collapsed, leaving behind a high-porosity, high-permeability zone of rubble (gob). Abandoned room and pillar mines, especially when the pillars are mined on the retreat phase of mining, only remain open for short and (or) undocumented periods. Longwall coal mining is designed to recover as much coal as possible, while the resulting overburden strata are designed to collapse as the shear (a rotating metal drum with cutting teeth) advances along the longwall panel, creating extensive zones of overburden collapse (Shultz, 1988).
Well logs from abandoned underground coal mine aquifers were assessed to better investigate their porosity and composition. A total of 56 wells were logged in geologic formations known to include coal seams (Kozar and others, 2025). However, not all the wells logged included coal seams, and of the 56 wells potentially containing coal seams, only 8 were documented as either containing a coal seam or were completed in abandoned mine workings. Of those 8 wells, 4 were completed in abandoned underground coal mines—wells Bar-0152, Mcd-0206, Mcd-0225, Mcd-0226, and Wyo-0290 (Kozar and others, 2025).
Close examination of the optical televiewer log for well Wyo-0290 (fig. 27) shows a distinct collapse zone of overburden strata in the interval between 274.9 and 276.4 ft below land surface that was once occupied by a coal seam that was completely mined out in this interval, leaving the rubble zone visible in the image. Collapse of the overburden strata resulted in subsidence fractures above the roof of the mine at 266.3, 267.4, and 267.8 ft below land surface.
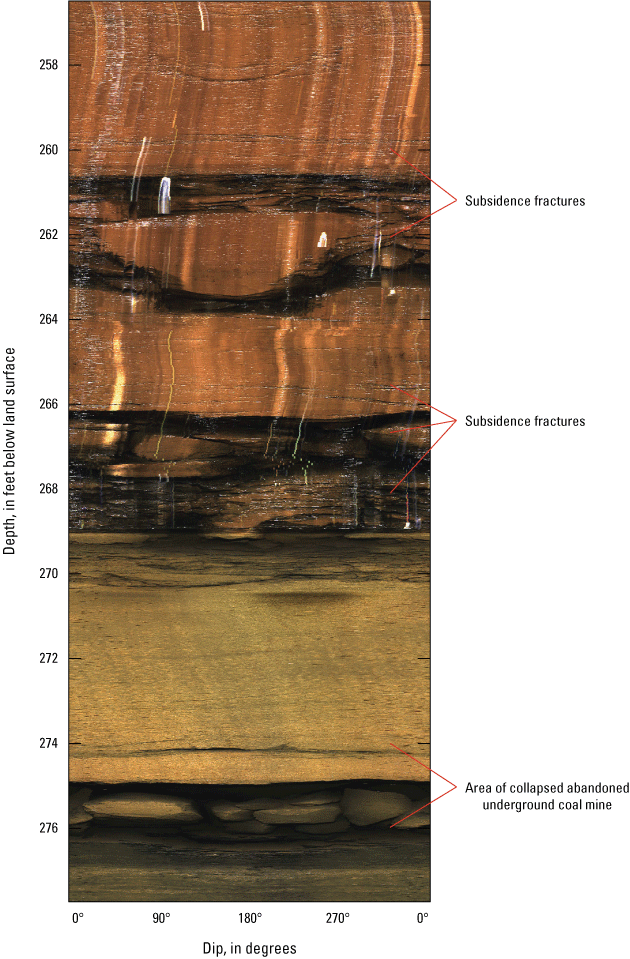
Image of an optical televiewer log section showing collapsed underground coal-mine workings and subsidence fractures in well Wyo-0290 near Ravencliffe, West Virginia.
A mined-out area similar to the area in well Wyo-0290 was observed in well Bar-0152 in Audra State Park (fig. 28) at a depth between 79.7 and 85.7 ft below land surface; however, in well Bar-0152, there was less aperture for the overlying subsidence fractures above the collapsed mine workings at depths of 67.0, 70.6, 75.8 ft below land surface, potentially due to several factors including: the age of the abandoned mine workings; type of mining activity (room and pillar versus longwall); or composition of the overburden strata. For this well, the overburden strata are comprised of a hard, competent, somewhat argillaceous or shaly sandstone, and the composition of the overburden strata may be responsible for the lack of subsidence fractures with visible aperture above the abandoned underground coal mine workings.
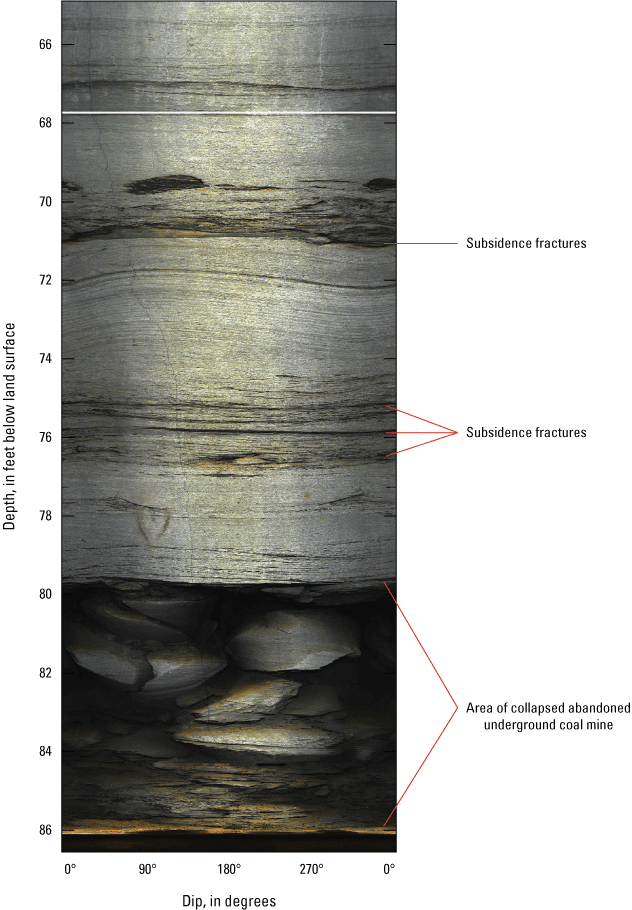
Image of an optical televiewer log section showing collapsed underground coal-mine workings in well Bar-0152 in Audra State Park near Audra, West Virginia.
Well Mcd-0225 was completed to the abandoned mine workings of a very old (greater than 50 years since mining ceased) abandoned coal mine in the Elkhorn area in McDowell County in southern West Virginia. There is little evidence that the 6 ft thick Pocahontas No. 3 coal seam even existed in this interval because the coal pillars were evidently pulled and the entire overburden strata above the mine pancaked down into the abandoned underground coal mine workings (fig. 29). This type of collapse feature would be typical of wells completed in abandoned longwall coal mines where the overburden strata are designed to collapse upon retreat of the shear as it passes the face of the mine. For the Elkhorn area, the abandoned underground coal mine workings largely dewatered overlying intervals of bedrock, and the Pocahontas No. 3 coal seam became the interval controlling groundwater levels within the aquifer (Kozar and others, 2012).
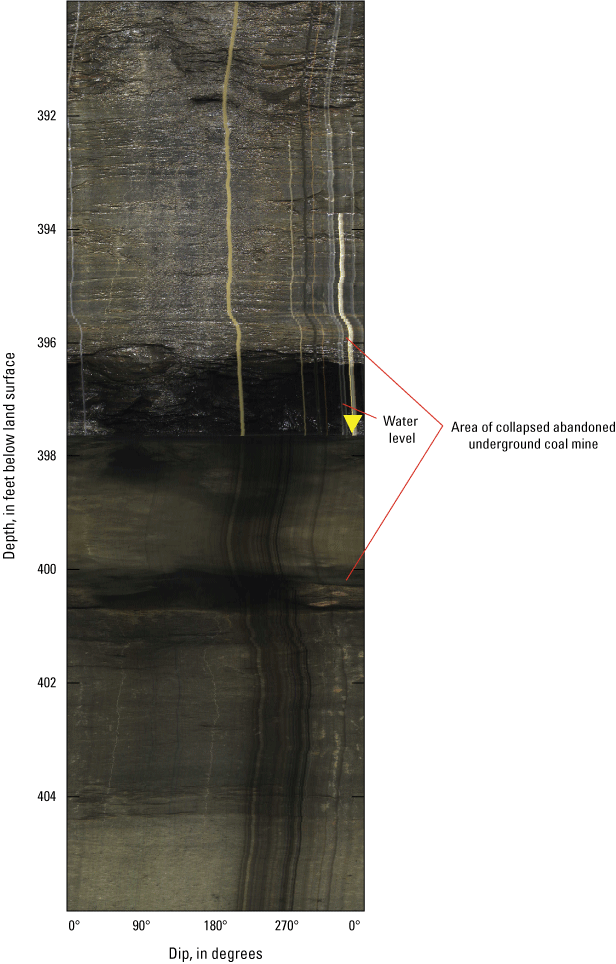
Image of an optical televiewer log section showing collapsed underground coal-mine workings and water level in well Mcd-0225 at Elkhorn, West Virginia.
An optical televiewer log for well Mcd-0226 (fig. 30) in the Elkhorn area shows a section of open mine entry, or void, in a section of the mine in which the overburden strata and coal pillars have not completely collapsed. The overburden strata for this well is composed of a massive sequence of slightly argillaceous sandstone, which was competent and resisted collapse. In this well, the thickness of the Pocahontas No. 3 coal seam for the mines in the Elkhorn area can be observed because in this well, the thickness of the coal seam was greater than 5 ft.
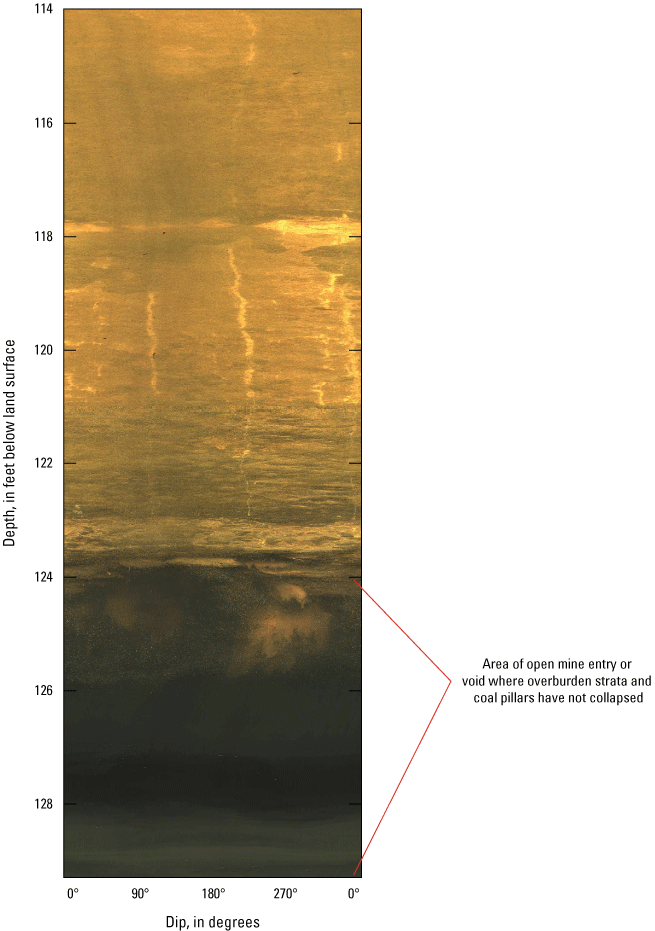
Image of an optical televiewer log section showing an open mine entry in an underground coal mine in well Mcd-0226 at Elkhorn, West Virginia.
The above examples from borehole logs completed in abandoned underground coal mines should help better characterize the nature of abandoned underground coal mine aquifers. Extensive pools of water may reside in abandoned coal mine entries, as evidenced by the optical televiewer image for well Mcd-0226 (fig. 30), and mine entries can remain open for periods of time immediately upon cessation of mining. However, in many cases such open pools of water do not exist. Often, open pools of water are replaced by extensive areas of abandoned collapsed overburden strata and collapsed coal pillars forming a very porous rubble zone akin to a glacial outwash aquifer, as evidenced by the optical televiewer logs for wells Wyo-0290, Bar-0152, and Mcd-0225 (figs. 27, 28, and 29). Regardless, these extensive abandoned underground coal mine aquifers are often formed by large interconnected abandoned coal mine workings where several adjacent abandoned mines are hydraulically connected. These areally extensive interconnected abandoned mine workings result in prolific aquifers for water supply in areas where the coal seams contain a low pyrite or sulfur content, such as is common in the Pocahontas coal seams of southern West Virginia (Kozar and others, 2012).
Areally Extensive Carbonate Aquifers
In West Virginia, two principal areas comprise large, areally extensive carbonate aquifers. These include the Cambro-Ordovician age karst aquifers in the eastern panhandle in Jefferson and Berkeley Counties and the Mississippian age karst aquifers in the southern part of the State in Monroe, Greenbrier, and Pocahontas Counties (Jones, 1997). Both karst aquifers are prolific sources of water for public water systems and agricultural, commercial, and individual residential homeowner use (U.S. Geological Survey, 2025c).
Shenandoah Valley Karst Aquifer
The Cambro-Ordovician age karst aquifer system within the Shenandoah Valley in West Virginia crops out in the eastern panhandle counties of Jefferson and Berkeley. This karst aquifer system has outcrops of Ordovician age limestone and dolomite that crop out in thin bands elsewhere, such as in Monroe County along the thrust fault separating the Appalachian Plateaus and Valley and Ridge Provinces, and can form prolific aquifers (Kozar and others, 2023). The USGS has completed multiple investigations of karst aquifers in Jefferson and Berkeley Counties, but only one of those studies in the Leetown area of Jefferson County included collection of borehole geophysical data (Kozar and others, 2007) for assessing controls on fracture occurrence and distribution. Additional wells were logged during the current study to provide a more thorough understanding of groundwater-flow processes in this complex, fractured, karst-dominated aquifer system.
Twenty-four fractures were identified in sixteen wells, 13 in Jefferson County and 3 in Berkeley County (Kozar and others, 2025; table 7), and were available for assessment of the various factors controlling the occurrence and distribution of fractures in the Shenandoah Valley karst aquifer. Transmissivity was computed for 17 fractures from 11 of the 16 wells logged and ranged from a minimum of 0.80 to a maximum of 109,600 ft2/d (table 7). Mean transmissivity for the 17 discrete fractures for which transmissivity was computed was 13,853 ft2/d, but the median value was only 58 ft2/d, which is indicative of the extreme variability in fracture transmissivity for karst aquifers. Higher transmissivity values are commonly associated with large water-filled solution conduits or caves, and lower transmissivity values are characteristic of the more diffuse fracture-dominated parts of the aquifer (table 7).
Table 7.
Table of water-bearing fractures, depth, azimuth, dip, lithology, and transmissivity identified as part of the statewide analysis of fracture data from 16 wells in the Shenandoah Valley karst aquifer in the Valley and Ridge Physiographic Province in the eastern panhandle of West Virginia.[Aquifer data from Kozar and Paybins (2016). Physiographic province data from Fenneman and Johnson (1946). ft2/d, square feet per day; max., maximum; —, no transmissivity estimate for these fractures; NA, not applicable; min., minimum]
Bedrock strike is the direction or trend that a structural surface, for example, a bedding or fault plane takes as it intersects the horizontal, and bedrock dip is usually 90° perpendicular to bedrock strike (Gary and others, 1972). The distribution of water-bearing and low-transmissive fractures for the Shenandoah Valley karst aquifer are shown in tadpole plots (fig. 31). The azimuth and dip angle, as depicted in the tadpoles, show the high variability in dip angle and azimuth of the fractures and a higher distribution of high dip angles for deeper fractures. The same data are shown in rose plots of dip angle (fig. 32) and dip azimuth (fig. 33). A high distribution of water-bearing fractures are shallow in the aquifer (fig. 31), which is consistent with data for the Valley and Ridge Province (fig. 23B), and the rose diagram of dip angle (fig. 32) shows a high density of high-angle dipping fractures for the aquifer and a strong correlation to overall dip of bedding perpendicular to the strike of bedrock within the region, as shown in a rose plot of dip azimuth (fig. 33).
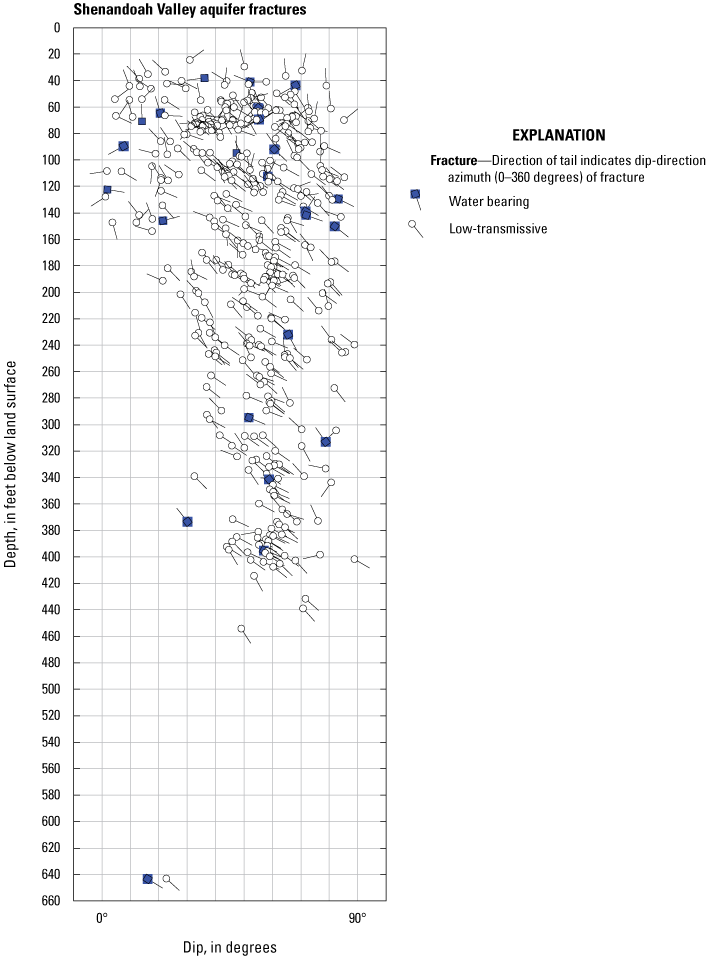
Tadpole plots showing distribution of water-bearing and low-transmissive fractures with dip angle shown on x-axis of plot and dip direction indicated by direction of tadpole tail (0–360°) for wells logged in the Shenandoah Valley karst aquifer in West Virginia.
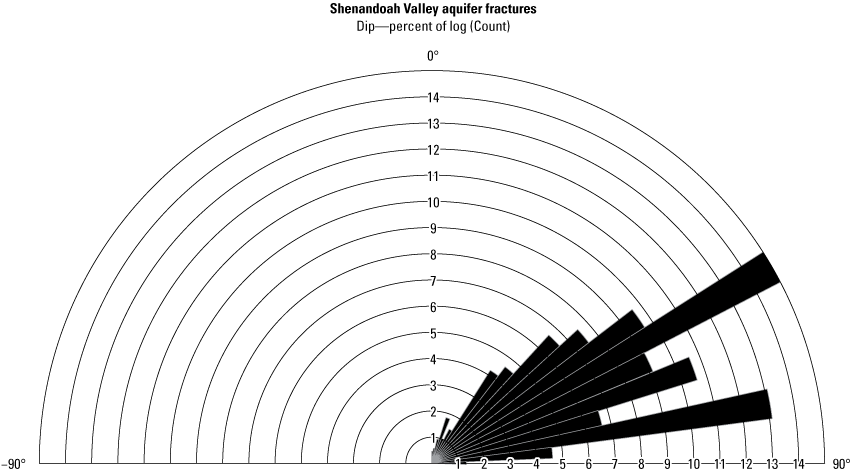
Rose diagram showing dip count and dip angles for all fractures mapped in the Shenandoah Valley karst aquifer in West Virginia.
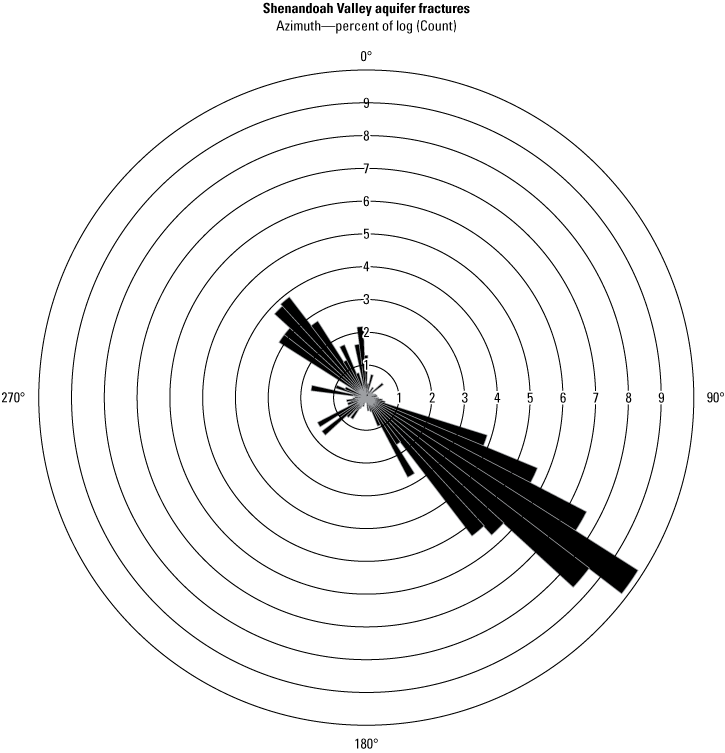
Rose diagram showing azimuth of fractures for all fractures mapped within the Shenandoah Valley karst aquifer in West Virginia.
Kozar and others (2007) provide a thorough description of the karst aquifer within the Shenandoah Valley of West Virginia based on borehole and surface geophysical research and installation of wells and piezometers collected for hydrogeologic investigations in or near Leetown, West Virginia. Kozar and others (2007) state numerous fractures intersect a borehole, but usually only one or two fractures are large water-bearing fractures. According to Kozar and others (2007), many smaller fractures provide storage potential for water but are not major avenues of groundwater flow. The less dominant fractures provide groundwater storage capacity and yield water to larger, more dominant water-bearing fractures, which in turn are drained by solution conduits within the carbonate rock commonly found along thrust and cross-strike faults or along bedding planes and drain water over a wide area. Kozar and others (2007) also conclude that the smaller diffuse-flow-dominated network of fractures that provides most of the storage occupies a larger proportion of the total aquifer volume, but solution conduits that occupy a much smaller proportion of the overall volume of aquifer are important because they constitute the primary drains for the groundwater flow system. Kozar and others (2007) also state that an active epikarstic layer within the karst ranges in depth from a minimum of 0 to a maximum of 60 ft below land surface and is highly permeable due to fluctuations at the water table over time. These intervals are typically cased off during drilling because of the large amount of residual mud and clay that is present within the epikarst.
From borehole geophysics studies completed for the Leetown study (Kozar and others, 2007), the dominant orientation of fractures aligns with bedrock strike with fracture dips ranging from 15° to 70° to the northwest and southeast. These trends are consistent with surficial mapping of strike parallel fractures in the Shenandoah Valley of West Virginia and with the data collected for this study and previously discussed, but numerous high-angle cross-strike joints and faults observed in outcrops are not well represented by ATV or OTV log analysis for either the Leetown study or for this investigation. The discordance is likely a result of sample bias because vertical boreholes are not effective for imaging high-angle fractures.
Greenbrier Valley Karst Aquifer
The second principal karst aquifer system in West Virginia is the Mississippian age karst and siliciclastic aquifers comprised of formations within the Greenbrier Group, Bluefield Formation, and Hinton Formation that crop out extensively in Greenbrier, Monroe, and Pocahontas Counties with lesser exposures in other counties within the State including Preston, Randolph, Tucker and Summers Counties. This report does not distinguish between the carbonate and siliciclastic units comprising the aquifer because even the Greenbrier Group itself contains non-carbonate siliciclastic units. These aquifers are also heavily relied on as a source of groundwater for public and residential supplies. An intensive county-wide hydrogeologic study in Monroe County focused on groundwater budgets, groundwater flow, borehole geophysics, and potentiometric-surface (water-table) mapping (Kozar and others, 2023). For the Monroe County study, wells were logged in the Mississippian age Greenbrier Group, Bluefield Formation, Hinton Formation, and Ordovician age karst rocks. Karst feature mapping and mapping of the Greenbrier Group at the formation level was an important part of the study. Additional wells were logged in Greenbrier County specifically for this study and the combined dataset was available for analysis.
Based on the logs for 15 wells in the Greenbrier valley aquifer logged as part of this and the recently completed Monroe County hydrogeologic assessment, 30 water-bearing fractures were identified (table 8). The wells logged were not all in carbonate rocks but also included wells logged in siliciclastic non-carbonate strata. As such, the logs are not specifically representative of the karst carbonate geologic formations within the Greenbrier Group but also contain a mixture of carbonate and non-carbonate siliciclastic rocks and included wells completed in the Bluefield and Hinton Formations. Transmissivity was calculated for 27 of the 30 fractures (table 8), and, as would be expected for a mixture of siliciclastic non-carbonate and karst carbonate strata, there was a high degree of variability in the computed transmissivities, ranging from a minimum of 0.02 ft2/d to a maximum of 18,500 ft2/d, and having a mean transmissivity of 1,831 ft2/d and median transmissivity of 159 ft2/d. These computed transmissivities are not as large as the ones presented for the Shenandoah Valley karst aquifer (table 7) and are probably not indicative of the potential range of expected transmissivities, which would be expected to be similar or even larger for the Greenbrier aquifer than for the Shenandoah Valley aquifer. Because the Greenbrier aquifer is significantly more conduit dominated than the Shenandoah Valley karst aquifer, maximum, median, and average transmissivities would be expected to be larger for the Greenbrier aquifer.
However, the dataset for the Greenbrier valley aquifer is skewed simply because of the smaller number of water-bearing fractures actually logged in karst carbonate strata (9 wells) compared to non-carbonate strata (18 wells; table 8). For the 5 fractures assessed only in limestone units, mean transmissivity was 8,950 ft2/d and median transmissivity was 9,520 ft2/d, significantly higher than the mean and median transmissivity for all Greenbrier valley aquifer wells of 1,831 and 159 ft2/d, as would be expected. This sparsity of data is a function of the limited amount of work conducted by the USGS in the Greenbrier valley aquifer compared to the much larger number of studies completed for the Shenandoah Valley karst aquifer. Other karstic limestone areas comprising the Greenbrier valley aquifer, including in Pocahontas and especially in Greenbrier County, have not been studied sufficiently to fully characterize the transmissivity of karstic areas of the Greenbrier valley aquifer. Additional well logging and hydrogeologic investigations would be needed to better understand transmissivity distribution in these areas.
Table 8.
Table of water-bearing fractures, depth, azimuth, dip, lithology, and transmissivity identified as part of the statewide analysis of fracture data from 15 wells in the Greenbrier valley karst aquifer in southeastern West Virginia.[Physiographic province data from Fenneman and Johnson (1946). Fracture depth, azimuth, and dip data are reported to one significant figure. ft2/d, foot squared per day; —, no transmissivity estimate for these fractures; NA, not applicable]
Tadpole plots of water-bearing and low-transmissive fractures mapped within the Greenbrier valley aquifer (fig. 34) show similar patterns to that for the Appalachian Plateaus Province (fig. 12) in which the Greenbrier valley is situated. Fracture depth decreases with depth similar to the Appalachian Plateaus Province and a higher proportion of fractures have shallow dip angles, as would be expected for bedding-plane dominated aquifers such as those in the Greenbrier valley aquifer. The water-bearing fractures (blue square tadpoles in fig. 34) are largely a shallow phenomenon and decrease in frequency rapidly below a depth of about 215 ft, similar to what was documented for the Appalachian Plateaus Province (fig. 23). Deep water-bearing fractures may be tapping the geologic contact between the Hillsdale Limestone and underlying Maccrady Shale Formations, which is a common practice for agricultural wells in the area.
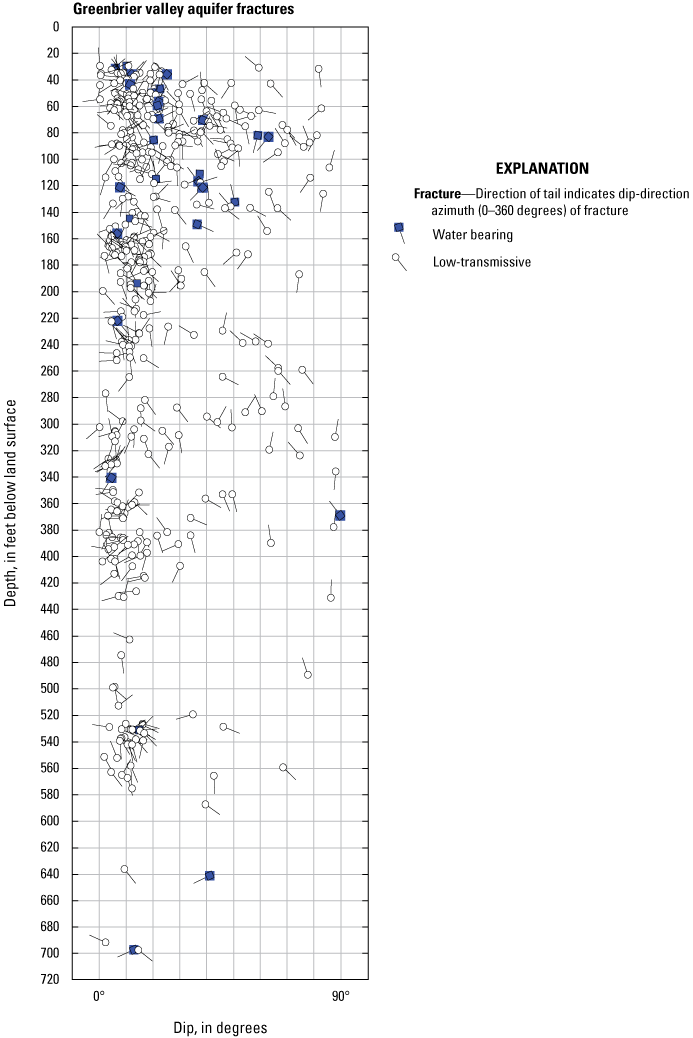
Tadpole plots showing distribution of water-bearing and low-transmissive fractures with dip angle shown on x-axis of plot and dip direction indicated by tadpole tail direction (0–360°) for wells logged in the Greenbrier valley aquifer in West Virginia.
Dip angles for fractures in the Greenbrier valley aquifer are mostly very gentle. A rose diagram (fig. 35) illustrates the percentage of dip for each 5° interval between 0° and 90°. Most dip angles are between 0° and 20°. Such slight dip angles represent largely bedding planes, but higher angle fractures represent joints, faults, or other fractures. The azimuth or direction of dip of fractures in the Greenbrier valley aquifer varies substantially, but the northwest and southeast azimuth angles are dominant as would be expected for bedding dipping perpendicular to the general northeast-to-southwest strike of bedrock in the Greenbrier valley aquifer (fig. 36). However, numerous fractures with dip azimuths are orthogonal to bedrock strike and those azimuths are representative of the higher angle fractures shown in figure 35.
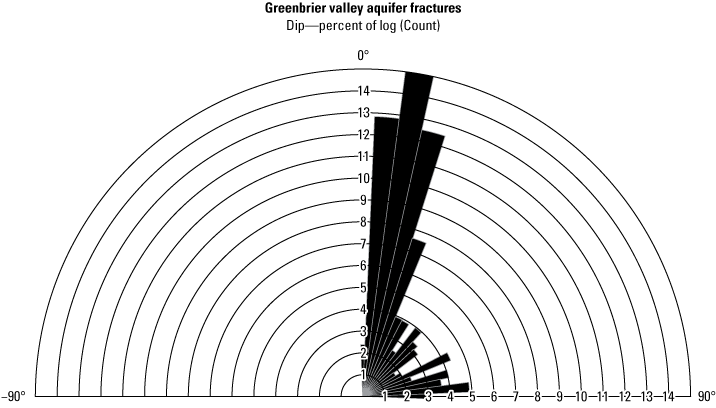
Rose diagram showing dip count and dip angles for all fractures mapped within the Greenbrier valley aquifer in West Virginia.
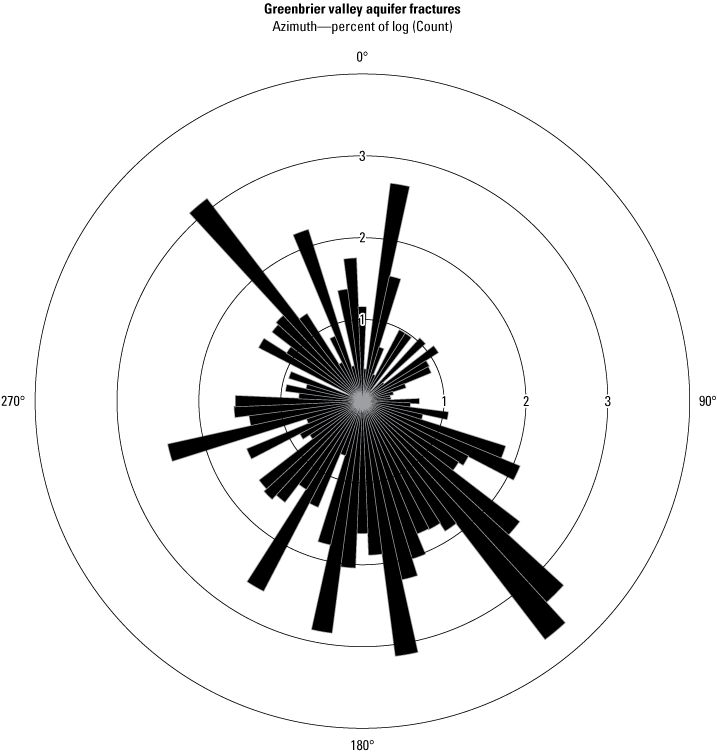
Rose diagram showing azimuth of fractures for all fractures mapped within the Greenbrier valley aquifer in West Virginia.
Previous studies in Monroe and Greenbrier Counties discuss the distribution of fractures in detail, and the hydrogeologic report summarizing the groundwater hydrology and geology of Monroe County (Kozar and others, 2023) provides a thorough literature review of pertinent groundwater investigations in Monroe and Greenbrier Counties. One of the studies summarized in the Monroe County hydrogeology report (Hirko, 2012) stated that folds in the southern Appalachian Mountains trend approximately N. 60° E., whereas folds in the central Appalachians trend approximately N. 10°–30° E. The transition between the central and southern Appalachian Mountains is located where the Roanoke Recess, bounded by the Covington lineament to the north, converges with the Saint Clair thrust fault and Glen Lyn syncline. Dean and others (1988) state that this same feature in Monroe County marks the proximal extent of the Appalachian Mountain structural front. Hirko (2012) also states that linear features in central Monroe County correlate with sinkhole collapses, trending N. 10°–20° E., N. 30°–40° E., and N. 50°–80° E. and that these linear features parallel major fractures in limestone bedrock of the area as documented by Lessing (1979; 1981). Ogden (1976) states that bedding with a low plunge angle generally dips 15° or less but increases slightly along fold limbs, fold axes, and thrust fault margins. Ogden (1976) also states that plunged directions of major folds are to the southeast, and folds parallel to the Saint Clair thrust fault trend N. 55° E. Ogden (1976) also states that many of the caves in Monroe County form along the strike of bedrock, and the most form in the Denmar Formation and Union Limestone, which are the most calcite dominant carbonate units in the Greenbrier Group. These formations are often adjacent to shale confining units. Ogden (1976) also notes that although caves tend to form along strike, that trend is not statistically significant. Joints are also a controlling factor, especially those oriented N. 58° W. and N. 27° W. Stratigraphic dip averages about 15° but may be near vertical or overturned in areas. The fracture data collected from borehole geophysical surveys of wells logged within the Greenbrier valley aquifer for this study are in general agreement with the trends documented by previous studies in the region.
Conclusion
Fractured-rock aquifers cover 23,601 square miles (mi2) within the State of West Virginia and comprise the vast majority (97.4 percent) of surficial area within the State, with the remaining 2.6 percent (621 mi2) being comprised of alluvial sand-and-gravel and glacial outwash aquifers bordering the State’s major rivers. While alluvial aquifers, especially those bordering the Ohio and Kanawha Rivers, have been studied extensively, fractured-rock aquifers within West Virginia have only been characterized locally for studies completed in a few areas, such as in Jefferson, McDowell, and Monroe Counties. Fractured-rock aquifers are important water supplies for public supply, agriculture, industry, and residential use in West Virginia. This study was conducted to provide a statewide assessment of the occurrence and distribution of fractures and the various topographic, physiographic, and lithologic controls on the occurrence and distribution of fractures within the State. Understanding the processes controlling fracture occurrence and distribution could help better assess potential depths of active fracturing of the bedrock, the depth at which fractures diminish or become so tight as to preclude storage or yield of water and the potential fate and transport of contaminants within fractured-rock aquifers in the event of an unanticipated contamination event. These assessments could help inform decisions aimed at managing and protecting fractured-rock aquifer resources within West Virginia.
A total of 126 wells had sufficient borehole geophysical logs available to allow characterization of the lithology of fractures for each well, and of those 126 wells, 115 had sufficient logs to aid in the analysis of fracture distribution and the assessment of geologic, lithologic, topographic, and physiographic processes controlling fracture distribution and occurrence within the fractured-rock aquifers in West Virginia. Of those 115 wells, 109 wells had sufficient data available to characterize water-bearing fractures in 3,403 fractures. Of those 109 wells, 252 water-bearing fractures were identified. Sufficient EM-flow logs were available to characterize discrete-zone fracture transmissivity for 189 water-bearing fractures.
A key finding from this study is that even though a well may contain many fractures, only a small percentage of the fractures are considered water-bearing. From the 115 wells logged in this study with identified fractures, a total of 3,403 fractures were identified, and only 252 (7.4 percent) of these fractures were water-bearing. In the Appalachian Plateaus Province, 2,253 fractures were identified in wells, and 181 (8.0 percent) of these fractures were water-bearing. In the Valley and Ridge Province, 1,150 fractures were identified, and only 71 (6.2 percent) of these fractures were water-bearing. For wells within the Appalachian Plateaus Province, 81 percent of water-bearing fractures are found at a depth of 215 feet (ft) or less. In the Valley and Ridge Province, 72 percent of water-bearing fractures occurred at depths of 215 ft or less. In both provinces, the number of water-bearing fractures at depths greater than 215 ft diminishes significantly.
Topography is a primary factor governing the yield of wells in hilltop, hillside, and valley settings in the Appalachian Plateaus Province of West Virginia. In the Appalachian Plateaus Physiographic Province of West Virginia, stress relief and isostatic rebound processes result in highest median well yields (30 gallons per minute [gal/min]) in valley settings, lowest median well yields (2.9 gal/min) in hilltop settings, and intermediate median well yields (12 gal/min) in hillside settings. Data collected for this study have provided considerable additional support to this earlier work. A plot of discrete-zone transmissivity derived from analysis of discrete-zone borehole fracture and flow-meter data, using the U.S. Geological Survey flow-log analysis of single holes (FLASH) software, shows this same classic pattern of highest median well transmissivity (355 feet squared per day [ft2/d]) in valley settings, intermediate median transmissivity (45 ft2/d) in hillside settings, and lowest median transmissivity (6.7 ft2/d) in hilltop settings for wells logged in the Appalachian Plateaus and Valley and Ridge Provinces. However, in the Valley and Ridge Province, wells on hillsides had the highest median transmissivity (528 ft2/d), lowest median transmissivity in hilltop settings (5.7 ft2/d), and intermediate median transmissivity in valley settings (16.9 ft2/d). The dataset of wells logged in the Valley and Ridge Province was skewed by the large number of wells drilled in Mineral County specifically to target deep thin limestone units within the Tonoloway or Helderberg Limestones, otherwise the distributions are similar.
Of water-bearing fractures for valley wells in the Appalachian Plateaus Province, 51 of 75 (68 percent) have transmissivity that equals or exceeds 100 ft2/d, but most hilltop wells (15 of 20 or 75 percent) and hillside wells (15 of 22 or 68 percent) have transmissivity less than 100 ft2/d. For Valley and Ridge wells, 11 of 30 valley wells (37 percent) had water-bearing fractures with transmissivities in excess of 100 ft2/d, 14 of 19 hillside wells (74 percent) had fractures with transmissivity in excess of 100 ft2/d, and only 1 of 15 hilltop wells had water-bearing fractures (7 percent) with a transmissivity in excess of 100 ft2/d.
A large concentration of fractures in the Appalachian Plateaus Province has dip angles of less than 30°, consistent with the flat to slightly dipping bedrock within the province. The dip azimuth (0° to 360°) of mapped fractures ranges widely. No clear distinction lies between the number of water-bearing fractures with respect to the dip angle of the fractures, with water-bearing fractures occurring throughout the 0° to 90° range of possible dip angles. The distribution of mapped water-bearing fractures shows a decreasing trend in water-bearing fractures with depth. Fewer water-bearing fractures are below a depth of about 215 ft than at shallower depths.
The Valley and Ridge Province has a greater distribution of higher-angle fractures than fractures identified in the Appalachian Plateaus Province. This is expected because the Valley and Ridge Province experienced significant folding and faulting compared to the Appalachian Plateaus Province. This folding and faulting has resulted in long-linear ridges and valleys within the Valley and Ridge Province compared to the slightly dipping strata characteristic of the Appalachian Plateaus Province. The dip direction of strata in the Valley and Ridge Province trends northwest-to-southeast, perpendicular to the general northeast-to-southwest strike of bedrock. In contrast to the Appalachian Plateaus Province, the highest median transmissivity is for hillside wells, which is likely caused by deeper fractures within solutional enlarged conduits in thin Silurian and Ordovician age limestones targeted for drilling of public supply wells.
A total of 109 wells had sufficient ambient and pumping flow data to allow analysis of 252 water-bearing fractures using the USGS FLASH software. Computed transmissivity for the 252 identified water-bearing fractures ranged widely from 0.02 to 109,600 ft2/d. The mean and median transmissivity also varied considerably having a mean of 2,508 and a median of 63 ft2/d. Median transmissivity of water-bearing fractures was highest for wells logged in the Appalachian Plateaus Province (102 ft2/d) and lowest in the Valley and Ridge Province (30 ft2/d). Conversely, mean transmissivity of water-bearing fractures was highest for wells logged in the Valley and Ridge Province (4,307 ft2/d) and lowest for wells in the Appalachian Plateaus Province (1,565 ft2/d). Geology can explain this difference in transmissivity. Wells in the Valley and Ridge Province have a higher percentage of wells drilled in karst carbonate aquifers, which can often show extremely high transmissivity (maximum of 109,600 ft2/d) compared to wells within the Appalachian Plateaus Province (maximum of 31,800 ft2/d), resulting in higher mean as opposed to median transmissivity.
Sonic porosity was evaluated in 74 boreholes in fractured-rock aquifers across West Virginia. Median and average values of porosity were assessed for formations greater than 5 ft in thickness and grouped into seven different rock types (table 5). Sandstone rock type represents aquifers primarily composed of sandstone and sand-sized particles with less than 10 percent shale volume. The median and average total shale-corrected sonic porosity of sandstone aquifers was estimated to be 14 percent. The argillaceous or calcareous sandstone aquifers are composed of sandstone with fine-grained or calcareous proportions greater than 10 percent. Shale-corrected sonic porosity calculated for fine-grained lithologies had lower median values, ranging from 5 percent in argillaceous sandstones to 0 percent porosity calculated for siltstones and shales. This shows that sandstone aquifers in West Virginia likely have higher effective porosity than fine-grained or mineralized rocks such as those with substantial argillaceous or calcareous proportions. Median and average shale-corrected porosity values of less than 2 percent for shale and siltstone indicate that fine-grained lithologies were minimally effective or not effective at yielding water beyond water produced as secondary porosity in bedding planes and fractures.
The results of this study contribute to the understanding of the occurrence and distribution of fractures in bedrock aquifers within West Virginia. Study results quantified trends that have been suspected for many years but were never well documented or verified by borehole geophysical or other data:
-
(1) the density of water-bearing and low-transmissive fractures decreases significantly with depth,
-
(2) a statistically significant difference in the density of fractures was observed at a depth of 215 ft for wells in the Appalachian Plateaus and Valley and Ridge aquifers, having a much higher density of water-bearing and low-transmissive fractures above a depth of 215 ft than below,
-
(3) shale corrected values of porosity for carbonate aquifers (including limestone and dolomite) in West Virginia had median and average values less than 5 percent and can generally be considered mineralized with low effective porosity,
-
(4) the median and average total porosity of sandstone aquifers were estimated to be 14 percent,
-
(5) shale and siltstone have relatively high total porosity when compared to other lithologies, but these lithologies often have bound water with minimal effective porosity less than 2 percent,
-
(6) transmissivity is highest in valley settings in the Appalachian Plateaus and hillside settings in the Valley and Ridge Province and lowest in hilltop settings for both provinces, and
-
(7) water-bearing fractures comprise only a small fraction (less than 8 percent) of all fractures in bedrock aquifers in West Virginia.
Abandoned underground coal mines have long been thought to form large pools of water in the vast interconnected mine entries that comprise abandoned room and pillar coal mines and are commonly referred to as mine pools or mine pool aquifers. Such vast interconnected mine entries can form extensive pools of water, but data collected for this study indicate that some mines may not contain vast pools of water in intact abandoned mine entries at all, but rather groundwater accumulates in a vast interconnected rubble zone formed as overburden strata and pillars left to hold up mine roofs collapse over time. Abandoned underground coal mine aquifers is a more descriptive term than mine pools or mine-pool aquifers because abandoned underground coal mine aquifers include both intact mine pool aquifers and aquifers formed by the rubble of collapsed mine pillars and overburden strata.
References Cited
Advanced Logic Technology, 2023, WellCAD version 5.7 digital software manual: Luxembourg, Advanced Logic Technology, accessed March 7, 2024, at https://www.alt.lu/download/.
Bradbury, K.R., and Rothschild, E.R., 1985, A computerized technique for estimating the hydraulic conductivity of aquifers from specific capacity data: Groundwater, v. 23, no. 2, p. 240–246, accessed December 5, 2024, available at https://ngwa.onlinelibrary.wiley.com/doi/abs/10.1111/j.1745-6584.1985.tb02798.x.
Cardwell, D.H., Erwin, R.B., and Woodward, H.P., 1968, Geologic Map of West Virginia: West Virginia Geological and Economic Survey, 2 sheets, scale 1:2,500,000. [Also available at https://wvgis.wvu.edu/data/dataset.php?ID=43.]
Carlston, C.W., and Graeff, G.D., Jr., 1956, Ground-water resources of the Ohio River Valley in West Virginia, pt. III of Geology and economic resources of the Ohio River Valley in West Virginia: West Virginia Geological and Economic Survey, v. 22, p. 1–131. [Also available at https://ngmdb.usgs.gov/Prodesc/proddesc_46444.htm.]
Cross, A.T., and Schemel, M.P., 1956, Geology of the Ohio River valley in West Virginia, pt. I of Geology and economic resources of the Ohio River valley in West Virginia: West Virginia Geological and Economic Survey, v. 22, p. 1–149. [Also available at https://ngmdb.usgs.gov/Prodesc/proddesc_46442.htm.]
Century Geophysical, LLC, 2023, Multi-parameter probes: Century Geophysical, LLC, accessed December 15, 2023, at https://www.century-geo.com/multi-parameter-probes.
Day-Lewis, F.D., Johnson, C.D., Paillet, F.L., and Halford, K.J., 2011, A computer program for flow-log analysis of single holes (FLASH): Groundwater, v. 49, no. 6, p. 926–931, accessed December 15, 2023, at https://doi.org/10.1111/j.1745-6584.2011.00798.x or https://ngwa.onlinelibrary.wiley.com/doi/10.1111/j.1745-6584.2011.00798.x.
Dean, S.L., Kulander, B.R., and Skinner, J.M., 1988, Structural chronology of the Alleghenian orogeny in southwestern West Virginia: Geological Society of America Bulletin, v. 100, no. 2, p. 299–310, accessed March 7, 2024, at https://doi.org/10.1130/0016-7606(1988)100<0299:SCOTAO>2.3.CO;2.
Freeze, R.A., and Cherry, J.A., 1979, Groundwater: Englewood Cliffs, N.J., Prentice-Hall, Inc., 604 p. [Also available at https://archive.org/details/groundwater-freeze-and-cherry-1979.]
Hobba, W.A., Jr.; Fisher, D.W.; Pearson, F.J., Jr.; and Chemerys, J.C., 1979, Hydrology and geochemistry of thermal springs of the Appalachians: U.S. Geological Survey Professional Paper 1044–E, 36 p., accessed December 12, 2024, at https://pubs.usgs.gov/publication/pp1044E.
JMP Statistical Discovery LLC, 2022, Predictive and specialized modeling—Version 17: Cary, NC, JMP Statistical Discovery LLC, 586 p., accessed September 26, 2023, at https://www.jmp.com/content/dam/jmp/documents/en/support/jmp17/predictive-and-specialized-modeling.pdf.
Keys, W.S., 1990, Borehole geophysics applied to ground-water investigations: U.S. Geological Survey Techniques of Water-Resources Investigations, book 2, chap. E2, 150 p. [Also available at https://pubs.usgs.gov/twri/twri2-e2/html/pdf.html.]
Kozar, M., McAdoo, M., Schipke, K., Wright, C., and Kearns, M., 2025, Data from 126 logged groundwater wells analyzed to assess geologic, topographic, and physiographic controls on the occurrence and distribution of fractures and transmissivity of water-bearing fractures in West Virginia: U.S. Geological Survey data release, https://doi.org/10.5066/P186CU2N.
Kozar, M.D., Doctor, D.H., Jones, W.K., Chien, N., Cox, C.E., Orndorff, R.C., Weary, D.J., Weaver, M.R., McAdoo, M.A., and Parker, M., 2023, Hydrogeology, karst, and groundwater availability of Monroe County, West Virginia: U.S. Geological Survey Scientific Investigations Report 2023–5121, 82 p., accessed March 8, 2024, at https://doi.org/10.3133/sir20235121.
Kozar, M.D., McAdoo, M.A., and Haase, K.B., 2020, Groundwater quality and geochemistry of West Virginia’s southern coal fields: U.S. Geological Survey Scientific Investigations Report 2019−5059, 78 p., accessed March 8, 2024, at https://doi.org/10.3133/sir20195059.
Kozar, M.D., and McCoy, K.J., 2004, Geohydrology and simulation of ground-water flow in Ohio River alluvial aquifers near Point Pleasant, Lubeck, Parkersburg, Vienna, Moundsville, and Glendale, West Virginia: U.S. Geological Survey Scientific Investigations Report 2004–5088, 39 p., accessed March 18, 2024, at https://doi.org/10.3133/sir20045088.
Kozar, M.D., McCoy, K.J., Britton, J.Q., and Blake, B.M.B., Jr., 2012, Hydrogeology, groundwater flow, and groundwater quality of an abandoned underground coal-mine aquifer, Elkhorn Area, West Virginia: West Virginia Geological and Economic Survey Bulletin B-46, 103 p., accessed February 11, 2019, at http://downloads.wvgs.wvnet.edu/pubcat/docs/Bulletin_46_Hydrogeology,%20Groundwater%20Abandoned%20Coal%20Mine%20Aquifer,%20Elkhorn,%20WV_(2012).pdf.
Kozar, M.D., McCoy, K.J., Weary, D.J., Field, M.S., Pierce, H.A., Schill, W.B., and Young, J.A., 2007, Hydrogeology and water quality of the Leetown Area, West Virginia: U.S. Geological Survey Open-file Report 2007–1358, 100 p., accessed March 18, 2024, at https://pubs.usgs.gov/of/2007/135.
Kozar, M.D., and Paybins, K.S., 2016, Assessment of hydrogeologic terrains, well-construction characteristics, groundwater hydraulics, and water-quality and microbial data for determination of surface-water-influenced groundwater supplies in West Virginia: U.S. Geological Survey Scientific Investigations Report 2016–5048, 55 p., accessed March 18, 2024, at https://doi.org/10.3133/sir20165048.
Lessing, P.; Hobba, W.A., Jr.; Dean, S.L.; and Kulander, B.R., 1991, Relations between warm springs and geology delineated by side-looking airborne-radar imagery in eastern West Virginia: U.S. Geological Survey Water-Resources Investigations Report 88–4096, 44 p., accessed December 11, 2024, at http://pubs.usgs.gov/wri/1988/4096/report.pdf.
Lisle, R.J., and Leyshon, P.R., 2004, Stereographic projection techniques for geologists and engineers (2d ed.): Cambridge University Press, New York, 112 p., accessed November 20, 2024, at https://doi.org/10.1017/CBO9781139171366.
Makar, K.H., and Kamel, M.H., 2011, An approach for minimizing errors in computing effective porosity in reservoir of shaly nature in view of Wyllie–Raymer–Raiga relationship: Journal of Petroleum Science and Engineering, v. 77, nos. 3–4, p. 386–392, accessed March 5, 2024, at https://doi.org/10.1016/j.petrol.2011.04.013.
McAdoo, M.A., 2024, PHREEQC files for geochemical simulations in the Ohio River Alluvial Aquifer of West Virginia: U.S. Geological Survey data release, accessed March 21, 2024, at https://doi.org/10.5066/P13TPVMI.
McAdoo, M.A., and Connock, G.T., 2024, Water-quality indicators of surface-water-influenced groundwater supplies in the Ohio River alluvial aquifer of West Virginia: U.S. Geological Survey Scientific Investigations Report 2023–5139, 42 p., accessed March 21, 2024, https://doi.org/10.3133/sir20235139.
McCoy, K.J., Podwysocki, M.H., Crider, E.A., and Weary, D.J., 2005a, Fracture trace map and single-well aquifer test results in a carbonate aquifer in Jefferson County, West Virginia: U.S. Geological Survey Open-File Report 2005–1407, 1 pl., accessed March 19, 2024, at https://pubs.usgs.gov/of/2005/1407/.
McCoy, K.J., Podwysocki, M.H., Crider, E.A., and Weary, D.J., 2005b, Fracture trace map and single-well aquifer test results in a carbonate aquifer in Berkeley County, West Virginia: U.S. Geological Survey Open-File Report 2005–1040, 1 pl., accessed March 19, 2024, at https://pubs.usgs.gov/of/2005/1040/.
Ogden, A.E., 1976, The hydrogeology of the central Monroe County karst, West Virginia: Morgantown, West Virginia, West Virginia University, Ph.D. dissertation, 235 p., 6 app., 6 pls. [Also available at https://researchrepository.wvu.edu/etd/9527].
Paillet, F.L., 1998, Flow modeling and permeability estimation using borehole flow logs in heterogenous fractured formations: Water Resources Research, v. 34, no. 5, p. 997–1010, accessed March 17, 2025, at https://agupubs.onlinelibrary.wiley.com/doi/epdf/10.1029/98WR00268.
Paillet, F.L., 2000, A field technique for estimating aquifer parameters using flow log data: Groundwater, v. 38, no. 4, p. 510–521. [Also available at https://ngwa.onlinelibrary.wiley.com/doi/epdf/10.1111/j.1745-6584.2000.tb00243.x.]
Paillet, F.L., Hess, A.E., Cheng, C.H., and Hardin, E., 1987, Characterization of fracture permeability with high-resolution vertical flow measurements during borehole pumping: Groundwater, v. 25, no. 1, p. 28–40. [Also available at https://ngwa.onlinelibrary.wiley.com/doi/epdf/10.1111/j.1745-6584.1987.tb02113.x.]
Rega, K.P., 2011. Role of lineaments in the hydrogeology of Knobly Mountain, Mineral and Grant counties, West Virginia: West Virginia University, master’s thesis, 64 p., accessed March 5, 2024, at https://doi.org/10.33915/etd.3299.
Raymer, L.L., Hunt, E.R., and Gardner, J.S., 1980, An improved sonic transit time-to-porosity transform: SPWLA 21st Annual Logging Symposium, Lafayette, Louisiana, July 1980, 13 p., accessed March 5, 2024, at https://onepetro.org/SPWLAALS/proceedings-abstract/SPWLA-1980/All-SPWLA-1980/SPWLA-1980-P/19448.
Shultz, R.A., 1988, Ground-water hydrology of Marshall County, West Virginia, with emphasis on the effects of longwall coal mining: U.S. Geological Survey Water-Resources Investigations Report 88–4006, 139 p., accessed March 18, 2024, at https://doi.org/10.3133/wri884006.
Theis, C.V., Brown, R.H., and Meyer, R.R., 1963, Estimating the transmissibility of aquifers from the specific capacity of wells in U.S. Geological Survey Water-Supply Paper 1536-I compiled by Bentall, R., p. 331–340. [Also available at https://pubs.usgs.gov/wsp/1536i/report.pdf.]
Theis, C.V., 1935, The relation between the lowering of the piezometric surface and the rate and duration of discharge of a well using ground water storage: American Geophysical Union Trans., v. 16, no. 2, p. 519–524. [Also available at https://doi.org/10.1029/TR016i002p00519. Duplicated in 1952 as U.S. Geological Survey Ground Water Notes, no. 5, 10 p., which is available at https://water.usgs.gov/ogw/pubs/Theis-1935.pdf.]
U.S. Geological Survey, 2023, Highest and lowest elevations: U.S. Geological Survey, accessed December 20, 2023, at https://www.usgs.gov/educational-resources/highest-and-lowest-elevations.
U.S. Geological Survey, 2025a, National Map: U.S. Geological Survey, accessed May 15, 2025, at https://apps.nationalmap.gov/viewer/.
U.S. Geological Survey, 2025b, USGS GeoLog Locator: U.S. Geological Survey database, accessed October 17, 2025, at https://webapps.usgs.gov/GeoLogLocator/#!/.
U.S. Geological Survey, 2025c, USGS water data for the Nation: U.S. Geological Survey National Water Information System database, accessed November 5, 2025, at https://doi.org/10.5066/F7P55KJN.
U.S. Geological Survey, National Geospatial Program, 2025, Geographic Names Information System (GNIS) full model of WV (published 20250514) FileGDB: U.S. Geological Survey, accessed May 22, 2025, at https://www.sciencebase.gov/catalog/item/643702c9d34ee8d4addcc20d.
West Virginia Geological and Economic Survey, 2025, West Virginia Geological and Economic Survey Coal Bed Mapping Program digital data available for download, accessed January 8, 2025, at https://survey123.arcgis.com/share/f9bf01129bb04f349e6f207cf7039e53.
West Virginia Legislature, 2023, West Virginia code—Chapter 22–Environmental resources—Article 12–Groundwater protection act: West Virginia Code, accessed December 18, 2023, at https://code.wvlegislature.gov/22-12/.
Williams, J.H., and Conger, R.W., 1990, Preliminary delineation of contaminated water-bearing fractures intersected by open-hole bedrock wells: Groundwater Monitoring & Remediation, v. 10, p. 118–126, accessed March 17, 2025, at https://doi.org/10.1111/j.1745-6592.1990.tb00028.x.
Williams, J.H., and Johnson, C.D., 2004, Acoustic and optical borehole-wall imaging for fractured-rock aquifer studies: Journal of Applied Geophysics, v. 55, no. 1–2, p. 151–159, accessed March 27, 2024, https://doi.org/10.1016/j.jappgeo.2003.06.009.
Williams, J.H., and Lane, J.W., 1998, Advances in borehole geophysics for ground-water investigations: U.S. Geological Survey Fact Sheet 002–98, 4 p., accessed March 17, 2025, at https://doi.org/10.3133/fs00298.
Williams, J.H., Lapham, W.W., and Barringer, T.H., 1993, Application of electromagnetic logging to contamination investigations in glacial sand-and-gravel aquifers: Groundwater Monitoring & Remediation, v. 13, no. 3, p. 129–138, accessed March 25, 2024, at https://doi.org/10.1111/j.1745-6592.1993.tb00082.x.
Wyrick, G.G., and Borchers, J.W., 1981, Hydrologic effects of stress-relief fracturing in an Appalachian Valley: U.S. Geological Survey Water-Supply Paper 2177, 51 p., accessed March 18, 2024, at https://doi.org/10.3133/wsp2177.
Young, S.C., and Pearson, H.S., 1995, The electromagnetic borehole flowmeter—Description and application: Groundwater Monitoring & Remediation, v. 15, no. 4, p. 138–147, accessed March 25, 2024, at https://doi.org/10.1111/j.1745-6592.1995.tb00561.x.
Conversion Factors
U.S. customary units to International System of Units
Temperature in degrees Celsius (°C) may be converted to degrees Fahrenheit (°F) as follows:
°F=(1.8×°C)+32.
Temperature in degrees Fahrenheit (°F) may be converted to degrees Celsius (°C) as follows:
°C=(°F–32)/1.8.
Datums
Vertical coordinate information is referenced to the North American Vertical Datum of 1988 (NAVD 88).
Horizontal coordinate information is referenced to the North American Datum of 1983 (NAD 83).
Elevation, as used in this report, refers to distance above the vertical datum.
Supplemental Information
In this report, data from two wells located about a quarter of a mile inside the Blue Ridge Physiographic Province in West Virginia are included in the data of the neighboring Valley and Ridge Physiographic Province because the provinces share structural, geological, and fracturing characteristics.
For additional information contact:
Director, Virginia and West Virginia Water Science Center
U.S. Geological Survey
1730 East Parham Road
Richmond, Virginia 23228
or visit our website at
https://www.usgs.gov/centers/virginia-and-west-virginia-water-science-center
Publishing support provided by the Baltimore Publishing Service Center.
Disclaimers
Any use of trade, firm, or product names is for descriptive purposes only and does not imply endorsement by the U.S. Government.
Although this information product, for the most part, is in the public domain, it also may contain copyrighted materials as noted in the text. Permission to reproduce copyrighted items must be secured from the copyright owner.
Suggested Citation
Kozar, M.D., McAdoo, M.A., Austin, S.H., and Wright, C.A., 2025, Factors affecting the distribution of water-bearing fractures in the bedrock aquifers of West Virginia: U.S. Geological Survey Scientific Investigations Report 2025–5044, 66 p., https://doi.org/10.3133/sir20255044.
ISSN: 2328-0328 (online)
ISSN: 2328-031X (print)
Study Area
| Publication type | Report |
|---|---|
| Publication Subtype | USGS Numbered Series |
| Title | Factors affecting the distribution of water-bearing fractures in the bedrock aquifers of West Virginia |
| Series title | Scientific Investigations Report |
| Series number | 2025-5044 |
| ISBN | 978-1-4113-4608-6 |
| DOI | 10.3133/sir20255044 |
| Publication Date | July 21, 2025 |
| Year Published | 2025 |
| Language | English |
| Publisher | U.S. Geological Survey |
| Publisher location | Reston, VA |
| Contributing office(s) | Virginia and West Virginia Water Science Center |
| Description | x, 66 p. |
| Country | United States |
| State | West Virginia |
| Online Only (Y/N) | N |
| Additional Online Files (Y/N) | N |