

Completion Summary for Monitor Wells NRF-17 and NRF-18 at the Naval Reactors Facility, Idaho National Laboratory, Idaho
Links
- Document: Report (3.8 MB pdf) , HTML , XML
- Data Release: USGS data release - Single-well aquifer test data from wells NRF-17 and NRF-18, Idaho National Laboratory, Idaho
- NGMDB Index Page: National Geologic Map Database Index Page (html)
- Download citation as: RIS | Dublin Core
Abstract
The U.S. Geological Survey (USGS)—in cooperation with the U.S. Department of Energy (DOE) for the Naval Reactors Laboratory Field Office that supports operations for the Naval Reactors Facility (NRF) located at the Idaho National Laboratory (INL)—drilled and constructed well NRF-17 (formerly borehole USGS 151) and well NRF-18 (formerly borehole USGS 152) for stratigraphic framework analyses and water-quality monitoring at the Idaho National Laboratory (INL) near the NRF, in southeastern Idaho. Borehole USGS 151 was continuously cored from about 48 to 1,070 feet (ft) below land surface (BLS); rotary drilled from approximately 1,070 to 1,720 ft BLS; and re-drilled to complete construction as a monitor well NRF-17, completed to 461 ft BLS. Borehole USGS 152 was continuously cored from approximately 19 to 1,259 ft BLS; rotary drilled from approximately 1,259 to 1,630 ft BLS; and re-drilled to complete construction as a monitor well NRF-18, completed to 450 ft BLS.
Geophysical data were examined with photographed core material to record lithologic descriptions and to suggest zones where groundwater flow was anticipated. Basalt flows varied from highly fractured to dense, with high-to-low vesiculation. Well NRF-17 generally was constructed in mostly dense basalt (greater than 75 percent), and well NRF-18 was constructed in primarily fractured and (or) vesicular basalt. In well NRF-17, the well capacity is directly affected by the limited amount of fractured basalt, which serves as the primary pathway for groundwater. This effect was observed during the pumping test conducted after the well's final construction.
Single-well aquifer tests were done at wells NRF-17 and NRF-18 to provide estimates of transmissivity and hydraulic conductivity after final well construction and initial well development. Estimated values of transmissivity and hydraulic conductivity for well NRF-17 were 8.81 feet squared per day (ft2/d) and 1.04×10⁻² feet per day (ft/d), respectively. Estimated values of transmissivity and hydraulic conductivity for well NRF-18 were 4.77×103 ft2/d and 5.61 ft/d, respectively. The NRF-17 pump test resulted in 19.41 ft of measured drawdown at a sustained average pumping rate of 3.3 gallons per minute (gal/min). The NRF-18 pump test resulted in 0.55 ft of measured drawdown at a sustained average pumping rate of 31.0 gal/min.
Water-quality samples collected from the two wells were analyzed for cations, anions, metals, nutrients, volatile organic compounds, stable isotopes, and radionuclides. Water samples for select inorganic constituents showed concentrations consistent with signatures from tributary valley groundwater with influences from ephemeral surface-water recharge from the Big Lost River. Water-quality samples analyzed for stable isotopes of oxygen and hydrogen are consistent with signatures from tributary valley groundwater and surface-water recharge inputs to the aquifer. No measured water-quality results were greater than their respective maximum contaminant levels for public drinking-water supplies. Inorganic and nutrient water-quality results for well NRF-17 and well NRF-18 suggest the groundwater in this area is potentially affected by industrial wastewater disposal.
Introduction
The U.S. Geological Survey (USGS), in cooperation with the U.S. Department of Energy (DOE), has collected borehole information at the Idaho National Laboratory (INL) since 1949 to provide baseline data concerning the migration and disposition of radioactive and chemical wastes in the eastern Snake River Plain (ESRP) aquifer. As part of an ongoing effort by the USGS to refine numerical models to consider the movement of groundwater and contaminants in the ESRP aquifer, additional hydrogeologic and borehole information at and near the Naval Reactors Facility (NRF) is required. These data will be used to better understand the complex groundwater flow system for remediation studies at the NRF (fig. 1). Geologic data, along with hydraulic properties (transmissivity and hydraulic conductivity), help define groundwater movement and contaminant transport of waste plumes at the NRF.

Location of selected facilities at the Idaho National Laboratory, Idaho.
Well NRF-17 is located along the southeastern side of the NRF, whereas well NRF-18 is located along the northwestern side of the NRF (fig. 2). The general purpose for well construction is to support NRF facility monitoring. Wells NRF-17 and NRF-18 were originally identified as cored borehole USGS 151 and borehole USGS 152, respectively, and renamed after final well construction. Original boreholes USGS 151 and USGS 152 were core drilled during 2019 and 2020 and characterized to depths of 1,720 and 1,630 feet (ft) below land surface (BLS), respectively. On completion of characterization, both boreholes had the deepest cored sections abandoned (cemented) from total drilled depth upward to about 600 ft BLS, consistent with other NRF monitor wells (fig. 2). The initial cored boreholes (USGS 151 and 152) have associated data release files that describe the core-drilling effort, geophysical data collected, and photographs and descriptions for the core material collected (Trcka and Twining 2023a, 2023b). Core photographs, core descriptions, and geophysical data collected from the original boreholes were used as part of the hydrogeologic assessment for this report.
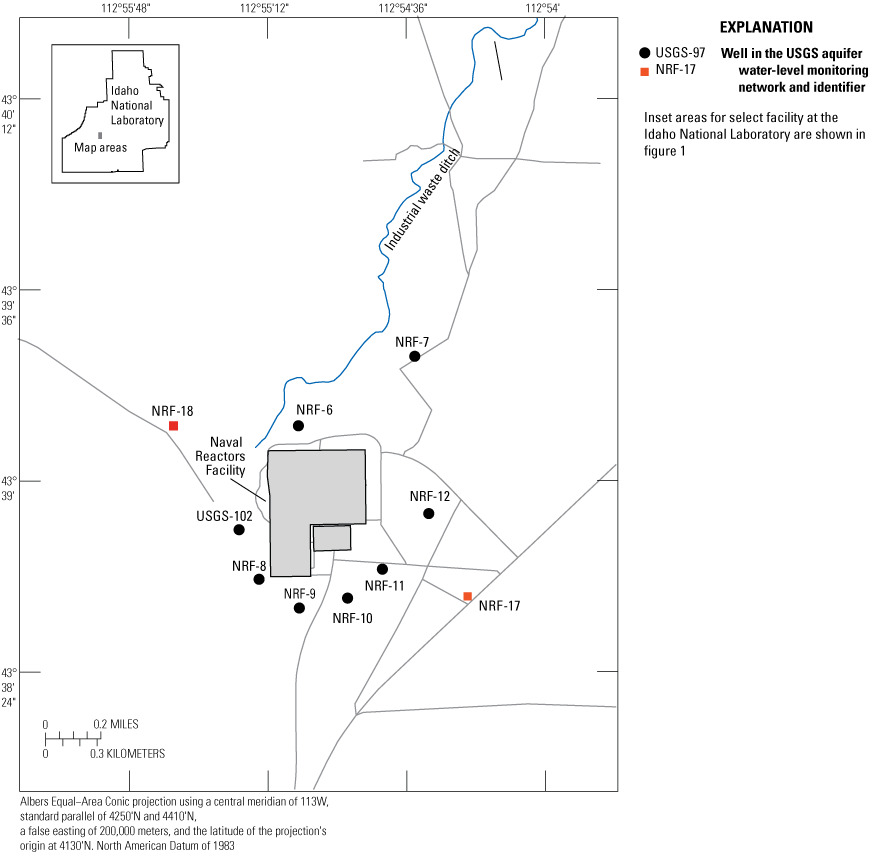
Wells NRF-17 and NRF-18 and select monitor wells, Naval Reactors Facility, Idaho National Laboratory, Idaho.
The final design for monitor well NRF-17 includes 12-inch-(in.) diameter steel casing to 20 ft BLS, 6.0-in. diameter steel well casing to 371 ft BLS, and a 5.9-in. open-hole from 371 to 461 ft BLS. Depth to water at this location is approximately 392 ft BLS, with an open water column of about 69 ft into the ESRP aquifer; the submersible pump intake is located near 420 ft BLS. The well is constructed in mostly dense rock, as defined by drill-core and geophysical data. Final monitor well construction was completed over the course of 17 days and the USGS mobilized equipment off the drill site on September 18, 2023.
The final design for monitor well NRF-18 includes 12-in.-diameter steel casing to 15 ft BLS, 8.0-in. steel well casing to 380 ft BLS, 6.0-in. stainless-steel blank casing and rubber K-packer adapter from 361 to 390 ft BLS, and a stainless-steel well screen from 390 to 450 ft BLS. The well screen sits atop of a 6-9 mesh silica sand and bentonite hole plug filled from 450 to 461 ft BLS, the drilled completion depth. Depth to water at this location is approximately 392 ft BLS and the well penetrates about 58 ft into the regional aquifer system. The well is constructed in a mixture of fractured and dense rock, as defined by drill core and geophysical data. Final monitor well construction was completed over the course of 5 days; the upper 8.0-in. casing had been installed during the previous drilling effort in 2020. The USGS mobilized equipment off the drill site on September 27, 2023.
Geophysical data and the borehole video were collected and examined to confirm well integrity for cased and open borehole sections and to identify areas of fractured and dense basalt. After drilling, each well was developed for an extended period to clear out residual drilling fluids and to test the well production rates. Reported aquifer test data, included as part of this report, was completed for each well during May 2024. An extensive suite of groundwater samples for water quality (including inorganic, organic, stable isotopes, and radionuclides) were collected during autumn sampling activities in November 2023, the results of which were used to characterize water chemistry for each well.
Purpose and Scope
The purpose of this study is to document data collection and provide insight into to the hydrogeology at the NRF. Geologic, geophysical, and aquifer test data were collected and analyzed to determine lithologic and hydraulic properties of the ESRP aquifer. Additionally, water samples were collected and analyzed for inorganic, organic, stable isotope, and radionuclide constituents for the newly drilled well and to provide water-quality data after well construction. The scope of this report presents results of the drilling, construction, geophysical logging, aquifer testing, and water sampling for wells NRF-17 and NRF-18.
Hydrogeologic Setting
The INL is located within the west-central part of the ESRP (fig. 1). The ESRP is a northeast-trending structural basin about 200 miles (mi) long and 50–70 mi wide. Formation of the ESRP was caused by the passage of the North American Plate over the Yellowstone hot spot (Pierce and Morgan, 1992). The ESRP is subject to continuing basaltic volcanism and subsidence because disruption to the crust resulted in increased heat flow (Blackwell and others, 1992) and emplacement of a dense, mid-crustal sill (Shervais and others, 2006). The subsiding ESRP basin was filled with interbedded terrestrial sediments and late Pliocene to Pleistocene basalt, 0.6–1.2 mi thick (Whitehead, 1992). The basaltic rocks and sedimentary deposits make up the ESRP aquifer.
The ESRP is composed mostly of olivine tholeiite basalt flows, which erupted as tube-fed, inflated, pahoehoe flows that constitute more than 85 percent of the subsurface volume of the ESRP at the INL (Anderson and Liszewski, 1997). The distribution of basalt flows is controlled by topography, rate of effusion, and duration of eruption. Near-vent flows are thinner than distal flows, and accumulations of thin flows have a larger volume of high conductivity zones than the same volume of thick flows (Anderson and others, 1999).
The part of the Snake Plain aquifer that underlies the ESRP is one of the most productive aquifers in the United States (U.S. Geological Survey, 1985, p. 193). Groundwater in the ESRP aquifer generally moves from northeast to southwest, eventually discharging to springs along the Snake River downstream from Twin Falls, Idaho—about 100 mi southwest of the INL (Whitehead, 1992). Water moves through basalt fracture zones at the tops, bases, and sides of basalt flows. Infiltration of surface water, groundwater pumping, geologic conditions, and seasonal fluxes of recharge and discharge locally affect the movement of groundwater (Garabedian, 1986). Recharge to the ESRP aquifer is primarily from infiltration of applied irrigation water, streamflow, precipitation, and groundwater inflow from adjoining mountain drainage basins (Ackerman and others, 2006; Rattray, 2018).
Previous investigations have determined groundwater flow characteristics and hydraulic properties of the ESRP aquifer within and near INL. The 2021 water-table elevation ranges from about 4,560 to 4,410 ft (Treinen and others, 2024, fig. 9); at wells NRF-17 and NRF-18, the elevation of the water table is about 4,462 ft. The depth to water below land surface in wells completed in the ESRP aquifer ranges from about 286 ft in the northern part of the INL to more than 990 ft in the southeastern part. The May 2024 depth to water is 392 ft BLS as measured in wells NRF-17 and NRF-18 is about 392 ft BLS at both locations. Water in the ESRP aquifer primarily moves through interflow and fracture zones in the basalt. A large proportion of groundwater moves through the upper 200–800 ft of basaltic rocks (Mann, 1986, p. 21). Twining and Maimer (2019) estimated transmissivity for the upper part of the aquifer to be 2.0–540,000 feet squared per day (ft2/d). Anderson and others (1999) reported a range of hydraulic conductivity at the INL of 0.01–32,000 feet per day (ft/d). The hydraulic conductivity of rocks underlying the aquifer varies from 0.002 to 0.03 ft/d (Mann, 1986, p. 21). Localized tracer tests at the INL have shown vertical and horizontal transport rates as high as 60 and 150 ft/d, respectively (Nimmo and others, 2002; Duke and others, 2007).
Previous Investigations
The USGS INL Project Office provides completion reports for special studies addressing drilling, borehole geophysical data, and monitor well testing at the INL. Several recent reports include work done for wells located around the NRF. A list of all the reports published by the USGS on project work completed at the INL can be found in Fisher (2022). Notable publications related to the purpose and scope of this study include Bartholomay and others (2002) and Twining and others (2016, 2010).
Bartholomay and others (2002) examined the chemical and radiochemical constituents in water samples collected from 13 wells near the NRF in 2000. Water samples were analyzed for naturally occurring constituents and anthropogenic contaminants. A total of 52 samples were collected from the 13 monitoring wells. The routine samples contained detectable concentrations of total cations and dissolved anions, and nitrite plus nitrate as nitrogen. Most of the samples also contained detectable concentrations of gross alpha- and gross beta-particle radioactivity and tritium.
Twining (2016) collected borehole deviation data for wells constructed within the ESRP aquifer. The well completion summary report examined deviation data collected through gyroscopic and magnetic methods and presented correction factors for water-level observations at well sites in and near INL. Borehole well deviation survey data were considered for 177 wells completed within the ESRP aquifer, but not all wells had deviation survey data available. Of the 57 wells with gyroscopic deviation surveys, correction factors for 16 wells ranged from 0.20 to 6.07 ft and inclination angles (SANG) ranged from 1.6 to 16.0 degrees. To remove the effects of well deviation, the USGS INL Project Office applies a correction factor to water-level data when a well deviation survey indicates a change in the reference elevation of greater than or equal to 0.2 ft at the water surface.
Twining and others (2010) provided drilling, construction, geophysical log data, and lithologic logs for borehole NRF-16 using a report format similar to that of the current report. Data collected during drilling, geophysical logging, aquifer testing, and sampling were summarized. Borehole NRF-16 was initially cored to a depth of 425 ft BLS and water samples and geophysical data were collected. Two consecutive single-well aquifer tests were conducted after final construction to estimate hydraulic properties, averaged transmissivity and hydraulic conductivity were 4.8×103 ft2/d and 9.9 ft/d, respectively. Water samples were analyzed for metals, nutrients, total organic carbon, volatile organic compounds, semi-volatile organic compounds, herbicides, pesticides, polychlorinated biphenyls, and radionuclides. All chloride, nitrate, and sulfate concentrations were less than background concentrations. Concentrations in water samples for most of the organic compounds and radionuclides were less than the reporting limits and reporting levels.
Drilling and Borehole Construction Methods
Final construction for wells NRF-17 and NRF-18 occurred from August 14 to September 27, 2023. The core-drilling effort was completed as part of a separate project and conducted by the USGS Research Drilling Program out of Nevada during 2019 and 2020. To support the current monitoring program at the NRF, boreholes USGS 151 and USGS 152 were renamed wells NRF-17 and NRF-18 after final construction (fig. 2). Core and rotary drilling activities, geophysical data, and detailed core descriptions for borehole USGS 151 and borehole USGS 152 are summarized in Trcka and Twining (2023a, 2023b).
Prior to well construction activities for wells NRF-17 and NRF-18, a jobsite walkdown, briefing, and safety discussion were held on September 9, 2023. The briefing outlined roles and responsibilities for construction activities and outlined the USGS construction perimeter and drilling objectives. Project daily equipment and safety inspections were performed and drilling progress was communicated through weekly emails to project personnel. Data on drilling activities at wells NRF-17 and NRF-18 are available as part of a separate data release (Zingre, 2024). Drilling water used for well construction activities was supplied from well USGS 102 (fig. 2) and transported using a water tanker.
Monitor Well NRF-17 Construction
USGS mobilized equipment to well NRF-17 on August 14, 2023. Steel well casing, 12.0-in.-and 8.0-in.-diameter, were previously installed during 2020 (Trcka and Twining, 2023a). On August 15, 2023, the USGS started drilling using an 8.0-in.-diameter drill bit attached to a 7.5-in.-diameter stabilizer. At about 76 ft BLS, the 8.0-in. bit stopped advancing as it became partially lodged inside the 8.0-in. steel casing, so the steel casing was removed along with the drill bit. The 12.0-in. steel casing, installed to a depth of 20 ft BLS, remained in place after the 8.0-in. casing was removed.
Starting on August 17, 2023, the USGS reassembled a similar 8.0-in.-diameter drill bit and 7.5-in.-diameter stabilizer and drilled to a depth of 372 ft BLS over the course of 3 days. On August 22, 2023, the USGS ran a video log to confirm that the well was open before installing 6.0-in.-diameter steel well casing. The well casing would not advance past 160 ft BLS and was removed to clear an obstruction. On September 5, 2023, the USGS drilled using a 10.0-in.-diameter hammer bit to 230 ft BLS before the hammer started having operational issues and was changed out for a tri-cone style drill bit. On September 7, 2023, the 10.0-in. tri-cone drill bit completed reaming to a depth of 376 ft BLS. Before the tri-cone bit was removed, the borehole was cleared for 30 minutes to remove any residual cuttings using a combination of drilling foam and supply water. On September 11, 2023, a video was run showing that the drilled section was clear from obstructions, so 6.0-in. well casing was set to 371 ft BLS. A 10.0-in. grout basket was installed on the bottom casing string to hold the bentonite hole plug and prevent it from falling past 371 ft BLS.
Starting on September 11, 2023, 8,000 pounds of bentonite hole plug were poured from land surface, hydrated over 2 days, and tagged near 50 ft BLS. About 2,800 pounds of neat cement were added on September 12, 2023, from 50 ft to land surface to complete the annular seal (fig. 3).
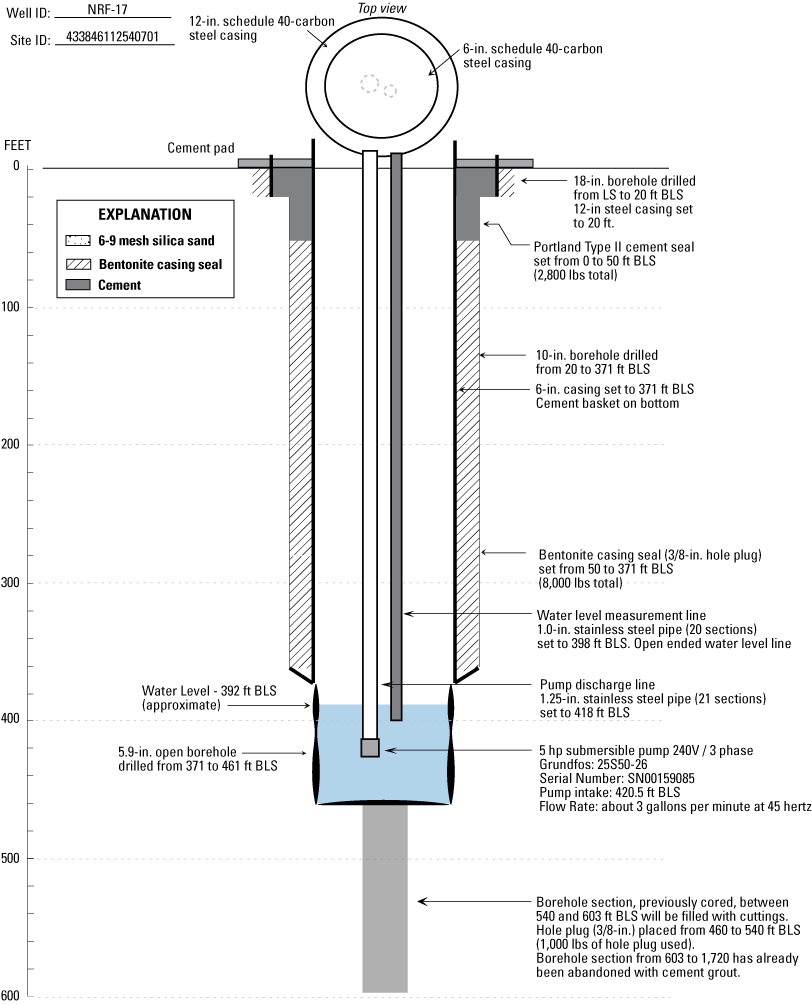
Final constructed well NRF-17, Naval Reactors Facility, Idaho National Laboratory, Idaho. BLS, below land surface; ft, feet; hp, horsepower; in., inch; lbs, pounds; LS, land surface.
Starting on September 12, 2023, the USGS drilled using a 5.9-in. tri-cone drill bit and 5.5-in. stabilizer and competed reaming from 371 to 461 ft BLS. The well was developed for about 90 minutes after drilling. Well development continued for a few hours the next day (September 13, 2023). On September 14, 2023, the drill stem was removed, and a video run showed that the hole was open to 461 ft BLS. The video showed that the previously cored section remained open down to a depth of about 540 ft BLS. After discussion with the NRF, the USGS placed approximately 1,000 pounds of bentonite hole plug to seal the corehole section from 461 to 540 ft BLS. The section of borehole was tagged using a weighted measurement line to confirm the total well depth as 461 ft BLS. The USGS mobilized equipment over to well NRF-18 on September 18, 2023.
On September 25, 2023, the USGS installed a submersible pump, pump wire, and measurement line (fig. 3). Well NRF-17 was configured with a submersible pump and motor attached to a 1.3-in.-diameter stainless-steel discharge and 1.0-in.-diameter stainless-steel open-ended measurement line. The submersible pump suction was placed at 420.5 ft BLS. The final construction of well NRF-17 includes (1) 12.0-in.-diameter carbon steel casing extending from land surface to 20 ft BLS; (2) 6.0-in.-diameter carbon steel casing extending 2 ft above land surface to 371 ft BLS; and (3) 5.9-in., inside-diameter open borehole from 371 to 461 ft BLS (fig. 3). Surface completion includes a 4-ft-diameter concrete pad complete with a brass survey marker, and a locking wellhead (table 1).
Table 1.
Location and completion information for wells NRF-17 and NRF-18, Naval Reactors Facility, Idaho National Laboratory, Idaho.[Local site name: Local well identifier used in this study. Location of well is shown in figure 2. Site identifier is a unique numerical identifier used to access well data (U.S. Geological Survey, 2024). Longitude, Latitude, and Measurement point elevation are taken at brass survey marker (brass cap) located adjacent to well head on cement pad. Approximated saturated aquifer thickness is the approximated elevation of the base of the aquifer as interpreted from geophysical surveys (Whitehead, 1992) subtracted from the measur ed depth to water (elevation of water table). Bottom of open borehole or screen refers to where the well screen ends, or open borehole (uncased) section ends. Abbreviations: BLS, below land surface; NAD 83, North American Datum of 1983; NAVD 88, National Geodetic Vertical Datum of 1988; NRF, Naval Reactor Facility; USGS, U.S. Geological Survey; UTC, Coordinated Universal Time]
Monitor Well NRF-18 Construction
USGS mobilized equipment to well NRF-18 on September 18, 2023 and started to drill with an 8.0-in. bit attached to a 7.5-in.-diameter stabilizer. Drilling occurred over 2 days to a completion depth of 461 ft BLS. Well NRF-18 was developed for 3 hours after drilling stopped and until there was evidence of good formation flow on September 19, 2023. The upper borehole section, which includes 12.0-in. casing to 15 ft BLS and 8.0-in. casing to 380 ft BLS, was completed as part of the prior drilling activity and did not require any modification (Trcka and Twining, 2023b).
On September 20, 2023, a video was run to confirm the borehole condition and showed the bottom of the drilled 8.0-in. borehole free from obstruction to a depth of 461 ft BLS. The video also showed that the previously cored section was only partially filled with drill cuttings and was open between 461 ft and 539 ft BLS. About 825 pounds of bentonite hole plug was added and 200 pounds of silica sand (6-9 mesh size) to bring the well bottom up to the design depth of 450 ft BLS. Well NRF-18 depth was tagged using a weighted measurement line while adding material and later confirmed by borehole video. The 6.0-in. stainless-steel well screen assembly was installed on September 21, 2013, with the bottom cap landing at 450 ft BLS. The well screen assembly included a threaded K-packer adapter, 39 ft of blank 6.0-in., stainless-steel blank casing, and 60 ft of 6.0-in., stainless-steel well screen (20-slot wire wrap; fig. 4).

Final constructed well NRF-18, Naval Reactors Facility, Idaho National Laboratory, Idaho. BLS, below land surface; ft, feet; in.; hp, horsepower; inch; V, volt.
Starting on September 27, 2023, the USGS installed a submersible pump and measurement line. Well NRF-18 was configured with a submersible pump and motor attached to a 1.3-in.-diameter, stainless-steel discharge and 1.0-in.-diameter, stainless-steel, open-ended measurement line. The submersible pump suction was placed at 410.6 ft BLS. The final construction of well NRF-18 includes (1) 12.0-in.-diameter carbon steel casing extending from land surface to 15 ft BLS; (2) 8.0-in.-diameter carbon steel casing extending just above land surface to 380 ft BLS; (3) 6.0-in.-diameter, stainless-steel blank casing attached to a K-packer assembly extending from 351 to 390 ft BLS; and (4) 6.0-in.-diameter, stainless-steel, wire-wrap, 20-slot well screen extending from 390 to 450 ft BLS with a capped bottom (fig. 4). Surface completion includes a 4-ft-diameter concrete pad complete with a brass survey marker, and a locking wellhead (table 1).
Geologic and Geophysical Data
Geologic data were collected and analyzed from core material to provide rock and sediment properties (Trcka and Twining, 2023a, 2023b). Additionally, geologic and hydrologic data were interpreted from geophysical log data collected and analyzed for wells NRF-17 and NRF-18. Geophysical logs generally provide a complete and continuous representation of the formation adjacent to the well bore and offer more depth selection consistency for geologic contacts when core recovery is incomplete.
Geophysical Data
Geophysical data were collected immediately following core drilling during 2020 and after final construction of each monitoring well during 2023. Table 2 summarizes the borehole geophysical data collected from wells NRF-17 and NRF-18. Geophysical data presented in figures 5 and 6 (including natural gamma, neutron, and gamma-gamma density) were collected during 2020 and represent the cored section prior to reaming and casing in wells NRF-17 and NRF-18 (table 2). Additional geophysical log data, acoustic televiewer (ATV), was collected in 2023 following reaming for well NRF-17 and well NRF-18. Select geophysical data (neutron, natural gamma, and gamma-gamma) collected in 2020 following core drilling were shown in figures where source log resolution can be affected by a larger borehole diameter.
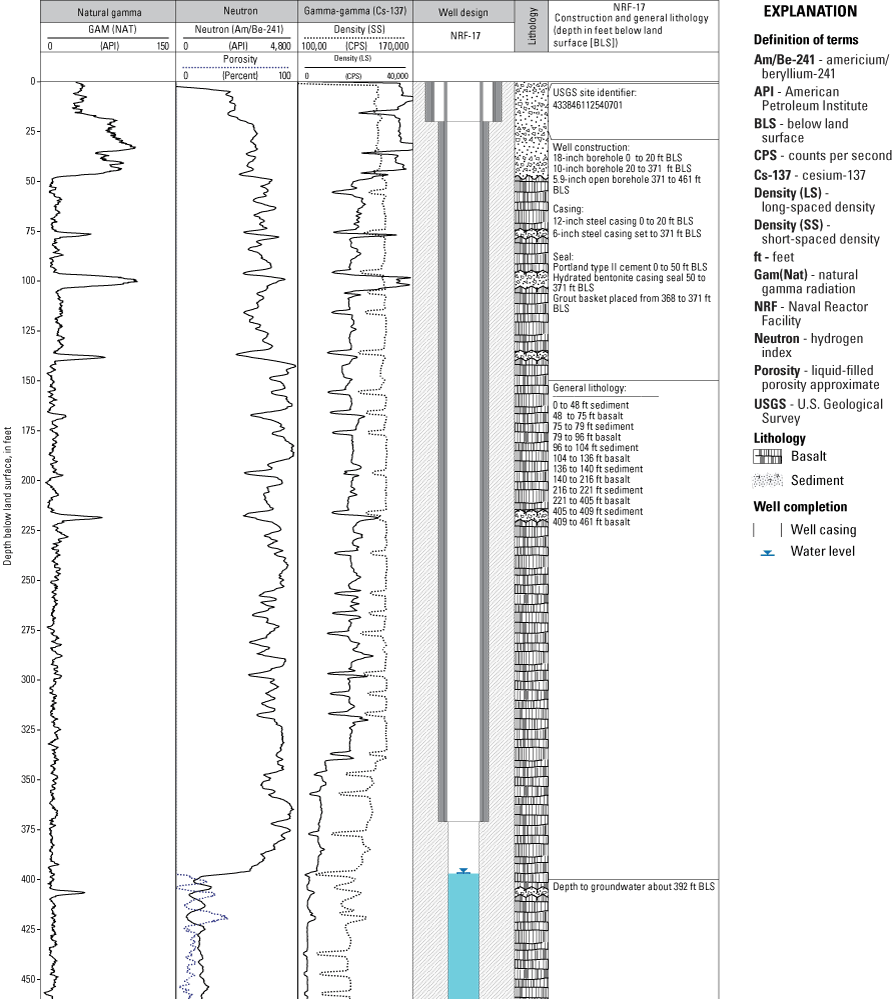
Geophysical logs (including natural gamma, neutron, and gamma-gamma, well design) and generalized lithology described from cores for well NRF-17, Naval Reactors Facility, Idaho National Laboratory, Idaho.

Geophysical logs (including natural gamma, neutron, and gamma-gamma, well design) and generalized lithology described from cores for well NRF-18, Naval Reactors Facility, Idaho National Laboratory, Idaho.
Geophysical log data collected for wells NRF-17 and NRF-18 include natural gamma, neutron, gamma-gamma dual density, gyroscopic deviation, mechanical 3-arm caliper, acoustic caliper, and ATV (table 2). Additionally, borehole videos were collected to view the conditions of the open borehole during construction and after final completion. Geophysical log data were collected and saved as electronic files in the form of physical measurement and depth and processed using WellCAD software. Processed data were used to infer changes in geologic material along with lithologic descriptions from core. Borehole geophysical data can be accessed through the USGS GeoLog Locator (U.S. Geological Survey, 2019).
Table 2.
Summary of borehole geophysical data collected from wells NRF-17 and NRF-18, Naval Reactors Facility, Idaho National Laboratory, Idaho.[Geophysical data presented were taken from one or more of the logging tools listed under Log type. Log type: Description of geophysical log trace presented. Tool ID: Century Geophysical Corporation (Tulsa, Oklahoma) tool number as referenced on web site https://www.century-geo.com/. Depth: Logging depth reported from land surface measurement point. Date: mm-dd-yy, month, day, year. Time: hhmm, time-stamped hour-minute time log. Sensor uncertainty: Uncertainty specified by tool manufacturer; Comments: Explanations where needed. Abbreviations and symbol: BLS, below land surface; ft, foot; ID, identifier; NRF, Naval Reactor Facility; USGS, U.S. Geological Survey; ±, plus or minus]
Geologic Data
The surficial geology at wells NRF-17 and NRF-18 was characterized as sparsely vegetated loess. Surface sediment was not cored; however, drill cuttings from above the first basalt contact were described as unconsolidated soil consisting mostly of fine-to-coarse sand with a brief occurrence of large boulders, cobbles, and gravel at well NRF-17 and mostly of fine-grained loess material at well NRF-18. Surface sediment extends to about 48 ft BLS at well NRF-17 and to about 6 ft BLS at well NRF-18.
Sediment layer descriptions were noted in core logs (Trcka and Twining, 2023a, 2023b) and lithologic descriptions were included in geophysical logs for wells NRF-17 (fig. 5) and NRF-18 (fig. 6). Excluding surface sediment, core descriptions were compared against geophysical data and suggest sediment layer thickness ranges from 1 to 7 ft for the constructed well section from 48 to 461 ft BLS in well NRF-17 and from 2 to 5 ft for the constructed well section from 6 to 461 ft BLS in well NRF-18. Only one of five sediment layers in well NRF-17 were recovered during coring for the constructed section described (fig. 5). No sediment was recovered from well NRF-18 for the section described (fig. 6). The sediment recovered from well NRF-17 starts near 216 ft BLS and is described as fine sand (Trcka and Twining, 2023a). Other sediment layers were either washed out or not recovered during coring. Excluding the 48 ft of surface sediment in well NRF-17 and 6 ft in well NRF-18, sediment layers described below the first basalt contact only account for a small percentage (less than 4 percent) of the overall thickness in both wells (figs. 5 and 6).
Basalt layers were described for wells NRF-17 and NRF-18 (Trcka and Twining, 2023a, 2023b). The texture of basalt varied between aphanitic, diktytaxitic, and porphyritic and generally ranged from medium to dark gray in color. Lithologic descriptions of basalt layers suggest variable thickness of units and indicate typical basalt variations of fractured upper and lower crust and more massive interiors along with varying degrees of vesiculation. Basalt constituted about 96 percent of the general lithology, excluding surface sediment, for the constructed section in wells NRF-17 and NRF-18.
Geophysical Logs
Borehole geophysical data were collected using wireline logging tools operated and owned by the USGS INL Project Office. Geophysical data generally were collected coming up out of the borehole unless otherwise described in table 2. Borehole video files were recorded using wireline camera equipment, also owned and operated by the USGS INL Project Office. The log type, logging tool identifier, logging depth, date and time of log, and sensor uncertainty are provided in table 2. The USGS calibrates geophysical logging equipment and sensors annually or as needed.
Natural Gamma Logs
Natural gamma logs were used to confirm and compare the location and thickness of sediment layers with lithologic logs (Trcka and Twining, 2023a, 2023b). Natural gamma logs record gamma radiation emitted by naturally occurring radioisotopes. The natural gamma detector measures total gamma radiation without distinguishing among individual contributions of the various isotopes. The USGS has used natural gamma logging at the INL to identify sedimentary layers in boreholes, but also to distinguish between basalt flows containing different amounts of potassium-40 (Anderson and Liszewski, 1997). Most logging tools used by the USGS include a natural gamma detector along with other sensors and detectors. The natural gamma data tool sensor presented in report figures is identified in table 2.
Five sediment layers, excluding surface sediment from the first basalt contact, were identified in generalized lithologic descriptions for the constructed section using natural gamma data and core material for wells NRF-17 and NRF-18. As observed in well NRF-18, elevated natural gamma indicates increased potassium-40 in select basalt groups and can show natural gamma emission levels similar to those represented by sediment. For example, the elevated natural gamma observed in well NRF-18 from about 109 to 175 ft BLS and again from about 252 to 270 ft BLS represent increased gamma emissions likely related to elevated potassium-40 in select basalt groups; basalt identification was confirmed against core material (fig. 6; Trcka and Twining, 2023b).
General lithology, confirmed against natural gamma logs and core descriptions, was used to identify sediment layer thickness and location where unsaturated zone sediment was not recovered during core drilling. Sediment layers were relatively thin, ranging from 1 to 7 ft for both wells NRF-17 and NRF-18. Sediment layers constituted a relatively small percentage of the lithology at about 4 percent by volume for each well. The sediment described in well NRF-17 consisted of fine-grained sand and silt (Trcka and Twining, 2023a, 2023b). No attempts were made to describe sediment layers that were not recovered during the core-drilling process.
Neutron Logs
Neutron logs are a general indicator of hydrogen content and, when combined with natural gamma logs for sediment location, can be used to identify perched groundwater. The neutron detector continuously records induced radiation produced by bombarding surrounding material (casing, formation, and fluid) with fast neutrons (energies greater than 105 electron volts) from a sealed neutron source, which collide with surrounding atomic nuclei until they are captured (Keys, 1990, section 5, p. 95). The neutron probe used by the USGS INL Project Office has an americium/beryllium neutron source and a helium-3 detector that counts slow (thermal) neutrons (those that have energies less than 0.025 electron volts). The neutron logs were collected through drill casing after core drilling to capture borehole conditions before reaming to a larger diameter (table 2).
Neutron logs indicate no evidence of perched groundwater in unsaturated media, located above the regional aquifer or from land surface down to about 392 ft BLS in wells NRF-17 and NRF-18. Neutron logs shown for well NRF-18 (fig. 6) were collected inside drill stem filled with drilling fluid, resulting in an overall lower neutron count compared to the neutron log collected for well NRF-17 (fig. 5). The neutron logs correlated well with ATV logs and lithologic logs collected for wells NRF-17 and NRF-18 (figs. 7 and 8). Zones with low hydrogen content correlated with dense and massive basalt, whereas zones with high hydrogen content correlated with fractured and vesicular basalt for saturated media. Relative change in neutron porosity, generated from neutron measurements, were used to confirm areas of higher and lower hydrogen content in wells NRF-17 and NRF-18. In well NRF-17, the 2 primary fractured areas that contribute to groundwater flow are present near 407 and 418 ft BLS, respectively (fig. 7); however, most of the lithology within the water column was described as dense basalt, as confirmed by neutron measurements. In well NRF-18, fractured and vesicular basalt constitute most of the water column. Based on neutron measurements and estimated porosity, pumping production capacity for well NRF-18 is likely to be substantially higher than that observed for well NRF-17.

Expanded geophysical and lithologic logs with focus on depths 390–460 feet below land surface for well NRF-17, Naval Reactor Facility, Idaho National Laboratory, Idaho.

Expanded geophysical and lithologic logs with focus on depths 390–460 feet below land surface for well NRF-18, Naval Reactor Facility, Idaho National Laboratory, Idaho.
Gamma-Gamma Dual Density Logs
Gamma-gamma dual density logging detects Compton-scattered gamma rays that originate from a fully encapsulated, 0.2-curie cesium-137 source (Keys, 1990). The gamma tool uses a detachable radioactive source located on the bottom of the tool during operation. The intensity of the gamma radiation reflected to the probe is related to the electron density of the medium after it is backscattered or absorbed in a drill hole, borehole fluid, or surrounding media. In this study, we used an omni-directional, dual detector sonde that responds to density variation in counts per second (CPS), registering higher CPS counts for lower-density material.
Gamma-gamma dual density data were collected for wells NRF-17 and NRF-18 (figs. 5 and 6; table 2). Attempts were made to use gamma-gamma dual density logs to confirm density changes and correlate with areas of unfractured and fractured basalt. Fractured basalt zones, indicated in gamma-gamma dual density logs, can be used to correlate with fractured zones from other geophysical logs; however, the drill tooling (core-drilling rods) seems to directly affect the gamma-gamma signal and source emission for this tool. For example, the regularly spaced decreases in density reflect the location of the threaded drill collars; therefore, it was assumed that the type of drill rod used on this project limited the use of the density log for this application.
Acoustic Televiewer Log
The acoustic televiewer (ATV) probe was run in wells NRF-17 and NRF-18 and used to generate an image of the borehole walls (figs. 7 and 8; table 2). High-resolution images are obtained from the ATV probe by rotating a transducer that transmits digital ultrasonic pulses. The transit time (travel time) and amplitude of the reflected acoustic signal are recorded as photographic-like images. Lithologic changes, foliations, bedding planes, and sealed fractures may be detected when there is no change in the borehole diameter if there is sufficient acoustic contrast (Williams and Johnson, 2004). The ATV and neutron logs are shown together to indicate the location of fractures, relative fracture density, and fracture aperture.
Centralizers were attached to the ATV probe to center the probe inside the open borehole and run within the water column for each well (table 2). The borehole diameters for wells NRF-17 and NRF-18 were adequate for the ATV probe; which was within the suggested diameter range of 2.9–9.0-in. (Williams and Johnson, 2004). The ATV probe was trolled upward at 3–4 ft per minute with the data collection interval set at 0.02 ft per measurement to maximize image quality. The ATV-imaged data for wells NRF-17 (fig. 7) and NRF-18 (fig. 8) correlate with neutron logs and depict areas of fractured and dense basalt. Use of the ATV-imaged data adjacent to the neutron response helps us identify the primary pathway for groundwater flow and where porosity changes occur in basalt media. The water column in well NRF-17 is mostly dense basalt (estimated at 77 percent). Fractured and vesicular basalt (estimated at 23 percent) are shown in ATV images and are present mostly within the upper 21 ft of water column in well NRF-17 (fig. 7). Well NRF-18 is composed mostly of fractured and vesicular basalt (estimated at 64 percent) and ATV images show these features throughout the water column. Locations of fractured and dense basalt media were used to make assumptions related to pumping test results and provide a general indication for how basalt features affect the well capacity and hydraulic property estimates.
Acoustic Caliper and Mechanical Caliper Logs
Acoustic caliper and mechanical caliper tools were collected to examine changes in borehole diameter (table 2; figs. 7 and 8). Acoustic caliper log data for wells NRF-17 and NRF-18 were collected after reaming and represent the final well diameter prior to placing the submersible pump in the well. Mechanical caliper logs were collected after core drilling and reflected the borehole diameter prior to reaming. Both log types are presented and show similar fractured areas; however, the acoustic caliper data more accurately reflect the current conditions for each of the wells. The acoustic and mechanical caliper data were used to confirm rock property changes, such as fractured and vesicular to dense basalt.
The acoustic caliper tool interpolates borehole wall variations using a waveform that is reflected from the borehole wall back to the ATV tool. The acoustic caliper and ATV logs are collected using the same logging tool (table 2). The travel time of the waveform from the borehole wall to the tool is converted to a distance that is the approximate borehole diameter. The acoustic caliper tool uses acoustic transit and velocity data to generate directional caliper distance in the horizontal X and Y directions, noted as ATV X and ATV Y, respectively (figs. 7 and 8). The acoustic caliper tool collects a continuous profile of the borehole diameter as the tool is raised from the bottom of the borehole and can detect subtle changes of greater than or equal to 0.1 in. in borehole diameter.
The mechanical caliper tool also collects a continuous log of the borehole diameter by using three extendable spring-loaded arms, capable of detecting changes in borehole diameter. Changes in borehole diameter, detected by the amount of deflection of the caliper arms, are recorded as the caliper tool is raised from the bottom of the borehole. Caliper data were used to delineate fracture openings and zones of relatively dense fracturing.
The borehole diameter data, collected by the acoustic caliper and mechanical caliper tools, correlate well with ATV-imaged locations of fractures but also confirm areas of dense basalt. Fractured and (or) vesicular zones, identified in ATV and mechanical caliper logs, correlate with elevated neutron porosity data and changes in density (figs. 7 and 8). Fracture and (or) vesiculated zones are considered the primary water-producing zones where groundwater flow is expected.
Gyroscopic Deviation Survey
A borehole gyroscopic deviation survey was done for wells NRF-17 and NRF-18 to determine well offset and the projected well bore path. The gyroscopic deviation survey procedure and equations used to compute calculated offset, northing, easting, distance, and azimuth are described in Twining (2016). Gyroscopic deviation data were continuously collected at regularly spaced intervals of 0.20 ft and processed using the software supplied by the tool manufacturer.
Gyroscopic deviation data for wells NRF-17 and NRF-18 are reported in 50-ft increments and reflect the horizontal and vertical displacements at various depths (table 3). The calculated offset near the approximate depth to water was considered to determine whether a water-level correction was necessary. The calculated offset using a deviation survey for well NRF-17 was 0.14 ft and for well NRF-18 was 0.18 ft, suggesting that the boreholes do not require a water-level correction (table 3). A water-level correction is required when the offset exceeds 0.20 ft (Twining, 2016).
Table 3.
Gyroscopic deviation survey data shown in 50-foot increments for wells NRF-17 and NRF-18, Naval Reactor Facility, Idaho National Laboratory, Idaho.[Survey was done using a gyroscopic deviation logging tool with magnetic declination set at constant 12.5 degrees. CD (cable depth) is reported from wireline depth. TVD (true vertical depth) is computed depth using an average angles equation (Twining, 2016). CO (calculated offset) is computed by subtracting TVD from CD. Northing, Easting, Distance, and Azimuth are computed from the well path survey using SANG and SANGB data (Twining, 2016). Abbreviations: ft BLS, feet below land surface; SANG, inclination or slant angle; SANGB, azimuth or slant angle bearing from well survey; NRF, Naval Reactor Facility]
Single-Well Aquifer Tests
Single well aquifer tests were conducted for wells NRF-17 and NRF-18, located near the NRF at INL (fig. 2). Test results were used to define hydraulic characteristics for two recently drilled monitoring wells that penetrate approximately 60–70 feet into the ESRP aquifer at each location. Both wells were constructed within olivine tholeiite basalt. Well NRF-18 had a thin layer of sediment described near the top of water column (fig. 8). Well NRF-17 was constructed in mostly dense basalt (77 percent) and fractured basalt (23 percent; fig. 7); well NRF-18 was constructed in mostly fractured basalt (64 percent), dense basalt (23 percent), and sediment (1 percent; fig. 8).
Each aquifer test had a total duration time of 3 hours (180-minutes). Well NRF-17 was pumped continuously on May 28, 2024, from 1110 to 1410 hours. Well NRF-18 was pumped continuously on May 29, 2024, from 1050 to 1350 hours. The aquifer-test data were analyzed for pressure change in response to groundwater pumping and atmospheric conditions. Results from these tests will be used to determine monitoring well productivity and to help describe ESRP aquifer conditions for each well near the NRF facility for future monitoring.
Single-Well Aquifer Test Procedures
During aquifer tests for wells NRF-17 and NRF-18, fluid pressure head, fluid temperature, air temperature, and barometric pressure were measured continuously. The fluid pressure head, Ψw+atm, and fluid temperature were measured using an absolute (non-vented) Solinst Levelogger suspended on a direct read cable and placed inside a 1-in., stainless-steel, water-level line before testing (fig. 9). The Model 3001 Solinst Levelogger (model F65/M20; Solinst, Georgetown, Ontario, Canada) has a manufacturer-stated, full-scale range and accuracy of 65.6 and ±0.03 ft, respectively. The barometric pressure, Ψatm, and air temperature were measured with a Model 3001 Solinst Barologger, F5/M1.5, with an operating temperature range of –20–80 degrees Celsius (°C) and stated accuracy of ±0.01 pounds per square inch (lb/in2). The barrologger was suspended on a cable about 10 ft down inside the well casing and dataset to collect at 5-minute intervals over the duration of both aquifer tests (figs. 9, 10). During the aquifer test, barometric pressure ranged from 12.37 to 12.34 lb/in2 at well NRF-17 and from 12.29 to 12.32 lb/in2 at well NRF-18; air temperature ranged from 15.8 to 14.9 °C at well NRF-17 and from 14.6 to 14.7 °C at well NRF-18 (fig. 10).
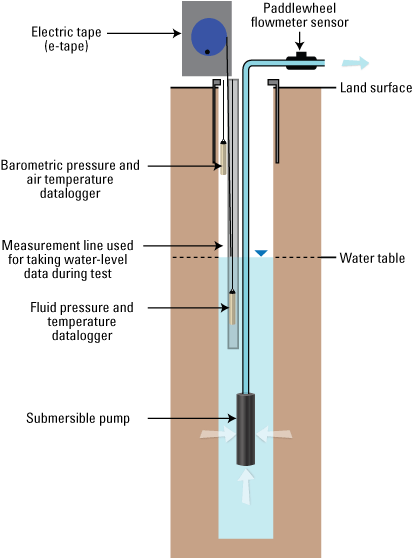
Idealized schematic showing pressure sensor and pump placement during the single-well aquifer tests at wells NRF-17 and NRF-18, Naval Reactors Facility, Idaho National Laboratory, Idaho (modified from Twining and others, 2014).
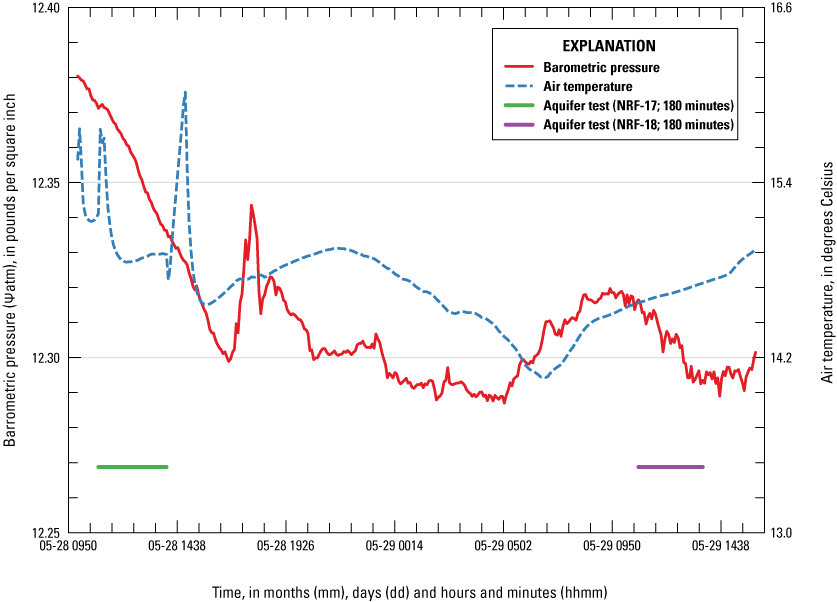
Graph showing changes in barometric pressure and air temperature through time, during the single-well aquifer tests in wells NRF-17 and NRF-18, Naval Reactors Facility, Idaho National Laboratory, Idaho, May 28–29, 2024.
The compensated fluid pressure head, , was obtained by subtracting the fluid pressure head, , from the barometric pressure, (eq. 1). Compensated fluid pressure head computation was done using the software provided by Solinst and calculated using the following equation:
whereManual water-level measurements were collected using an electric tape during each aquifer test. The electric tape probe was lowered down the same 1-in., stainless-steel measurement line as the datalogger used to measure fluid pressure head change during the test (fig. 9). The manual water-level measurements were not collected throughout the entire test, but attempts were made to collect early and late time measurements as time permitted to supplement compensated fluid pressure readings. Compensated fluid pressure readings, after the submersible pump was turned off (recovery data), were collected but not analyzed. Additionally, no manual water-level measurements were collected after the pump was turned off.
The pumping rate, Q, associated with well discharge was monitored periodically using an inline flowmeter sensor (fig. 9). The pumping rate reported in well NRF-17 decreased during the first 30 minutes of the test from 4.4 to 3.1 gal/min where it remained relatively constant for the remainder of the test, averaging 3.3 gal/min (fig. 11A). The pumping rate reported in well NRF-18 increased from 29.3 gal/min to 32.0 gal/min over the first 30 minutes of the test and remained relatively constant during the remainder of the test, averaging 31.0 gal/min (fig. 11B).
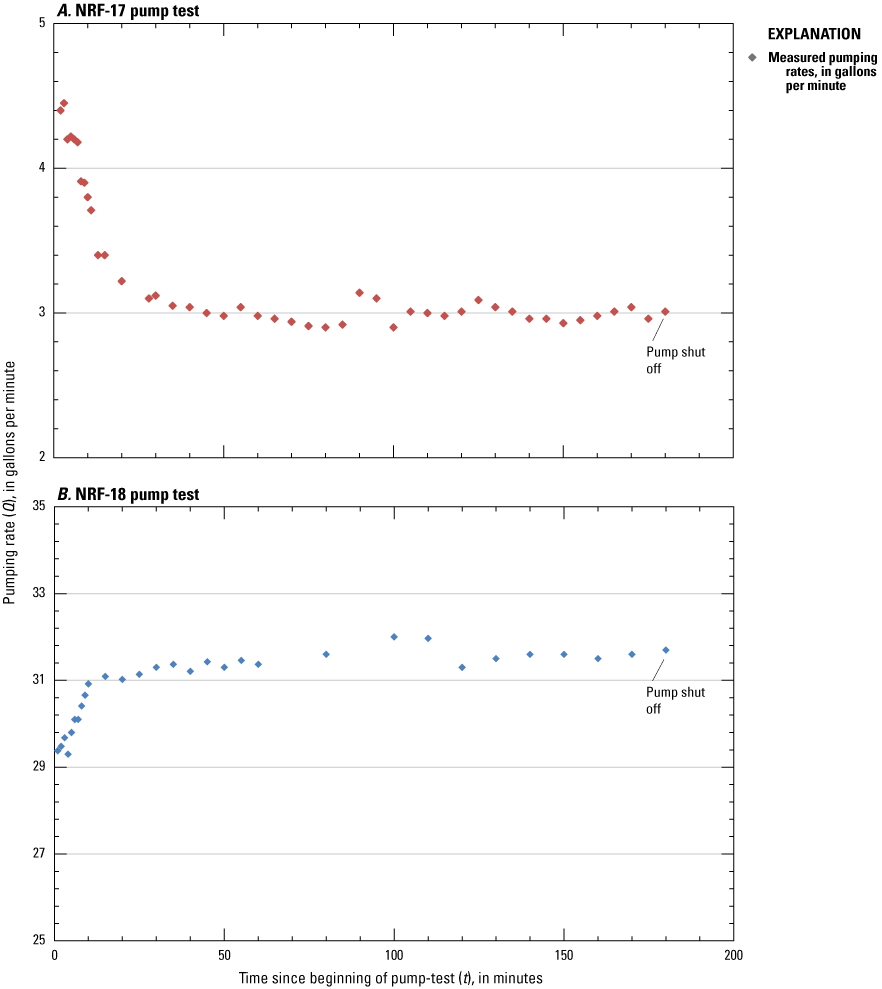
Graphs showing measured pumping rates during 180-minute tests at wells (A) NRF-17 on May 28, 2024, and (B) NRF-18, on May 29, 2024, at Naval Reactor Facility, Idaho National Laboratory, Idaho.
Analysis of Single-Well Aquifer Test Data
Single-well aquifer test results from monitoring well NRF-17 were analyzed using the Cooper-Jacob method of curve fitting (Cooper and Jacob, 1946) to estimate transmissivity. The Cooper-Jacob method (Cooper and Jacob, 1946), a simplification of the Theis solution, assumes that the pumping well fully penetrates a confined, homogeneous, and isotropic aquifer of infinite extent. Hydrologic conditions at well NRF-17 depart greatly from the Theis (1935) model given that the well partially penetrates an unconfined heterogeneous anisotropic aquifer. The Cooper-Jacob method was used, regardless of the differences between field conditions and theory, for its simplicity. In an analysis of single-well tests, Halford and others (2006) reported that the Cooper-Jacob method (Cooper and Jacob, 1946) is well-suited for estimating hydraulic properties.
The Cooper-Jacob method estimates transmissivity by fitting a straight line to drawdown in the pumping well on an arithmetic axis compared to time on a log-arithmetic axis. Transmissivity, T, is determined from the slope of the straight line using the following equation:
whereSingle-well aquifer test results for well NRF-18 were analyzed using a specific-capacity method to estimate transmissivity (Ackerman, 1991). This method uses linear regression to estimate transmissivity (in feet squared per day) near the well from specific capacity (in gallons per minute per foot; fig. 12). The specific-capacity method uses a modified Theis equation (Theis and others, 1963, p. 332, eq. 1) and assumes constant values for the storage coefficient and the effective well radius to estimate transmissivity. Because of the near instantaneous drop in water level to pumping, the specific-capacity method was used to estimate hydraulic properties at well NRF-18. Both aquifer test methods, the Cooper-Jacob and the specific-capacity methods, have been applied during previous studies and provide a reasonable comparison of hydraulic properties estimated for wells drilled in fractured basalt at the INL.
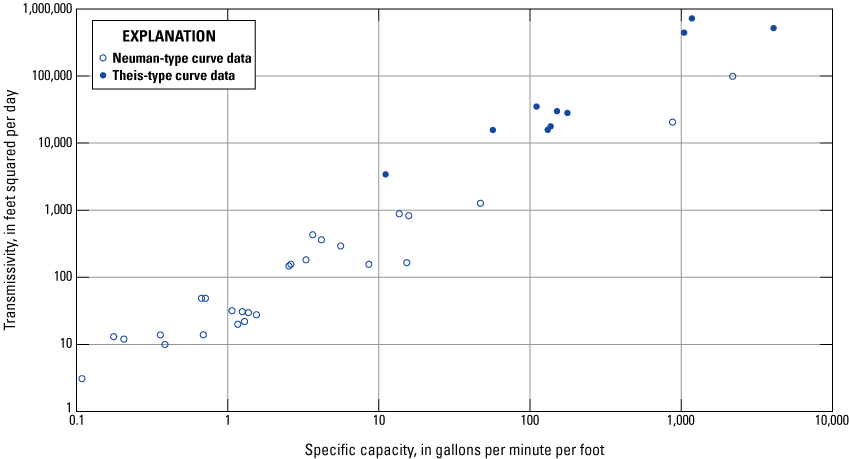
Relation between transmissivity and specific capacity derived from aquifer testing for wells completed within the eastern Snake River Plain aquifer, Idaho (modified from Ackerman, 1991).
Specific-capacity is an expression of the productivity of a well and is commonly expressed as the ratio of the pumping rate, Q, in gallons per minute, to the total measured drawdown, , in feet (eq. 3). This specific-capacity method uses linear regression to estimate transmissivity (T) through the following equations:
whereT
is the transmissivity, in feet squared per day;
SC
is the specific capacity, in gallons per minute per foot;
Q
is the average pumping rate, in gallons per minute; and
is the average drawdown over one log cycle, in feet.
The drawdown in the well, s, at any given time, t,is determined by subtracting the compensated pressure head at time t, from the initial compensated pressure head before pumping, . Drawdown as a function of time was calculated using the following equation:
Estimations of horizontal hydraulic conductivity, K, were based on the aquifer thickness, b, rather than the water column height. Halford and others (2006) reported that, in most cases, using aquifer thickness as the divisor gave the best estimates of horizontal hydraulic conductivity for unconfined aquifers with partial penetration. Aquifer thickness was approximated at 850 ft BLS from electrical resistivity surveys and data collected from limited deep boreholes at the INL (Whitehead, 1986, sheet 2; Ackerman and others, 2010). Horizontal hydraulic conductivity (K) was calculated using transmissivity (T) and aquifer thickness (b) in the following equation:
Hydraulic Property Estimates
Transmissivity and hydraulic conductivity were estimated from two single-well aquifer tests performed at wells NRF-17 and NRF-18. Hydraulic property estimates were estimated using an analysis method selected based on individual well response to pumping at a semi-constant rate (Q). Drawdown measurements that occurred during each test were reported from manual water-level measurements and compensated fluid-pressure measurements.
Figure 13A shows manual water-level measurements taken in well NRF-17 during the first 13 minutes of the test and compensated fluid pressure measurements taken throughout the duration of the 180-minute test. Because of a measurement line obstruction, manual water-level measurements were discontinued after 13 minutes; however, compensated fluid-pressure measurements continued and were used for aquifer test analysis. The source of the manual water-level line obstruction cannot be confirmed; however, the obstruction may have been related to the electric tape probe tip encountering pump wire or a pipe coupler below the 1-in. measurement line (fig. 3).
Log cycle drawdown ( in eq. 2), used to estimate hydraulic properties for well NRF-17, was approximated at 13.1 ft using compensated fluid pressure measurements over one log cycle (1 and 10 minutes; fig. 13B). Measured water-level data collected during the pumping test ranged from 390.48 ft BLS (pre-test) to 409.89 ft BLS, or 19.41 ft, at about 13 minutes into test (Zingre, 2024). Compensated fluid pressure measurements and manual water-level measurements were similar and suggest stable drawdown after about the first 15 minutes into the test at well NRF-17.
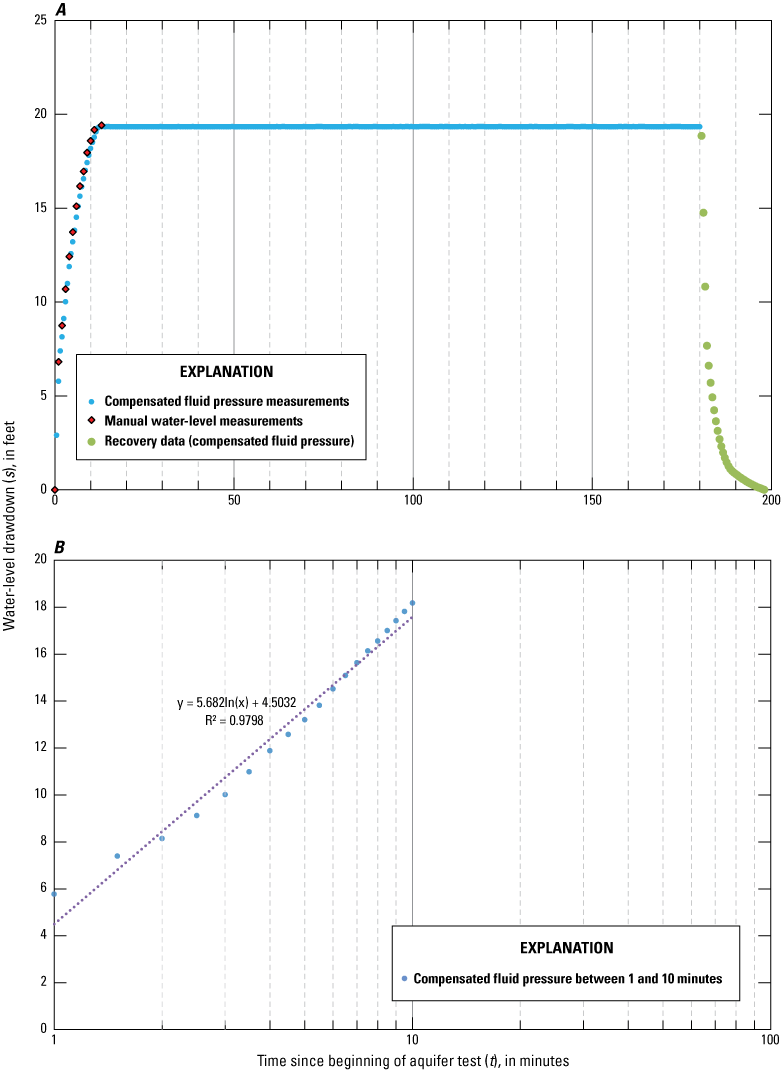
(A) Water-level drawdown at well NRF-17 from electric water-level tape (e-tape) and pressure transducer data collected during the aquifer test (180-minute duration) on May 28, 2024, and (B) selected water-level drawdown data included in analysis using the Cooper-Jacob method of linear regression used for single well analysis at well NRF-17, Naval Reactor Facilities, Idaho National Laboratory, Idaho. R2, coefficient of determination.
Well NRF-18 manual water-level measurements and compensated fluid pressure measurements were taken throughout the duration of the 180-minute test (fig. 14). Average drawdown (), used to estimate hydraulic properties for well NRF-18, was estimated at 0.57 ft for manual water-level and at 0.56 ft using compensated fluid pressure measurements (fig. 14). Manual water-level measurements collected during the test ranged from 391.16 ft BLS (pre-test) to 391.71 ft BLS (Zingre, 2024). Compensated fluid pressure measurements and manual water-level measurements show similar results and suggest that the reported water-level drop that occurred at the onset of pumping occurred immediately (less than 1 minute afterwards) and remained stable throughout the remainder of the test. Once the pump was shut off, the well recovered immediately and the water level in the well rebounded above the pre-test water level. The immediate recovery response is related to the high production capacity of the well.
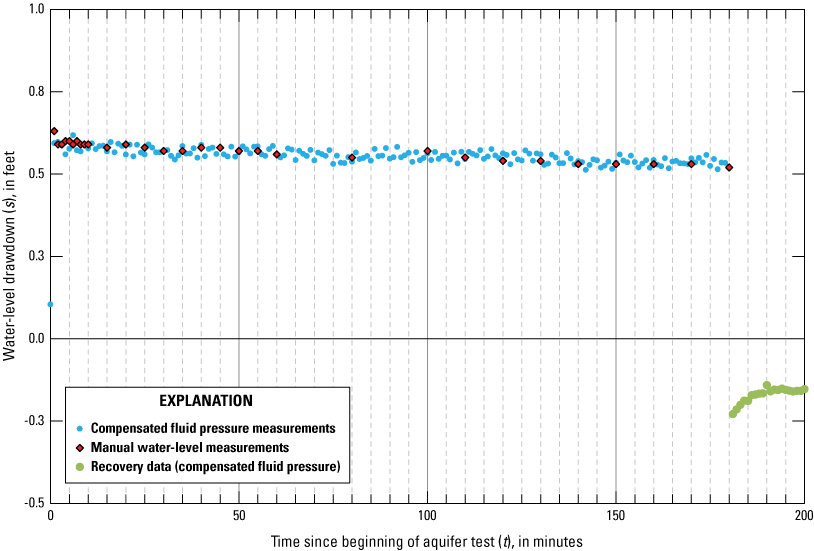
Water-level drawdown at well NRF-18 from electric water-level tape (e-tape) and pressure transducer data collected during the aquifer test (180-minute duration) on May 29, 2024, Naval Reactor Facilities, Idaho National Laboratory, Idaho.
Transmissivity for well NRF-17 was estimated using the Cooper-Jacob method (eq. 2), which involves linear regression of a subset of water-level drawdown data to fit a semi-log model and calculate a semi-log slope (fig. 13B). Transmissivity for well NRF-18 was estimated using the specific-capacity method (eq. 4). Compensated pressure head measurements are affected by transducer settings prior to the beginning of the test; therefore, they are relative values and not reflective of actual depth below water.
Using the compensated transducer data that accounts for barometric pressure, values of transmissivity and hydraulic conductivity for well NRF-17 were 8.81 ft2/d and 1.04×10⁻² ft/d, respectively (eqs. 2 and 6). Well NRF-17 drawdown () was estimated at 13.1 ft for the log cycle between 1 minutes and 10 minutes (fig. 13B). The calculations of these hydraulic properties, as defined by eqs. 2 and 6, are shown as follows:
Using compensated transducer data that accounts for barometric pressure, the estimated values of transmissivity and hydraulic conductivity for well NRF-18 were 4.77×10³ and 5.61 ft/d, respectively (eqs. 4 and 6). Drawdown () during the well NRF-18 pumping test was estimated by taking the difference between the initial elevation and the pumping elevation of water (fig. 14) and estimated at 0.56 ft based on compensated transducer data. The calculations of these hydraulic properties are shown as follows:
A comparison between the estimated transmissivity for wells NRF-17 and NRF-18 and the transmissivity values determined from past aquifer tests conducted at wells near the NRF shows reasonable agreement (fig. 2; table 4). The estimated average transmissivity values at wells NRF-17 NRF-18 are within the wide range of transmissivity values from previous aquifer tests (Ackerman, 1991; Twining and others, 2016, 2018), which range from less than 3.0×100 ft2/d to greater than 5.4×105 ft2/d (table 4). The average hydraulic conductivity values estimated for wells NRF-17 and NRF-18 are within the range of values reported in the literature for similar rock types. Freeze and Cherry (1979) reported hydraulic conductivity values for permeable basalt ranging from 5.7×10⁻² to 5.7×103 ft/d. The hydraulic conductivity of the ESRP aquifer at or near the INL have been reported from about 1.0×10⁻² to 3.2×104 ft/d (Anderson and others, 1999).
Table 4.
Comparison of transmissivity values estimated from aquifer tests completed at wells near wells NRF-17 and NRF-18, Naval Reactor Facility, Idaho National Laboratory, Idaho.[Locations of wells are shown in figure 2. Local name: Local well identifier used in this study. Site identifier: Unique numerical identifiers used to access well data (U.S. Geological Survey, 2024). Transmissivity: Values are from aquifer tests presented in Ackerman (1991). Distance to NRF-17: Straight-line distance to well NRF-17. Distance to NRF-18: Straight-line distance to well NRF-18. Abbreviations and symbols: NRF, Naval Reactor Facility; USGS, U.S. Geological Survey; ft2/d; foot squared per day; <, less than; >, greater than]
Water-Sample Collection
Water-sample collection at wells NRF-17 and NRF-18 followed guidelines documented in the USGS National Field Manual for the Collection of Water-Quality Data (U.S. Geological Survey, variously dated) and in Bartholomay and others (2021). The constituents sampled after well completion were selected to provide a characterization of baseline water chemistry and radionuclide concentrations.
Sample Collection Methods
Water-quality samples were collected from well NRF-17 (on November 7, 2023) and well NRF-18 (on November 8, 2023) from a 0.25-in.-diameter, stainless-steel sample port mounted on piping at the wellhead after the well was purged with a submersible pump and field measurements were stable. Field measurements of water temperature, pH, specific conductance, dissolved oxygen, and alkalinity were collected before sampling (Bartholomay and others, 2021; table 5).
Table 5.
Concentrations of selected chemical and radiochemical constituents in water from wells NRF-17 and NRF-18, Idaho National Laboratory, Idaho, November 7–8, 2023.[See figure 2 for well location with data access through U.S. Geological Survey (2024). Date: (mm-dd-yyyy) indicates month-day-year. Analytical results are in micrograms per liter unless otherwise noted. Bicarbonate data were calculated from alkalinity field measurements; alkalinity divided by 0.8202 (Hem, 1989, p. 57). Samples were analyzed at the U.S. Geological Survey (USGS) National Water Quality Laboratory in Lakewood, Colorado unless otherwise indicated. Abbreviations and symbols: Menlo, USGS Menlo Park Tritium Laboratory, California; RSIL, USGS Reston Stable Isotope Laboratory, Virginia; CaCO3, calcium carbonate; pCi/L, picocuries per liter; N, nitrogen; P, phosphorus; RESL, Radiological and Environmental Sciences Laboratory; <, less than; ±, plus or minus; mg/L, milligrams per liter; NTU, nephelometric turbidity units; uS/cm, microsiemens per centimeter. Uncertainty of radiochemical constituents is 1s. Uncertainty (2-sigma) of deuterium and oxygen-18 is ±2 permil and 0.2 permil, respectively. Radiochemical concentrations that meet or exceed the reporting level of 3 times the 1s value are shown in boldface type.]
Calculated using PhreeqC geochemical program (Parkhurst and Appelo, 2013).
Water-quality samples were processed in the field according to protocols for the analyses requested. Samples analyzed for chemical constituents by the USGS National Water Quality Laboratory (NWQL) were placed in containers and preserved in accordance with laboratory requirements specified by Bartholomay and others (2021, app. 1). Containers and preservatives were supplied by the NWQL and underwent rigorous quality-control procedures (Pritt, 1989, p. 75) to minimize sample contamination. Samples requiring field filtration were filtered through a disposable 0.45-micrometer cartridge pre-rinsed with at least 2 liters of deionized water. Water samples analyzed for radionuclides were collected and preserved in accordance with laboratory requirements specified by Bodnar and Percival (1982) and Bartholomay and others (2021, app. A) before being sent to the Radiological and Environmental Sciences Laboratory (RESL). Water samples for stable isotopes of oxygen and hydrogen, and chlorofluorocarbon (CFC-11) concentrations were collected in bottles provided by the NWQL and shipped to the USGS Reston Stable Isotope Laboratory (RSIL) in Reston, Virginia, for analysis. Water samples for tritium were collected and shipped to the USGS Menlo Park Research Laboratory in California for analysis.
Analytical Methods
Analytical methods used by the USGS for selected organic, inorganic, and radionuclide constituents are described by Goerlitz and Brown (1972), Thatcher and others (1977), Wershaw and others (1987), Fishman and Friedman (1989), Faires (1993), Fishman (1993), McCurdy and others (2008), Rose and others (2016), and Foreman and others (2021). Analytical methods used for selected isotopic constituents were summarized by Busenberg and others (2000). A discussion of procedures and methods used by the RESL for the analysis of radionuclides in water is provided by Sill and Sill (1994), U.S. Department of Energy (1995), and Bodnar and Percival (1982).
Guidelines for Interpretation of Analytical Results
The analytical results for water-quality samples from wells NRF-17 and NRF-18 are reported with stated laboratory uncertainties, minimum reporting limits (MRLs), or method detection limits (MDLs) depending on the analytical technique. Analytical results are interpreted in the context of historical results and established background concentrations, as available. The guidelines for interpreting analytical results are based on an extension of a method proposed by Currie (1984) that is given in Bartholomay and others (2020).
Concentrations of radionuclides are reported with an estimated sample standard deviation, s, which is obtained by propagating sources of analytical uncertainty in measurements. McCurdy and others (2008) provided details on interpreting radiological data used by the USGS. In this report, radionuclide concentrations less than 3s are considered to be less than the “reporting level.”
Concentrations of inorganic and organic constituents are reported with reference to MDL or MRL, respectively. Detection limits for inorganic constituents were determined using the detection and quantification calculation (DQCALC) procedure as described in U.S. Geological Survey (2015) and the reporting limits for organic constituents were determined following the procedures described in Foreman and others (2021).
Previous work has identified several recharge sources to the ESRP aquifer including regional groundwater, tributary valley groundwater, tributary valley surface water, irrigation return water, geothermal water, and precipitation (Rattray, 2018). For the purposes of this report, recharge sources are broadly defined as “regional groundwater” that originates from the ESRP aquifer to the northeast of the INL, and ‘tributary valley groundwater’, which originates from the tributary valleys to the west and northwest of INL. Each of these recharge sources have unique chemical and isotopic signatures. Wells NRF-17 and NRF-18 are located along the northwestern area of the INL (fig. 1) and the general water chemistry and recharge sources can be approximated based on this geographic location (Rattray and Paces, 2023). Recharge sources to the Northwest INL area include surface water from the Big Lost River during higher-than-average precipitation years and groundwater from the Little Lost River Valley and the Big Lost River Valley (Rattray, 2018, 2019).
The following chemistry data sections include select results as well as how these chemical signatures relate to potential groundwater recharge sources at wells NRF-17 and NRF-18 during this sampling event in autumn 2023. Some water-chemistry results at the INL are compared to background values for the ESRP aquifer in general. Finally, water-quality results are compared with known industrial activities that historically have introduced chemical and radiochemical constituents to the aquifer.
Inorganic Chemistry Data
Water samples collected from wells NRF-17 and NRF-18 were sent to the NWQL and the USGS Redox Laboratory (chromium, lead, and manganese only) to be analyzed for inorganic dissolved concentrations of (1) cations of calcium, magnesium, potassium, silica, and sodium; (2) anions of bromide, chloride, fluoride, and sulfate; and (3) trace elements of aluminum, antimony, arsenic, barium, beryllium, boron, cadmium, chromium (total and speciation), cobalt, copper, iron (total and speciation), lead, lithium, manganese, mercury, molybdenum, nickel, selenium, silver, strontium, thallium, tungsten, uranium, vanadium, and zinc.
Selected sample results from samples collected at wells NRF-17 and NRF-18 (reported respectively) indicated that calcium concentrations were 56.4 and 59.8 mg/L, potassium concentrations were 6.2 and 2.90 mg/L, silica concentrations were 25.3 and 24.0 mg/L, chloride concentrations were 37.6 and 27.5 mg/L, and sulfate concentrations were 39.2 and 34.2 mg/L, respectively (table 5). In addition to total and dissolved iron (Fe) and chromium (Cr) results from the NWQL, Fe and Cr were measured at the USGS Redox laboratory and include total Fe and Cr as well as Fe(II) and Cr(VI), two oxidation states of these elements (table 5). The notable results from these split samples sent to the USGS Redox Laboratory were that the total Cr concentration of 21.3 micrograms per liter (µg/L) for well NRF-17 was much greater than the mean background Cr concentration of less than 5 µg/L for the tributary valley groundwater and eastern regional groundwater (Bartholomay and Hall, 2016). The total, dissolved Cr concentration at well NRF-18 (8.40 µg/L) is closer to the median for these sources of potential recharge water to the NRF (Redox Laboratory), table 5. Both wells have Cr(VI) that dominates the speciation of the total dissolved Cr concentrations for both wells, at 21 µg/L (well NRF-17) and 8.40 µg/L (well NRF-18; table 5).
Based on the inorganic constituent results, the water chemistry at wells NRF-17 and NRF-18 is typical of tributary valley groundwater as supported by the lithium concentration (less than 5 µg/L) and silica concentrations (Bartholomay and Hall, 2016; Rattray, 2018). However, the sulfate, nitrate, and chloride concentrations suggest that a source, potentially from industrial wastewater disposal activities at the NRF, is mixing with recharge water from the west and northwest tributary groundwater sources to produce the groundwater observed at these wells. Wells NRF-17 and NRF-18 are located west of the mixing line of water recharge types (regional groundwater and tributary valley groundwater) as described in Fisher and others (2012) and Rattray (2018); however, intermittent recharge from the Big Lost River, variable recharge from the Little Lost River, and Little Lost River valley groundwater recharge are likely influencing the chemical composition of the groundwater at this location. The water chemistry supports a mixture of groundwater from tributary valley groundwater recharge, local groundwater recharge potentially affected by industrial activities, and surface-water recharge (Rattray, 2019). The biggest difference between the inorganic constituent results between wells NRF-17 and NRF-18 is in the aluminum and chromium concentrations (table 5).
Nutrient samples were collected and sent to the NWQL to be analyzed for dissolved concentrations of ammonia as nitrogen (N), nitrite as N, nitrate plus nitrite as N, and orthophosphate as phosphorus (P; table 5). The nitrate plus nitrite as (N) concentrations for both wells (wells NRF-17 and NRF-18) were 1.97 mg/L, which is higher than the mean concentration determined for the eastern regional groundwater source. Locally, at the NRF facility, wastewater-influenced groundwater was observed as being related to industrial activities there.
Organic Chemistry Data
Water-quality samples collected from wells NRF-17 and NRF-18 were analyzed at the NWQL for volatile organic compounds (VOCs). All of the sixty VOC analytes measured had concentrations less than laboratory MRL values (table 5) and the Environmental Protection Agency (EPA) maximum contaminant levels (MCLs; U.S. Environmental Protection Agency, 2022). These results are consistent with results from nearby wells (Treinen and others, 2024).
Stable Isotope Data
Water samples collected from wells NRF-17 and NRF-18 were analyzed at RSIL for relative concentrations of the stable isotopes of deuterium (2H) and oxygen-18 (18O). Because the absolute measurement of isotopic ratios is analytically intensive, relative isotopic ratios were measured instead (Toran, 1982) and are expressed in delta notation as part permil (part per thousand difference). For example, 18O/16O of a sample is compared with 18O/16O of a standard reference material:
whereRsample
is the 18O/16O ratio in the sample,
Rstandard
is the 18O/16O ratio in the standard, and
δ 18O
is the relative concentration, in units of parts per thousand.
Delta 18O is referred to as delta notation (δ); it is the value reported by isotopic laboratories for stable isotope analysis. Deuterium (δ2H) is defined in a similar manner with the respective ratios, (2H/1H), replacing 18O/16O in Rsample and Rstandard. The standard used for determining δ18O and δ2H in water is standard mean ocean water as defined by Craig (1961).
Stable isotope concentration data for δ2H and δ18O samples collected from wells NRF-17 and NRF-18 were –134.9±2 and –17.3±0.2 permil, and –134.4±2 and –17.6±0.2 permil, respectively (table 5). Concentrations of δ2H and δ18O were similar to stable isotope signatures from Little Lost River valley groundwater and Little Lost River surface water (Rattray, 2018) when compared to the signature from Birch Creek surface water and concentrations in other wells in the northwestern area of the INL (figs. 1 and 2). The δ2H and δ18O stable isotope signatures and the direction of groundwater flow in this area of the INL indicate that the water at wells NRF-17 and NRF-18 is likely influenced by evaporated surface water and tributary valley groundwater sources (Rattray, 2018).
Radiochemical Data
Water samples collected from wells NRF-17 and NRF-18 were analyzed at the RESL for strontium-90 (Sr-90); gross alpha, beta, and gamma radioactivity; uranium-234, and uranium-238; plutonium-238, plutonium-239, -240 (undivided), and americium-241; and at Menlo Park for low-level tritium (table 5). Concentrations of plutonium-238, plutonium-239 and -240, americium-241, and cesium-137 radionuclides were less than the reporting level. The radionuclides uranium-234, uranium-238, Sr-90 (well NRF-18), and gross beta radioactivity (well NRF-17) were all detected at concentrations greater than their respective reporting levels (table 5). Both measured uranium isotope activities were consistent with the background level for the ESRP aquifer (Bartholomay and Hall, 2016, table 1). The Sr-90 concentration was reported as 2.7±0.9 pCi/L in NRF-18, which is at the reporting level of 3s: however, it is less than the EPA 8 pCi/L MCL for drinking water (U.S. Environmental Protection Agency, 2022). A detection of gross beta activity greater than the reporting level was found in well NRF-17 at 2.9±0.9 pCi/L, which is consistent with previous report observations near the NRF (Bartholomay and others, 2002). The low-level tritium results for wells NRF-17 (26.53±4.07) and NRF-18 (26.62±4.04; table 5) are consistent with a mixture of young groundwater (recharged after 1950) and old groundwater (Busenberg and others 2001; Bartholomay and others, 2002; Rattray, 2018).
Summary
The U.S. Geological Survey (USGS)—in cooperation with the U.S. Department of Energy (DOE) for the Naval Reactors Laboratory Field Office that supports operations for the Naval Reactors Facility (NRF) located at the Idaho National Laboratory (INL)—drilled and constructed well NRF-17 (formerly USGS 151) and well NRF-18 (formerly USGS 152) as water-quality monitoring wells. Wells NRF-17 and NRF-18 were both initially cored for geologic characterization and facility characterization as part of a separate study, then repurposed as monitoring wells to support the NRF groundwater sampling program. Well NRF-17 has open hole construction with a final completion depth of 461 feet (ft) below land surface (BLS); well NRF-18 has a stainless-steel well screen that terminates at 450 ft BLS.
Geophysical data were examined against photographed core that were taken as part of the original study. Basalt flows varied from highly fractured to dense with high-to-low vesiculation. Well NRF-17 generally was constructed in mostly dense basalt (greater than 75 percent), and well NRF-18 was constructed in primarily fractured and (or) vesicular basalt (about 64 percent). Owing in part to well NRF-17 having been constructed in mostly dense basalt, the pumping test results confirmed that the well is low capacity and requires a reduction in pumping rate to prevent the water column falling below the pump intake. Well NRF-18 can be pumped at full capacity and does not require a reduction in pumping rate.
Single-well aquifer tests were done at wells NRF-17 and NRF-18 to provide estimates of transmissivity and hydraulic conductivity after initial well development. Well NRF-17 was pumped continuously on May 28, 2024, from 1110 to 1410 hours, and well NRF-18 was pumped continuously on May 29, 2024, from 1050 to 1350 hours. The aquifer-test data were analyzed for pressure changes in response to groundwater pumping and atmospheric conditions. Estimated values of transmissivity and hydraulic conductivity for well NRF-17 were 8.81 feet squared per day (ft2/d) and 1.04×10⁻² feet per day (ft/d), respectively. Estimated values of transmissivity and hydraulic conductivity for well NRF-18 were 4.77×103 ft2/d and 5.60 ft/d, respectively. The transmissivity and hydraulic conductivity estimate for wells NRF-17 and NRF-18 were within range of those considered from previous aquifer tests in other wells near the Naval Reactors Facility, which range from less than 3 ft2/day to greater than 5.4×105 ft2/d.
Water-quality samples were analyzed for cations, anions, metals, nutrients, volatile organic compounds, stable isotopes, and radionuclides. Water samples for select inorganic constituents showed concentrations consistent with signatures from tributary valley groundwater with influences from ephemeral surface-water recharge from the Big Lost River. Water-quality samples analyzed for stable isotopes of oxygen and hydrogen are consistent with evaporated surface-water recharge inputs to the aquifer. No measured water-quality results were greater than their respective maximum contaminant levels for public drinking-water supplies. Inorganic and nutrient water-quality results for wells NRF-17 and NRF-18 suggest that the groundwater in this area is potentially affected by industrial wastewater disposal.
Acknowledgments
The authors would like to acknowledge the U.S. Department of Energy-Naval Reactors Facility for support and funding this project. Additionally, the authors acknowledge the efforts made by the drilling and sampling field-teams at the Idaho National Laboratory project office, including James Fisher, Jacob Hollingsworth, Allison Trcka, and Jayson Blom.
References Cited
Ackerman, D.J., 1991, Transmissivity of the Snake River Plain aquifer at the Idaho National Engineering Laboratory, Idaho: U.S. Geological Survey Water-Resources Investigations Report 91–4058 (DOE/ID-22097), 35 p., accessed December 4, 2024, at https://pubs.er.usgs.gov/publication/wri914058.
Ackerman, D.J., Rattray, G.W., Rousseau, J.P., Davis, L.C., and Orr, B.R., 2006, A conceptual model of ground-water flow in the eastern Snake River Plain aquifer at the Idaho National Laboratory and vicinity with implications for contaminant transport: U.S. Geological Survey Scientific Investigations Report 2006–5122, 62 p., accessed December 3, 2024, at https://pubs.usgs.gov/sir/2006/5122/.
Ackerman, D.J., Rousseau, J.P., Rattray, G.W., and Fisher, J.C., 2010, Steady-state and transient models of groundwater flow and advective transport, eastern Snake River Plain aquifer, Idaho National Laboratory and vicinity, Idaho: U.S. Geological Survey Scientific Investigations Report 2010–5123, 220 p., accessed October 10, 2024, at https://doi.org/10.3133/sir20105123.
Anderson, S.R., Kuntz, M.A., and Davis, L.C., 1999, Geologic controls of hydraulic conductivity in the Snake River Plain aquifer at and near the Idaho National Engineering and Environmental Laboratory, Idaho: U.S. Geological Survey Water-Resources Investigations Report 99–4033 (DOE/ ID-22155), 38 p., accessed October 10, 2024, at https://pubs.er.usgs.gov/publication/wri994033.
Anderson, S.R., and Liszewski, M.J., 1997, Stratigraphy of the unsaturated zone and the Snake River Plain aquifer at and near the Idaho National Engineering Laboratory, Idaho: U.S. Geological Survey Water-Resources Investigations Report 97–4183 (DOE/ID-22142), 65 p., accessed October 10, 2024, at https://pubs.er.usgs.gov/publication/wri974183.
Bartholomay, R.C., and Hall, L.F., 2016 Evaluation of background concentrations of selected chemical and radiochemical constituents in water from the eastern Snake River Plain aquifer at and near the Idaho National Laboratory, Idaho: U.S. Geological Survey Scientific Investigations Report 2016-5056, (DOE/ID-22237), 19 p., accessed October 3, 2024 at https://doi.org/10.3133/sir20165056.
Bartholomay, R.C., Knobel, L.L., Tucker, B.J., and Twining, B.J., 2002, Chemical and radiochemical constituents in water from wells in the vicinity of the Naval Reactors Facility, Idaho National Engineering and Environmental Laboratory, Idaho, 2000: U.S. Geological Survey Open-File Report 2002–148 (DOE/ID–22178), 34 p., accessed October 3, 2024, at https://doi.org/10.3133/ofr02148.
Bartholomay, R.C., Maimer, N.V., Rattray, G.W., and Fisher, J.C., 2020, An update of hydrologic conditions and distribution of selected constituents in water, Eastern Snake River Plain Aquifer and perched groundwater zones, Idaho National Laboratory, Idaho, emphasis 2016–18: U.S. Geological Survey Scientific Investigations Report 2019–5149 (DOE/ID–22251), 82 p., accessed October 3, 2024, at https://doi.org/10.3133/sir20195149.
Bartholomay, R.C., Maimer, N.V., Wehnke, A.J., and Helmuth, S.L., 2021, Field methods, quality-assurance, and data management plan for water-quality activities and water-level measurements, Idaho National Laboratory, Idaho: U.S. Geological Survey Open-File Report 2021–1004 (DOE/ID-22253), 72 p. accessed October 3, 2024, at https://doi.org/10.3133/ofr20211004.
Busenberg, E., Plummer, L.N., and Bartholomay, R.C., 2001, Estimated age and source of the young fraction of ground water at the Idaho National Engineering and Environmental Laboratory: U.S. Geological Survey Water-Resources Investigations Report 2001-4265 (DOE/ID-22177), 144 p., accessed October 9, 2024, at https://doi.org/10.3133/wri014265.
Busenberg, E., Plummer, L.N., Doughten, M.W., Widman, P.K., and Bartholomay, R.C., 2000, Chemical and isotopic composition and gas concentrations of ground water and surface water from selected sites at and near the Idaho National Engineering and Environmental Laboratory, Idaho, 1994–97: U.S. Geological Survey Open-File Report 2000–81 (DOE/ ID-22164), 51 p. accessed October 10, 2024, at https://pubs.er.usgs.gov/publication/ofr0081.
Cooper, H.H., Jr., and Jacob, C.E., 1946, A generalized graphical method for evaluating formation constants and summarizing well-field history: American Geophysical Union Transactions, v. 27, no. 4, p. 526–534, accessed October 3, 2024, at https://doi.org/10.1029/TR027i004p00526.
Craig, H., 1961, Isotopic variation in meteoric water: Science, v. 133, no. 3465, p. 1702–1703. [Also available at https://doi.org/10.1126/science.133.3465.1702.]
Duke, C.L., Roback, R.C., Reimus, P.W., Bowman, R.S., McLing, T.L., Baker, K.E., and Hull, L.C., 2007, Elucidation of flow and transport processes in a variably saturated system of interlayered sediment and fractured rock using tracer tests: Vadose Zone Journal, v. 6, no. 4, p. 855–867, accessed September 4, 2024, at https://doi.org/10.2136/vzj2006.0102.
Faires, L.M., 1993, Methods of analysis by the U.S. Geological Survey National Water Quality Laboratory—Determination of metals in water by inductively coupled plasma-mass spectrometry: U.S. Geological Survey Open-File Report 92–634, 28 p. [Also available at https://pubs.er.usgs.gov/publication/ofr92634.]
Fisher, J.C., 2022, inlpubs—Bibliographic information for the U.S. Geological Survey Idaho National Laboratory Project Office: U.S. Geological Survey software release, R package, Reston, Va., accessed December 9, 2024, at https://doi.org/10.5066/P9I3GWWU.
Fisher, J.C., Rousseau, J.P., Bartholomay, R.C., and Rattray, G.W., 2012, A comparison of U.S. Geological Survey three-dimensional estimates of groundwater source areas and velocities to independently derived estimates, Idaho National Laboratory and vicinity, Idaho: U.S. Geological Survey Scientific Investigations Report 2012–5152 (DOE/ID-22218), 130 p., accessed October 3, 2024, at available at https://doi.org/10.3133/sir20122152.
Fishman, M.J., ed., 1993, Methods of analysis by the U.S. Geological Survey National Water Quality Laboratory—Determination of inorganic and organic constituents in water and fluvial sediments: U.S. Geological Survey Open-File Report 93–125, 217 p., accessed October 1, 2024, at https://pubs.er.usgs.gov/publication/ofr93125.
Fishman, M.J., and Friedman, L.C., eds., 1989, Methods for determination of inorganic substances in water and sediments: U.S. Geological Survey Techniques of Water-Resources Investigations, book 5, chap. A1, 545 p., accessed October 3, 2024, at https://pubs.usgs.gov/twri/twri5-a1/.
Foreman, W.T., Williams, T.L., Furlong, E.T., Hemmerle, D.M., Stetson, S.J., Jha, V.K., Noriega, M.C., Decess, J.A., Reed-Parker, C., and Sandstrom, M.W., 2021, Comparison of detection limits estimated using single and multi-concentration spike-based and blank-based procedures: Talanta, v. 228, 17 p., accessed October 3, 2024, at https://doi.org/10.1016/j.talanta.2021.122139.
Garabedian, S.P., 1986, Application of a parameter-estimation technique to modeling the regional aquifer underlying the eastern Snake River Plain, Idaho: U.S. Geological Survey Water-Supply Paper 2278, 60 p., accessed October 9, 2024, at https://pubs.er.usgs.gov/publication/wsp2278.
Goerlitz, D.F., and Brown, E., 1972, Methods for analysis of organic substances in water: U.S. Geological Survey Techniques of Water-Resources Investigations, book 5, chap. A3, 40 p., accessed October 3, 2024, at https://pubs.usgs.gov/twri/05a03/report.pdf.]
Halford, K.J., Weight, W.D., and Schreiber, R.P., 2006, Interpretation of transmissivity estimates from single-well pumping aquifer tests: Ground Water, v. 44, no. 3, p. 467–471, accessed October 1, 2024, at https://doi.org/10.1111/j.1745-6584.2005.00151.x.
Keys, W.S., 1990, Borehole geophysics applied to ground-water investigations: U.S. Geological Survey Techniques of Water-Resources Investigations, book 2, chap. E2, 150 p., accessed September 3, 2024, at https://pubs.usgs.gov/twri/twri2-e2/.
Mann, L.J., 1986, Hydraulic properties of rock units and chemical quality of water for INEL-1—A 10,365-foot deep test hole drilled at the Idaho National Engineering Laboratory, Idaho: U.S. Geological Survey Water-Resources Investigations Report 86–4020 (IDO-22070), 23 p., accessed September 8, 2024, at https://doi.org/10.3133/wri864020.
McCurdy, D.E., Garbarino, J.R., and Mullin, A.H., 2008, Interpreting and reporting radiological water-quality data: U.S. Geological Survey Techniques and Methods, book 5, chap. B6, 33 p., accessed September 9, 2024, at https://pubs.usgs.gov/tm/05b06/.
National Water Quality Monitoring Council, 2024, National Water Quality Monitoring Council portal, accessed June 2024, at https://www.waterqualitydata.us/.
Nimmo, J.R., Perkins, K.S., Rose, P.E., Rousseau, J.P., Orr, B.R., Twining, B.V., and Anderson, S.R., 2002, Kilometer-scale rapid transport of naphthalene sulfonate tracer in the unsaturated zone at the Idaho National Engineering and Environmental Laboratory: Vadose Zone Journal, v. 1, no. 1, p. 89–101, accessed September 17, 2024. https://doi.org/10.2136/vzj2002.8900.
Parkhurst, D.L., and Appelo, C.A.J., 2013, Description of input and examples for PHREEQC Version 3—A computer program for speciation, batch reaction, one-dimensional transport, and inverse geochemical calculations: U.S. Geological Survey Techniques and Methods, book 6, chap. A43, 497 p., accessed September 4, 2024, at https://pubs.usgs.gov/tm/06/a43/.
Pierce, K.L., and Morgan, L.A., 1992, The track of the Yellowstone hot spot—Volcanism, faulting, and uplift, chap. 1 of Link, P.K., Kuntz, M.A., and Platt, L.B., eds., Regional geology of eastern Idaho and western Wyoming: Geological Society of America Memoir 179, p. 1–53., accessed September 11, 2024, at https://doi.org/10.1130/MEM179-p1.
Pritt, J.W., 1989, Quality assurance of sample containers and preservatives at the U.S. Geological Survey National Water Quality Laboratory, in Pederson, G.L., and Smith, M.M., comps., U.S. Geological Survey second national symposium on water quality—Abstracts of the technical sessions: U.S. Geological Survey Open-File Report 89–409, 111 p., accessed September 17, 2024, at https://pubs.er.usgs.gov/publication/ofr89409.
Rattray, G.W., 2018, Geochemistry of groundwater in the eastern Snake River Plain aquifer, Idaho National Laboratory and vicinity, eastern Idaho: U.S. Geological Survey Professional Paper 1837–A (DOE/ID-22246), 198 p., accessed September 17, 2024, at https://doi.org/10.3133/pp1837A.
Rattray, G.W., 2019, Evaluation of chemical and hydrologic processes in the eastern Snake River Plain aquifer based on results from geochemical modeling, Idaho National Laboratory, eastern Idaho: U.S. Geological Survey Professional Paper 1837–B (DOE/ID–22248), 85 p., accessed September 17, 2024, at https://doi.org/10.3133/pp1837B.
Rattray, G.W., and Paces, J.B., 2023, Evaluation of hydrologic processes in the eastern Snake River Plain aquifer using uranium and strontium isotopes, Idaho National Laboratory, eastern Idaho, with contributions by Treinen, K.C.: U.S. Geological Survey Professional Paper 1837–D (DOE/ID-22259), 65 p., accessed September 6, 2024, at https://doi.org/10.3133/pp1837D.
Rose, D.L., Sandstrom, M.W., and Murtagh, L.K., 2016, Determination of heat purgeable and ambient purgeable volatile organic compounds in water by gas chromatography/mass spectrometry: U.S. Geological Survey Techniques and Methods, book 5, chap. B12, 61 p., accessed September 17, 2024, at https://doi.org/10.3133/tm5B12.
Shervais, J.W., Vetter, S.K., and Hanan, B.B., 2006, Layered mafic sill complex beneath the eastern Snake River Plain—Evidence from cyclic geochemical variations in basalt: Geology, v. 34, no. 5, p. 365–368, accessed September 4, 2024. https://doi.org/10.1130/G22226.1.
Thatcher, L.L., Janzer, V.J., and Edwards, K.W., 1977, Methods for determination of radioactive substances in water and fluvial sediments: U.S. Geological Survey Techniques of Water-Resources Investigations, book 5, chap. A5, 95 p., accessed September 17, 2024, at https://pubs.usgs.gov/twri/twri5a5/.
Theis, C.V., 1935, The relation between the lowering of the piezometric surface and the rate and duration of discharge of a well using groundwater storage: Transactions—American Geophysical Union, v. 16, no. 2, p. 519–524, accessed October 17, 2024, at https://doi.org/10.1029/TR016i002p00519.
Theis, C.V., Brown, R.H., and Meyer, R.R., 1963, Estimating the transmissibility of aquifers from the specific capacity of wells, in Bentall, R., comp., Methods of determining permeability, transmissibility and drawdown: U.S. Geological Survey Water-Supply Paper 1536-I, p. 331–341., accessed October 17, 2027, at https://pubs.er.usgs.gov/publication/wsp1536I.
Toran, L., 1982, Isotopes in ground-water investigations: Ground Water, v. 20, no. 6, p. 740–745, accessed September 17, 2024, at https://doi.org/10.1111/j.1745-6584.1982.tb01394.x.
Trcka, A.R., and Twining, B.V., 2023a, Drilling, construction, geophysical data, and lithologic log for borehole USGS 151: U.S. Geological Survey data release., accessed September 17, 2024, at https://doi.org/10.5066/P9KOXCE5.
Trcka, A.R., and Twining, B.V., 2023b, Drilling, construction, geophysical data, and lithologic logs for borehole USGS 152: U.S. Geological Survey data release., accessed September 17, 2024, at https://doi.org/10.5066/P9Q3FR4N.
Treinen, K.C., Trcka, A.R., and Fisher, J.C., 2024, An update of hydrologic conditions and distribution of selected constituents in water, eastern Snake River aquifer and perched groundwater zones, Idaho National Laboratory, Idaho, emphasis 2019–21: U.S. Geological Survey Scientific Investigations Report 2023–5128 (DOE/ID-22261), 96 p., accessed September 4, 2024, at https://doi.org/10.3133/sir20235128.
Twining, B.V., 2016, Borehole deviation and correction factor data for selected wells in the eastern Snake River Plain aquifer at and near the Idaho National Laboratory, Idaho: U.S. Geological Survey Scientific Investigations Report 2016–5163 (DOE/ID-22241), 23 p., plus app., accessed September 17, 2024, at https://doi.org/10.3133/sir20165163.
Twining, B.V., Bartholomay, R.C., and Hodges, M.K.V., 2014, Completion summary for boreholes USGS 140 and USGS 141 near the Advanced Test Reactor Complex, Idaho National Laboratory, Idaho: U.S. Geological Survey Scientific Investigations Report 2014–5098 (DOE/ID–22229), 40 p., plus app., accessed September 17, 2024, at https://doi.org/10.3133/sir20145098.
Twining, B.V., Bartholomay, R.C., and Hodges, M.K.V., 2016, Completion summary for boreholes TAN-2271 and TAN-2272 at Test Area North, Idaho National Laboratory, Idaho: U.S. Geological Survey Scientific Investigations Report 2016-5088 (DOE/ID-22239), 37 p., plus app., accessed September 3, 2024, at https://doi.org/10.3133/sir20165088.
Twining, B.V., Bartholomay, R.C., and Hodges, M.K.V., 2018, Completion summary for borehole TAN-2312 at Test Area North, Idaho National Laboratory, Idaho: U.S. Geological Survey Scientific Investigations Report 2018-5118, DOE/ID-22247, 29 p., plus app., accessed September 3, 2024, at https://doi.org/10.3133/sir20185118.
Twining, B.V., Fisher, J.C., and Bartholomay, R.C., 2010, Completion summary for well NRF-16 near the Naval Reactors Facility, Idaho National Laboratory, Idaho: U.S. Geological Survey Scientific Investigations Report 2010–5101 (DOE/ID–22210), 36 p., accessed September 3, 2024, at https://doi.org/10.3133/sir20105101.
Twining, B.V., and Maimer, N.V., 2019, Transmissivity and geophysical data for selected wells located at and near the Idaho National Laboratory, Idaho, 2017-18: U.S. Geological Survey Scientific Investigations Report 2019–5134 (DOE/ID–22249), 30 p. plus app., accessed September 3, 2024 at https://doi.org/10.3133/sir20195134.
U.S. Environmental Protection Agency, 2022, Part141—National Primary Drinking Water Regulations: Code of Federal Regulations, title 40, part 141, accessed July 1, 2024, at https://www.ecfr.gov/current/title-40/chapter-I/subchapter-D/part-141.
U.S. Geological Survey, 1985, National water summary 1984—Hydrologic events, selected water-quality trends, and ground-water resources: U.S Geological Survey Water-Supply Paper 2275, 467 p., accessed September 3, 2024, at https://pubs.er.usgs.gov/publication/wsp2275.
U.S. Geological Survey, 2015, Changes to National Water Quality Laboratory (NWQL) procedures used to establish and verify laboratory detection and reporting limits: U.S. Geological Survey National Water Quality Laboratory Technical Memorandum 15.02, accessed September 3, 2024, at http://wwwnwql.cr.usgs.gov/rapi-notes/15-14_NWQL_TM_15-02_(DQCALC).pdf.
U.S. Geological Survey, 2019, USGS GeoLog Locator: U.S. Geological Survey web interface, accessed October 3, 2024, at https://doi.org/10.5066/F7X63KT0.
U.S. Geological Survey, 2024, USGS water data for the Nation, U.S. Geological Survey National Water Information System web interface, accessed June 19 2024, at https://waterdata.usgs.gov/nwis.
U.S. Geological Survey, variously dated, National field manual for the collection of water-quality data: U.S. Geological Survey Techniques of Water-Resources Investigations, book 9, chaps. A1–A9., accessed September 3, 2024, at http://water.usgs.gov/owq/FieldManual/.
Wershaw, R.L., Fishman, M.J., Grabbe, R.R., and Lowe, L.E., eds., 1987, Methods for the determination of organic substances in water and fluvial sediments: U.S. Geological Survey Techniques of Water-Resources Investigations, book 5, chap. A3, 80 p., accessed September 14, 2024, at https://pubs.er.usgs.gov/publication/twri05A3.
Whitehead, R.L., 1992, Geohydrologic framework of the Snake River Plain regional aquifer system, Idaho and eastern Oregon: U. S. Geological Survey Professional Paper 1408–B, 32 p., accessed July 16, 2024, at https://pubs.er.usgs.gov/publication/pp1408B.
Williams, J.H., and Johnson, C.D., 2004, Acoustic and optical borehole-wall imaging for fractured-rock aquifer studies: Journal of Applied Geophysics, v. 55, nos. 1–2, p. 151–159, accessed July 18, 2024, at https://doi.org/10.1016/j.jappgeo.2003.06.009.
Zingre, J.A., 2024, Single-well aquifer test data from wells NRF-17 and NRF-18, Idaho National Laboratory, Idaho: U.S. Geological Survey data release, accessed January 14, 2025, at https://doi.org/10.5066/P13URUXF.
Conversion Factors
U.S. customary units to International System of Units
International System of Units to U.S. customary units
Temperature in degrees Celsius (°C) may be converted to degrees Fahrenheit (°F) as follows:
°F = (1.8 × °C) + 32.
Datums
Vertical coordinate information is referenced to the North American Vertical Datum of 1988 (NAVD 88).
Horizontal coordinate information is referenced to the North American Datum of 1983 (NAD 83).
Elevation, as used in this report, refers to distance above the vertical datum.
Supplemental Information
Concentrations of chemical constituents in water are given in either milligrams per liter (mg/L) or micrograms per liter (µg/L).
Activities for radioactive constituents in water are given in picocuries per liter (pCi/L).
The standard unit for transmissivity is cubic foot per day per square foot times foot of aquifer thickness [(ft3/d)/ft2] ft. In this report, the mathematically reduced form, foot squared per day (ft2/d), is used for convenience.
Abbreviations
2H
deuterium
API
American Petroleum Institute
ATV
acoustic televiewer
ATRC
Advanced Test Reactor Complex
BLS
below land surface
CFA
Central Facilities Area
CPS
counts per second
DOE
U.S. Department of Energy
DQCALC
detection and quantitation calculation
EPA
Environmental Protection Agency
ESRP
eastern Snake River Plain
INL
Idaho National Laboratory
INTEC
Idaho Nuclear Technology and Engineering Center
MCL
maximum contaminant level
MFC
Materials and Fuels Complex
MDL
method detection limit
MRL
minimum reporting level
N
nitrogen
NRF
Naval Reactors Facility
NTU
nephelometric turbidity units
NWQL
National Water Quality Laboratory (USGS)
P
phosphorus
RESL
Radiological and Environmental Sciences Laboratory (DOE)
RSIL
Reston Stable Isotope Laboratory
RWMC
Radioactive Waste Management Complex
s
sample standard deviation
Sr-90
strontium-90
TAN
Test Area North
USGS
U.S. Geological Survey
VOC
volatile organic compound
For information about the research in this report, contact the
Director, Idaho Water Science Center
U.S. Geological Survey
230 Collins Rd
Boise, Idaho 83702-4520
https://www.usgs.gov/centers/id-water
Manuscript approved on March 04, 2025
Publishing support provided by the U.S. Geological Survey
Science Publishing Network, Tacoma Publishing Service Center
Edited by John Osias and Vanessa Ball
Layout, design, and illustration support by Luis Menoyo
Disclaimers
Any use of trade, firm, or product names is for descriptive purposes only and does not imply endorsement by the U.S. Government.
Although this information product, for the most part, is in the public domain, it also may contain copyrighted materials as noted in the text. Permission to reproduce copyrighted items must be secured from the copyright owner.
Suggested Citation
Twining, B.V., Treinen, K.C., and Zingre, J.A., 2025, Completion summary for monitor wells NRF-17 and NRF-18 at the Naval Reactors Facility, Idaho National Laboratory, Idaho: U.S. Geological Survey Scientific Investigations Report 2025–5049, 37 p., https://doi.org/10.3133/sir20255049.
ISSN: 2328-0328 (online)
Study Area
| Publication type | Report |
|---|---|
| Publication Subtype | USGS Numbered Series |
| Title | Completion summary for monitor wells NRF-17 and NRF-18 at the Naval Reactors Facility, Idaho National Laboratory, Idaho |
| Series title | Scientific Investigations Report |
| Series number | 2025-5049 |
| DOI | 10.3133/sir20255049 |
| Publication Date | July 03, 2025 |
| Year Published | 2025 |
| Language | English |
| Publisher | U.S. Geological Survey |
| Publisher location | Reston, VA |
| Contributing office(s) | Idaho Water Science Center |
| Description | Report: vii, 37 p.; Data Release |
| Country | United States |
| State | Idaho |
| Other Geospatial | Idaho National Laboratory, Naval Reactors Facility |
| Online Only (Y/N) | Y |