

Predictions of Elk, Chronic Wasting Disease Dynamics, and Socioeconomics Under Alternative D at the National Elk Refuge in Jackson, Wyoming, and Surrounding Areas
Links
- Document: Report (3.05 MB pdf) , HTML , XML
- Larger Work: This publication is Chapter F of Decision analysis in support of the National Elk Refuge bison and elk management plan
- Software Releases:
- USGS software release - Jackson bison population projections
- USGS software release - Supporting code for—Evaluating elk distribution and conflict under proposed management alternatives at the National Elk Refuge in Jackson, Wyoming (version 2.0)
- USGS software release - Software code for simulating elk and chronic wasting disease dynamics on the National Elk Refuge (version 2.0)
- USGS software release - Socioeconomic effects of bison and elk management alternatives on National Elk Refuge
- Download citation as: RIS | Dublin Core
Acknowledgments
We thank the Wyoming Game and Fish Department, U.S. Fish and Wildlife Service, U.S. Department of Agriculture, and National Park Service for sharing data in support of the analyses and providing their expertise on the wildlife subject matter team.
Abstract
This chapter presents a description and quantitative evaluation of a collaborative alternative (alternative D) focused on near-term elk population reduction and chronic wasting disease (CWD) monitoring as part of winter elk and bison feedground operations on the National Elk Refuge adjacent to Jackson, Wyoming. Alternative D was developed by the U.S. Fish and Wildlife Service, the lead agency of an Environmental Impact Statement, in consultation with cooperating agencies, including the National Park Service, U.S. Forest Service, and Wyoming Game and Fish Department. In evaluating alternative D, the U.S. Geological Survey considered four distinct scenarios that incorporated whether the agencies were able to meet their elk population reduction goals, and the effects of the U.S. Fish and Wildlife Service stopping feeding after CWD prevalence was measured at or above 7 percent in the Jackson Elk Herd Unit. The modeled scenarios in which the U.S. Fish and Wildlife Service stopped feeding elk at 7 percent CWD prevalence had higher elk population sizes and generally lower CWD prevalence overall at the end of the 20-year simulation period. Further, three of the four alternative D scenarios resulted in fewer elk-use days on sensitive aspen, willow, and cottonwood habitat types compared to continuing to feed; the 7 percent CWD trigger scenario resulted in higher elk-use days on cottonwood and willow habitats compared to continued feeding, but fewer elk-use days on aspen habitats. When considering brucellosis risk, alternative D scenarios without the 7 percent CWD stop feeding trigger had lower risk than the alternative that stopped feeding elk immediately.
Introduction
The National Elk Refuge (NER, also referred to as “the Refuge”) is in northwestern Wyoming, adjacent to the town of Jackson, and is part of the Greater Yellowstone Ecosystem. Each winter, the NER provides supplemental food to Bison bison (Linnaeus, 1758; bison) and Cervus elaphus canadensis (Erxleben, 1777; elk), as they have for at least the last century (16 U.S.C. §673, Wyoming Elk Reserve). In recent years, chronic wasting disease (CWD) in elk has been detected close to the Refuge; in 2020, elk tested positive in Grand Teton National Park, and, in 2024, at other nearby State-run feedgrounds, including Dell Creek and Horse Creek (WGFD, 2025). The spread of CWD has prompted the NER to re-evaluate its bison and elk feedground program to determine the best course of action that will minimize disease, maximize wildlife populations, and achieve other objectives important to the U.S. Fish and Wildlife Service (FWS). The U.S. Geological Survey worked closely to evaluate the range of management alternatives that were proposed by the FWS and other cooperating agencies as part of the drafting of a National Environmental Policy Act Environmental Impact Statement (FWS, 2023). The cooperating agencies included the National Park Service (NPS), the U.S. Forest Service (FS), and the Wyoming Game and Fish Department (WGFD).
Following the release of the first version of this report (Cook and Cross, 2025), discussions among FWS and cooperating agencies resulted in an additional management alternative that proposed new criteria by which to manage elk feeding operations and would attempt to minimize human-bison conflicts. The new alternative, hereafter referred to as “alternative D” to align with the FWS Environmental Impact Statement (FWS, 2023), includes a greater reliance on cooperative management among the agencies as well as modification of the conditions under which the feedground operations for elk would be stopped. This chapter evaluates the effects of alternative D on a subset of the 19 performance metrics first introduced in chapter A (Cook and others, 2025, this volume), and it considers a range of scenarios associated with the implementation of actions that are outside of the authorities of FWS and the NER.
Alternative D Description
If following alternative D, the FWS, along with the other cooperating agencies—NPS, FS, and WGFD, will work to reduce the number of elk that overwinter on the NER to about 5,000 animals, prior to stopping feeding, by increasing elk harvest opportunities. The goal is to reduce the population over 10 years under the new “Bison and Elk Management Plan,” having most of the herd reduced prior to year 8. Then, after 10 years of active elk herd reductions, the FWS will stop feeding elk on the Refuge. If, within those first 10 years, the prevalence of CWD is measured as 7 percent or higher in the Jackson Elk Herd Unit (JHU), the FWS will stop feeding elk immediately. Seven percent was selected as the threshold because previous work by Galloway and others (2021) indicated that the Jackson elk herd, mostly contained with the JHU, will decline at CWD prevalence equal to or greater than 7 percent. Regardless of the CWD prevalence, the FWS will end its supplemental feeding of elk after year 10. The NER will continue to feed bison over the next 20 years to minimize the potential of human-wildlife conflicts and maintain a minimum population of 500 bison.
Methods
General Approach
The evaluation of alternative D followed mostly the same process as the other five initial alternatives, whereby the actions described by the alternative were translated into quantitative relationships within a series of linked computer models. First, the alternative components associated with increasing harvest rates or stopping feeding in response to CWD were considered within the matrix elk population and CWD simulation model described in chapter B (herein CWD model; Cross and others, 2025, this volume). The CWD model allowed for repeat simulations of the elk population (fig. F1) and showed how the population changed over time in response to natural aging, reproduction, survival, and CWD processes, and also as a function of actions related to harvest and feedground management. The results of the simulations were used to summarize performance metrics that focused on elk population size, elk suffering, number of harvested elk, and changes in CWD prevalence (Performance metrics [PMs] 1a–c, 5a; table F4).
To model elk space-use patterns under alternative D, the raw elk counts of the number of elk with CWD were then projected onto a set of spatially explicit probabilistic maps that corresponded to monthly space use patterns for elk under conditions that matched seasonal variations in habitats and feeding operations at State and Federal feedgrounds (hereafter, spatial model; Cotterill and others, 2025, this volume, chap. C). The results from the spatial model produced metrics associated with elk use of sensitive habitats (PMs 2a–c, table F4) and private lands (PM 6a, table F4). A subset of the private lands where cattle overwinter were further used, in combination with counts of adult females, pregnancy rates, and brucellosis seroprevalences to derive a brucellosis abortion hazard for elk as a measure of risk to cattle producers (PM 6c, table F4; Cotterill and others, 2025, this volume, chap. C).
Finally, the outputs from the CWD and spatial models were used in three separate socioeconomics models to estimate metrics associated with either NER visitor counts (PM 5b, table F4) and their spending at local businesses (PM 8b, table F4), hunting revenues from elk tag sales (PM 8a, table F4) and hunting-related contributions to local economies (PM 8b, table F4), or outfitter revenues (PM 8c, table F4). Other metrics associated with FWS management costs and invasive species risk were covered in chapter A (Cook and others, 2025). We assumed that the effects to bison populations (PM 1d, table F4), human-bison conflict (PM 6b, table F4), and bison harvest (PM 9a, table F4) under alternative D would be the same as under the continue feeding alternative because alternative D continues feeding bison over the entire 20 years of evaluation. The models are written in R (version 4.4.0; R Core Team, 2024) and are available online (Cook, 2024; Cotterill and Graves, 2025; Cross, 2025; McEachran and Cook, 2024).
Modeling alternative D differed from the other alternatives in that four distinct scenarios of alternative D were considered. The variables were whether the 7 percent CWD trigger and increased elk harvest were included or not, and in what combination with other management strategies. The first scenario did not include the 7 percent CWD trigger or increased elk harvesting and assumed that elk feeding was ended after year 10. The second scenario increased elk harvesting to achieve the goal of 5,000 elk using the NER by year 8 but did not include the 7 percent CWD trigger. The third scenario included the 7 percent CWD trigger to halt elk feeding, but did not increase elk harvesting. The fourth scenario included both the CWD trigger and increased elk harvesting options. These four scenarios helped to understand the range of outcomes that might happen given the inclusion and success of these different actions.
Results are presented across two spatial scales to facilitate broad-scale and fine-scale comparisons among the alternatives. The broader spatial scale (analysis area, fig. F1) included all areas where the Jackson elk herd currently inhabit, but also those areas where they are expected to relocate under management alternatives that stop feeding. This area included the JHU and the northern part of the Fall Creek Herd Unit. The finer spatial scale was defined as the JHU and is the scale at which most elk management decisions are typically made (fig. F1).
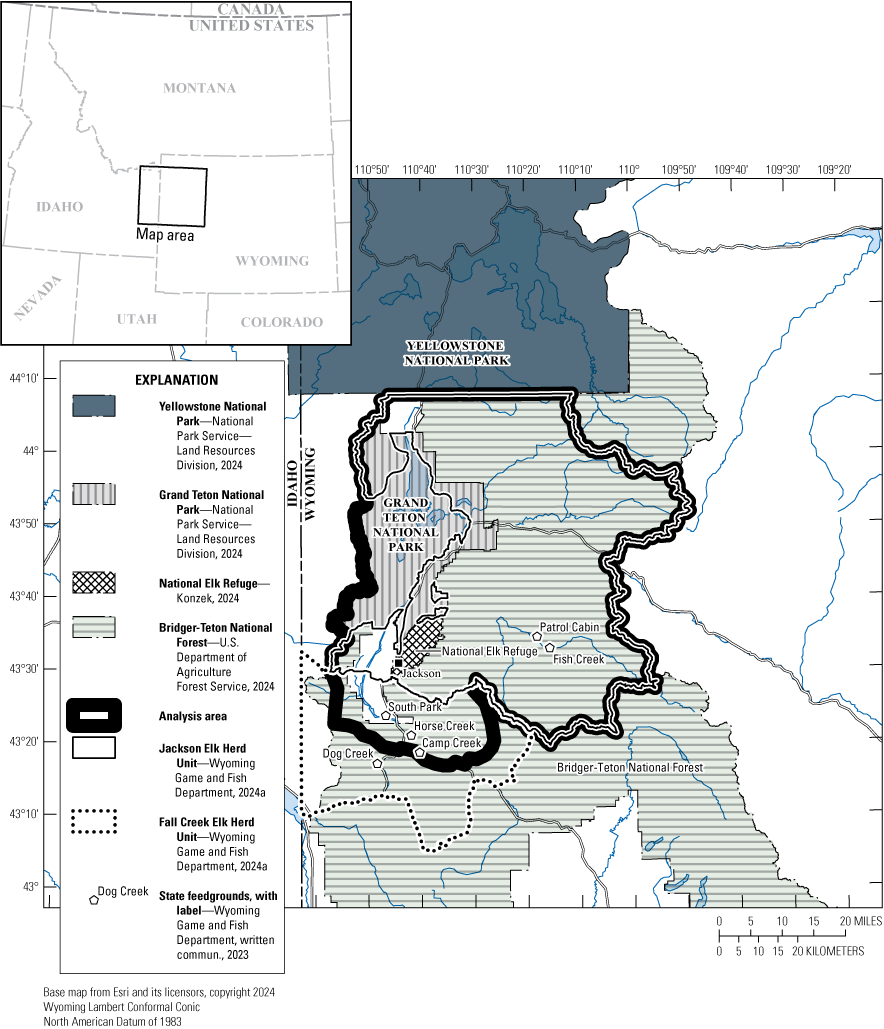
Map showing the study area. The analysis area is composed of the Jackson Elk Herd Unit, part of the Fall Herd Unit, the National Elk Refuge, and Grand Teton National Park. Also included are the locations of six State feedgrounds, Patrol Cabin, Fish Creek, South Park, Horse Creek, Camp Creek, and Dog Creek, that were considered in the analyses of this report. Modified from Cook and others, 2025, chap. A, fig. A1.
Modeling Details Under Alternative D
CWD and Elk Population Modeling
A few minor changes were required to implement alternative D in the elk and CWD model developed in chapter B (Cross and others, 2025, this volume). First, a trigger based on the CWD prevalence in the JHU was added. Similar to the 3 percent CWD prevalence trigger previously specified for the disease threshold alternative, we assumed that 400 elk were tested every November and if the CWD prevalence of that sample exceeded 7 percent, elk feeding was not conducted in subsequent years and elk redistributed themselves to other areas as modeled in Cross and others (2025, this volume, chap. B). To reduce the elk population on the NER to approximately 5,000 by year seven, the hunting rates of all sex and age classes were increased by 2.1 times from those reported in table A1 (Cook and others, 2025, this volume, chap. A). This resulted in a 14.7 percent increase in yearling and adult female elk harvested and a 16.8 percent increase of adult bulls harvested annually. Once the target number of 5,000 elk was achieved in the NER elk segment, hunting rates were reset back to baseline levels. Hunting rates declined linearly to zero when the JHU was 80 percent or less than the population objective of 11,000 elk. To evaluate the importance of the 7 percent CWD trigger and increased hunting, each scenario was evaluated with and without the 7 percent CWD trigger as well as the increased hunting, resulting in four different scenario combinations. If the CWD trigger was not reached by year 10, or if there was no 7 percent CWD trigger, supplemental feeding of elk ceased after year 10.
Elk Space-Use Modeling
The same spatial model as described in chapter C (Cotterill and others, 2025, this volume) was applied to the alternative D elk and CWD model results. As before, feed cessation at the NER triggered modifications to distributions in accordance with the same resource selection function fit to existing elk collaring data and adjusted by expert-elicited predictions. Under the 7 percent CWD trigger, temporal variations in seasonal landscape use by elk were accommodated across the full range of simulated outcomes from the CWD model. To determine when the switch between elk distribution under feedground operations and feedground closure happened, annual CWD prevalence estimates from Cross and others (2025, this volume, chap. B) were used.
Socioeconomics Modeling
The same three socioeconomics models were implemented to estimate NER visitation, non-hunting and hunting-related economic expenditures, elk harvest tag sales, and outfitter revenues (McEachran and others, 2025, this volume, chap. E) under alternative D. As a result, findings presented for alternative D in this chapter reflect the same approaches as previously described in McEachran and others (2025, this volume, chap. E).
Results
CWD and Elk Population Size
The inclusion of the 7 percent CWD trigger resulted in a lower overall CWD prevalence over the 20 years (table F1). At year 10, if there were no increased hunting and no CWD trigger, the CWD prevalence in the JHU averaged 38 percent (standard deviation [SD]=9.7 percent) before declining back to 25 percent (SD=8.6 percent) by year 20 (fig. F2). In contrast, when there were both increased hunting and a CWD trigger, the CWD prevalence by year 10 in the JHU was, on average, 22 percent (SD=7.5 percent) and, by year 20, reached a CWD prevalence of 26 percent (SD=10 percent). Including the CWD trigger also resulted in fewer winter CWD mortalities over the 20 years compared with when a 7 percent CWD trigger was not included in the alternative. At the spatial extent defined by the full analysis area, we found similar trends as in the JHU with lower CWD prevalence under scenarios of alternative D that included the 7 percent CWD trigger (table F1). All scenarios of alternative D had lower CWD prevalence compared to the alternative that continued elk feeding for 20 years (table F1).
The alternative D scenario with the 7 percent CWD trigger resulted in a larger elk population size by year 20 compared with an alternative D with no 7 percent CWD trigger (table F1). Alternative D without the CWD trigger resulted in a Jackson elk herd population size at year 20 of 4,421 (SD=1,278) without an increase in hunting or 4,754 (SD=1,461) with an increase in hunting (table F1, fig. F1). In contrast, the inclusion of a CWD trigger and an increase in hunting resulted in a Jackson elk herd population size of 6,143 (SD=1,791) by year 20. An alternative D with a CWD trigger and an increase in hunting resulted in a higher elk population size by year 20 and a lower CWD prevalence than the continued feeding alternative (table F1). At the spatial extent defined by the full analysis area, we found similar trends as in the JHU with larger elk populations under scenarios that included the CWD trigger (table F1). The scenarios of alternative D that had no CWD trigger had lower elk population sizes compared to the alternative that continued feeding for 20 years, whereas alternative D scenarios with the CWD trigger had larger population sizes at year 20 (table F1).
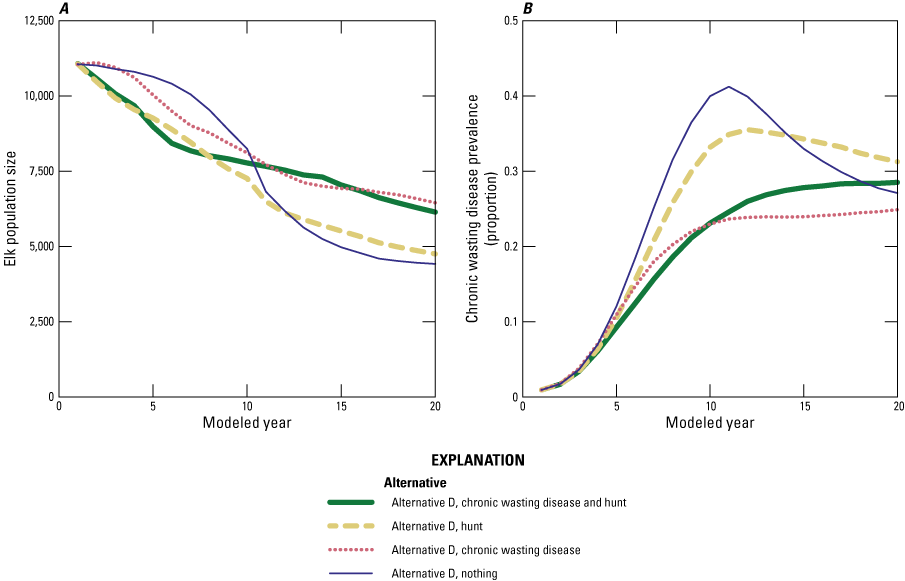
Graphs showing the performance of metrics for the Jackson elk population size and CWD prevalence under the four scenarios developed for alternative D, including the alternative with and without elk reductions caused by increased harvest and with and without a 7 percent CWD trigger. A, elk population size. B, CWD prevalence.
The alternative D scenarios that focus on increasing initial hunting rates resulted in more cumulative elk harvested over the 20-year timeframe (11,041 [SD=1,970] elk harvested with CWD trigger and increased hunting compared to 9,845 [SD = 2,068] harvested with a CWD trigger but no increase in hunting). The increased hunting rates led to more animals harvested at the full analysis area, having 14,752 (SD=2,260) elk hunted over 20 years with the CWD trigger and increased harvest compared to 13,573 (SD=2,453) with the trigger but without increased harvest (table F1).
Table F1.
Summary of elk and chronic wasting disease performance metrics as modeled for the Jackson Elk Herd Unit and analysis area in western Wyoming.[CWD, chronic wasting disease; SD, standard deviation; JHU, Jackson Elk Herd Unit; Alt D, alternative D]
Elk Use of Sensitive Habitats and Private Lands
In general, all four scenarios of alternative D resulted in fewer elk-use days on sensitive aspen, willow, and cottonwood habitat types on and adjacent to the Refuge compared to the continue feeding alternative (table F2). The exceptions for lower elk use were for cottonwood and willow under the alternative D scenario that included the 7 percent CWD trigger but not increased hunting, and willow under the alternative D scenario that included both the 7 percent trigger and had increased hunting (table F2). The scenario without the 7 percent CWD trigger, but with increased hunting, tended to perform the best across all metrics associated with elk use of sensitive habitats among the four scenarios of alternative D. Elk use of private lands and brucellosis risk to livestock was lower than the continue feeding alternative under alternative D scenarios without the 7 percent CWD trigger and higher under the two scenarios with the CWD trigger (table F2).
Table F2.
Summary of elk use of sensitive habitats, private lands, and elk abortions on private lands for the analysis area in western Wyoming.[SD, standard deviation; Alt D, alternative D; CWD, chronic wasting disease]
Socioeconomic Effects
The two alternative D scenarios without increased harvest showed similar cumulative revenues from elk harvest tags, hunting-related expenditures, and outfitter revenues compared to the continue feeding alternative over the 20-year period (table F3). These patterns result from the increased number of elk harvested under the alternative scenarios with increased harvest rates (table F1). In contrast, the alternative D scenarios with increased harvest had higher harvest-tag revenues, hunting-related expenditures, and outfitter revenues than the continue feeding alternative over the 20-year period (table F3).
Table F3.
Summary of 20-year cumulative revenues for elk harvest tag sales, hunting-related expenditures, and outfitters for the analysis area in western Wyoming.[SD, standard deviation; Alt D, alternative D; CWD, chronic wasting disease]
Tradeoffs Among Alternatives
The full suite of nineteen performance metrics can be found in table F4. No single alternative or scenario among continued feeding, no feeding, and the four alternative D scenarios performed the best on all metrics simultaneously. Notably, there is a consistent tradeoff whereby stopping feeding earlier results in lower CWD prevalence and higher elk population sizes after 20 years but produces higher elk use of private lands. The no feeding alternative results in one of the lowest estimates of CWD in elk and the largest elk population in year 20; however, that same alternative resulted in high elk use of private lands and sensitive habitats. Under the no feeding alternative, the bison population was lower, human-bison conflicts increased, and the estimated bison harvest was lower (table F4). In contrast, continuing to feed elk resulted in higher CWD prevalence in elk and lower elk population size in year 20, but less use of private lands, and some sensitive habitats, particularly willow. For bison, continued feeding resulted in more bison, fewer human-bison conflicts, and more estimated harvest (table F4).
Table F4.
Consequence table showing the performance metrics and alternatives. Modified from Cook and others, 2025, this volume, chap. A, Table A2.[Refer to Cook and others, 2025, this volume, chap. A, Table A1 for full performance metric details. Measures for 1a–c were rounded to two significant figures. Fundamental objective four was raised as important by NER managers (in alignment with FWS and NPS, 2007); however, subject matter experts from the FWS, NPS, FS, and WGFD expected that the effects of bison and elk on the chemical, physical, and biological properties of water resources at the Refuge would be the same under all alternatives. Therefore, this objective was not considered further. Alt D, alternative D; CWD, chronic wasting disease; SD, standard deviation; min., minimum; max., maximum]
Discussion
Scenarios with and without increased harvest and a 7 percent CWD trigger in alternative D resulted in predictions mostly consistent with other analyses in this report. These findings highlight the tradeoff between strategies that limit disease but maintain larger population sizes, and those that reduce human-wildlife conflicts but have higher CWD prevalence. For example, tradeoffs are apparent when considering continuing to feed elk for 20 years or stopping feeding immediately. Continuing to feed is predicted to lead to relatively high CWD prevalence and lower elk population size for the analysis area, but consistently performed better on metrics associated with elk use of private lands and sensitive habitats, compared to no feeding (table F4). The other alternatives or scenarios that stop feeding after several years, while elk populations are reduced by harvest (for example, alternative D with increased harvest), mitigate some of the negative effects on private lands associated with stopping feeding immediately, while also leading to increased harvest opportunities and economic revenues associated with hunting.
Under all scenarios for alternative D, the elk population in the JHU is predicted to decline by 42–60 percent, based on the lowest elk population size at year 20 of 4,400 individuals (alternative D without the 7 percent CWD trigger or increased harvest) and largest elk population size of 6,400 individuals under alternative D without hunting and the 7 percent CWD trigger (table F1). These declines result from the following two primary drivers: elevated disease-associated mortality and lowered elk survival without winter feeding. For disease, alternative D with the 7 percent CWD trigger performed similarly to stopping feeding immediately and the previously analyzed 3 percent CWD trigger alternative (25 percent CWD prevalence in year 20 under alternative D after stopping feeding at 7 percent as opposed to 26 percent CWD prevalence in year 20 under the no feeding and 3 percent disease threshold alternatives). In contrast, alternative D without the 7 percent CWD trigger and hunting led to a 38 percent spike of CWD around year 20 before declining to a level fairly comparable to the other alternative D scenarios.
Although there remains substantial uncertainty about the precise dynamics of CWD in supplementally fed and unfed elk in the JHU and whether disease transmission rates for fed elk might be as high as predicted in Cook and others (2023), CWD has a high prevalence in certain settings. Previous studies found CWD prevalence in excess of 60 percent in captive settings (Peters and others, 2000; Williams and others, 2014). Estimates in free-ranging elk have been generally lower; however, Wind Cave National Park is estimated to have the highest prevalence in elk at 29 percent (Sargeant and others, 2021).
Conclusion
The decision on whether and how to feed elk and bison on the NER is a complex one that has embedded tradeoffs when trying to maintain large populations of elk with limited human-elk conflict and abundant opportunities to hunt and view elk, while also minimizing the potential for disease to spread within animals in high-density feeding conditions. Increased harvest rates prior to closing feedgrounds may help alleviate some of the challenges associated with elk on private lands. Still, no alternative or scenario can maximize the achievement of all objectives simultaneously. This chapter provides updated analysis and estimates for alternative D compared to the previous set of five alternatives and further enhances the set of strategies available for FWS and cooperating agencies to navigate the difficult tradeoffs and develop the next Bison and Elk Management Plan.
References Cited
Cook, J.D., 2024, Jackson bison population projections: U.S. Geological Survey software release, https://doi.org/10.5066/P1QZGZSN.
Cook, J.D., Cotterill, G.G., McEachran, M.C., Graves, T.A., Cole, E.K., and Cross, P.C., 2025, Decision framing overview and performance of management alternatives for bison and elk feedground management on the National Elk Refuge in Jackson, Wyoming, chap. A of Decision analysis in support of the National Elk Refuge bison and elk management plan: U.S. Geological Survey Scientific Investigations Report 2025–5076, 19 p., https://doi.org/10.3133/sir20255076A. [Supersedes USGS Scientific Investigation Report 2024–5119.]
Cook, J.D., and Cross, P.C., eds., 2025, Decision analysis in support of the National Elk Refuge bison and elk management plan: U.S. Geological Survey Scientific Investigations Report 2024–5119, 6 chap. (A–F), variously paged, https://doi.org/10.3133/sir20255076. [Supersedes USGS Scientific Investigation Report 2024–5119.]
Cook, J.D., Cross, P.C., Tomaszewski, E.M., Cole, E.K., Campbell Grant, E.H., Wilder, J.M., and Runge, M.C., 2023, Evaluating management alternatives for Wyoming Elk feedgrounds in consideration of chronic wasting disease (ver. 2.0, November 2023): U.S. Geological Survey Open-File Report 2023–1015, 50 p., accessed April 11, 2024, at https://doi.org/10.3133/ofr20231015.
Cotterill, G.G. and Graves, T.A., 2025, Supporting code for—Evaluating elk distribution and conflict under proposed management alternatives at the National Elk Refuge in Jackson, Wyoming (version 2.0): U.S. Geological Survey software release, https://doi.org/10.5066/P1486NQE.
Cotterill, G.G., Cross, P.C., Cole, E.K., Cook, J.D., McEachran, M.C., and Graves, T.A., 2025, Evaluating elk space-use and conflict under proposed management alternatives at the National Elk Refuge in Jackson, Wyoming, chap. C of Decision analysis in support of the National Elk Refuge bison and elk management plan: U.S. Geological Survey Scientific Investigations Report 2025–5076, 32 p., https://doi.org/10.3133/sir20255076C. [Supersedes USGS Scientific Investigation Report 2024–5119.]
Cross, P.C., 2025, Software code for simulating elk and chronic wasting disease dynamics on the National Elk Refuge (version 2.0). U.S. Geological Survey software release, https://doi.org/10.5066/P13PPHA9.
Cross, P.C., Cook, J.D., and Cole, E.K., 2025, Predictions of elk and chronic wasting disease dynamics at the National Elk Refuge and surrounding areas in Jackson, Wyoming, chap. B of Decision analysis in support of the National Elk Refuge: U.S. Geological Survey Scientific Investigations Report 2025–5076, 22 p., https://doi.org/10.3133/sir20255076B. [Supersedes USGS Scientific Investigations Report 2024–5119.]
Galloway, N.L., Monello, R.J., Brimeyer, D., Cole, E.K., and Hobbs, N.T., 2021, Supporting adaptive management with ecological forecasting—Chronic wasting disease in the Jackson Elk Herd: Ecosphere, v. 12, no. 10, p. e03776, accessed April 30, 2024, at https://doi.org/10.1002/ecs2.3776.
McEachran, M.C., and Cook, J.D., 2024, Socioeconomic effects of bison and elk management alternatives on National Elk Refuge: U.S. Geological Survey software release, https://doi.org/10.5066/P1DZS7MW.
McEachran, M.C., Don Carlos, A., Cotterill, G.G., Cole, E.K., and Cook, J.D., 2025, Evaluating elk space-use and conflict under proposed management alternatives at the National Elk Refuge, chap. E of Decision analysis in support of the National Elk Refuge: U.S. Geological Survey Scientific Investigations Report 2025–5076, 11 p., https://doi.org/10.3133/sir20255076E. [Supersedes USGS Scientific Investigations Report 2024–5119.]
Peters, J., Miller, J.M., Jenny, A.L., Peterson, T.L., and Carmichael, K.P., 2000, Immunohistochemical diagnosis of chronic wasting disease in preclinically affected elk from a captive herd: Journal of Veterinary Diagnostic Investigation, v. 12, no. 6, p. 579–582, accessed October 5, 2024, at https://doi.org/10.1177/104063870001200618.
R Core Team, 2024, R: A Language and Environment for Statistical Computing: Vienna, Austria, R Foundation for Statistical Computing, version 4.3.3 accessed May 17, 2024, at https://www.r-project.org/.
Sargeant, G.A., Wild, M.A., Schroeder, G.M., Powers, J.G., and Galloway, N.L., 2021, Spatial network clustering reveals elk population structure and local variation in prevalence of chronic wasting disease: Ecosphere, v. 12, no. 12, 16 p., accessed October 4, 2024, at https://doi.org/10.1002/ecs2.3781.
U.S. Fish and Wildlife Service [FWS], 2023, Intent to prepare an updated bison and elk management plan for the National Elk Refuge in Wyoming—Environmental impact statement [notice of intent; announcement of public meetings; requests for comments]: Federal Register, v. 88, no. 146, p. 50168, accessed May 15, 2024, at https://www.govinfo.gov/content/pkg/FR-2023-08-01/pdf/2023-16378.pdf.
Williams, A.L., Kreeger, T.J., and Schumaker, B.A., 2014, Chronic wasting disease model of genetic selection favoring prolonged survival in Rocky Mountain elk (Cervus elaphus): Ecosphere, vol. 5, no. 5, 10 p., accessed October 3, 2024, at https://doi.org/10.1890/ES14-00013.1.
Wyoming Game and Fish Department [WGFD], 2025, 2024 Chronic wasting disease surveillance report: Wyoming Game and Fish Department, 9 p., accessed May 29, 2025, at https://wgfd.wyo.gov/sites/default/files/2025-04/2024%20CWD%20Surveillance%20Report%20final.pdf.
For more information concerning the research in this report, contact:
Center Director, USGS Eastern Ecological Science Center
U.S. Geological Survey
12100 Beech Forest Rd., Ste 4039
Laurel, MD 20708-4039
Or visit the Eastern Ecological Science Center website at
https://www.usgs.gov/centers/eesc
Publishing support provided by the Baltimore Publishing Service Center.
Disclaimers
Any use of trade, firm, or product names is for descriptive purposes only and does not imply endorsement by the U.S. Government.
Although this information product, for the most part, is in the public domain, it also may contain copyrighted materials as noted in the text. Permission to reproduce copyrighted items must be secured from the copyright owner.
Suggested Citation
Cook, J.D., Cotterill, G.G., Cole, E.K., and Cross, P.C., 2025, Predictions of Elk, Chronic Wasting Disease Dynamics, and Socioeconomics Under Alternative D at the National Elk Refuge in Jackson, Wyoming, and Surrounding Areas, chap. F of Cook, J.D., and Cross, P.C., eds., Decision Analysis in Support of the National Elk Refuge Bison and Elk Management Plan: U.S. Geological Survey Scientific Investigations Report 2025–5076, 9 p., https://doi.org/10.3133/sir20255076F.
ISSN: 2328-0328 (online)
Study Area
| Publication type | Report |
|---|---|
| Publication Subtype | USGS Numbered Series |
| Title | Predictions of elk, chronic wasting disease dynamics, and socioeconomics under alternative D at the National Elk Refuge in Jackson, Wyoming, and surrounding areas |
| Series title | Scientific Investigations Report |
| Series number | 2025-5076 |
| Chapter | F |
| DOI | 10.3133/sir20255076F |
| Publication Date | August 14, 2025 |
| Year Published | 2025 |
| Language | English |
| Publisher | U.S. Geological Survey |
| Publisher location | Reston, VA |
| Contributing office(s) | Eastern Ecological Science Center |
| Description | Report: vi, 9 p.; 4 Software Releases |
| Larger Work Type | Report |
| Larger Work Subtype | USGS Numbered Series |
| Larger Work Title | Decision analysis in support of the National Elk Refuge Bison and Elk Management Plan |
| Country | United States |
| State | Wyoming |
| Other Geospatial | National Elk Refuge |
| Online Only (Y/N) | Y |
| Additional Online Files (Y/N) | N |