

Potentiometric Surface Maps and Groundwater-Level Hydrographs for Confined Aquifers of the New Jersey Coastal Plain, 2018
Links
- Document: Report (5.31 MB pdf) , HTML , XML
- Plate: Plates 1–9 (69.4 MB pdf)
- Data Release: USGS data release - Geospatial data representing wells open to, and 2018 potentiometric surface contours of, the confined aquifers of the New Jersey Coastal Plain
- NGMDB Index Page: National Geologic Map Database Index Page
- Download citation as: RIS | Dublin Core
Acknowledgments
The New Jersey Department of Environmental Protection provided funding in support of this project. The authors appreciate the assistance of several New Jersey public supply water purveyors who provided access to their wells and modified their schedules to stop pumping from wells to allow representative measurements. Numerous owners of agricultural, commercial, domestic, industrial, institutional, and observation wells are gratefully acknowledged for allowing access to their wells. Several U.S. Geological Survey colleagues in the New Jersey Water Science Center expended time, energy, and enthusiasm in collecting, processing and approving groundwater levels and providing reviews of this manuscript for which the authors are very thankful.
Abstract
The U.S. Geological Survey, in cooperation with the New Jersey Department of Environmental Protection (NJDEP), prepared potentiometric surface maps for 10 confined aquifers of the New Jersey Coastal Plain physiographic province based on water-level measurements collected during late 2018 and early 2019 from 951 wells in New Jersey and parts of Pennsylvania and Delaware. Maps were prepared for the confined Cohansey aquifer, Rio Grande water-bearing zone, Atlantic City 800-foot sand, Piney Point aquifer, Vincentown aquifer, Wenonah-Mount Laurel aquifer, Englishtown aquifer system, and the upper, middle, and lower aquifers of the Potomac-Raritan-Magothy aquifer system.
Potentiometric surface maps indicate regional cones of depression in the following aquifers and the counties in which they are centered: Atlantic City 800-foot sand in Atlantic County, the Piney Point aquifer in Cumberland County, the Wenonah-Mount Laurel aquifer and Englishtown aquifer system in Monmouth and Ocean Counties, the Wenonah-Mount Laurel aquifer in Camden and Gloucester County, the upper aquifer of the Potomac-Raritan-Magothy aquifer system in Ocean County, and the upper, middle, and lower aquifers of the Potomac-Raritan-Magothy aquifer system in Camden County. Cones of depression with smaller areal extents were in the confined Cohansey aquifer, the Rio Grande water-bearing zone, the Atlantic City 800-foot sand centered in Cape May County, the Piney Point aquifer centered in Ocean County, the Wenonah-Mount Laurel aquifer in Salem and Burlington Counties, the Englishtown aquifer system in Camden County, the upper aquifer of the Potomac-Raritan-Magothy aquifer system in Monmouth County, and the middle aquifer of the Potomac-Raritan-Magothy aquifer system in Monmouth, Ocean, and Salem Counties. No cone of depression was interpreted in the Vincentown aquifer.
Long-term hydrographs are presented for 75 wells spanning each of the 10 confined aquifers, and contain a mix of discrete water-level measurements and daily mean water levels based on continuously recorded 15-minute data. Changes of water levels during 2014–19, as indicated by the hydrographs, were compared with those of previous periods to assess any departures from historical data. During 2014–19, water levels were stable and fluctuated within similar ranges as previous periods in the following aquifers and locations: all wells in the confined Cohansey aquifer, the Rio Grande water-bearing zone, the Vincentown aquifer, the Englishtown aquifer system, the Piney Point aquifer wells in Burlington and Ocean Counties, six of eight wells in the Wenonah-Mount Laurel aquifer, all wells in the upper and lower aquifers of the Potomac-Raritan-Magothy aquifer system outside NJDEP Critical Areas, and all wells in the middle aquifer of the Potomac-Raritan-Magothy aquifer system except those within NJDEP Critical Area II. Increasing water levels in 2014–19, ongoing since historical periods, were indicated in the following aquifers and locations: Atlantic County wells in the Piney Point aquifer, all wells in the upper and lower aquifers of the Potomac-Raritan-Magothy aquifer system outside NJDEP Critical Areas, and all wells in the middle aquifer of the Potomac-Raritan-Magothy aquifer system within NJDEP Critical Area II. Water levels in the Atlantic City 800-foot sand also increased during 2014–19 in wells in Atlantic County and northern Cape May County closer to the center of the cone of depression in that aquifer, which is a response unique to this period and absent from previous periods. During 2013–19, continued decreasing water levels, ongoing since previous periods, were indicated by hydrographs of Atlantic City 800-foot sand wells in southern Cape May County, Piney Point aquifer wells in Cumberland County where the regional cone of depression is located, and two wells in the Wenonah-Mount Laurel aquifer—070478, which in 2014–19 departed from previous periods, and 330020, which continued a gradual decrease throughout its period of record.
Introduction
The Coastal Plain aquifers of New Jersey provide water to about 4.2 million people living in 11 counties that comprise the southern three-fifths of the State (U.S. Census Bureau, 2023). Groundwater withdrawals from confined and unconfined aquifers of the Coastal Plain increased from 50 million gallons per day (Mgal/d) in 1918 to more than 350 Mgal/d in 1980 to support the growing population of the region during that timespan (Zapecza and others, 1987), causing groundwater levels to decline and regional cones of depression to deepen the potentiometric surface of numerous confined aquifers. The groundwater withdrawals caused reversals of hydraulic gradients that induced the flow of brackish or saline water from salty surface water bodies and adjacent aquifers in certain areas (Gordon and others, 2021).
Management of groundwater resources by the New Jersey Department of Environmental Protection (NJDEP) led the agency in 1985 and 1993 to legislate restrictions on groundwater withdrawals from two Critical Water-Supply Areas (Critical Area I and Critical Area II) of the Coastal Plain (fig. 1) and supplement the reduced groundwater withdrawal with an increase withdrawal from surface water sources (New Jersey Administrative Code, 2023). By 2018, withdrawals from the 10 confined aquifers of the Coastal Plain totaled approximately 188 Mgal/d. In Critical Area I, groundwater withdrawal limits are placed on the Wenonah-Mount Laurel aquifer, Englishtown aquifer system, and the Potomac-Raritan-Magothy aquifer system. In Critical Area II, groundwater withdrawal limits are placed on only the Potomac-Raritan-Magothy aquifer system. The Critical Area groundwater management strategies have resulted in water-level recoveries of the regulated aquifers (Spitz and DePaul, 2008; Spitz and others, 2008).
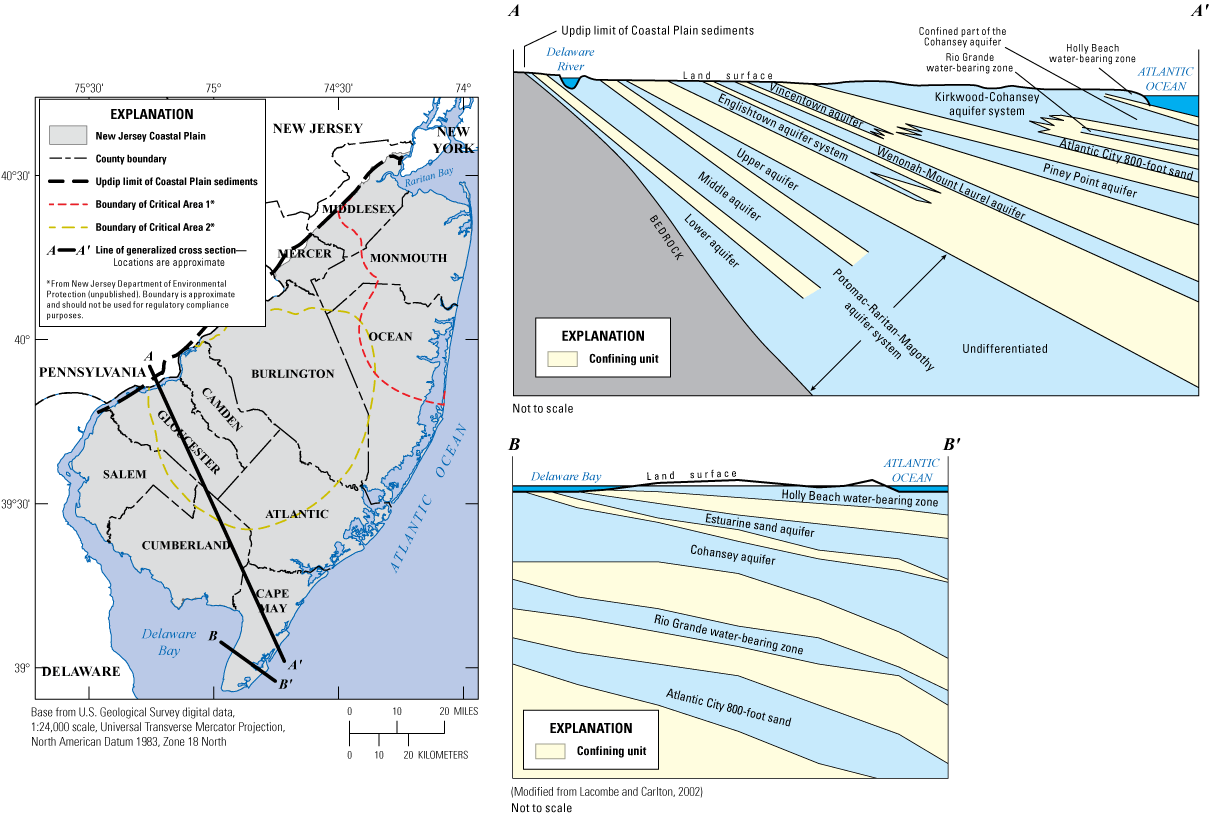
Map showing the location of study area, a generalized hydrogeologic section A–A’ through the Coastal Plain of southern New Jersey, and a generalized hydrogeologic section B–B’ through southern Cape May County, New Jersey. Modified from Gordon and others (2021).
Purpose and Scope
The U.S. Geological Survey (USGS), in cooperation with the NJDEP, measured the water-level altitudes of 930 wells in New Jersey to evaluate groundwater conditions in 10 confined aquifers of the New Jersey Coastal Plain physiographic province in late 2018 through early 2019. In addition, 3 wells were measured by USGS personnel in Pennsylvania, and water levels from 18 wells in Delaware were obtained from the Delaware Geological Survey (Delaware Geological Survey, 2020). These groundwater-level measurements were used to interpolate potentiometric surfaces and create potentiometric surface maps for the confined Cohansey aquifer, the Rio Grande water-bearing zone, the Atlantic City 800-foot sand, the Piney Point aquifer, the Vincentown aquifer, the Wenonah-Mount Laurel aquifer, the Englishtown aquifer system, and the upper, middle, and lower aquifers of the Potomac-Raritan-Magothy aquifer system. The Old Bridge aquifer and Farrington aquifer of Middlesex and Monmouth Counties are included with the upper and middle aquifers of the Potomac-Raritan-Magothy aquifer system, respectively. Wells screened in the undifferentiated zones of the Potomac-Raritan-Magothy aquifer system are included with the middle Potomac-Raritan-Magothy aquifer system. Previous potentiometric surface maps in this series present water levels in the study area at 5-year intervals from 1978 through 2013 (table 1). Water-level changes over time for each confined aquifer are presented with hydrographs of water levels collected from 75 observation wells containing a mix of continuously recorded and discrete groundwater levels.
This study provides an updated, large-scale snapshot of the configuration of the potentiometric surface in each confined aquifer. Information provided in this study and comparison to prior assessments of the groundwater resources can support water resource managers’ decisions to better sustain the groundwater supply of this region and ensure it is protected for future use.
Table 1.
References for U.S. Geological Survey potentiometric surface maps of confined aquifers of the New Jersey Coastal Plain.| Measurement year | Reference |
|---|---|
| 1978 | Walker (1983) |
| 1983 | Eckel and Walker (1986) |
| 1988 | Rosman and others (1995) |
| 1993 | Lacombe and Rosman (1997) |
| 1998 | Lacombe and Rosman (2001) |
| 2003 | DePaul and others (2009) |
| 2008 | DePaul and Rosman (2015) |
| 2013 | Gordon and others (2021) |
| 2018 | This report |
Description of the Study Area
The study area encompasses the Coastal Plain physiographic province of New Jersey and eastern Pennsylvania and parts of the Coastal Plain in Delaware (fig. 1). The study area covers approximately 5,400 square miles and is bounded on the northwest by the updip limit of the Coastal Plain, also known as the Fall Line, which separates the unconsolidated sediments of the Coastal Plain from the rocks of the Piedmont physiographic province. This investigation includes the counties of Atlantic, Burlington, Camden, Cape May, Cumberland, Gloucester, Monmouth, Ocean, and Salem and parts of Mercer and Middlesex Counties in New Jersey, parts of Kent and New Castle Counties in Delaware, and part of Philadelphia County in Pennsylvania.
The hydrogeologic units of the Coastal Plain have been described in detail at the regional level by Zapecza (1989) and Sugarman and others (2005). County-level aquifer maps are available by Sugarman and Monteverde (2008) and Sugarman and others (2016; 2018; 2019; 2020; and 2022). The hydrogeology of Delaware is described in Vroblesky and Fleck (1991). A columnar section of geologic and hydrogeologic units of the Coastal Plain in New Jersey and Delaware, highlighting the stratigraphic sequence of the confined aquifers investigated, is provided in figure 2.
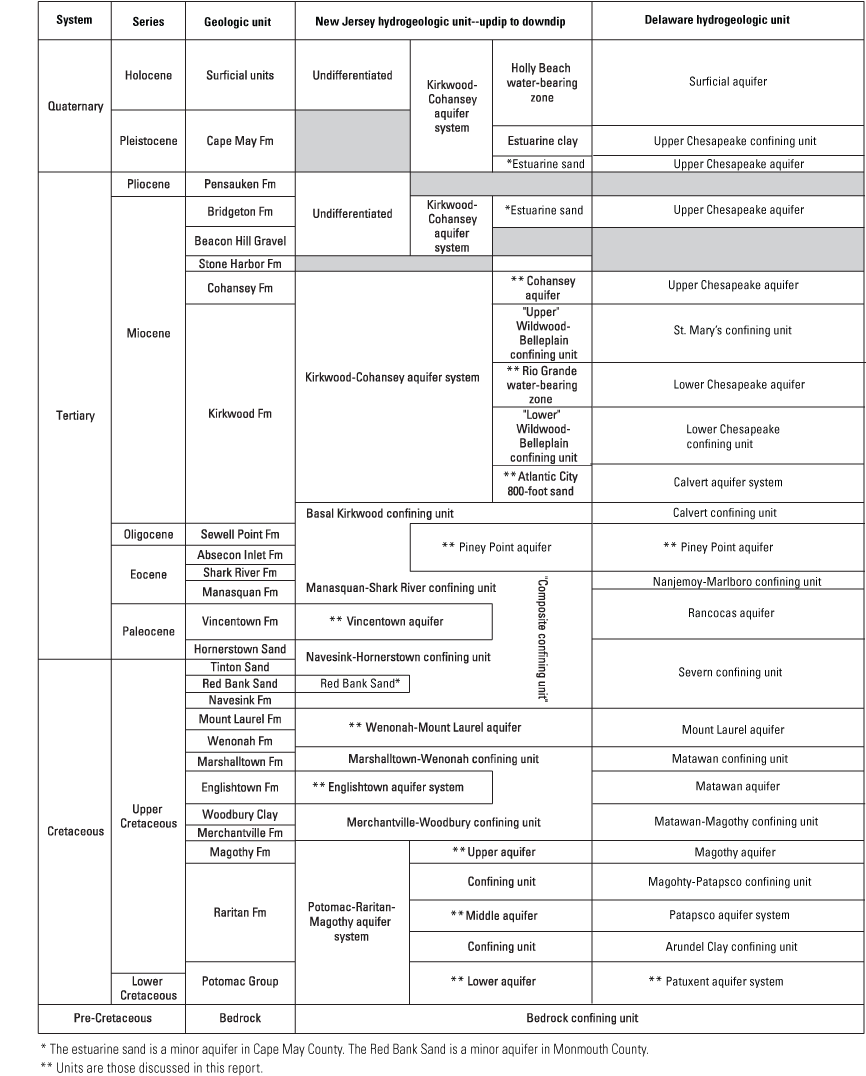
Stratigraphic columnar section showing hydrogeologic units and formations (Fm) for the New Jersey Coastal Plain and Delaware Coastal Plain. Modified from Kauffman (2024) and Gordon and Carleton (2023).
Well-Numbering System
In this report, wells are listed by a unique USGS identification number (Fiore and others, 2025). For wells in New Jersey, the well-numbering system is a 6-digit number consisting of an odd-numbered county code followed by a sequence number for wells within that county. For example, well number 150123 is the 123rd well inventoried in Gloucester County (15). For Pennsylvania, the well-numbering system consists of a P, followed by a sequence number for the well. For wells in Delaware, identifiers are assigned by the Delaware Geological Survey and are numbered based on a coordinate system using 7.5-minute quadrangles of latitude and longitude. County codes for New Jersey are listed in table 2.
Data Collection and Analysis
Water-Level Measurements
Static groundwater levels were measured in 951 wells primarily from mid-October through December 2018 after peak withdrawals during the summer months had lessened. Data collection was interrupted for a 5-week period from late December 2018 through January 2019. At approximately 10 percent of wells, groundwater level measurements were collected between February and the first week of April 2019.
The depth to water in each well was measured in accordance with methods described in Cunningham and Schalk (2011). Collected water-level measurements are available in the National Water Information System (NWIS) database (U.S. Geological Survey, 2022) and are compiled in a companion data release (Fiore and others, 2025). Most production wells (public supply, domestic, industrial, institution, agricultural) were pumped at different intervals during the study period. Water-level measurements were taken when the well pump was off for at least 24 hours for public-supply and other higher-capacity wells with high withdrawal volumes, and at least 2 hours for lower-capacity well types such as domestic wells to obtain a water-level measurement that approximated static conditions. To ensure accurate measurements and that water levels were not recovering, two or more water-level measurements were made at each well while the well was not pumping. Water levels were assumed to be static when at least two values were within 0.05 feet (ft) in a span of at least 5 minutes. Precedent withdrawal rates and pumping status of nearby wells were not always known and, in some instances, may have affected the representativeness of the water-level data, even if they met these criteria. Water-level altitudes were calculated by subtracting the water-level measurement made at each well from the land-surface elevation stored in NWIS for that well, referenced to the North American Vertical Datum of 1988 (NAVD 88).
Groundwater from four observation wells (110137, 250568, 250771, and 330841) measured in this study has been sampled periodically and has chloride concentrations greater than 2,500 milligrams per liter (mg/L). Therefore, the water levels in these wells were converted from a measured saltwater hydraulic head to a calculated freshwater head following a modification of the Ghyben-Herzberg relation (Todd, 1980) to determine the equivalent length of freshwater in a well filled with saltwater:
wherelf
is the length of the freshwater column in the well casing,
ρs
is the density of saltwater,
ρf
is the density of freshwater, and
ls
is the length of the saltwater column in the well casing.
The density of freshwater is 1.00 gram per cubic centimeter, and this density increases with increasing solute concentrations. The freshwater equivalent water levels were used to contour the potentiometric surfaces; the measured water levels and freshwater equivalents for these wells are provided in Fiore and others (2025).
Potentiometric Surface Maps
Water-level data were exported from NWIS and imported into a geographic information system using Esri ArcGIS Pro software (Redlands, Calif.) as a point feature class. The ArcGIS Pro geoprocessing tool “Topo to Raster” was used to create a series of raster surfaces, each one representing the water-level altitude of an individual aquifer (Esri, 2023) from 2018 to 2019 groundwater level measurements. Potentiometric surface contours of each aquifer were derived from the corresponding altitude raster using the “Contouring” tool (Esri, 2023). Contours were then manually readjusted within ArcGISPro to ensure they represented hydrologically realistic surfaces for confined aquifers, because this interpolation method affects the reliability of individual isolines and their portrayal of slope, peaks, and depressions, especially for groundwater applications.
Boundaries of potentiometric surface interpolation were created for each aquifer based upon the geographic extent of wells screened in the subject aquifer with a recorded water-level measurement in 2018–19. Boundaries of the extent of confinement beneath the land surface of each aquifer were identified in prior studies and used as guidelines for contour extent. In general, potentiometric surface contours were terminated adjacent to bays and the ocean where their position was determined manually and represented in maps using dashed lines. The geospatial datasets used to generate the potentiometric surface maps are available from Fiore and others (2025).
Isochlors
Previously published lines of 250 mg/L and 10,000 mg/L equal chloride concentration (Gordon and others, 2021), referred to as isochlors, were added to the potentiometric surface maps. The locations of the 250-mg/L isochlors designate the limit of potable water in each aquifer as defined by NJDEP secondary drinking-water standards (New Jersey Administrative Code, 2023). The location of the 10,000-mg/L isochlor, which represents approximately half the chloride concentration of seawater, was simulated for selected aquifers by Pope and Gordon (1999). Adding the isochlors is for descriptive purposes only; evaluating chloride distribution and saltwater intrusion in Coastal Plain aquifers is beyond the scope of this report.
Previous isochlors (Gordon and others, 2021) were evaluated for any changes using chloride data available in the NWIS database (U.S. Geological Survey, 2022) from 38 wells sampled from 2017 to 2019. Only the 250-mg/L isochlor of the lower Potomac-Raritan-Magothy aquifer required an update in 2018; the locations of all other isochlors were unchanged from Gordon and others (2021). The position of the saltwater interface inferred is more closely related to longer-term changes in groundwater withdrawals (Pope and Gordon, 1999) than to conditions specific to 2018.
Hydrographs
Hydrographs were created to evaluate water-level changes in 75 select observation wells. Each observation well is part of the USGS New Jersey Water Science Center groundwater network except for well 090071, which was formerly in the USGS network until 1998 but has since been measured by the USGS at the same 5-year intervals as the wells discussed in previous reports in this series. A hydrograph for this well was included because it is screened in the Rio Grande water-bearing zone, which only has one well in the USGS groundwater network (090304). Hydrographs begin in 1978, the first year of USGS synoptic water-level measurements in New Jersey Coastal Plain confined aquifers, and 50 of the 75 observation wells have periods of record extending from 1978 or earlier, 21 wells have periods of record since the 1980s, and 4 wells have periods of record since the 1990s. Hydrographs extend through 2019 to ensure the water levels measured in early 2019 as part of this study can be evaluated. Hydrographs include daily mean water-level data collected continuously using a pressure transducer (Cunningham and Schalk, 2011). If no continuous data were available, then discrete, manually collected water-level data were used instead. All data used in hydrographs are available in NWIS. Previous reports of this series, such as the most recent (Gordon and others, 2021), compare the water levels of their study period to previous study periods; this report focuses on comparing water levels from the current period (2014–19) with the previous period (2008–13).
Groundwater Withdrawals
Groundwater use data for New Jersey were provided by the New Jersey Geological and Water Survey and are available in the New Jersey Water Transfer Data Model database (New Jersey Geological and Water Survey, 2022). The databases contain monthly withdrawal, use, and return volumes by site. Groundwater withdrawal volumes are summarized for the 10 confined aquifers. A detailed assessment of groundwater use is beyond the scope of this report.
Cohansey Aquifer
The confined Cohansey aquifer is located only in peninsular Cape May County. Groundwater withdrawals from this aquifer in 2018 averaged approximately 3.34 million gallons per day (Mgal/d), equivalent to the amount withdrawn in 2013 (Gordon and others, 2021).
Potentiometric surfaces for the confined Cohansey aquifer are shown on plate 1. The 2018 potentiometric surface indicates a cone of depression centered on pumping wells in the southern half of peninsular Cape May County. The deepest part of the cone extends below an altitude of −15 ft. The −10-ft potentiometric surface covers a large area of the southern part of the county, extending into the Atlantic Ocean and along the coast of Delaware Bay. Most of southern Cape May County had groundwater levels below 0 ft NAVD 88, except for large parts of the barrier islands along the Atlantic coast. The potentiometric surface is highest in the northeast part of the aquifer, where water-level altitudes are above 5 ft.
Hydrographs of five wells in the confined Cohansey aquifer are shown in figure 3. Wells 090048, 090049, 090080, and 090150 had similar water levels and had fluctuations with similar ranges during 2014–19 as during the historical period. In well 090060, which is the well closest to the cone of depression at less than 1 mile, water levels fluctuated within a narrower range from 2014 to 2019 than the historical period, with fewer water-level altitudes less than −20 ft and an overall higher mean water level.
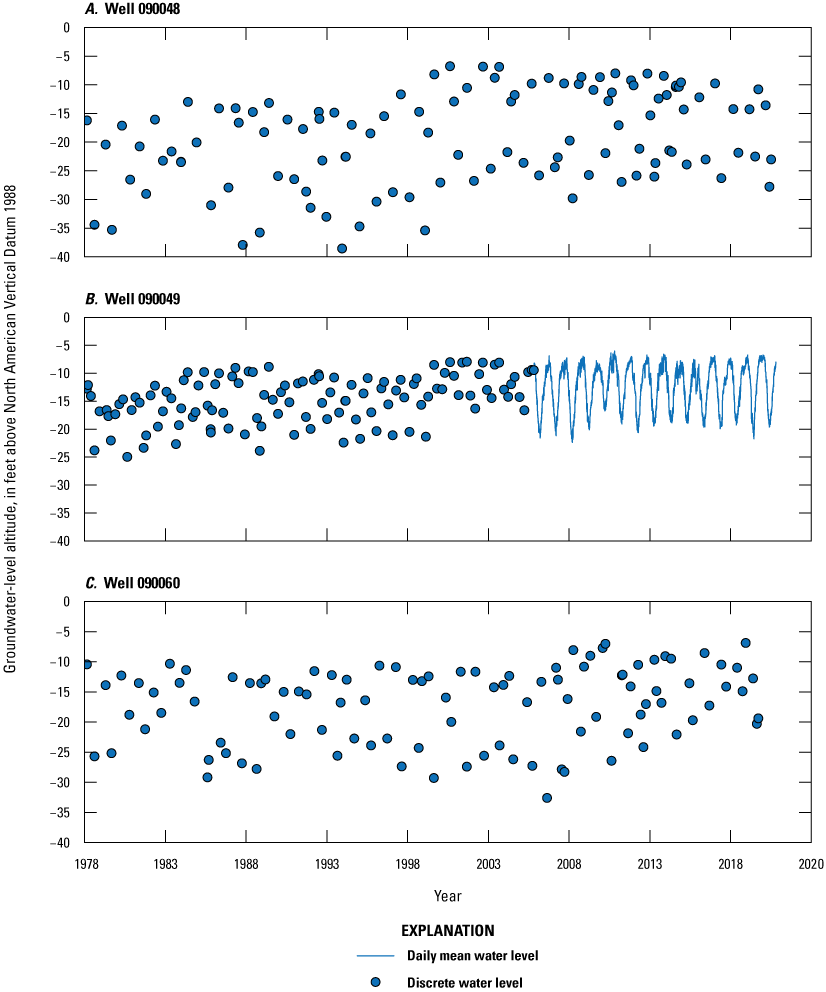
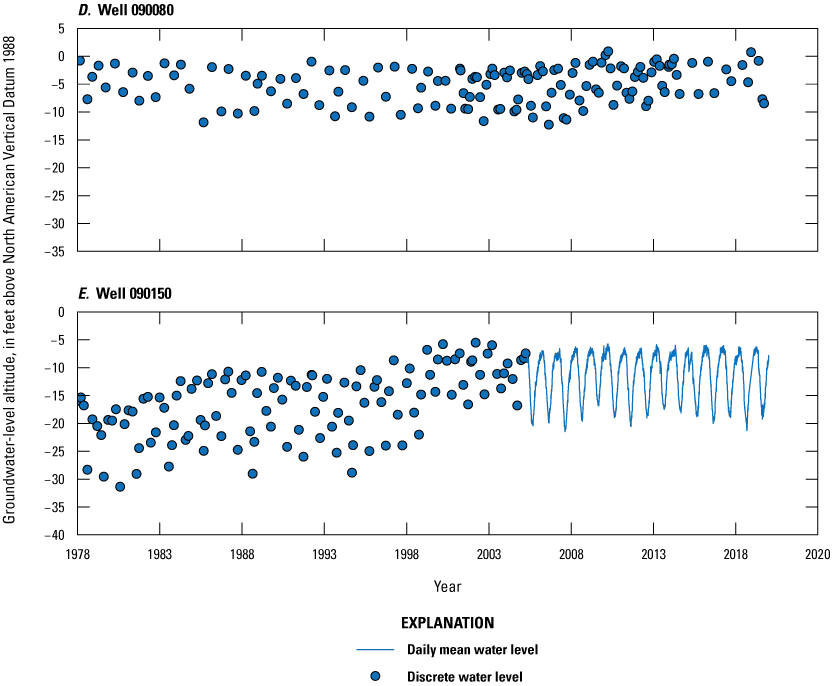
Groundwater-level hydrographs for selected observation wells screened in the confined Cohansey aquifer, New Jersey, 1978–2019. NAVD 88, North American Vertical Datum of 1988.
Rio Grande Water-Bearing Zone
Groundwater withdrawals from the Rio Grande water-bearing zone in 2018 average approximately 0.94 Mgal/d, an increase from 0.5 Mgal/d in 2013 (Gordon and others, 2021). Average withdrawals from the Rio Grande water-bearing zone of 0.22 Mgal/d occurred in Ocean, 0.01 Mgal/d in Atlantic, and 0.70 Mgal/d in Cape May Counties during 2018.
Potentiometric surfaces for the Rio Grande water-bearing zone are shown on plate 1. The 2018 potentiometric surface indicated peak measured altitudes of greater than 10 ft near the aquifer’s updip limit in Atlantic County. The potentiometric surface slopes downward in a southeastern direction, largely parallel to the coastline, into a regional cone of depression indicated by the −20-ft potentiometric surface contour that extends from the Beach Haven quadrangle in southern Ocean County in the north and a large part of Cape May County in the south. The deepest part of the cone of depression is in central Cape May County and had measured water-level altitudes less than −30 ft. Water levels are below 0 ft NAVD 88 for most of the extent of the Rio Grande water-bearing zone, except near its updip limit.
Hydrographs of wells 090071 and 090304 in the Rio Grande water-bearing zone are shown in figure 4. Water levels in well 090304, which is closer to the center of the cone of depression, exhibited smaller fluctuations but lower water levels overall during 2014–19 than the historical period, like well 090060 in the overlying confined Cohansey aquifer. Well 090071 is measured only once every 5 years, and its 2018 water level was within range of the historical period.
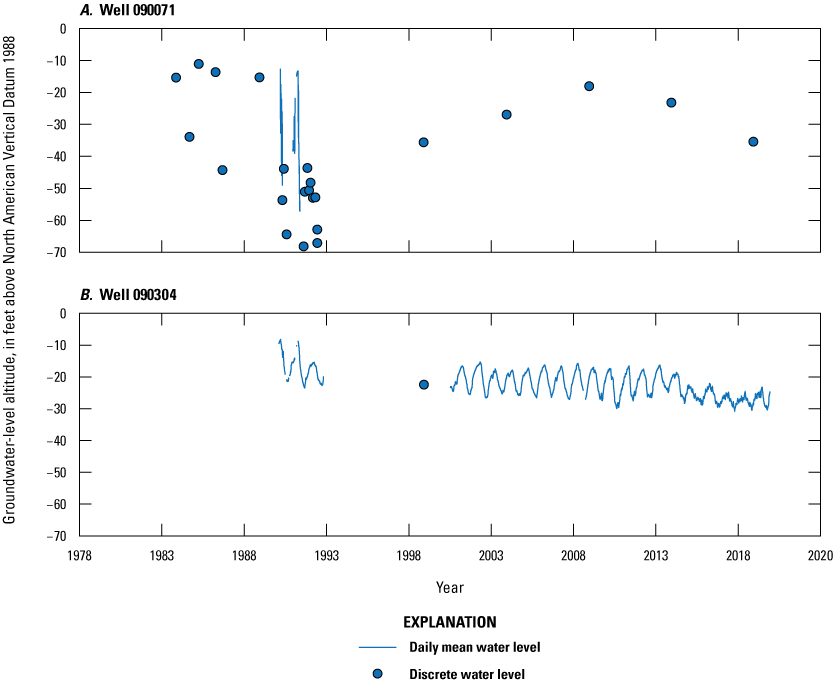
Groundwater-level hydrographs for selected observation wells screened in the Rio Grande water-bearing zone, New Jersey, 1978–2019. NAVD 88, North American Vertical Datum of 1988.
Atlantic City 800-Foot Sand
Groundwater withdrawals from the Atlantic City 800-foot sand in 2018 total 22.47 Mgal/d, slightly less than 23.8 Mgal/d in 2013 (Gordon and other, 2021). Withdrawals of 5.72 Mgal/d occurred in Ocean County, 9.78 Mgal/d in Atlantic County and 6.98 Mgal/d in Cape May County during 2018.
Potentiometric surfaces for the Atlantic City 800-foot sand aquifer are shown on plate 2. The 2018 potentiometric surface has altitude peaks near its updip extent in West Creek quadrangle of southern Ocean County (about 41 ft). The potentiometric surface of the Atlantic City 800-foot sand was below 0 ft throughout most of its extent and indicates a large cone of depression centered in the Atlantic City and Ocean City quadrangles of Atlantic County where water-level altitudes were less than −70 ft. The −40 ft potentiometric surface of this cone of depression extends to the Brigantine Inlet quadrangle in the north and as far south as the Stone Harbor quadrangle of Cape May County. Smaller cones of depression within the regional cone of depression are in pumping centers in the southern part of Cape May County, where water-level altitudes are below −40 ft in the Cape May quadrangle and −50 ft in the Rio Grande quadrangle. Well 011910 in the Mays Landing quadrangle in Atlantic County also shows drawdown, which may be due to local effects such as water levels not being fully recovered from pumping or nearby pumping. Minor water-level drawdown is also indicated beneath the barrier islands of the Ship Bottom and Beach Haven quadrangles of Ocean County.
Hydrographs of seven wells in the Atlantic City 800-foot sand aquifer are shown in figures 5 (Atlantic County) and 6 (Cape May County). Hydrographs of the Atlantic City 800-foot sands indicate a recovery of water levels that began during the 2014 to 2019 period compared to the historical record. The wells in Atlantic County—010180, 010578, 010704, and the northernmost well in Cape May County near the Atlantic County border—090185, exhibited decreasing water levels from at least the late 1970s through approximately 2013. From 2014 to 2018, water levels have been markedly increasing. Wells 090302, 090306, and 090337 in southern Cape May County continue to experience decreasing water levels as in previous periods.
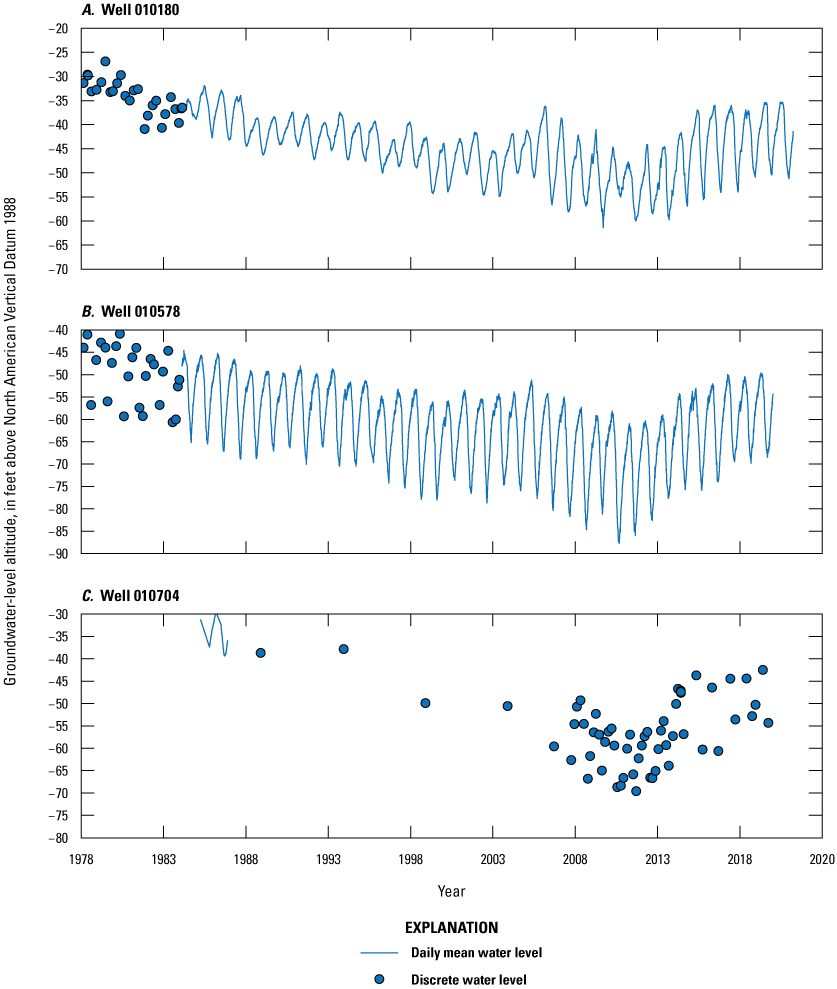
Groundwater-level hydrographs for selected observation wells screened in the Atlantic City 800-foot sand aquifer, Atlantic County, New Jersey, 1978–2019. NAVD 88, North American Vertical Datum of 1988.
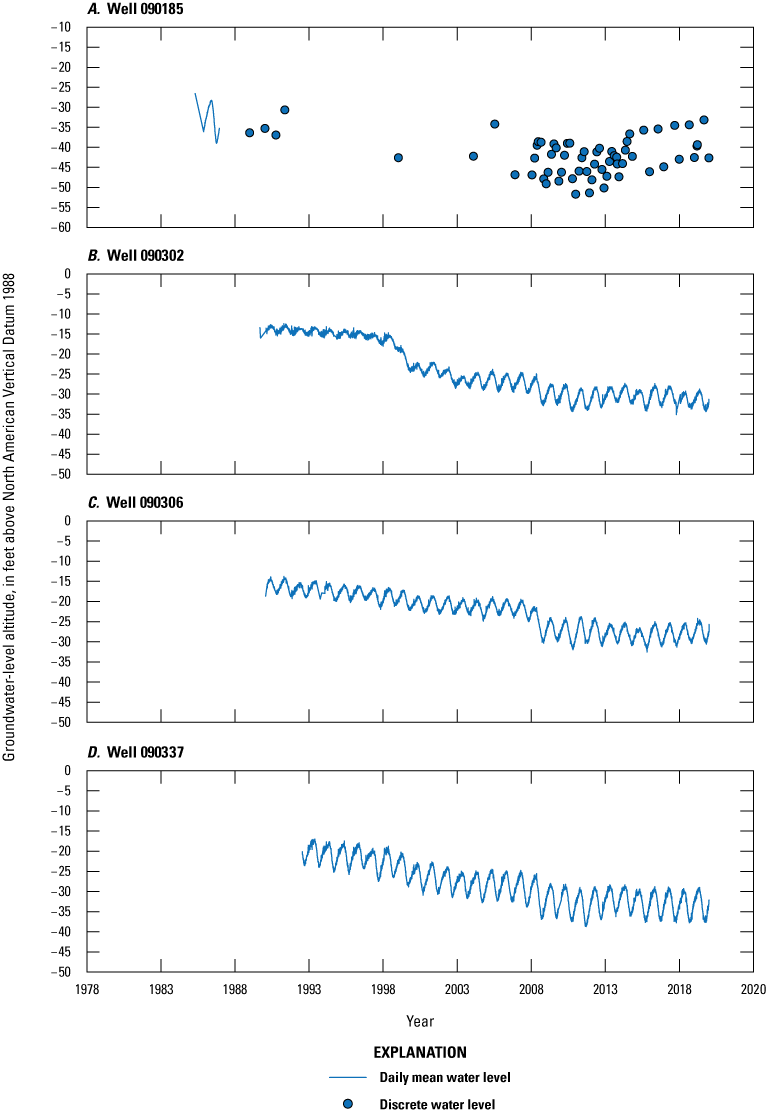
Groundwater-level hydrographs for selected observation wells screened in the Atlantic City 800-foot sand aquifer, Cape May County, New Jersey, 1978–2019. NAVD 88, North American Vertical Datum of 1988.
Piney Point Aquifer
Groundwater withdrawals from the Piney Point aquifer in 2018 average approximately 5.0 Mgal/d, slightly less than the 5.1 Mgal/d withdrawn in 2013 (Gordon and others, 2021). Ocean County had the largest withdrawals of 3.9 Mgal/d in 2018, followed by Cumberland County (0.49 Mgal/d), and Atlantic County (0.47 Mgal/d); Camden, Gloucester and Salem Counties had minor withdrawals of less than 0.1 Mgal/d each.
Potentiometric surfaces for the Piney Point aquifer are shown on plate 3. The potentiometric surface is highest near the Piney Point’s updip limit near the boundary of Burlington County and Ocean County in the Whiting and Woodmansie quadrangles, where water-level altitudes of about 117 ft were measured in two wells. A large cone of depression is indicated at a pumping center in the Bridgeton quadrangle of Cumberland County, which has measured water-level altitudes deeper than −180 ft. The cone of depression extends from Cumberland County, New Jersey, across the Delaware River into Delaware, where the lowest measured water-level altitude of about −246 ft was recorded in the Dover quadrangle. Adjacent to this cone of depression is a minor area of drawdown in the Buena quadrangle of Atlantic County. Another cone of depression below a potentiometric surface of −20 ft is on the barrier islands of Ocean County, which is centered near Barnegat Light and extends north toward Seaside Park quadrangle where water levels are below −40 ft in altitude. The southern extent of this cone of depression is less clear because the −20 ft potentiometric surface also encloses another small cone of depression near Atlantic City, which is inferred based off previous reports in this series (Gordon and others, 2021).
Hydrographs of seven wells in the Piney Point aquifer are shown in figures 7 (Cumberland County) and 8 (Atlantic, Burlington, and Ocean Counties). Hydrographs from wells 110044, 110096, and 110163 in the Cumberland County cone of depression indicate similar decreasing water levels in 2014–19 as during previous periods. Piney Point aquifer wells in Burlington County (050407) and Ocean County (290425 and 290585) exhibit stable water levels from about 1997 and earlier. The sole Piney Point well in Atlantic County (011219) indicates water-level increases since about 2015 that differs from the decreasing response from about 1995.
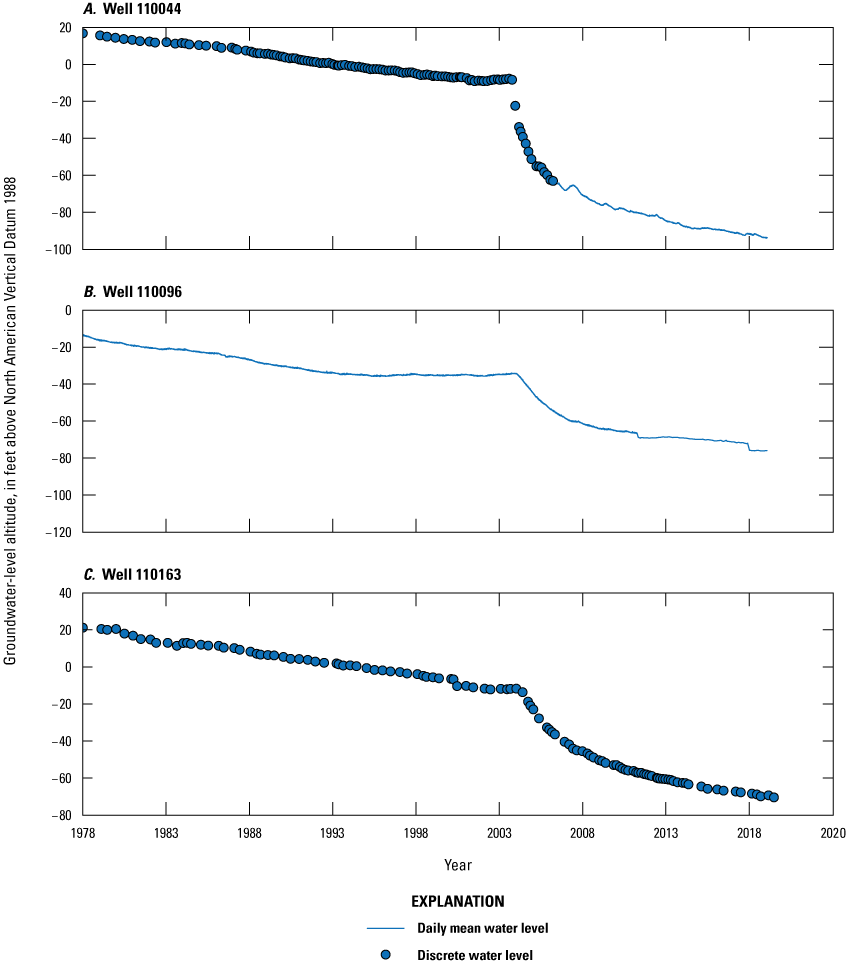
Groundwater-level hydrographs for selected observation wells screened in the Piney Point aquifer, Cumberland County, New Jersey, 1978–2019. NAVD 88, North American Vertical Datum of 1988.
Groundwater-level hydrographs for selected observation wells screened in the Piney Point aquifer in Atlantic, Burlington, and Ocean Counties, New Jersey, 1978–2019. NAVD 88, North American Vertical Datum of 1988.
Vincentown Aquifer
Groundwater withdrawals from the Vincentown aquifer in 2018 averaged approximately 1.33 Mgal/d, less than 1.6 Mgal/d withdrawn in 2013 (Gordon and others, 2021). Monmouth County had combined withdrawals of 0.87 Mgal/d in 2018, followed by withdrawals of 0.39 Mgal/d in Ocean County and minor withdrawals in Gloucester and Salem Counties.
Potentiometric surfaces for the Vincentown aquifer are shown on plate 4. The potentiometric surface does not indicate areas of regional drawdown throughout its extent. However, the relatively smaller number of measured wells screened in the Vincentown aquifer compared to other confined aquifers limits the resolution of the potentiometric surface mapping for that aquifer. The potentiometric surface reaches a high of 130 ft in northwestern Ocean County around the Cassville and Roosevelt quadrangles and decreases toward the coast to a low of 20 ft near Asbury Park in Monmouth County. The southwest part of the Vincentown aquifer exhibits a decreasing potentiometric surface from the Pitman West quadrangle in Gloucester County to the Delaware River in Salem County, where water-level altitudes are less than 10 ft, the deepest measured for this aquifer in this study.
Three hydrographs are available for the Vincentown aquifer for wells 051250, 250636, and 290425 (fig. 9). Each of the 3 wells indicate stable water levels that fluctuate within historical ranges since approximately 1990 and earlier.
Groundwater-level hydrographs for selected observation wells screened in the Vincentown aquifer, New Jersey, 1978–2019. NAVD 88, North American Vertical Datum of 1988.
Wenonah-Mount Laurel Aquifer
Groundwater withdrawals from the Wenonah-Mount Laurel aquifer in 2018 averaged approximately 6.39 Mgal/d, slightly less than 6.7Mgal/d withdrawn in 2013 (Gordon and others, 2021). Wells in Burlington County account for withdrawals of 1.65 Mgal/d, 1.46 Mgal/d in Camden County, 1.37 Mgal/d in Gloucester County, 1.13 Mgal/d in Salem County, 0.68 Mgal/d in Monmouth County, and minor withdrawals in Ocean County.
Potentiometric surfaces for the Wenonah-Mount Laurel aquifer are shown on plate 5. In general, the altitude of the potentiometric surface declines toward the southeast from the western edge of the aquifer near the recharge area along its outcrop, where it reaches a peak altitude of more than 150 ft in the Roosevelt quadrangle in Monmouth County. Potentiometric surfaces indicate two regional cones of depression in the aquifer. A southern cone of depression, centered on the boundary between Gloucester and Camden Counties, extends below an altitude of −40 ft. The −20 ft potentiometric surface in this cone of depression extends across the Pitman East, Williamstown, and Clementon quadrangles. A northern regional cone of depression is centered in the Asbury Park quadrangle in southeastern Monmouth County, within the boundary of Critical Area I, and has water-level altitudes less than −80 ft, the deepest water levels for this aquifer. The −60-ft potentiometric surface associated with this cone of depression extends to the adjacent Point Pleasant quadrangle to the south. A smaller cone of depression with water-level altitudes less than 0 ft occurs in the Salem quadrangle in Salem County. A minor area of drawdown in the Medford Lakes and Indian Mills quadrangle in Burlington County has water-level altitudes less than −20 ft. Additional cones of depression around well 050367 in the Browns Mills quadrangle in Burlington County, well 291752 in the Roosevelt quadrangle in Ocean County, and well 330902 in the Woodstown quadrangle of Salem County resulted from measurements being collected before complete water-level recovery, thus do not represent cones of depression in static conditions. The lower water level of well 250396 compared with the water levels at nearby wells, despite 250396 being closer to the outcrop recharge area, may result from unknown hydrologic effects from the unconfined part of the aquifer.
Hydrographs for eight wells screened in the Wenonah-Mount Laurel aquifer are shown in figure 10 (Burlington, Monmouth, and Ocean Counties) and 11 (Camden and Salem Counties). Well 070478 is in the Gloucester and Camden Counties cone of depression and showed a 2014–19 departure from historical periods, with decreasing water levels since about 2015. Before onset of this decrease, water levels were increasing from 2008 to 2015 after experiencing record lows from a decreasing response that began in about 1983. This change of response for well 070478 is likely related to its location in the cone of depression centered in the Pitman East quadrangle on the border of Camden and Gloucester Counties. Water levels from wells 051155, 290140, 070118, and 330252 fluctuate within the same range in 2014–19 as the historical records. Wells 250353 and 250486 have stable water levels in 2014–19 since the rise in 1991 associated with Critical Area I restrictions. Well 330020 in Salem County continued to have decreasing water levels in 2014–19, ongoing since at least 1978, and since about 2006 has had greater water level fluctuation within a larger range than previous periods.
Groundwater-level hydrographs for selected observation wells screened in the Wenonah-Mount Laurel aquifer in Burlington, Monmouth, and Ocean Counties, New Jersey, 1978–2019. NAVD 88, North American Vertical Datum of 1988.
Groundwater-level hydrographs for selected observation wells screened in the Wenonah-Mount Laurel aquifer in Camden and Salem Counties, New Jersey, 1978–2019. NAVD 88, North American Vertical Datum of 1988.
Englishtown Aquifer System
Groundwater withdrawals from the Englishtown aquifer system in 2018 total 7.89 Mgal/d, approximately the same amount withdrawn from the aquifer in 2013 (Gordon and others, 2021). These withdrawals are at wells in Monmouth, Ocean, Burlington, Camden, Gloucester, and Salem Counties; the highest rate of 3.21 Mgal/d being in Monmouth County followed by 1.85 Mgal/d in Ocean County. Additional groundwater withdrawals of 1.64 Mgal/d were in Camden County, 0.88 Mgal/d in Burlington County, 0.29 Mgal/d in Salem County and minor withdrawals in Gloucester County during 2018.
Potentiometric surfaces for the Englishtown aquifer system are shown on plate 6. The 2018 potentiometric surface generally declines in altitude from its outcrop area where the aquifer is recharged southeastward toward the Atlantic Ocean. The highest water-level altitudes are above 140 ft in the Roosevelt quadrangle in Monmouth County. A large regional cone of depression in the 2018 potentiometric surface is within Critical Area I and is centered over the Point Pleasant quadrangle where water-level altitudes are below −70 ft. The −50-ft potentiometric surface of this cone of depression extends into the adjacent Lakewood quadrangle to the west, Seaside Park quadrangle to the south, and Asbury Park quadrangle to the north where two smaller cones of depression with water-level altitudes less than −60 ft are located within this regional cone of depression. A smaller cone of depression is in the Runnemede and Clementon quadrangles in Camden County where water-level altitudes are below 10 ft. Additional minor areas of drawdown are also in the Mount Holly quadrangle in Burlington County (water-level altitudes less than 20 ft) and the Browns Mills quadrangle in Burlington County (water-level altitudes less than 10 ft). The small cone of depression around well 331209 in Salem County is the result of the water-level measurement being collected before recovery from pumping and does not represent a static condition. Outlier drawdown around well 290452 in the Seaside Park quadrangle in Ocean County and well 0501817 in the Medford Lakes quadrangle of Burlington County may have resulted from either unrecovered water levels, effects of nearby pumping, or another cause.
Hydrographs for eight wells screened in the Englishtown aquifer system are shown in figures 12 (Burlington and Ocean Counties) and 13 (Monmouth County). Hydrographs of wells 050259, 290138, 250250, and 250715 indicate stable water levels in the 2014–19 period and fluctuate within historical ranges. Water levels increased in wells 290503, 250429, and 250638 following Critical Area I restrictions and have been stable or slightly increasing since. These wells are within the Englishtown aquifer system regional cone of depression in Monmouth and Ocean Counties. Well 290534 has shown large changes in water levels in 2011 and 2014, but water levels have remained stable from 2014 to 2019. The cause of these jumps, such as possible silting of the well screen, is unknown but could be better understood with additional testing.
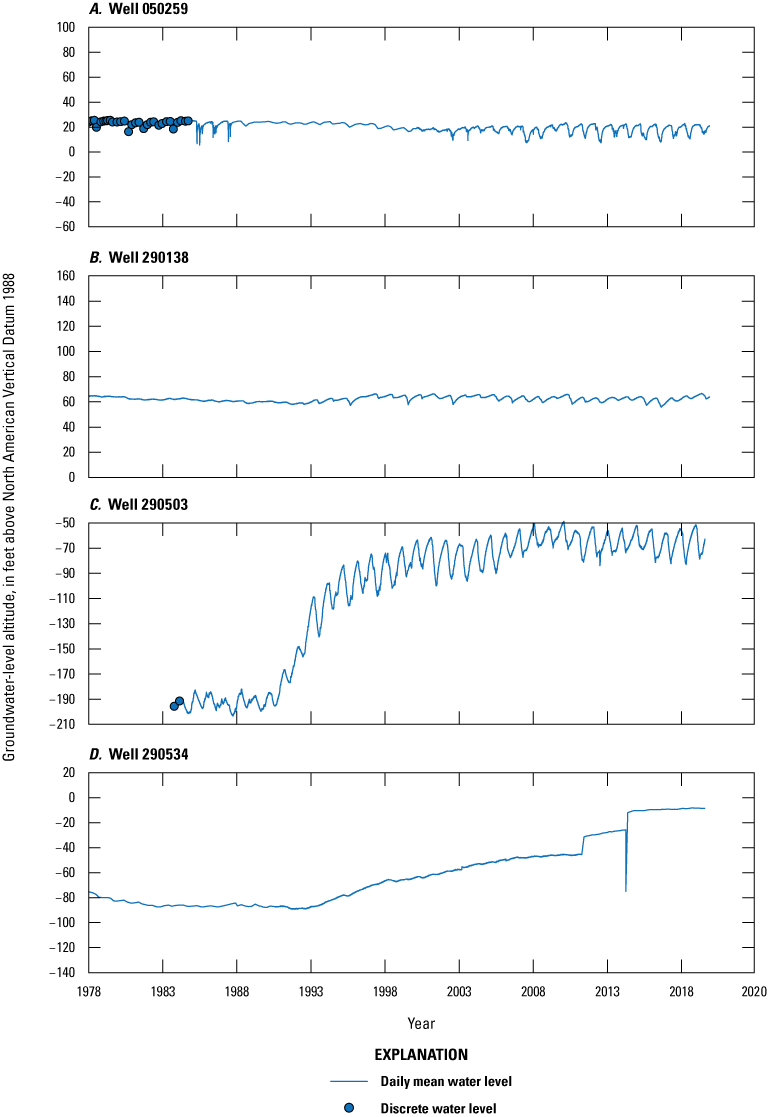
Groundwater-level hydrographs for selected observation wells screened in the Englishtown aquifer system in Burlington and Ocean Counties, New Jersey, 1978–2019. NAVD 88, North American Vertical Datum of 1988.
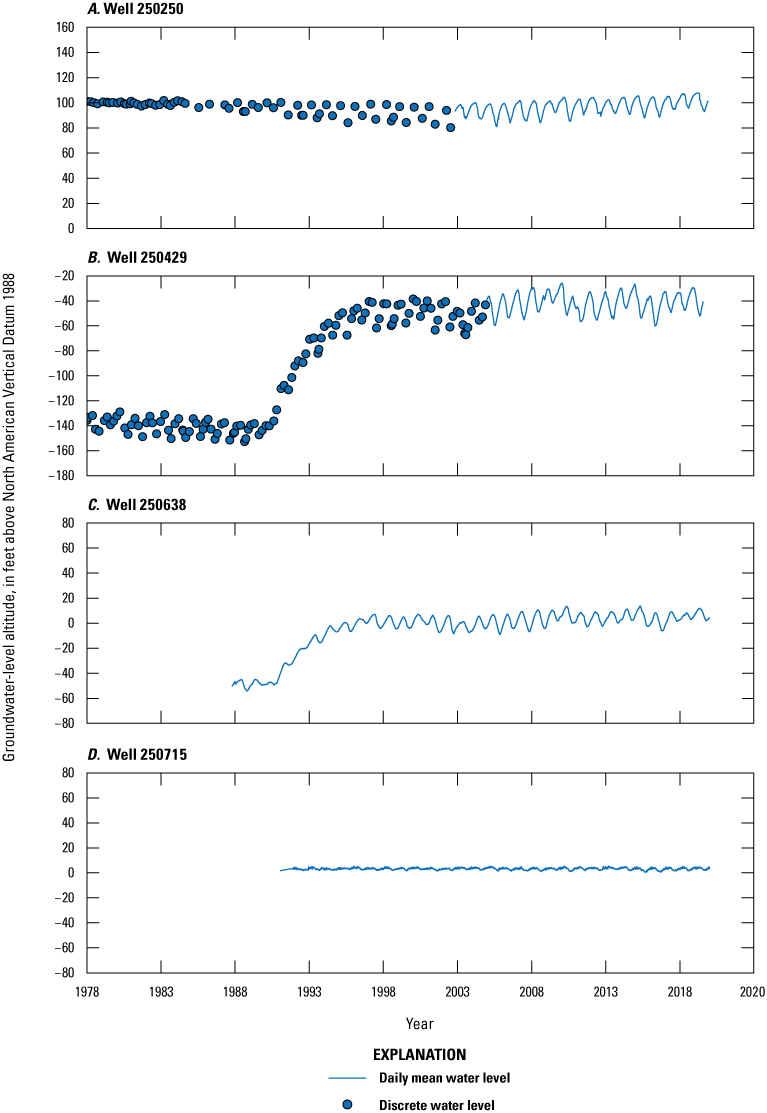
Groundwater-level hydrographs for selected observation wells screened in the Englishtown aquifer system in Monmouth County, New Jersey, 1978–2019. NAVD 88, North American Vertical Datum of 1988.
Upper Aquifer of the Potomac-Raritan-Magothy Aquifer System
Groundwater withdrawals from the upper aquifer of the Potomac-Raritan-Magothy aquifer system in 2018 averaged approximately 52.20 Mgal/d, an increase from 49.0 Mgal/d in 2013 (Gordon and others, 2021). Middlesex County had the largest withdrawals of 16.22 Mgal/d, followed by 8.40 Mgal/d in Camden, 7.62 Mgal/d in Gloucester, 7.31 Mgal/d in Monmouth, 6.78 Mgal/d in Ocean, 3.28 Mgal/d in Burlington, 1.83 Mgal/d in Salem, and 0.73 Mgal/d in Mercer Counties.
Potentiometric surfaces for the upper aquifer of the Potomac-Raritan-Magothy aquifer system are shown on plate 7. Water-level altitudes in this upper aquifer exceed 60 ft near the Magothy Formation outcrop in the Hightstown quadrangle of Mercer and Middlesex County. East and south of this area, the potentiometric surface declines throughout the aquifer to altitudes below 0 ft and is affected by withdrawals in several geographic areas. Potentiometric surfaces indicate two large regional cones of depression in the aquifer. One cone of depression is centered near the boundary of the Toms River and Lakewood quadrangles in Ocean County in Critical Area I where water levels drop to altitudes below –100 ft. The –50-ft potentiometric surface of this area of drawdown extends across the adjacent Lakehurst, Keswick Grove, Seaside Park, and Point Pleasant quadrangles. A smaller cone of depression associated with Critical Area I is in the Long Branch West quadrangle and has a water level less than –40 ft in altitude, although its exact areal extent is unknown and only indicated by well 250360. The second regional cone of depression is centered in the Runnemede and Clementon quadrangles in Camden County in Critical Area II where water-level altitudes are less than –60 ft, and the –50 ft potentiometric surface extends across the Mount Holly, Medford Lakes, Williamstown, and Pitman East quadrangles. A groundwater divide between the two regional cones of depression is between the –30 and –40-ft potentiometric surfaces in the Browns Mills, Whiting, Chatsworth, and Woodmansie quadrangles. Small cones of depression around wells 230213 in the Jamesburg quadrangle in Middlesex County, 250334 in the Asbury Park quadrangle in Monmouth County, 051816 in the Columbus quadrangle in Burlington County, 050759 in the Medford Lakes quadrangle in Burlington County, 150127 in the Pitman West quadrangle in Gloucester County, and 150060 in the Pitman West quadrangle in Gloucester County are each outliers within the regional potentiometric surfaces and likely resulted from water levels being affected by nearby pumping, water levels having not fully recovered from pumping, and (or) other causes.
Hydrographs from 11 wells in the upper aquifer of the Potomac-Raritan-Magothy aquifer system are shown in figures 14 (Middlesex and Monmouth Counties), 15 (Burlington, Camden, and Ocean Counties), and 16 (Gloucester and Salem Counties). Water levels in wells 250206, 250316, and 250639 experienced similar rises in the late 1980s associated with Critical Area I withdrawal restrictions, followed by increasing water levels from 2014 to 2019. Well 290504 is also within Critical Area I, but too few historical water levels are available to evaluate the long-term water-level response for this well. Wells 050258, 070117, 070477, and 150741 are within Critical Area II and had water-level rises in the mid-1990s affected by groundwater withdrawal restrictions, and during 2014–19, water levels continued to increase. Wells 150728, 230292, and 330253 are outside Critical Area margins but have stable water levels that fluctuate within historical ranges during 2014 to 2019.
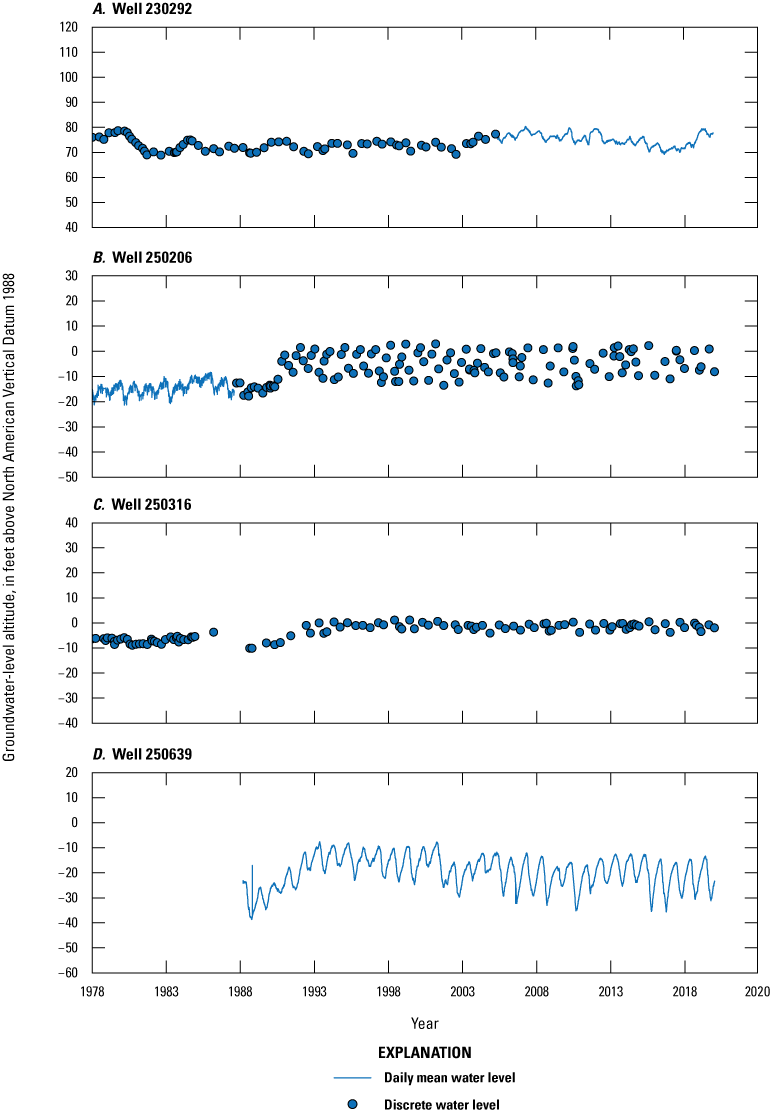
Groundwater-level hydrographs for selected observation wells screened in the upper aquifer of the Potomac-Raritan-Magothy aquifer system in Middlesex and Monmouth Counties, New Jersey, 1978–2019. NAVD 88, North American Vertical Datum of 1988.
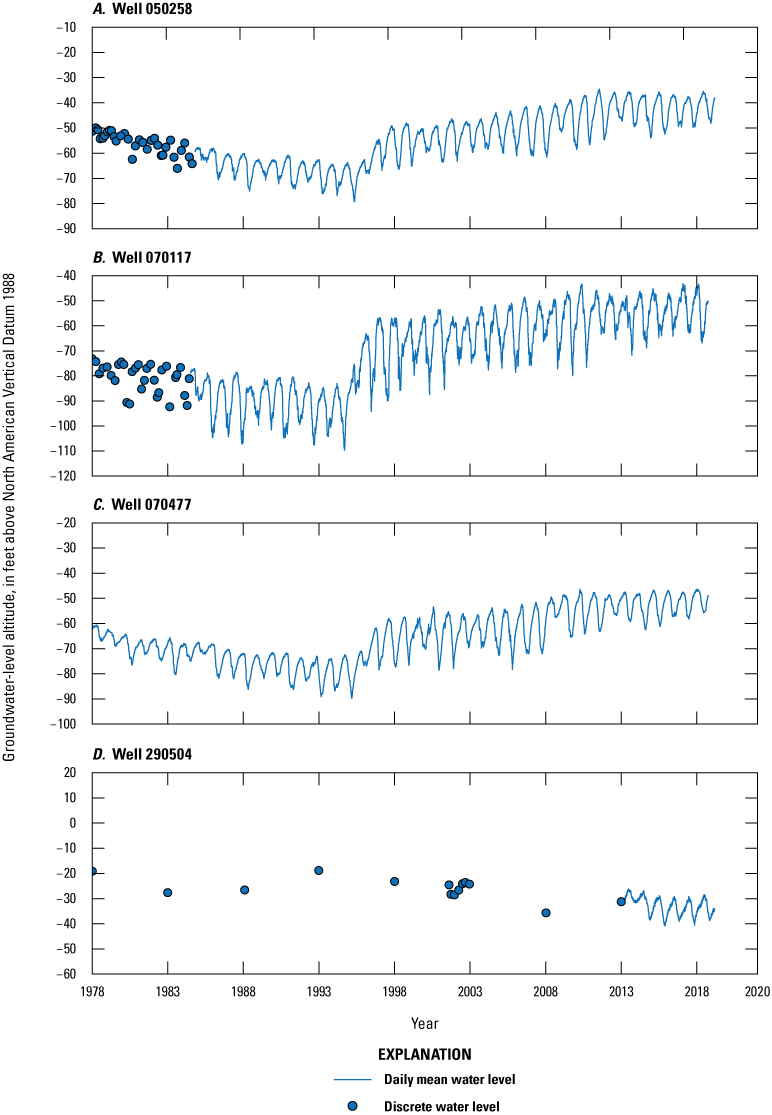
Groundwater-level hydrographs for selected observation wells screened in the upper aquifer of the Potomac-Raritan-Magothy aquifer system in Burlington, Camden, and Ocean Counties, New Jersey, 1978–2019. NAVD 88, North American Vertical Datum of 1988.
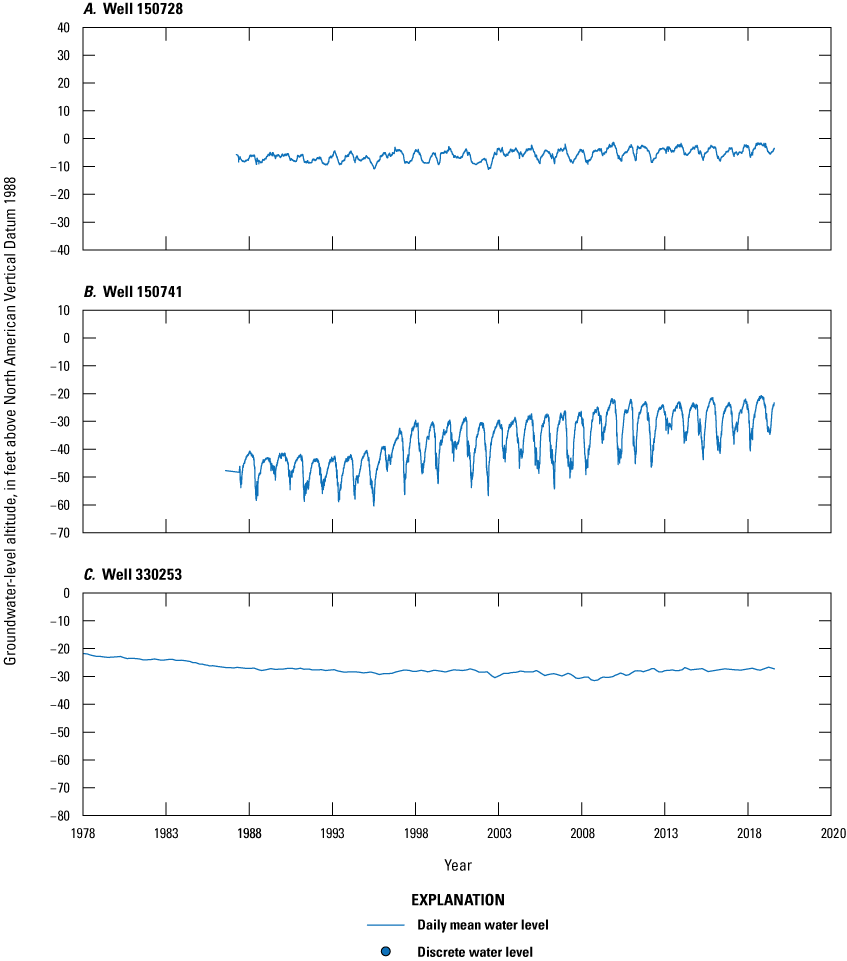
Groundwater-level hydrographs for selected observation wells screened in the upper aquifer of the Potomac-Raritan-Magothy aquifer system in Gloucester and Salem Counties, New Jersey, 1978–2019. NAVD 88, North American Vertical Datum of 1988.
Middle and Undifferentiated Aquifers of the Potomac-Raritan-Magothy Aquifer System
Groundwater withdrawals from the middle and undifferentiated aquifers of the Potomac-Raritan-Magothy aquifer system in 2018 totaled 54.76 Mgal/d, the highest groundwater withdrawal rate of the 10 confined aquifers in the New Jersey Coastal Plain; however, this rate is a decline from the 58.7 Mgal/d reported in 2013 (Gordon and others, 2021). The highest withdrawals in 2018 were from wells in Burlington County totaling 12.60 Mgal/d, followed by 8.18 Mgal/d in Ocean County, and 7.86 Mgal/d in Middlesex County. Additional 2018 withdrawals were 7.60 Mgal/d in Mercer County, 6.71 Mgal/d in Monmouth County, 5.57 Mgal/d in Camden County, 4.39 Mgal/d in Gloucester County, and 1.85 Mgal/d in Salem County.
Potentiometric surfaces for the middle and undifferentiated aquifers of the Potomac-Raritan-Magothy aquifer system are shown on plate 8. The 2018 potentiometric surface indicates highest altitudes in the Hightstown quadrangle of Mercer and Middlesex Counties and declines to below 0 ft throughout most of the aquifer east and south of this northwestern high except for other areas adjacent to its outcrop recharge area. Potentiometric surfaces also decrease toward the northwest of the high, which is likely caused by the hydrologic effects from the unconfined part of the aquifer. The largest cone of depression is within Critical Area II, where measured water-level altitudes were less than −60 ft in the Moorestown quadrangle near the border of Burlington and Camden Counties, and the −50 ft potentiometric surface extended farther into Camden County in the Runnemede and Clementon quadrangles. Three smaller cones of depression in Critical Area I were indicated by −30-ft potentiometric surfaces: Monmouth County near the border of the South Amboy, Keyport, Freehold, and Marlboro quadrangles; Ocean County near the border of the Adelphia, Farmingdale, Lakehurst, and Lakewood quadrangles; and Ocean County near the border of the Cassville and Lakehurst quadrangles. The lowest measured water level in this aquifer was about −85 ft in well 330934 in the Taylors Bridge quadrangle in Salem County, which is south of Critical Area II and likely caused by local withdrawals. The small cone of depressions around Burlington County wells 050634 and 051996 in the Bristol and New Egypt quadrangles, respectively, resulted from either some combination of unrecovered water levels before measurement, effects from nearby pumping, or some other cause that prevented water levels from representing a static condition on the potentiometric surface map.
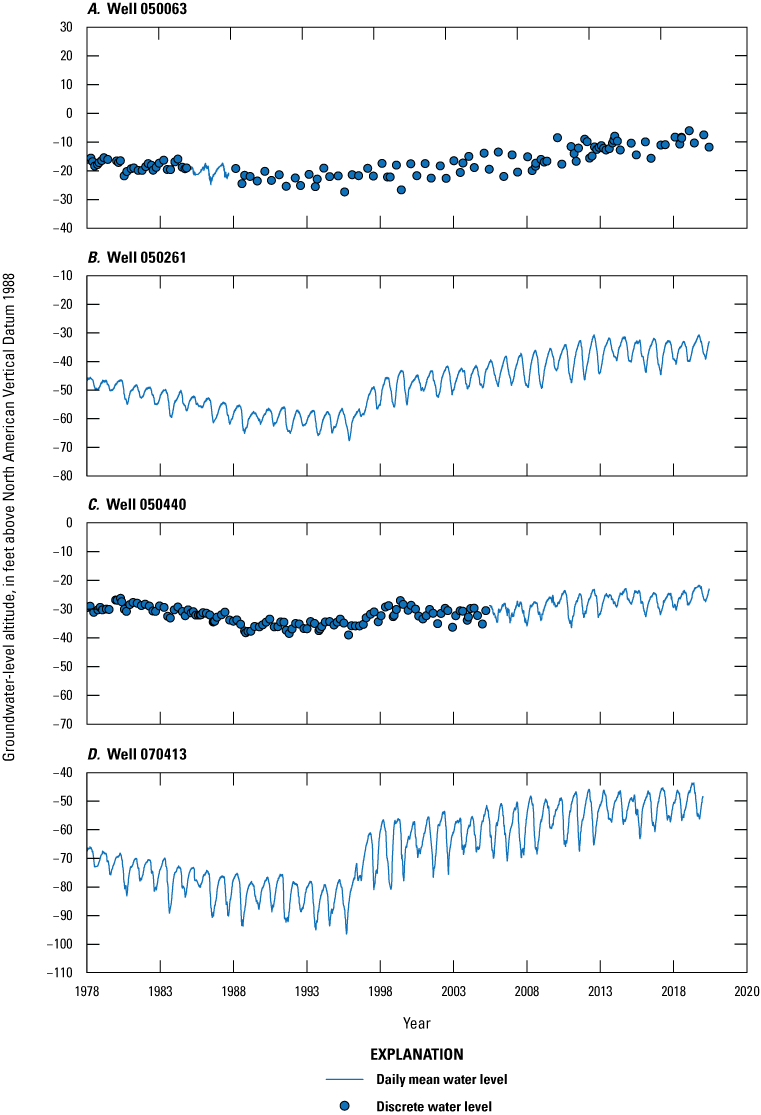
Hydrographs for 16 wells from the middle and undifferentiated aquifers of the Potomac-Raritan-Magothy aquifer system are shown in figures 17 (Middlesex and Monmouth Counties), 18 (Ocean County), 19 (Burlington and Camden County), 20 (Gloucester County), and 21 (Cumberland and Salem Counties). Water levels have been stable in wells 230439, 250272, 250635, 290019, and 290085 since about 1995, following Critical Area I restrictions that caused water-level recovery in these wells beginning around 1989. Well 230291 is outside the Critical Area I boundary, and its hydrograph indicates stable water levels from 2014 to 2019 fluctuating within historical ranges. Wells 050261 and 070413 are within Critical Area II and the large cone of depression within this aquifer and exhibited large water-level increases beginning in the mid-1990s followed by more gradual increases that continue from 2014 to 2019. Wells 050063, 050261, and 110137 are on the margin of Critical Area II and had more muted responses following withdrawal restrictions in the mid-1990s but continue a similar gradual increase of water levels from 2014 to 2019 in the time since. Hydrographs of wells 150713, 150727, 150774, 330187, and 330251 indicate stable to slightly increasing water levels from 2014 to 2019 that fluctuate within historical ranges. Of these wells, only 150774 is within Critical Area II, but data from that well only extends back to 2000 with the exception of two discrete measurements in the late 1980s.
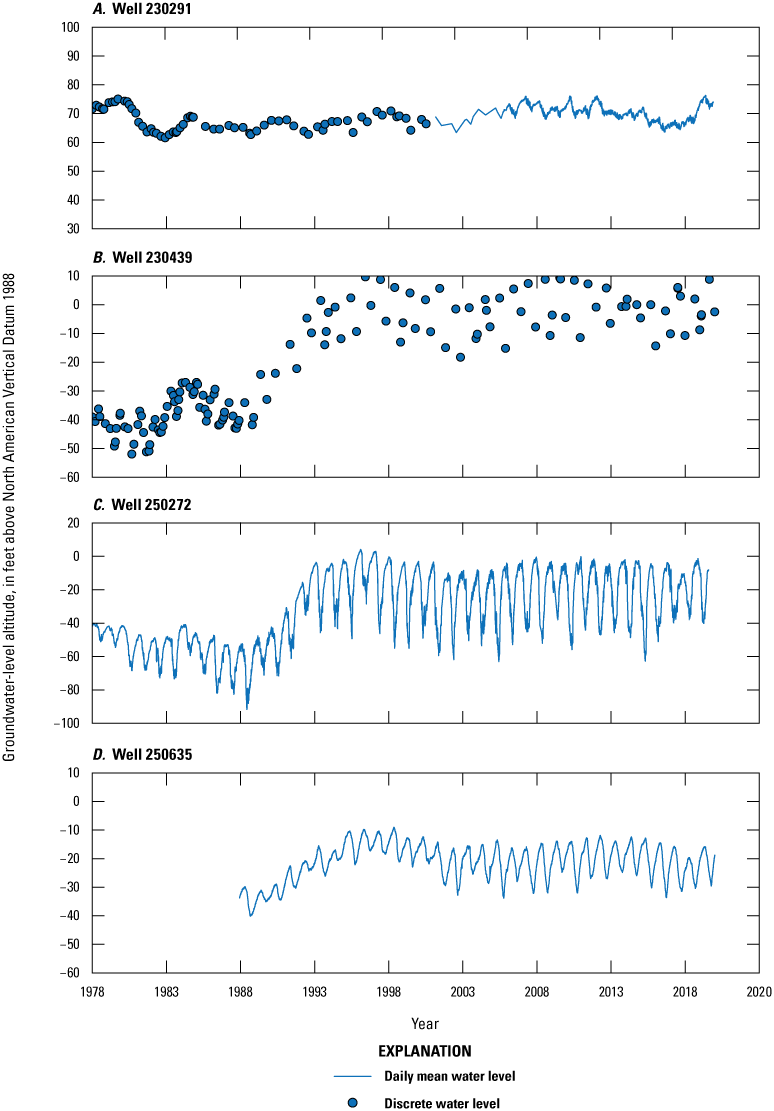
Groundwater-level hydrographs for selected observation wells screened in the middle aquifer of the Potomac-Raritan-Magothy aquifer system in Middlesex and Monmouth Counties, New Jersey, 1978–2019. NAVD 88, North American Vertical Datum of 1988.
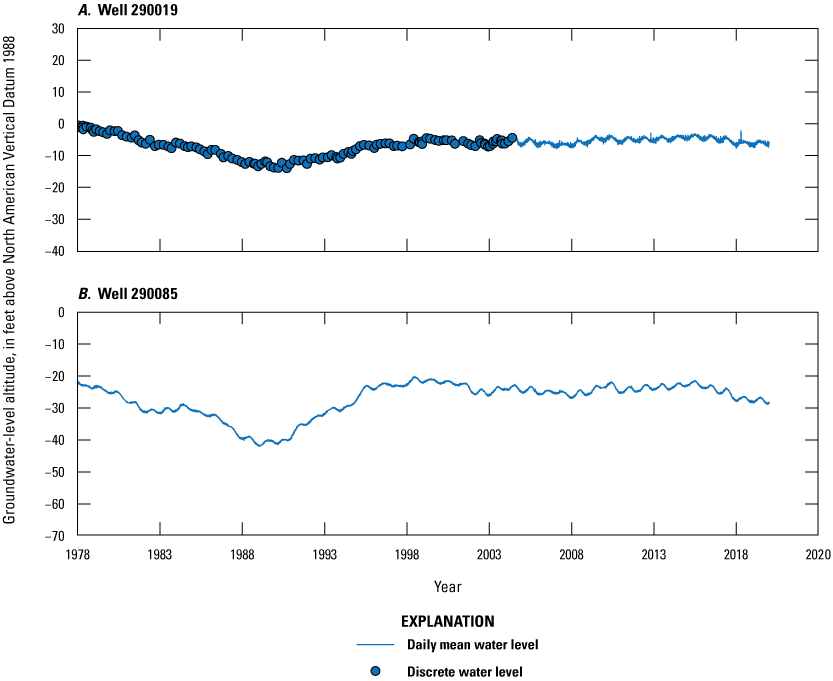
Groundwater-level hydrographs for selected observation wells screened in the middle aquifer of the Potomac-Raritan-Magothy aquifer system in Ocean County, New Jersey, 1978–2019. NAVD 88, North American Vertical Datum of 1988.
Groundwater-level hydrographs for selected observation wells screened in the middle aquifer of the Potomac-Raritan-Magothy aquifer system in Burlington and Camden Counties, New Jersey, 1978–2019. NAVD 88, North American Vertical Datum of 1988.
Groundwater-level hydrographs for selected observation wells screened in the middle aquifer of the Potomac-Raritan-Magothy aquifer system Gloucester County, New Jersey, 1978–2019. NAVD 88, North American Vertical Datum of 1988.
Groundwater-level hydrographs for selected observation wells screened in the middle aquifer of the Potomac-Raritan-Magothy aquifer system, Cumberland and Salem Counties, New Jersey, 1978–2019. NAVD 88, North American Vertical Datum of 1988.
Lower Aquifer of the Potomac-Raritan-Magothy Aquifer System
Groundwater withdrawals from the lower aquifer of the Potomac-Raritan-Magothy aquifer system in 2018 average approximately 33.55 Mgal/d, slightly more than the withdrawals of 32.9 Mgal/d in 2013 (Gordon and others, 2021). Camden County recorded the largest amount of withdrawals at 23.07 Mgal/d in 2018, followed by Burlington County with withdrawals of 7.56 Mgal/d. Additional withdrawals were 1.46 Mgal/d in Gloucester County, 0.84 Mgal/d in Salem County, 0.59 Mgal/d in Ocean County, and 0.30 Mgal/d in Mercer County.
Potentiometric surfaces for the lower aquifer of the Potomac-Raritan-Magothy aquifer system are shown on plate 9. Except for small areas adjacent to the Delaware River in Burlington County and near the fall line in Delaware, the 2018 potentiometric surface is below 0 ft NAVD 88 for most of the lower aquifer’s extent in New Jersey. A large regional cone of depression associated with withdrawals in Critical Area II is in the Runnemede and Clementon quadrangles of Camden County where water levels are below −60 ft in altitude. The −40-ft potentiometric surface extends into the adjacent Burlington County in the north and east and near the border of Camden and Gloucester Counties to the west. Groundwater levels in wells adjacent to the Delaware River in the Taylors Bridge quadrangle in Salem County are below −50 ft in altitude. The potentiometric surface in this area is likely affected by local industrial withdrawals and by withdrawals from wells in Delaware. The water level from well 050746 in the Moorestown quadrangle in Burlington County is not consistent with other water levels nearby. The 2018 water level likely does not represent a static condition owing to possible effects of nearby pumping, data collection before water-level recovery, or some other cause.
Hydrographs from eight wells in the lower aquifer of the Potomac-Raritan-Magothy aquifer system are shown in figures 22 (Burlington County), 23 (Camden County), and 24 (Gloucester County). Hydrographs for wells 050274, 050645, 070412, 070476, 150671, and 150742 indicate continued increasing water levels from 2014 to 2019 in response to Critical Area II withdrawal restrictions that began around 1996, and similarly around 1988 for well 050683. The hydrograph of well 150712 indicates a continuation of stable to slightly increasing water levels from 2014 to 2019 as the period beginning in the mid-1980s. This well is outside the Critical Area boundaries and is outside the cone of depression centered in Camden County.
Groundwater-level hydrographs for selected observation wells screened in the lower aquifer of the Potomac-Raritan-Magothy aquifer system in Burlington County, New Jersey, 1978–2019. NAVD 88, North American Vertical Datum of 1988.
Groundwater-level hydrographs for selected observation wells screened in the lower aquifer of the Potomac-Raritan-Magothy aquifer system in Camden County, New Jersey, 1978–2019. NAVD 88, North American Vertical Datum of 1988.
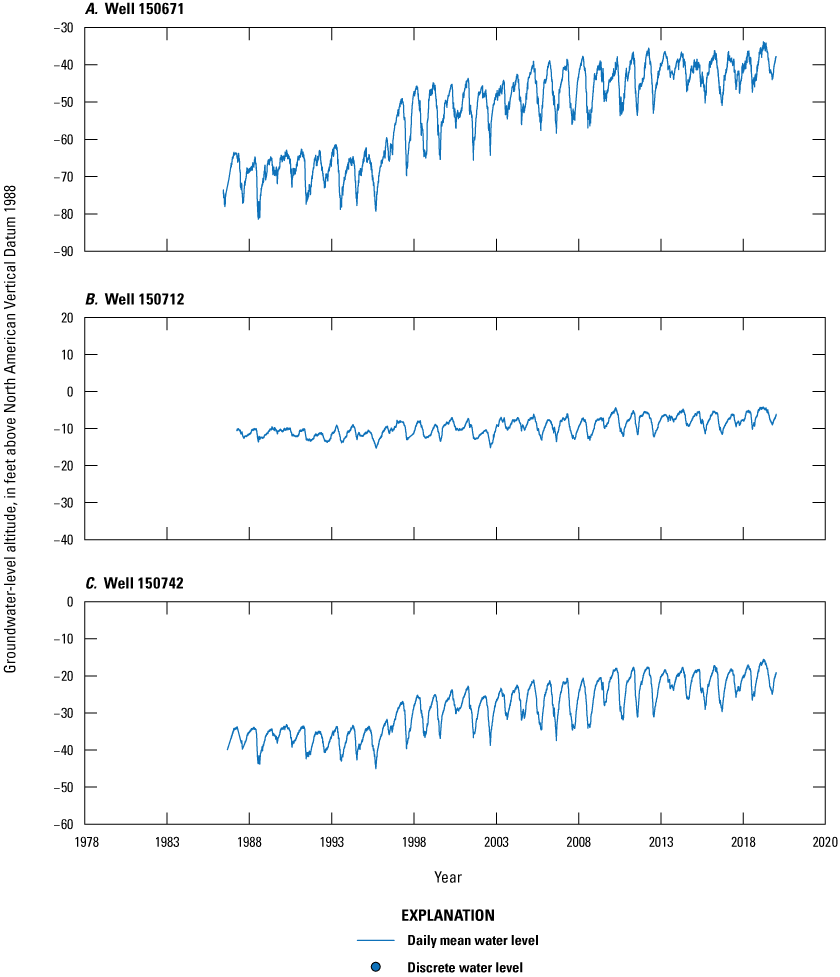
Groundwater-level hydrographs for selected observation wells screened in the lower aquifer of the Potomac-Raritan-Magothy aquifer system in Gloucester, New Jersey, 1978–2019. NAVD 88, North American Vertical Datum of 1988.
Summary
This report evaluates water levels measured in 10 confined aquifers of the New Jersey Coastal Plain during late 2018 and early 2019. Water levels were measured at 951 wells in New Jersey and parts of Pennsylvania and Delaware. The measurements were used to prepare potentiometric-surface maps for the confined Cohansey aquifer, Rio Grande water-bearing zone, Atlantic City 800-foot sand, Piney Point aquifer, Vincentown aquifer, Wenonah-Mount Laurel aquifer, Englishtown aquifer system, and the upper, middle, and lower aquifers of the Potomac-Raritan-Magothy aquifer system. Hydrographs of discrete and continuous daily mean water-level measurements are provided for 75 wells. The maps and hydrographs help water resources managers understand the groundwater conditions in these aquifers and inform decisions to effectively maintain groundwater supply in this region for future use.
A cone of depression in the confined Cohansey aquifer was identified in southern Cape May County. Water levels fluctuated in the aquifer at similar ranges as the historical period from 2014 to 2019.
The Rio Grande water-bearing zone contained a cone of depression within a larger cone of depression in southern Cape May County that extended parallel to the coast into southern Ocean County. Water levels fluctuated in this aquifer at similar ranges as the historical period from 2014 to 2019.
In the Atlantic City 800-foot sand, a cone of depression was centered in Atlantic City, and smaller cones of depression in southern Cape May County and in the southern barrier islands of Ocean County were also identified. From 2014 to 2019, wells in Atlantic County and northern Cape May County indicated increasing water levels that departed from the previous periods of decreasing water levels. Water levels in Cape May County continued to decrease during 2014 to 2019 as the historical period.
In the Piney Point aquifer, a large regional cone of depression was identified in Cumberland County that connects with a cone of depression in Delaware. Another cone of depression was also identified in the barrier islands of Ocean County. Water-level hydrographs in the 2014–19 period indicate continued decreasing water levels in Cumberland County, stable water levels in Burlington and Ocean County, and increasing water levels in Atlantic County.
No cone of depression was indicated by the potentiometric surface maps of the Vincentown aquifer. Water levels in the aquifer fluctuated at similar ranges from 2014 to 2019 as the historical period.
In the Wenonah-Mount Laurel aquifer, a cone of depression centered on the border of Camden and Gloucester Counties was identified, as well as a cone of depression centered in southeastern Monmouth County. Hydrographs indicate that the cone of depression in Camden and Gloucester Counties experienced decreasing water levels from 2014 to 2019 that differed from previous periods. The hydrograph for well 330020 indicated the same continued decreasing water levels as the historical period. All other wells with hydrographs indicated stable water levels fluctuating within historical ranges.
The Englishtown aquifer system included a regional cone of depression in Monmouth and Ocean Counties with smaller cones of depression within the larger area of drawdown. Another cone of depression was identified in Camden County. Water levels in wells in the Monmouth and Ocean Counties’ cone of depression continued increasing from 2014 to 2019 since groundwater withdrawal restrictions were in effect. Hydrographs for wells outside this area of drawdown indicated stable water levels from 2014 to 2019 that fluctuated within historical ranges.
In the upper aquifer of the Potomac-Raritan-Magothy aquifer system, two large cones of depression were identified: one in Ocean County and another in Camden County that extended into adjacent Gloucester and Burlington Counties. A smaller cone of depression was identified in Monmouth County. Hydrographs from wells in Critical Area I and Critical Area II indicated continued increasing water levels from 2014 to 2019. Wells outside critical areas have stable water levels fluctuating within historical ranges.
The middle and undifferentiated aquifer of the Potomac-Raritan-Magothy aquifer system contained a regional cone of depression near the border of Burlington and Camden Counties and smaller cones of depression in Monmouth and Ocean Counties. Hydrographs of wells within Critical Area I exhibited stable water levels during the 2014–19 period and fluctuated within the same range as the historical period. Wells within Critical Area II continued to have stable to gradually increasing water levels from 2014 to 2019 as previous periods. Stable to slightly increasing water levels were indicated for all other wells.
The lower aquifer of the Potomac-Raritan-Magothy aquifer system contained a regional cone of depression in Camden County extending into adjacent Burlington and Gloucester Counties and a cone of depression in Delaware extending into Salem County. Hydrographs indicated continued increasing water levels from 2014 to 2019 ongoing since Critical Area II withdrawal restrictions, and hydrographs for wells outside Critical Area II indicated stable to gradually increasing water levels continuing from 2014 to 2019.
References Cited
Cunningham, W.L., and Schalk, C.W., comps., 2011, Groundwater technical procedures of the U.S. Geological Survey: U.S. Geological Survey Techniques and Methods 1–A1, 154 p., accessed February 28, 2025, at https://doi.org/10.3133/tm1A1.
Delaware Geological Survey, 2020, Recent and historical groundwater level data: Delaware Geological Survey web page, accessed February 28, 2025, at http://data.dgs.udel.edu/sites/groundwater/recent-and-historical-groundwater-level-data.html.
DePaul, V.T., and Rosman, R., 2015, Water-level conditions in the confined aquifers of the New Jersey Coastal Plain, 2008: U.S. Geological Survey Scientific Investigations Report 2013–5232, 107 p., 9 pl., accessed February 28, 2025, at https://doi.org/10.3133/sir20135232.
DePaul, Vincent, Rosman, Robert, and Lacombe, P.J., 2009, Water-level conditions in selected confined aquifers of the New Jersey and Delaware Coastal Plain, 2003: U.S. Geological Survey Scientific Investigations Report 2008–5145, 123 p., 9 pl., accessed April 21, 2025, at https://doi.org/10.3133/sir20085145.
Eckel, J.A., and Walker, R.L., 1986, Water levels in major artesian aquifers of the New Jersey Coastal Plain, 1983: U.S. Geological Survey Water-Resources Investigations Report 86–4028, 62 p., 7 pls., accessed April 21, 2025, at https://doi.org/10.3133/wri864028.
Esri, 2023, An overview of the 3D Analyst toolbox: ArcGIS Pro Tool Reference web page, accessed March 16, 2023, at https://pro.arcgis.com/en/pro-app/latest/tool-reference/3d-analyst/an-overview-of-the-3d-analyst-toolbox.htm.
Fiore, A.R., Cauller, S.J., and Brown, E.J., 2025, Geospatial data representing wells open to, and 2018 potentiometric surface contours of, the confined aquifers of the New Jersey Coastal Plain: U.S. Geological Survey data release, https://doi.org/10.5066/P9AT8Z9B.
Gordon, A.D., and Carleton, G.B., 2023, Updates to the regional groundwater-flow model of the New Jersey Coastal Plain, 1980–2013: U.S. Geological Survey Scientific Investigations Report 2023–5066, 117 p., accessed April 21, 2025, at https://doi.org/10.3133/sir20235066.
Gordon, A.D., Carleton, G.B., and Rosman, R., 2021, Water-level conditions in the confined aquifers of the New Jersey Coastal Plain, 2013: U.S. Geological Survey Scientific Investigations Report 2019–5146, 104 p., 9 pl., accessed February 28, 2025, at https://doi.org/10.3133/sir20195146.
Kauffman, L.J., 2024, Simulated effects of projected 2014–40 withdrawals on groundwater flow and water levels in the New Jersey Coastal Plain: U.S. Geological Survey Scientific Investigations Report 2024–5028, 149 p., accessed April 21, 2025, at https://doi.org/10.3133/sir20245028.
Lacombe, P.J., and Rosman, R., 1997, Water levels in, extent of freshwater in, and water withdrawals from eight major confined aquifers, New Jersey Coastal Plain, 1993: U.S. Geological Survey Water-Resources Investigations Report 96–4206, 8 pls., accessed April 21, 2025, at https://doi.org/10.3133/wri964206.
Lacombe, P.J., and Rosman, R., 2001, Water levels in, extent of freshwater in, and water withdrawals from ten major confined aquifers, New Jersey and Delaware Coastal Plain, 1998: U.S. Geological Survey Water-Resources Investigations Report 00-4143, 10 pls., accessed April 21, 2025, at https://doi.org/10.3133/wri004143.
New Jersey Geological and Water Survey, 2022, New Jersey water transfer model withdrawal, use, and return data summaries: New Jersey Geological and Water Survey Digital Geodata Series DSG10-3, accessed February 10, 2025, at https://dep.nj.gov/njgws/digital-data/dgs-10-3/.
Pope D.A., and Gordon, A.D., 1999, Simulation of ground-water flow and movement of the freshwater-saltwater interface in the New Jersey coastal plain: U.S. Geological Survey Water-Resources Investigations Report 98–4216, 159 p., accessed February 28, 2025, at https://doi.org/10.3133/wri984216.
Rosman, R., Lacombe, P.J., and Storck, D.A., 1995, Water levels in major artesian aquifers of the New Jersey Coastal Plain, 1988: U.S. Geological Survey Water-Resources Investigations Report 95-4060, 74 p., 8 pl., accessed February 28, 2025, at https://doi.org/10.3133/wri954060.
Spitz, F.J., and DePaul, V.T., 2008, Recovery of ground-water levels from 1988 to 2003 and analysis of effects of 2003 and full-allocation withdrawals in Critical Area 2, southern New Jersey: U.S. Geological Survey Scientific Investigations Report 2008–5141, 28 p., accessed September 18, 2025, at https://doi.org/10.3133/sir20085142.
Spitz, F.J., Watt, M.K., and DePaul, V.T., 2008, Recovery of ground-water levels from 1988 to 2003 and analysis of potential water-supply management options in Critical Area 1, east-central New Jersey: U.S. Geological Survey Scientific Investigations Report 2007–5193, 40 p., accessed September 18, 2025, at https://doi.org/10.3133/sir20075193.
Sugarman, P.J., and Carone, A.R., Stroiteleva, Y., and Barr, K., 2022, Framework and properties of aquifers in the Coastal Plain portion of Mercer and Middlesex Counties, New Jersey: New Jersey Geological and Water Survey Open File Map OFM 148, accessed January 6, 2025, at https://www.nj.gov/dep/njgs/pricelst/ofmap/ofm148.pdf.
Sugarman, P.J., Carone, A.R., Stroiteleva, Y., Pristas, R.S., Monteverde, D.H., Domber, S.E., Filo, R.M., Rea, F.A., and Schagrin, Z.C., 2018, Framework and properties of aquifers in Burlington County, New Jersey: New Jersey Geological and Water Survey Geologic Map Series GMS 18-3, accessed January 6, 2025, at https://www.nj.gov/dep/njgs/pricelst/gmseries/gms18-3.pdf.
Sugarman, P.J., Johnson-Bowman, M., Malerba, N.L., Stroiteleva, Y., Barr, K., Filo, R.M., Carone, A.R., Monteverde, D.H., Castelli, M.V., and Pristas, R.S., 2020, Framework and properties of aquifers in Atlantic County, New Jersey: New Jersey Geological and Water Survey Open File Map OFM 130, accessed January 6, 2025, at https://dep.nj.gov/wp-content/uploads/njgws/maps/ofmap/ofm130.pdf.
Sugarman, P.J., Miller, K.G., Browning, J.V., Kulpecz, A.A., McLaughlin, P.P., Jr., and Monteverde, D.H., 2005, Hydrostratigraphy of the New Jersey Coastal Plain—Sequences and facies predict continuity of aquifers and confining units: Stratigraphy, v. 2, no. 3, p. 259–275, accessed February 10, 2025, at https://doi.org/10.29041/strat.02.3.04.
Sugarman, P.J., and Monteverde, D.H., 2008, Correlation of deep aquifers using coreholes and geophysical logs in parts of Cumberland, Salem, Gloucester, and Camden Counties, New Jersey: New Jersey Geological and Water Survey Geologic Map Series 08-1, accessed January 6, 2025, at https://www.nj.gov/dep/njgs/pricelst/gmseries/gms08-1.pdf.
Sugarman, P.J., Monteverde, D.H., Boyle, J.T., and Domber, S.E., 2019, Aquifer correlation map of Monmouth and Ocean Counties, New Jersey: New Jersey Geological and Water Survey Geologic Map Series 13-1, accessed April 21, 2025, at https://www.nj.gov/dep/njgs/pricelst/gmseries/gms13-1.pdf.
Sugarman, P.J., Monteverde, D.H., Stanford, S.D., and Johnson, S.W., Stroiteleva, Y., Pristas, R.S., Vandegrift, K., and Domber, S.E, 2016, Geologic and aquifer map of Cape May County, New Jersey: New Jersey Geological and Water Survey Geologic Map Series 16-1, accessed January 6, 2025, at https://www.nj.gov/dep/njgs/pricelst/gmseries/gms16-1.pdf.
U.S. Census Bureau, 2023, County population by characteristics—2010–2019: United States Census Bureau web page, accessed on July 6, 2023, at https://www.census.gov/data/datasets/time-series/demo/popest/2010s-counties-detail.html.
U.S. Geological Survey, 2022, USGS water data for the Nation: U.S. Geological Survey National Water Information System database, accessed May 15, 2022, at http://doi.org/10.5066/F7P55KJN.
Vroblesky, D.A., and Fleck, W.B., 1991, Hydrogeologic framework of the Coastal Plain of Maryland, Delaware, and the District of Columbia: U.S. Geological Survey Professional Paper 1404-E, 45 p., 2 pls., accessed February 10, 2025, at https://doi.org/10.3133/pp1404E.
Walker, R.L., 1983, Evaluation of water levels in major aquifers of the New Jersey Coastal Plain, 1978: U.S. Geological Survey Water-Resources Investigations Report 82–4077[56] p., accessed April 21, 2025, at https://doi.org/10.3133/wri824077.
Zapecza, O.S., 1989, Hydrogeologic framework of the New Jersey Coastal Plain: U.S. Geological Survey Professional Paper 1404-B, 49 p., 24 pls., accessed February 10, 2025, at https://doi.org/10.3133/pp1404B.
Zapecza, O.S., Voronin, L.M., and Martin, M., 1987, Ground-water-withdrawal and water-level data used to simulate regional flow in the major Coastal Plain aquifers of New Jersey: U.S. Geological Survey Water-Resources Investigations Report 87–4038, 120 p., accessed February 10, 2025, at https://doi.org/10.3133/wri874038.
Conversion Factors
U.S. customary units to International System of Units
Datums
Vertical coordinate information is referenced to the North American Vertical Datum of 1988 (NAVD 88).
Horizontal coordinate information is referenced to the North American Datum of 1983 (NAD 83).
Altitude, as used in this report, refers to distance above the vertical datum.
Supplemental Information
Concentrations of chemical constituents in water are in either milligrams per liter (mg/L) or grams per cubic centimeter (g/cm3).
For information about the research in this report, contact
Director, New Jersey Water Science Center
U.S. Geological Survey
3450 Princeton Pike, Suite 110 Lawrenceville, New Jersey 08648
https://www.usgs.gov/centers/new-jersey-water-science-center
Publishing support provided by the U.S. Geological Survey, Science Publishing Network, Baltimore Publishing Service Center
Edited by Brent Trickett
Disclaimers
Any use of trade, firm, or product names is for descriptive purposes only and does not imply endorsement by the U.S. Government.
Although this information product, for the most part, is in the public domain, it also may contain copyrighted materials as noted in the text. Permission to reproduce copyrighted items must be secured from the copyright owner.
Suggested Citation
Fiore, A.R., Cauller, S.J., and Brown, E.J., 2025, Potentiometric surface maps and groundwater-level hydrographs for confined aquifers of the New Jersey Coastal Plain, 2018: U.S. Geological Survey Scientific Investigations Report 2025–5080, 37 p., 9 pls., https://doi.org/10.3133/sir20255080.
ISSN: 2328-0328 (online)
Study Area
| Publication type | Report |
|---|---|
| Publication Subtype | USGS Numbered Series |
| Title | Potentiometric surface maps and groundwater-level hydrographs for confined aquifers of the New Jersey Coastal Plain, 2018 |
| Series title | Scientific Investigations Report |
| Series number | 2025-5080 |
| DOI | 10.3133/sir20255080 |
| Publication Date | September 30, 2025 |
| Year Published | 2025 |
| Publisher | U.S. Geological Survey |
| Publisher location | Reston, VA |
| Contributing office(s) | New Jersey Water Science Center |
| Description | Report: viii, 37 p.; 9 Plates: 19.50 x 26.50 inches; Data Release |
| Country | United States |
| State | New Jersey |
| Other Geospatial | Coastal Plain |
| Online Only (Y/N) | Y |
| Additional Online Files (Y/N) | N |