

Regional Hydraulic Geometry Characteristics of Stream Channels in the Boston Mountains in Arkansas
Links
- Document: Report (2.39 MB pdf) , HTML , XML
- Data Release: USGS Data Release - Hydraulic geometry of stream channels in the Boston Mountains of Arkansas
- NGMDB Index Page: National Geologic Map Database Index Page
- Download citation as: RIS | Dublin Core
Acknowledgments
This work was partially funded through cooperative agreements with U.S. Army Corps of Engineers, Little Rock District. We would like to thank Ronald Redman (currently with Mitigation Surveying Services, LLC) for his work on this project while he was with the Arkansas Department of Energy and Environment, Division of Environmental Quality.
Special thanks to Walter Killion (U.S. Geological Survey) for his assistance in surveying and his knowledge of these sites. Without his hard work and dedication, this study would not have been possible.
Abstract
Many stream-channel infrastructure, habitat enhancement, and restoration projects are undertaken on streams throughout Arkansas by Federal, State, and local agencies as well as by private organizations and businesses with limited data on local geomorphology and streamflow conditions. Equations that relate drainage area above stable stream reaches to the basin characteristics, bankfull streamflow, and the associated channel dimensions can be used to estimate stream conditions. These equations, along with streambed material particle information, provide information that can be used to improve stream-channel projects. The U.S. Geological Survey, in cooperation with the U.S. Army Corps of Engineers, Little Rock District, completed a study to develop these equations for streams in the Boston Mountains in Arkansas.
Fourteen U.S. Geological Survey streamgages and stream reaches located in the Boston Mountains were selected for analysis. Geomorphic parameters of streams, including the mean bankfull channel dimensions (cross-sectional area, top width, mean depth, and streamflow), and the contributing drainage areas were investigated. Streambed materials were collected at eight of these sites to develop descriptive statistics of the streambed particle-size distributions and percentages of substrate type. Stream reaches at each study site were classified to Rosgen level II stream type based on the averages of stream-channel metrics collected from site cross sections and profiles. Of the 14 selected Boston Mountain stream reaches, 7 were classified as B-type streams, and 7 were classified as C-type streams. For these streams, the significant differences in measured parameters between stream types were that the B-type streams had greater depth, hydraulic radii, and bar D50 and D85 particle sizes, while C-type streams had greater watershed slopes. Streambed material particle size decreased with mean drainage basin elevation and decreased with increasing entrenchment ratios. Bar sediment size exhibited decreasing size with increasing sinuosity. Regional hydraulic geometry curves were constructed for the streams in the Boston Mountains by plotting measured bankfull geometry dimensions from stable reaches and the associated bankfull streamflow against the contributing drainage area.
Introduction
Natural stream channels systematically adjust their form, dimension, and slope through natural fluvial processes to establish and maintain equilibrium between streamflow and the erosion, transport, and deposition of sediment (Wolman, 1955; Leopold and others, 1964; Rosgen, 1996). When a natural stream channel exhibits long-term stability, it may laterally reposition (meander) itself in its valley and (or) undergo minor aggradation or degradation of the streambed over time without excessive changes in the mean top width and mean depth. Conversely, when a natural stream channel is unstable, there is an imbalance between the erosive and depositional forces. This imbalance may cause extreme lateral movement and streambed aggradation or degradation resulting in large changes in the mean top width and mean depth and excessive streambank erosion (Hupp and Simon, 1991; Pierce and King, 2008; Kroes and Hupp, 2010). The overall stability of a stream channel and the rate of associated stream-channel adjustments are the direct result of natural and (or) anthropogenic changes in hydrology or sediment supply imposed on the watershed and (or) channel.
The properties of the sediment transported along the streambed (bedload) play a role in the overall stability of the stream channel (Wolman, 1955; Leopold and others, 1964). Bedload is the part of the total sediment load that is transported by streamflow and intermittent contact with the streambed by rolling, sliding, or bouncing. The bedload transport process is controlled by the interaction between the stream-channel hydraulics and streambed material conditions that govern the stream-channel geomorphology. Knowledge of bedload transport is necessary to understand the causes and consequences of changes in fluvial form and to make informed management decisions that affect stream-channel geomorphology and function.
Scientists and engineers have long resorted to classification schemes as a means of describing the variability of the physical nature of rivers. Recent stream classification systems are process based and incorporate characteristics of the cross section, longitudinal profile, and channel materials (Schumm and others, 1984; Simon and Hupp, 1986; Simon, 1989; Montgomery and Buffington, 1993; Whiting and Bradley, 1993; Rosgen, 1994, 1996). Rosgen (1996) developed a stream classification system to (1) address specific, applied objectives related to conditions and processes; (2) predict behavior from appearance and develop specific hydraulic and sediment relations for given stream types; (3) provide a mechanism for extrapolation of site-specific data to streams of similar types; and (4) provide a consistent frame of reference to aid communication about stream geomorphology and condition among various disciplines.
Within stream classification systems, regional hydraulic geometry curves are a planning tool used for evaluating similar river types while still accounting for variations in stream drainage areas. The curves help with estimations of site-specific stream conditions for stream assessments, natural stream design, stream restoration, and habitat enhancement (Rosgen, 1994; U.S. Army Corps of Engineers [USACE], 1994; Brookes and Shields, 1996; Thorne and others, 1997). Regional hydraulic geometry curves are empirical relations constructed from observations of bankfull dimensions (the reach mean elevation where a streambank makes a topographic break in slope from within the channel and the wetted width begins to rapidly increase with stage) and other measurements made at stable stream reaches on gaged streams within a relatively homogeneous region as they relate to drainage area. Bankfull geometry dimensions are developed from topographic surveys at stable stream reaches and include point locations defining the channel thalweg, bankfull profiles, and riffle and pool cross sections. Regression equations derived from hydraulic geometry curves express the mathematical relation (power functions, Y = aXb) between the bankfull channel dimensions (Y) and the contributing drainage areas (X) for stable stream reaches within the same physiographic area. The curves and equations created for gaged streams can be used to provide estimates of bankfull channel dimensions and bankfull streamflow and to allow for comparisons to be made between riffle dimensions at stable, ungaged streams within the same physiographic region. Stream-channel projects using natural channel design are often based on bankfull streamflow and basin characteristics to ensure that the channel accommodates the streamflow and sediment transport without excessive erosion or deposition.
Purpose and Scope
The U.S. Geological Survey (USGS), in cooperation with the USACE, Little Rock District, conducted this study, in part, to provide the USACE Regulatory (Permits) program with fluvial geomorphic information to better fulfill the mission of protecting the aquatic resources of the Nation while allowing reasonable development through fair, flexible, and balanced permit decisions. The USACE evaluates permit applications for essentially all construction activities that occur in waterways in the United States (refer to United States Title 33 Code of Federal Regulations, Parts 320 through 330). Considerations in these evaluations may include the elevation, sizing, and materials used in the design of bridges, culverts, and bank armoring that can be calculated using regional hydraulic geometry curves.
This report documents the physical and hydrologic environment of the Boston Mountains in Arkansas, and the methods used to collect and analyze data for the development of a set of regional hydrologic geometry curves. This work supports a major goal of the USGS Water Mission Area Science Strategy (Evenson and others, 2013, p. 32) to “predict changes in the quantity and quality of water resources in response to changing climate, population, land use, and management scenarios.” The data collection and analyses conducted as part of this study can help to improve the understanding of the geomorphology and stability of streams and provide a way to evaluate the potential effects of natural and anthropogenic changes within watersheds of streams of the Boston Mountains. The scope of this investigation was confined to streams in the Boston Mountains physiographic section (fig. 1; Fenneman, 1938) that have streamflow measurement data collected by the USGS (table 1). The report structure, study objectives, and methods mirror those of Pugh and Redman (2019).
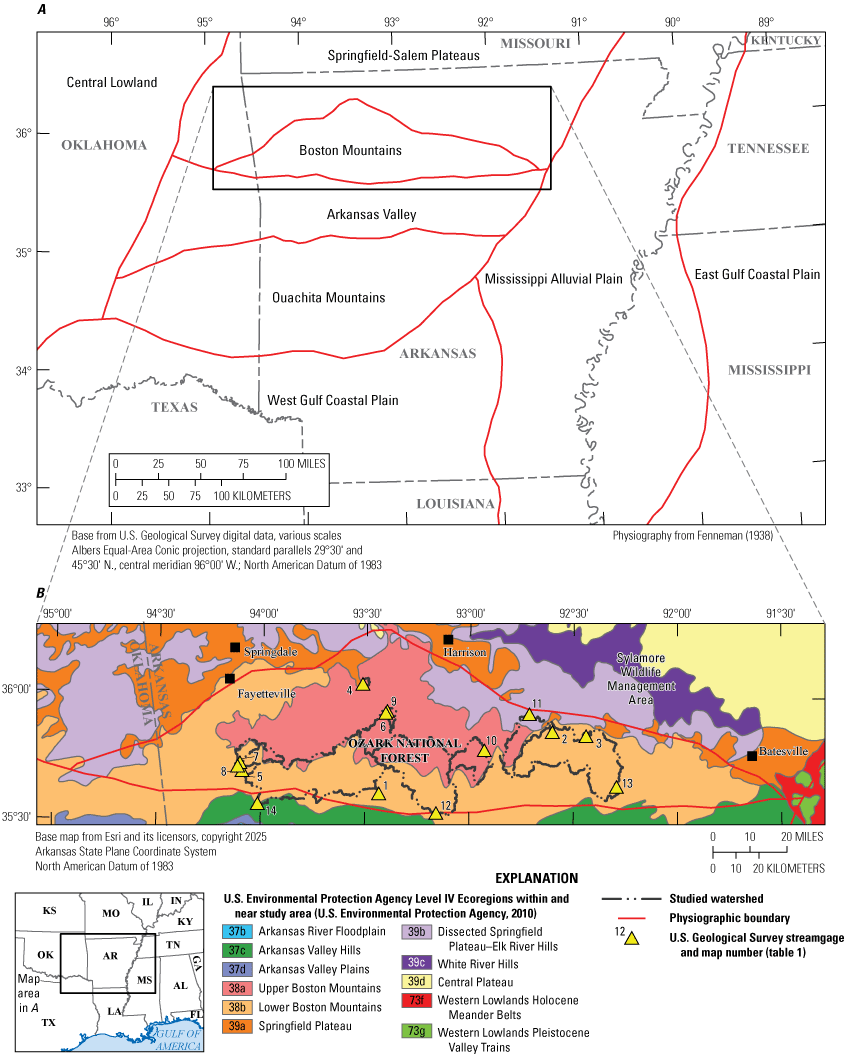
Maps showing A, physiographic sections of the south-central United States, the Boston Mountains and B, watersheds, sites and U.S. Environmental Protection Agency (EPA) Level IV Ecoregions associated with the Boston Mountains study area in Arkansas.
Table 1.
Selected USGS streamgage stations in the Boston Mountains in Arkansas (USGS, 2024).[USGS, U.S. Geological Survey; AR, Arkansas; mi2, square mile; DD, Decimal Degrees; NAD 83, North American Datum of 1983; HUC, hydrologic unit code]
| Map number (fig. 1B) |
USGS station number | USGS station name | Drainage area (mi2) | Latitude (DD, NAD 83) | Longitude (DD, NAD 83) | County | 8-digit HUC |
|---|---|---|---|---|---|---|---|
| 1 | 07257060 | Mikes Creek Tributary near Ozone, AR | 0.19 | 35.6237 | −93.4341 | Johnson | 11110202 |
| 2 | 07074900 | Trace Creek Tributary near Marshall, AR | 0.24 | 35.8706 | −92.6024 | Searcy | 11010014 |
| 3 | 07074950 | Tick Creek near Leslie, AR | 1.58 | 35.8555 | −92.4400 | Searcy | 11010014 |
| 4 | 07050200 | Maxwell Creek at Kingston, AR | 2.75 | 36.0517 | −93.5175 | Madison | 11010001 |
| 5 | 07250974 | Jack Creek near Winfrey, AR | 6.87 | 35.7044 | −94.0917 | Crawford | 11110201 |
| 6 | 07055650 | Smith Creek near Boxley, AR | 8.33 | 35.9472 | −93.3978 | Newton | 11010005 |
| 7 | 07250935 | Jones Creek at Winfrey, AR | 20.3 | 35.7358 | −94.1031 | Crawford | 11110201 |
| 8 | 07250965 | Frog Bayou at Winfrey, AR | 54.9 | 35.7222 | −94.1136 | Crawford | 11110201 |
| 9 | 07055646 | Buffalo River near Boxley, AR | 59.2 | 35.9389 | −93.4050 | Newton | 11010005 |
| 10 | 07055875 | Richland Creek near Witts Spring, AR | 67.3 | 35.7972 | −92.9289 | Searcy | 11010005 |
| 11 | 07056515 | Bear Creek near Silver Hill, AR | 78.5 | 35.9400 | −92.7133 | Searcy | 11010005 |
| 12 | 07257000 | Big Piney Creek near Dover, AR | 274 | 35.5494 | −93.1583 | Pope | 11110202 |
| 13 | 07075000 | Middle Fork of Little Red River at Shirley, AR | 302 | 35.6567 | −92.2928 | Van Buren | 11010014 |
| 14 | 07252000 | Mulberry River near Mulberry, AR | 373 | 35.5769 | −94.0153 | Franklin | 11110201 |
Data Release
Many of the larger datasets or tables assembled for this study are not presented in this report but are publicly available in a USGS data release (Kroes and Ruhl-Whittle, 2025). These supporting files include the following:
-
• A geographic information system (GIS) geopackage of the study site locations, the associated contributing watersheds, and the individual latitudinal and longitudinal survey points of the streams and stream valleys.
-
• Comma-separated value files of the streambed and point bar particle measurements made at stream reaches and the associated graphs of particle-size distributions and particle-shape analysis.
-
• A comma-separated value file containing the USGS streamgage location, basin characteristics, bankfull channel characteristics, and stream classification for each site.
-
• A comma-separated value file containing descriptions of the selected study sites including the reach beginning and ending locations; the geology and soils at the reach; the land cover within the watershed; the streambed substrate type within the reach; the entrenchment ratio, width-to-depth ratio, and sinuosity for the reach; the observed reach geomorphology; and the stream type classification for the reach.
-
• Photographs documenting the selected stream reaches.
Description of the Boston Mountains
The current conditions of streams and their watersheds are the result of the interactions between the local geology, land cover, and climate. To characterize the watersheds of the mountains, it is essential to understand how the landscape has evolved over time on human and geological time scales. This section contains descriptions of the location, topography, geology, soils, land cover, population, and climate of the Boston Mountains in Arkansas.
Location
The Boston Mountains are in north-central Arkansas and northeastern Oklahoma, extending approximately 200 miles from Independence County, Ark., westward to Muskogee County, Okla., and approximately 40–50 miles from the Ozark Highlands southward to the northern margin of the Arkansas Valley. The Boston Mountains are located within the Boston Mountains physiographic section (fig. 1; Fenneman, 1938). Generally, the Boston Mountains physiographic section lies within the Boston Mountains U.S. Environmental Protection Agency (EPA) Level III Ecoregion with inclusions in the Ozark Highlands and Arkansas Valley (Omernik, 1987). The EPA has further divided the study area into six Level IV Ecoregions (fig. 1B; EPA, 2010; Omernik and Griffith, 2014).
The Boston Mountains in Arkansas are contained within nine watersheds, or hydrologic units, that are part of the Arkansas-White-Red regional (2-digit code) hydrologic unit (table 2; fig. 2). The Boston Mountains are within two subregional hydrologic units—the Upper White and the Lower Arkansas. The percentages of the Boston Mountains in Arkansas within specific hydrologic units (table 2) were determined by extracting the hydrologic unit code (HUC) shapefile (U.S. Geological Survey, 2016) using extract by mask in ArcGIS Pro to the area contained within the Boston Mountains physiographic section (Fenneman, 1938; Esri, 2023). Areas of the extracted HUCs were divided by the total area of the Boston Mountains physiographic section (fig. 2). The Boston Mountains are primarily within the Beaver Reservoir (HUC 11010001; 23 percent), the Buffalo (HUC 11010005; 20 percent), the Little Red (HUC 11010014; 19 percent), and the Dardanelle Reservoir (HUC 11110202; 12 percent) hydrologic units.
Table 2.
Hydrologic units within the Boston Mountains in Arkansas.[HUC, hydrologic unit code. Boston Mountains boundary from Fenneman (1938); watershed boundaries from U.S. Geological Survey (2016)]
| Watershed name and HUC | Percentage of Boston Mountains in cataloging unit | |||
|---|---|---|---|---|
| Regional (2-digit HUC) |
Subregional (4-digit HUC) |
Accounting (6-digit HUC) |
Cataloging (8-digit HUC; fig. 2) | |
| Arkansas-White-Red (11) | Upper White (1101) | Upper White (110100) | Beaver Reservoir (11010001) | 23 |
| Bull Shoals Lake (11010003) | 5.9 | |||
| Middle White (11010004) | 20 | |||
| Buffalo (11010005) | 0.7 | |||
| Little Red (11010014) | 19 | |||
| Lower Arkansas (1111) | Robert S. Kerr Reservoir (111101) | Illinois (11110103) | 2.5 | |
| Robert S. Kerr Reservoir (1110104) | 7.2 | |||
| Lower Arkansas-Fourche La Fave (111102) | Frog-Mulberry (1110201) | 10 | ||
| Dardanelle Reservoir (11110202) | 12 | |||
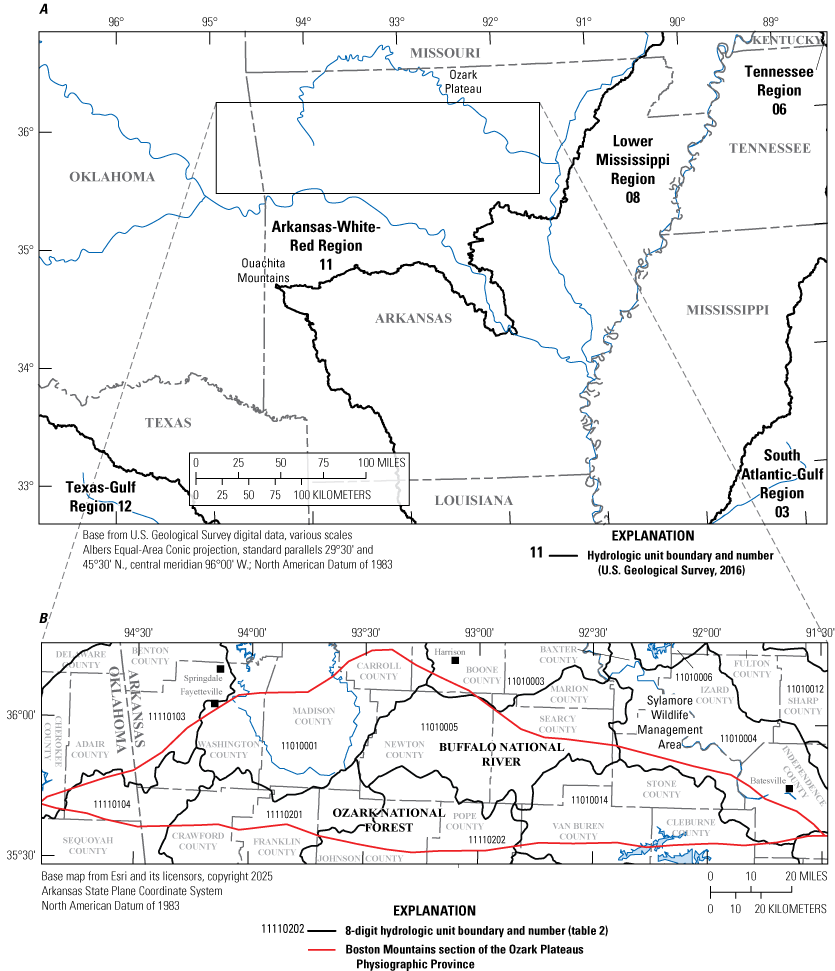
Maps showing A, the Arkansas-White-Red regional hydrologic unit, B, counties within and surrounding the Boston Mountains, and the 8-digit hydrologic units associated with the Boston Mountains study area in Arkansas.
Topography
The Boston Mountains in Arkansas are the eroded and uplifted southern extent of the Ozark Plateau. This mountain range spans an area that is about 35 miles north to south and about 200 miles east to west (Purdue, 1907). The relief, or differences in elevation from the valley floors to the ridgetops, generally ranges from 300 to 1,500 feet (ft) (Maxfield, 1964). The maximum elevation of the range is at Wahzhazhe Summit (formerly Buffalo Lookout, 2,561 ft, North American Vertical Datum of 1988 [NAVD 88]; USGS, 1967). The Boston Mountains are a plateau that is dissected by numerous streams that have cut deep, narrow stream valleys with large streambeds ranging in elevation from 260 to 850 ft, NAVD 88 (McKeown and others, 1988). Along the northern border of these mountains is an escarpment with many valleys eroded by northward-flowing streams. “This escarpment is highest in its middle portion and gradually falls off eastward and westward to the borders of the area” (Purdue, 1907, p. 1). To the south, the mountains gradually slope into the Arkansas Valley (Purdue, 1907).
Geology
All the rocks exposed within the Boston Mountains are of sedimentary origin and consist of sandstones, shales, and limestones. The sandstones and shales were formed of muds, sands, and organic material that were transported from adjacent land areas by streams and deposited over the bottom of the sea when the Boston Mountains and neighboring regions were beneath sea level. Deposited fine-sediment muds containing a large amount of carbonaceous matter subsequently became consolidated, forming the shales. Coarse material (loose sand) became consolidated, forming the sandstones. The limestones were formed largely of shells and other parts of animals that lived in the seas at that time. The rocks are consolidated but not metamorphosed. No igneous or volcanic rocks occur at the surface within the Boston Mountains. The formations that occur at the surface in the Boston Mountains are all Carboniferous. The northern edge of the Boston Mountains is Mississippian, and most of the southern area is predominantly Pennsylvanian (fig. 3; Purdue, 1907). The Arkansas Geological Survey 1:500,000-scale geologic map of Arkansas, including a stratigraphic column of the geological formations underlying Arkansas, as well as the formation age, geologic history, distribution, and formation description, is provided in Haley and others (1993) (fig. 4).
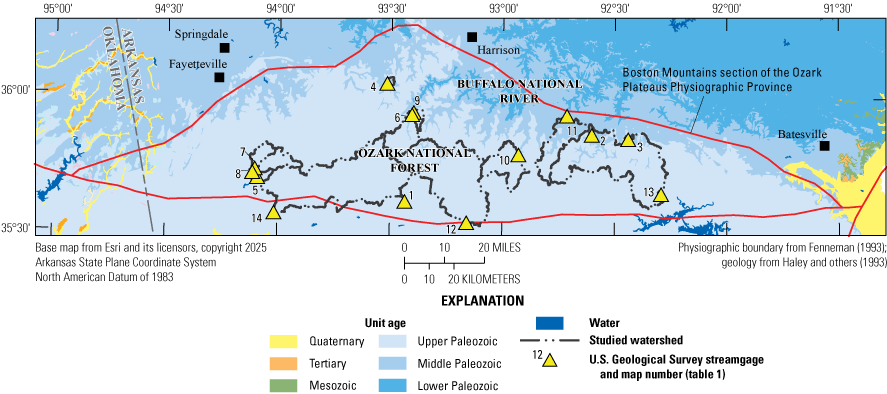
Map showing generalized surficial geology units of the Boston Mountains study area in Arkansas.
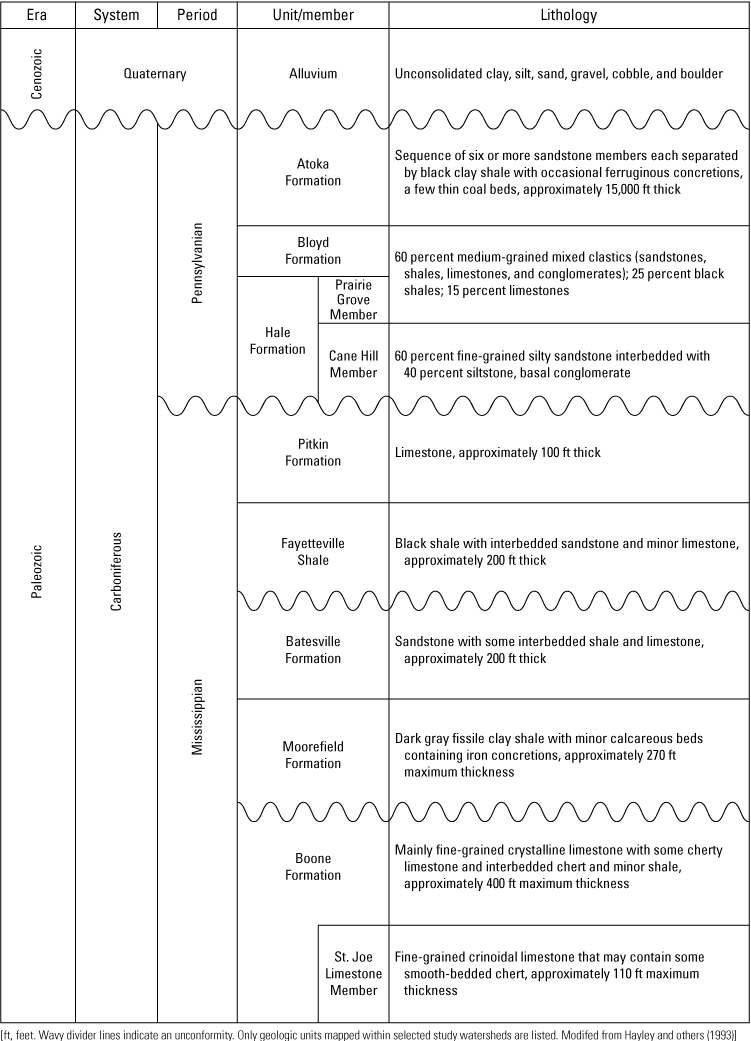
Stratigraphic chart showing notable geologic units in the Boston Mountains study area in Arkansas.
The rocks of the northern and middle parts of the Boston Mountains are mainly horizontal. The structure of the southern portion of the Boston Mountains is monoclinal, with the rocks dipping southward, generally at a low but perceptible angle. Faulting occurs along the east-west line where the Boston Mountains extend into the Arkansas Valley. The downthrow of these faults is on the south side of the mountains (Purdue, 1907).
The endurance of the Boston Mountains’ elevation relative to the erosion observed along their northern boundary and the southern boundary of the Springfield-Salem Plateaus is because of the flat anticline structure of the Boston Mountains. The geologic structure of the mountains determined the location of the drainage divide, and the principal agents of erosion were headwater streams. In some areas of the mountains, massive beds of sandstone that were resistant to erosion also contributed to the preservation of the mountains. Notably, the thick ledges of the Atoka Formation formed steep slopes to the north and south of the divide. Steep slopes in the Boston Mountains caused the streams that flow northward and southward from the divide to be swift, resulting in entrenched floodplains and channels without substantial lateral cutting or meandering. Alternating layers of hard (resistant) and soft (erosive) rock have resulted in numerous waterfalls and rapids with outcropping of the harder layers. Streams primarily developed in the direction of the dip and strike of rocks with few streams developing in other directions (Purdue, 1907).
Soils
Soils develop horizons that form because of persistent physical and chemical weathering processes acting on the parent material. Soils that form in similar parent material, age, topography, and climate have soil horizons that are similar in texture, structure, colors, and thickness. The soils in the study area are primarily Ultisols that are intensively weathered and characterized by low fertility. Soils in this order are acidic because of long periods of weathering during the Pleistocene and Holocene Epochs (Hoelscher and others, 1975). These soils form in humid climates under pine-hardwood forests and are generally moist throughout the year. The soils are strongly leached and are generally of medium texture and moderate permeability (Steila and Pond, 1989). Within the Boston Mountains, soils are of the suborder Udults (Nofziger, 2000). They are stony and nonstony, with medium texture and siliceous or mixed mineralogy. Ridgetops, benches, and upper slopes are well drained, shallow, and moderately deep (Mountainburg and Linker series). Middle and lower slopes and concave inter-ledge positions are well-drained, deep Paleudults (Nella series) and Hapludults (Enders series). Stream floodplains are Udifluvents (Ceda series) and Hapludults (Spadra series), and valley terraces are Fragiudults (Leadvale and Taft series) and Hapludults (Pickwick series) (Nofziger, 2000).
Land Cover and Population
Oak and hickory forests are the major land cover, with pasture and hay lands within broader stream valleys. Northern red oak (Quercus rubra), southern red oak (Quercus falcata), white oak (Quercus alba), and hickories (Carya spp.) typically dominate the uplands, but shortleaf pine (Pinus echinata) grows on drier, south- and west-facing slopes underlain by sandstone. Pasture or hay lands occur on nearly level ridgetops, benches, and valley floors (EPA, 2010). About 14 percent of the Boston Mountains study area has been cleared of natural vegetation for agricultural use. The major agricultural farming activities are pasture and hay land according to the National Land Cover Database (NLCD; Dewitz, 2023). From 1973 to 2000, net forest land cover was reduced by 1.7 percent, mechanically disturbed (clear cut or cleared) increased by 1 percent, and agriculture increased by 0.7 percent (Karstensen, 2009).
The Boston Mountains are generally sparsely populated; the largest population center, the Fayetteville metropolitan area (547,000 population), is located along the northwestern edge of the Boston Mountains (fig. 1B; U.S. Census Bureau, 2020). Boone, Carroll, Independence, Madison, Pope, and Washington Counties (fig. 2B) increased in population from 2010 to 2020, while the population in Cleburne, Conway, Newton, Searcy, Stone, and Van Buren Counties (fig. 2B) either remained stable or decreased (U.S. Census Bureau, 2020).
Climate
The mean annual temperature (1895–2013) for Fayetteville, Ark., was 58 degrees Fahrenheit (°F). The mean temperature for April through September was 71 °F, and the mean temperature for October through March was 45 °F (1895–2013). Extended warm and humid periods were common in summer (Office of the Arkansas State Climatologist, 2014).
Annual precipitation totals (1895–2013) ranged roughly from 45 to 55 inches (in.) (Office of the Arkansas State Climatologist, 2014). Precipitation results from middle latitude cyclones (lows), with warm, cold, and other frontal situations; tropical lows from the Gulf of America; and thunderstorms, or orographic uplift, caused by hills and mountains. Rainfall was generally abundant throughout the year. The dry months in Fayetteville were January and February, averaging 2.5 and 2.4 in. of precipitation, respectively. The number of days with measurable precipitation averaged about 100 per year. Most of the precipitation fell as rain. Heavy local storms that result in precipitation totals from 5 to 10 in. over extensive areas are common. During fall, winter, and early spring, precipitation events are usually less intense and of longer duration than during the summer. The mean annual snowfall total was 5 in. Snowfall was generally light and remains on the ground only briefly, but rare winter storms do occur with accumulations of as much as 10 in. during a 24-hour period. Ice storms were also infrequent but can be severe. On average, 26 tornadoes were reported each year (1950-2013) and generally occurred during the spring months (Office of the Arkansas State Climatologist, 2014; U.S. Climate Data, 2024).
Methods
The following discussions describe the selection of study reaches and the sampling methods used at each location. Sampling methods included stream geometry surveys, streambed material particle sampling, and digital photography documentation.
Reach Selection
At various times over the past 80 years, the USGS has maintained and operated approximately 40 streamgages throughout the Boston Mountains. Based on the criteria listed below, 14 study reaches associated with these streamgages were selected for analysis (table 1; fig. 1).
-
• The streamgage had approximately 20 years or more of flow record (USGS, 2025).
-
• Less than 3 percent of the watershed above the streamgage was classified as urban (developed land cover), not including developed open space (Dewitz, 2023).
-
• Streams had no flow-controlled impoundments in the drainage basin above the streamgage. Run of the river type impoundments were permissible.
-
• Upon inspection, the stream was stable upstream and downstream of the streamgage without excessive streambank failure and without excessive aggradation or degradation of the streambed.
-
• Drainage basins were selected to incorporate a range of sizes and geographic distributions across the Boston Mountains and facilitate development of representative regional curves.
Land Cover and Use Analysis
Land cover is the vegetation and physical material covering the Earth’s surface. Data from the NLCD 2021 (Dewitz, 2023) were used to determine the land cover and use of each of the watersheds above the selected stream reaches. The watersheds of the selected study reach streamgages were clipped from the NLCD shapefile by using the Extract by Mask tool in ArcGIS Pro (Esri, 2023). The percentage of each landcover class was determined by dividing the area of each class by the watershed area. These data allow for the extrapolation of our findings to similar land cover and land use areas within the Boston Mountains.
Longitudinal Profile and Cross-Section Surveys
Topographic surveys of stream longitudinal profiles and cross sections were conducted at each study reach to obtain information on the thalweg and bankfull slopes and cross-sectional hydraulic geometry. Reaches were surveyed at 3 to 12 cross sections, with a mean and median of approximately 6 cross sections ranging in length from 163 to 7,540 ft. Distances from the first to the last cross section ranged from 5.2 to 83 bankfull widths, with a median of 13.3 and a mean of 16.8 bankfull widths. Surveys at smaller streams were conducted by using traditional optical level, rod, and tape surveying equipment (±0.005 ft accuracy) with elevations determined by using geodetic surveying equipment (±0.1 ft accuracy; Rydlund and Densmore, 2012). Larger stream channels were surveyed by using a combination of traditional optical survey equipment and a kayak- or canoe-mounted sonar-measured bathymetry with Global Positioning System horizontal positioning (±0.3 ft vertical and 1.5 ft horizontal accuracy) and 1-meter (m) digital elevation model lidar surveys (±0.5 ft vertical accuracy; Arkansas GIS Office, 2017; Kroes and Ruhl-Whittle, 2025), and elevations at cross sections were determined from geodetic surveys. Each topographic survey measured the location and elevation of points along the thalweg and bankfull profiles and along selected riffle and pool cross sections. Longitudinal profiles were acquired above and (or) below the streamgage location for a total distance of at least 20 bankfull widths. All bankfull indicators that could be located and surveyed were measured and included points on both the left and right banks. Stage elevations associated with streamflows at the 1.5-year recurrence interval were used to aid in the identification of bankfull indicators during stream surveys. Field identification of bankfull indicators was cross referenced to cross-sectional plots and compared with multiple cross sections from each reach for final bankfull determinations (Kroes and Brinson, 2004). Cross-sectional surveys were acquired up to an elevation high enough to include the flood-prone elevation (twice the maximum bankfull depth; Leopold and others, 1964; Rosgen, 1996). The following channel geomorphic metrics and measurements were used to classify the studied stream reaches.
-
• Bankfull top width: the mean width of the stream channel at bankfull stage elevation for the reach.
-
• Bankfull mean depth: the mean depth of the stream channel for the reach, calculated by dividing the bankfull cross-sectional area by the bankfull width.
-
• Width-to-depth ratio: the mean bankfull width divided by the mean bankfull depth for the reach. A reach is considered to have a low width-to-depth ratio if the ratio is less than 12, a moderate width-to-depth ratio if the ratio is between 12 and 40, and a very high width-to-depth ratio if the ratio is greater than 40.
-
• Bankfull cross-sectional area: the mean area of the stream-channel cross section for the reach, at bankfull stage.
-
• Flood-prone width: the mean width of the valley measured at the elevation of twice the maximum bankfull depth.
-
• Entrenchment ratio: a field measurement of channel incision, defined as the flood-prone width divided by the bankfull width. A reach is considered entrenched if the ratio is less than 1.4, moderately entrenched if the ratio is between 1.4 and 2.2, and slightly entrenched if the ratio is greater than 2.2.
-
• Median size (D50) of streambed material: the median particle size, or the diameter that exceeds the diameter of 50 percent of all streambed material particles.
-
• Valley slope: the change in elevation divided by the length of valley. It is the slope of a valley for a given reach measured in a straight line from the start of the reach to the end of the reach.
-
• Water-surface slope: the difference between the water-surface elevation at the upstream end of a riffle to the upstream end of another riffle at least 20 bankfull widths downstream, divided by the distance between the riffles along the thalweg.
-
• Sinuosity: an index of channel pattern, determined from the ratio of the stream length measured along the center of the channel divided by straight line distance between the beginning and end of the reach as measured from our surveys. This can also be estimated from the ratio of the valley slope divided by the water-surface slope. A reach is considered to have a low sinuosity if the ratio is less than 1.2, a moderate sinuosity if the ratio is between 1.2 and 1.5, and a high sinuosity if the ratio is greater than 1.5.
-
• Bankfull shear stress: the tractive force of flow at bankfull stage, used to calculate particle sizes that could be mobilized during bankfull discharges. This value is calculated from the reach mean as:
-
• Particle size transported at bankfull flows: the calculated mean streambed particle diameter mobilized during bankfull discharges. This value was calculated by using a power equation derived by Leopold and others (1964) as:
The particle size transported at bankfull discharge was compared with the measured streambed material to determine the percentage of the streambed that may be mobilized during a bankfull, 1.5-year flood discharge.
Streambed Material Particle Sampling
Streambed material sampling was conducted on eight streams to develop particle-size distribution plots from which particle-size quantile values, descriptive statistics of particle-size distributions, and particle-size distribution percentages of substrate type were calculated to determine the shapes of the individual particles composing the streambeds for each study reach. Grain-size ranges given for streambed material particle-size ranges and percentages of substrate type were based on the modified Wentworth scale (American Geological Institute, 1982). Information on streambed material particle-size distribution is a parameter used in the Rosgen (1994) stream reach classification system. Streambed material particle sizes were measured by using two methods: (1) a modified Wolman pebble count (Wolman, 1955) and (2) a sieve analysis of bar samples.
The modified Wolman pebble counts were conducted across the riffles and pools within each study reach (Harrelson and others, 1994). An observer waded the stream by using a step-toe procedure to collect and measure approximately 100 streambed material samples at each riffle and pool. Materials from the active streambed, defined as the area between the toes of the left and right bankfull terraces, were measured. For each sample selected, the longest axis (length, denoted “a-axis”), intermediate axis (width, denoted “b-axis”), and shortest axis (thickness, denoted “c-axis”) were measured and recorded (fig. 5). From the pebble count data, the bedrock tallies were removed, and cumulative frequency curves were developed. Bedrock was defined as any exposure of native solid rock in the streambed or along the streambanks. The median (D50) and one standard deviation from the median (D16 and D84) particle sizes were determined. Particle counts, cumulative frequency, descriptive statistics, and percent by substrate type for each study reach are available from Kroes and Ruhl-Whittle (2025).
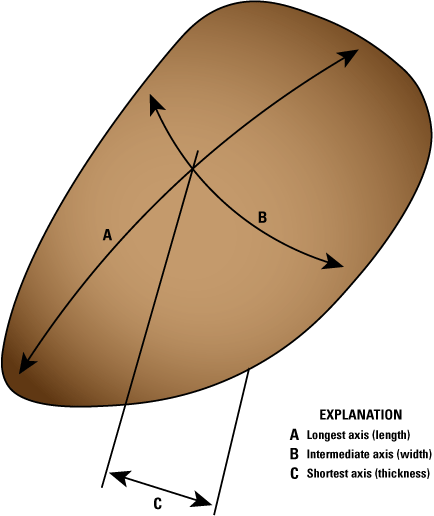
Particle axis measurement (from Pugh and Redman, 2019).
The second streambed material particle-size sampling procedure was a sieve analysis of bar samples. A 5-gallon pail (approximately 55 pounds or 25 kilograms) of bar gravel was collected from the downstream face of a point bar at an elevation approximately two-thirds of the distance between the bankfull and thalweg elevations. The sample was collected by first removing the armored layer of gravel and then collecting all the particles from an area approximately 0.3 m in diameter and 0.4 m in depth. The sample was dried and weighed to the nearest 0.1 gram (g) to determine the total sample weight. The sample was placed in a nest of sieves (refer to table 3 for listing of sieve sizes used) and shaken to separate the sample. The sample from each sieve was then removed and weighed. The final total weights retained on each sieve were summed and compared to the original total weight before sieving. From the weight retained on each sieve, cumulative frequency curves were developed, and D16, D50, and D84 particle sizes were determined.
Table 3.
Bar sediment sampling sieve sizes for streambed material particle-size sampling in selected stream reaches in the Boston Mountains in Arkansas. Fine sand and smaller passes through the #60 sieve, collected and weighed.Streambed material particle-shape analysis can provide information about the particle transport history and aid facies differentiation and characterization of depositional environments. Particles were classified into four basic shapes according to the ratios of the three particle axes: the a-, b-, and c-axes (fig. 5). Sneed and Folk (1958) classified particle shapes in terms of compactness, platyness, bladedness, and elongatedness (fig. 6). Triangular diagrams (fig. 6), based on ratios of the three-orthogonal particle axis were used for unbiased presentation of primary particle-shape data (Graham and Midgley, 2000). The Sneed and Folk (1958) descriptive particle-shape data and summaries for the Wolman pebble count data are provided in Kroes and Ruhl-Whittle (2025).
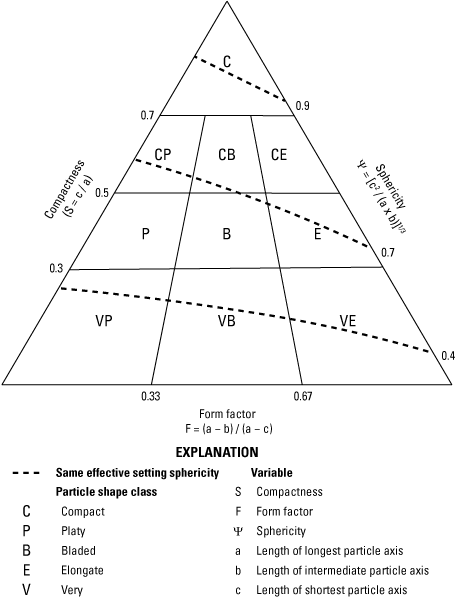
Descriptive particle-shape classes (modified from Sneed and Folk, 1958; Pugh and Redman, 2019).
Streambed particle-shape analyses were not used in the regional analysis in this report. Particle shape affects the amount of area a particle has exposed to the forces of flow, drag, and lift acting on it. This difference in shape affects particle entrainment, transport, and deposition. Consequently, two particles having the same weight and b-axis lengths but with different a- and c-axis lengths (different shapes) will respond differently to streamflow. These data were collected and computed in Kroes and Ruhl-Whittle (2025) as a means of archiving the dataset as a building block until a sufficiently larger dataset exists to further analyze streambed material particle shapes.
Stream Reach Classification
Streams of similar drainage areas may differ in width, depth, and sinuosity because of climate, geology, valley type, slope, sediment load, and (or) streambed and bank materials; however, because bankfull dimensions can characterize stream channels, streams with similar drainage areas can be classified and compared. Rosgen (1994) developed a stream reach classification system dividing streams into seven major types and dozens of subtypes, each denoted by a letter and number based on stream form and pattern. Because streams may vary in character over relatively short distance, the Rosgen (1994) classification system describes individual reaches, not the entire stream system.
Each reach was classified to the Rosgen level II stream type (Rosgen, 1994) based on the average of stream-channel metrics collected at measured cross sections and profiles. Level I classification (types A through G) describes the geomorphic characteristics at a coarse scale and is based on the entrenchment ratio and width-to-depth ratio. Level II classification (subtypes A1 to A6, B1 to B6, and so forth) provides a more detailed morphological description of the stream through additional examination of the stream pattern, profile, and streambed materials based on measured cross-section geometry, water-surface slope, and median size of the streambed material (Rosgen, 1996). Rosgen (1996, 2006) provided a means for describing deviations of measured values from the average level II values by using the following suffixes. The suffix “a” designation indicates that streams classified as a B type have a slope that is between 4 percent and 9.9 percent. The suffix “c” designation indicates that streams classified as a B type have a slope that is less than 2 percent. The suffix “b” designation indicates that streams classified as a C type have a slope that is between 2 percent and 3.9 percent. The suffix “c” designation indicates that streams classified as a C type have a slope that is less than 0.1 percent. The suffix “/1” designates the presence of bedrock within the study reach as noted during pebble counts.
Statistical Comparisons
Sediment particle-size distributions of streambed and bar material were compared for reaches where sediment was analyzed by using regression equations and correlation coefficients with the geomorphic parameters listed in the “Longitudinal Profile and Cross-Section Surveys” section, as well as 1.5-year-interval flood discharge and drainage basin characteristics available from USGS StreamStats (USGS, 2024) (drainage area, mean basin elevation, 10–85 stream slope, longest flow path, basin shape, estimated 2-year flood discharge, mean annual rainfall, mean annual runoff). Stream classifications were compared to the geomorphic and hydraulic parameters listed above using t-Tests: two- sample assuming unequal variance, one-tailed P, to determine significant (α ≤ 0.05) parameter differences between stream classifications.
Photographs
Digital photographs were taken at all cross sections. The photographs include views looking along the centerline of the cross section at the left and right banks and looking upstream and downstream from the cross-section thalweg. Representative stream reach images are available in Kroes and Ruhl-Whittle (2025).
Regional Hydraulic Geometry Characteristics of Selected Boston Mountain Stream Channels
The following discussions are about the analysis of data collected from the 14 study reaches within the Boston Mountains in Arkansas. The following report sections include general descriptions of the geology of the 14 study reaches and regional hydraulic geometry relations. Streambed materials from eight study reaches were analyzed.
General Geologic Characteristics of Selected Stream Reaches
Geology is the primary framework upon which fluvial processes operate, largely governing the landforms observed today. The geologic formations underlying each of the selected stream reaches are listed in table 4. Because of the differential erodibility of the rock types underlying the Boston Mountains, the ridges consist largely of sandstone and shale, while the valleys are mostly underlain by mixed sandstone, shale, and limestone. Most of the study reaches are underlain by the Atoka, Bloyd, or Boone Formations. The Atoka Formation, consisting of a sequence of sandstones and shales, underlies Mikes Creek Tributary near Ozone, Jack Creek near Winfrey, Frog Bayou at Winfrey, and Mulberry River near Mulberry (sites 1, 5, 8, and 14, respectively; fig. 1B; table 4; McFarland, 2004). The Bloyd Formation, consisting of a mix of sandstones, shales, and limestone, underlies Jones Creek at Winfrey, Big Piney Creek near Dover, and Middle Fork of Little Red River at Shirley (sites 7, 12, and 13, respectively; fig. 1B; table 4; McFarland, 2004). The Boone Formation, consisting of limestone, chert, and shale, underlies Maxwell Creek at Kingston, Smith Creek near Boxley, Buffalo River near Boxley, and Bear Creek near Silver Hill (sites 4, 6, 9, and 11, respectively; fig. 1B; table 4; McFarland, 2004). The Batesville Sandstone, Fayetteville Shale, and Pitkin Limestone underlie Trace Creek Tributary near Marshall and Richland Creek near Witts Spring (sites 2 and 10, respectively; fig. 1B; table 4). The Cane Hill Member of the Hale Formation, consisting of silty sandstone and siltstone, underlies Tick Creek near Leslie (site 3; fig. 1B; table 5; McFarland, 2004).
Table 4.
Geology and soil series at selected stream reaches in the Boston Mountains in Arkansas.[Green shading indicates mixed lithology; USGS, U.S. Geological Survey; USDA, U.S. Department of Agriculture; NRCS, Natural Resources Conservation Service. Station names from USGS (2024). Only geologic units mapped at study reach are listed. The Arkansas county soil survey index number of soil map units of residuum, colluvium, and alluvium are listed in parentheses as (county – index number)]
| Map no. (fig. 3) |
USGS station name (table 1) | Bedrock geology (Haley and others, 1993) | Soil parent material (USDA, NRCS, 2017) | ||||||||
|---|---|---|---|---|---|---|---|---|---|---|---|
| Residuum | Colluvium | Alluvium | |||||||||
| Sandstone | Shale | Limestone | Sandstone | Shale | Limestone | Sandstone | Shale | Limestone | Floodplain and terrace deposits | ||
| 1 | Mikes Creek Tributary near Ozone, AR | Atoka Formation1 | Mountainburg | Nella and Enders | |||||||
| 2 | Trace Creek Tributary near Marshall, AR | Batesville Sandstone | Fayetteville Shale | Pitkin Limestone | Newnata and Summit silty clay loams, 8 to 15 percent slopes, eroded (Searcy – 54D2) and Newnata-Eden-Moko complex, 20 to 40 percent slopes (Searcy – 56EF)1 | Newnata and Summit silty clay loams, 3 to 8 percent slopes, eroded (Searcy – 54C2)1 | |||||
| 3 | Tick Creek near Leslie, AR | Cane Hill Member of the Hale Formation1 | Enders and Nella complex, 3 to 20 percent slopes (Searcy – 24CD) and Enders-Nella stony loams, 20 to 40 percent slopes (Searcy – 24EF)1 | Ceda and Kenn complex, frequently flooded (Searcy – 12) | |||||||
| 4 | Maxwell Creek at Kingston, AR | Boone Formation | Noark very cherty silt loam, 20 to 40 percent slopes (Newton – 44) | Ceda gravelly fine sandy loam, occasionally flooded (Madison – 7) and Leesburg gravelly loam, 3 to 8 percent slope (Madison – 20) | |||||||
| 5 | Jack Creek near Winfrey, AR | Atoka Formation1 | Nella and Enders association, steep (Crawford – 22)1 | ||||||||
| 6 | Smith Creek near Boxley, AR | Boone Formation | Noark very cherty silt loam, 20 to 40 percent slopes (Newton – 44) | Razort loam, occasionally flooded (Newton – 48) | |||||||
| 7 | Jones Creek at Winfrey, AR | Bloyd Shale and Prairie Grove Member of the Hale Formation1 | Nella and Enders association, very steep (Crawford – 23)1 | Leadvale silt loam, 3 to 8 percent slope (Crawford – 13) and Spadra fine sandy loam, occasionally flooded (Crawford – 29) | |||||||
| 8 | Frog Bayou at Winfrey, AR | Atoka Formation1 | Nella and Enders association, steep and very steep (Crawford – 22 and Crawford – 23)1 | Spadra fine sandy loam, occasionally flooded (Crawford – 29) | |||||||
| 9 | Buffalo River near Boxley, AR | Boone Formation | Arkana and Moko complex, 0 to 40 percent slopes (Newton – 3) | Ceda and Kenn complex, frequently flooded (Newton – 6) | |||||||
| 10 | Richland Creek near Witts Spring, AR | Batesville Sandstone | Fayetteville Shale | Pitkin Limestone | Newnata and Summit complex, 8 to 15 percent slopes, eroded (Searcy – 54D2)1 | Ceda very cobbly loam, frequently flooded (Searcy – 10) and Spadra loam, 1 to 5 percent slopes (Searcy – 80B) | |||||
| 11 | Bear Creek near Silver Hill, AR | Moorefield Formation | Boone Formation | Clarksville very gravelly silt loam, 20 to 50 percent slopes (Searcy – 14F) | Razort loam, frequently flooded (Searcy – 70) | ||||||
| 12 | Big Piney Creek near Dover, AR | Bloyd Shale and Prairie Grove Member of the Hale Formation1 | Nella and Enders | Spadra | |||||||
| 13 | Middle Fork of Little Red River at Shirley, AR | Bloyd Shale and Prairie Grove Member of the Hale Formation1 | Steprock and Mountainburg and rock outcrop complex, 40 to 60 percent slopes (Van Buren – 32) | Kenn and Ceda complex, frequently flooded (Van Buren – 12) and Spadra loam, occasionally flooded (Van Buren – 27) | |||||||
| 14 | Mulberry River near Mulberry, AR | Atoka Formation1 | Allen and Enders association, steep (Franklin – AEE)1 | Bruno and Iuka soils (Franklin – Bu) and Dubbs fine sandy loam, 1 to 3 percent slopes (Franklin – DbB) | |||||||
General Soil Characteristics of Selected Stream Reaches
Soils provide insight into the evolution, age, and stability of the landform upon which they develop. The soil series mapped by the U.S. Department of Agriculture, Natural Resources Conservation Service are arranged according to the soil parent material type for the 14 selected stream reaches (table 4). Complete descriptions of the soil series are available from Hoelscher and others (1975) and Ditzler (2017).
Residuum soils are residual soil material formed in place by weathering (Hoelscher and others, 1975; Ditzler, 2017). These soils are on the ridgetops and side slopes and constitute the upland valley floors in the larger valleys at an elevation above the floodplain or oldest alluvial terrace. Allen and Summit soils are shale residuum on upland terraces. Enders soils are shale-sandstone residuum on valley uplands. Enders and Nella soils are shale residuum on ridgetops and side slopes. Allen soils are sandstone residuum on ridgetops and side slopes. Newnata soils are limestone, shale, and siltstone residuum on hilltops and side slopes. Mountainburg soils are sandstone on hills, ridges, mountaintops, and mountainsides. Steprock soils are sandstone residuum on very steep sides of hills, mountains, and ridges.
Colluvial soils are unconsolidated sediments that have moved downslope because of gravitational forces (Hoelscher and others, 1975; Ditzler, 2017). Enders soils are shale-sandstone colluvium found on uplands, mountaintops, ridges side slopes and footslopes of mountains. Nella soils are colluvium from interbedded limestone, alkaline shale, and siltstone found on hillsides, benches, and footslopes. Newnata soils are colluvium from interbedded limestone, alkaline shale, and siltstone found on hillsides and ridges. Summit soils are colluvium on interfluves, divides, and hillslopes. Noark soils are colluvium from cherty limestones found on steep uplands. Arkana and Moko soils are residuum from limestone found on steep uplands.
Alluvium or alluvial deposits represent the most recent deposition of sediment within a watershed and are present at each of the selected stream reaches in the channel and on the floodplains (Hoelscher and others, 1975; Ditzler, 2017). Terraces are the oldest alluvial deposits, representing abandoned floodplains, and are present at most selected stream reaches. Bruno, Ceda, Iuka, Kenn, Leadvale, Leesburg, Razort, and Spadra soils are Quaternary alluvium on the floodplains and terraces.
Land Cover Above Selected Stream Reaches
Data from the NLCD of 2021 (Dewitz, 2023) were used to determine the land cover within the Boston Mountains. Forest (deciduous forest, evergreen forest, and mixed forest) is the dominant land cover comprising 78 percent of the area. Undeveloped open land (shrub/scrub, grassland/herbaceous, or pasture/hay) represented 18 percent of the area. Developed land (developed, open space; developed, low intensity; developed, medium intensity; or developed, high intensity) was the third greatest land cover representing 0.86 percent of the area.
These data (Dewitz, 2023) were also used to determine the land cover within each of the watersheds above the selected stream reaches (table 5). Forest is the dominant land cover in the selected watersheds (table 5). On average, the watersheds were 84 percent forest, ranging from 48 to 99 percent. The second largest land cover category within the selected watersheds was undeveloped open land. On average, the selected watersheds were 12 percent undeveloped open land, ranging from 0.56 to 46 percent. The third largest land cover category within the selected watersheds was developed. On average, the selected watersheds were 3.1 percent developed, ranging from 0.75 to 5.8 percent. These three land cover categories—forest, undeveloped open land, and developed—accounted for greater than 99 percent of the land cover within all selected watersheds.
No trends in watershed development, forest prevalence, or undeveloped open land were identified, but developed area of the watersheds ranged from 0.75 to 5.8 percent. The watersheds above sites 2, 5, 10, and 12 had greater than 4 percent developed area, and watersheds above sites 11, 13, and 14 had less than 2 percent developed area. The watersheds above sites 3, 6, and 14 had the greatest forest cover (>93 percent) and the watersheds above sites 5 and 12 had less than 65 percent coverage. The watersheds above sites 3, 6, and 14 had less than 3.3 percent undeveloped open land, and those above sites 2, 5, and 12 had greater than 18 percent undeveloped open land.
Table 5.
Land cover within watersheds above selected stream reaches in the Boston Mountains in Arkansas.[Station names from U.S. Geological Survey (USGS; 2024); Land cover from National Land Cover Database (Dewitz, 2023). The classification system used by the National Land Cover Database is modified from the Anderson Land Classification System (Anderson and others, 1976)]
| Map no. (fig. 1B) | USGS station name (table 1) | Land cover class within watershed (percent) | ||||||||||||||
|---|---|---|---|---|---|---|---|---|---|---|---|---|---|---|---|---|
| Open water | Developed, open space |
Developed, low intensity |
Developed, medium intensity | Developed, high intensity |
Barren land (rocks/sand/clay) | Deciduous forest |
Evergreen forest |
Mixed forest | Shrubs/scrub | Grassland/ herbaceous |
Pasture/hay | Woody wetlands | Evergreen herbaceous wetlands | |||
| 1 | Mikes Creek Tributary near Ozone, AR | 0.20 | 3.09 | 0.16 | 0.03 | 0.00 | 0.01 | 76 | 9.99 | 4.6 | 0.70 | 1.2 | 4.0 | 0.05 | 0.02 | |
| 2 | Trace Creek Tributary near Marshall, AR | 0.14 | 3.45 | 0.70 | 0.12 | 0.03 | 0.20 | 62 | 4.6 | 8.5 | 2.1 | 1.9 | 17 | 0.03 | 0.03 | |
| 3 | Tick Creek near Leslie, AR | 0.12 | 2.69 | 0.10 | 0.02 | 0.00 | 0.01 | 83 | 7.5 | 3.8 | 0.51 | 0.50 | 2.2 | 0.07 | 0.01 | |
| 4 | Maxwell Creek at Kingston, AR | 0.06 | 2.92 | 0.24 | 0.05 | 0.02 | 0.21 | 79 | 0.7 | 3.6 | 1.7 | 1.7 | 10 | 0.18 | 0.05 | |
| 5 | Jack Creek near Winfrey, AR | 0.03 | 3.34 | 1.01 | 0.35 | 0.09 | 0.13 | 61 | 1.3 | 2.2 | 1.6 | 1.6 | 27 | 0.05 | 0.00 | |
| 6 | Smith Creek near Boxley, AR | 0.01 | 2.65 | 0.06 | 0.02 | 0.00 | 0.00 | 89 | 3.3 | 1.7 | 0.61 | 0.31 | 2.1 | 0.01 | 0.00 | |
| 7 | Jones Creek at Winfrey, AR | 0.01 | 2.32 | 0.08 | 0.03 | 0.00 | 0.01 | 90 | 2.0 | 1.0 | 0.34 | 0.67 | 4.0 | 0.01 | 0.00 | |
| 8 | Frog Bayou at Winfrey, AR | 0.05 | 1.92 | 0.26 | 0.05 | 0.00 | 0.00 | 88 | 0.40 | 0.64 | 0.19 | 0.20 | 8.4 | 0.04 | 0.03 | |
| 9 | Buffalo River near Boxley, AR | 0.05 | 2.28 | 0.44 | 0.07 | 0.00 | 0.00 | 88 | 0.04 | 0.58 | 0.27 | 0.23 | 8.3 | 0.03 | 0.00 | |
| 10 | Richland Creek near Witts Spring, AR | 0.00 | 4.34 | 0.12 | 0.05 | 0.00 | 0.01 | 85 | 1.1 | 1.0 | 1.1 | 2.2 | 5.1 | 0.00 | 0.00 | |
| 11 | Bear Creek near Silver Hill, AR | 0.00 | 1.82 | 0.07 | 0.01 | 0.01 | 0.00 | 81 | 6.0 | 4.4 | 0.13 | 0.14 | 6.7 | 0.00 | 0.00 | |
| 12 | Big Piney Creek near Dover, AR | 0.11 | 3.28 | 2.34 | 0.11 | 0.11 | 0.00 | 42 | 1.2 | 4.7 | 1.7 | 4.7 | 40 | 0.00 | 0.00 | |
| 13 | Middle Fork of Little Red River at Shirley, AR | 0.00 | 0.28 | 0.84 | 0.00 | 0.00 | 0.00 | 75 | 0.56 | 11 | 0.00 | 0.00 | 12 | 0.00 | 0.00 | |
| 14 | Mulberry River near Mulberry, AR | 0.00 | 0.56 | 0.19 | 0.00 | 0.00 | 0.00 | 96 | 0.37 | 2.2 | 0.56 | 0.00 | 0.00 | 0.00 | 0.00 | |
Streambed Material Analysis
An example of the results of particle data analysis is shown in figure 7 for Smith Creek near Boxley, Ark. (07055650; site 6; fig. 1; table 6). The computed streambed material particle-size classes (D16, D50, and D84 percent), along with the percentage of bedrock for all sampled cross sections, were used for subsequent statistical analyses relating geomorphic characteristics to basin characteristics and in the determination of the stream reach classification. Streambed material particle-size distributions were determined for sites 1, 2, 3, 6, 7, 8, 10, and 13 (table 6). The same analysis was conducted for the point bar material particle-size distributions. Particle-size quantile values of percent finer, descriptive statistics of particle-size distributions, and the particle-size distribution percentages of substrate type for cross sections and point bar material are available in Kroes and Ruhl-Whittle (2025).
Bedrock was identified as streambed material in seven of the eight streams sampled for particle-size distribution. Streambed mean particle size ranged from 30 to 99 millimeters (mm), with an overall mean of 73 mm (Kroes and Ruhl-Whittle, 2025). On average, 68 percent of the measured streambed sediment was at or below the size that may be mobilized during a bankfull discharge. Although analysis was limited by small sample sizes (N = 8), streambed material particle size decreased nonsignificantly with mean watershed elevation (coefficient of determination [R2] = 0.26; probability value [p-value] = 0.25) and exhibited finer sediments with increased entrenchment (R2 = 0.33; p-value = 0.18). Observed streambed particle size correlated significantly with calculated shear stress (R2 = 0.80; p-value = 0.006) and calculated width of particle transported at bankfull discharge (R2 = 0.80; p-value = 0.007).
By using Sneed and Folk (1958) particle-shape classification, we determined that bed materials at sites 1, 2, and 7 were primarily very platy and very bladed (Kroes and Ruhl-Whittle, 2025).
Other sites had more varied particle shapes, but the data formed a centroid between bladed and very bladed. This distribution of particle shapes is likely due to sediment origin as eroded sedimentary layers.
Measured bar sediment particle means ranged from 0.6 to 16 mm, with an overall mean of 12 mm. Bar sediment size correlations were also limited by small sample size (N = 8) but exhibited decreasing size with increasing sinuosity (R2 = 0.32; p-value = 0.14) and entrenchment (R2 = 0.31; p-value = 0.16). Increases in bar material size were correlated with increasing streambed material size (R2 = 0.45; p-value = 0.067). However, these results were not statistically significant.
The calculated particle sizes transported at bankfull ranged from 19 to 256 mm (table 6). These calculated values correlated significantly with observed bed sediment size distributions (D50 [R2 = 0.73; p-value = 0.007] and D84 [R2 = 0.86; p-value = 0.0009]). Of the eight reaches where bed sediment was measured, four were dominated by cobble. Those four cobble-dominated sites had calculated particle sizes transported at bankfull greater than 100 mm. Extrapolation of these observations and regressions to sites where bed sediment was not measured suggests that gravel may be the dominant particle size at sites 4 and 13 and cobble may be dominant at sites 5, 9, 11, and 14.
Drainage basin land cover classes generally did not correlate well with mean streambed particle sizes; however, the strongest nonsignificant correlation was between increasing drainage basin percentages of emergent herbaceous wetlands and decreasing mean streambed particle size (R2 = 0.29; p-value = 0.17). Land cover correlated well with mean bar particle sizes. The percentage of area in the watersheds that was emergent wetland increased nonsignificantly with finer distributions of bar particles (R2 = 0.46; p-value = 0.06). Likewise, increases in finer bar material were nonsignificantly related to increasing percentages of open water (R2 = 0.47; p-value = 0.06). Mixed forest (R2 = 0.38; p-value = 0.10) and developed medium intensity (R2 = 0.35; p-value = 0.12) also nonsignificantly increased as bar materials became finer.
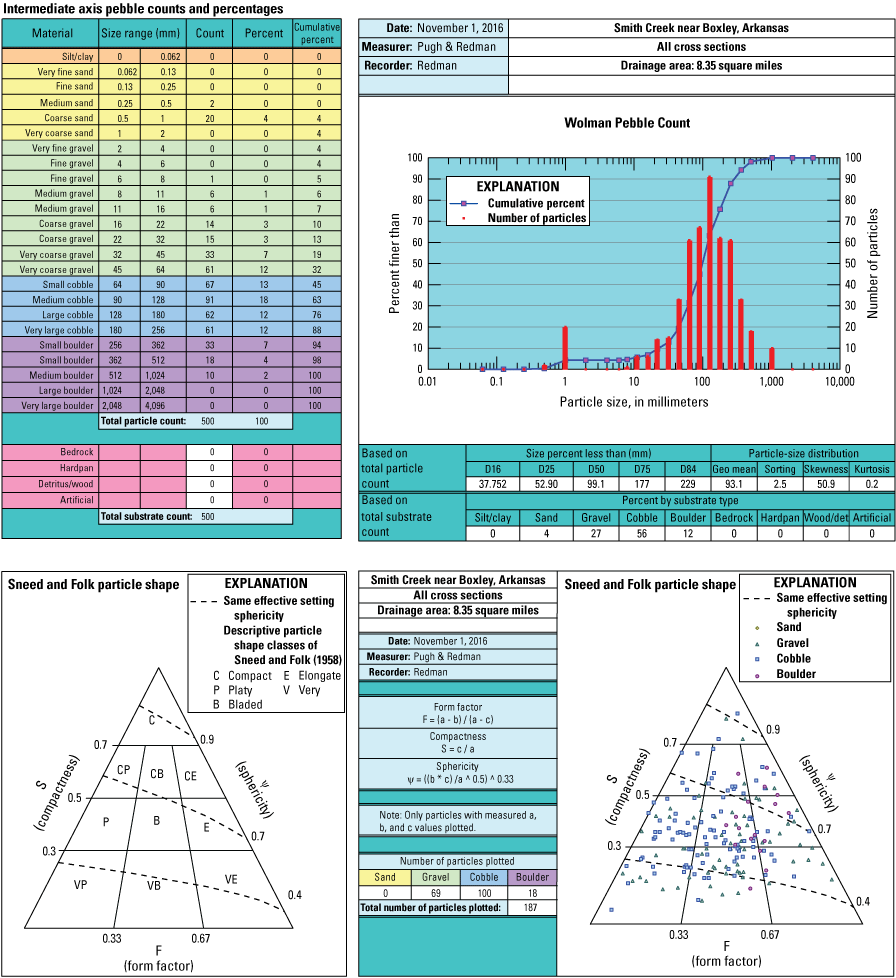
Streambed material data for Smith Creek near Boxley, Arkansas (07055650; table 1; Kroes and Ruhl-Whittle, 2025).
Table 6.
Summary of streambed and point bar material analysis for selected stream reaches in the Boston Mountains in Arkansas (Kroes and Ruhl-Whittle, 2025).[Station names from U.S. Geological Survey (USGS; 2024); D50, median particle size; D16 and D84, particle sizes that are one standard deviation from the median; lbf/ft2, pound-force per square foot; mm, millimeter; Bar, point bar sample, number in parentheses is number of point bars included in analysis; AR, Arkansas; --, no data]
| Map no. (fig. 3) | USGS station name (table 1) | Sample type | Particle size distribution (mm) | Substrate type (percent) | Bankfull shear stress (lbf/ft2) | Size transported at bankfull discharge (mm) | Streambed sediment mobilized at bankfull discharge (percent) | |||||||
|---|---|---|---|---|---|---|---|---|---|---|---|---|---|---|
| D16 | D50 | D84 | Silt/clay | Sand | Gravel | Cobble | Boulder | Bedrock | ||||||
| 1 | Mikes Creek Tributary near Ozone, AR | Bed (6)1 | 0.946 | 72.5 | 272 | 0.40 | 16 | 28 | 35 | 14 | 4.6 | 2.80 | 228 | 69 |
| Bar (1)1 | 0.541 | 1.67 | 5.50 | 0 | 30 | 70 | 0 | 0 | 0 | |||||
| 2 | Trace Creek Tributary near Marshall, AR | Bed (6)1 | 0.285 | 30.0 | 79.0 | 9.5 | 18 | 37 | 19 | 0 | 16 | 0.55 | 42 | 38 |
| Bar (1)1 | 0.062 | 0.60 | 4.00 | 6.4 | 52 | 41 | 0 | 0 | 0 | |||||
| 3 | Tick Creek near Leslie, AR | Bed (4)1 | 31.8 | 79.1 | 184 | 0 | 5.3 | 30 | 59 | 5 | 0.25 | 1.31 | 103 | 38 |
| Bar (1)1 | 3.99 | 16.1 | 84.0 | 1.1 | 3.6 | 65 | 31 | 0 | 0 | |||||
| 4 | Maxwell Creek at Kingston, AR | Bed (0)1 | -- | -- | -- | -- | -- | -- | -- | -- | -- | 0.99 | 77 | -- |
| Bar (0)1 | -- | -- | -- | -- | -- | -- | -- | -- | -- | -- | ||||
| 5 | Jack Creek near Winfrey, AR | Bed (0)1 | -- | -- | -- | -- | -- | -- | -- | -- | -- | 1.74 | 139 | -- |
| Bar (0)1 | -- | -- | -- | -- | -- | -- | -- | -- | -- | -- | ||||
| 6 | Smith Creek near Boxley, AR | Bed (5)1 | 37.8 | 99.1 | 229 | 0 | 4.4 | 28 | 55 | 12 | 0 | 3.13 | 256 | 74 |
| Bar (1)1 | 6.05 | 24.0 | 66.9 | 0 | 3 | 75 | 22 | 0 | 0 | |||||
| 7 | Jones Creek at Winfrey, AR | Bed (3)1 | 0.588 | 35.3 | 117 | 0 | 20 | 40 | 33 | 2.4 | 5.1 | 1.20 | 95 | 58 |
| Bar (1)1 | 5.04 | 12.7 | 36.0 | 1.4 | 2.6 | 88 | 8.0 | 0 | 0 | |||||
| 8 | Frog Bayou at Winfrey, AR | Bed (5)1 | 0.816 | 39.8 | 151 | 0 | 18 | 43 | 28 | 4.0 | 7.5 | 1.04 | 81 | 51 |
| Bar (1)1 | 1.04 | 6.90 | 27.0 | 0 | 13 | 78 | 9.2 | 0 | 0 | |||||
| 9 | Buffalo River near Boxley, AR | Bed (0)1 | -- | -- | -- | -- | -- | -- | -- | -- | -- | 1.69 | 134 | -- |
| Bar (0)1 | -- | -- | -- | -- | -- | -- | -- | -- | -- | -- | ||||
| 10 | Richland Creek near Witts Spring, AR | Bed (4)1 | 31.7 | 94.6 | 287 | 0 | 5.3 | 29 | 47 | 17 | 1.2 | 2.94 | 240 | 84 |
| Bar (1)1 | 4.09 | 15.0 | 54.1 | 0 | 11 | 70 | 20 | 0 | 0 | |||||
| 11 | Bear Creek near Silver Hill, AR | Bed (0)1 | -- | -- | -- | -- | -- | -- | -- | -- | -- | 1.83 | 146 | -- |
| Bar (0)1 | -- | -- | -- | -- | -- | -- | -- | -- | -- | -- | ||||
| 12 | Big Piney Creek near Dover, AR | Bed (6)1 | 9.82 | 57.2 | 199 | 0.39 | 9.4 | 40 | 33 | 9.4 | 7.1 | 1.79 | 143 | 65 |
| Bar (1)1 | 0.503 | 7.81 | 36.3 | 2.2 | 22 | 64 | 12 | 0 | 0 | |||||
| 13 | Middle Fork of Little Red River at Shirley, AR | Bed (0)1 | -- | -- | -- | -- | -- | -- | -- | -- | -- | 0.26 | 19 | -- |
| Bar (0)1 | -- | -- | -- | -- | -- | -- | -- | -- | -- | -- | ||||
| 14 | Mulberry River near Mulberry, AR | Bed (0)1 | -- | -- | -- | -- | -- | -- | -- | -- | -- | 0.64 | 49 | -- |
| Bar (0)1 | -- | -- | -- | -- | -- | -- | -- | -- | -- | -- | ||||
Geomorphology at Selected Stream Reaches
The channel shape, or geomorphology, was measured at each of the selected stream reaches. The geomorphological attributes measured or calculated at each of the selected stream reaches include the bankfull top width and mean depth, the flood-prone width, and the water-surface and valley slopes. The ratios of the bankfull top width to mean depth (width-to-depth ratio), the flood-prone width to bankfull top width (entrenchment ratio), and the water-surface slope to the valley slope (sinuosity) allow comparisons to be made between watersheds of different sizes. The width-to-depth ratio from the selected stream reaches ranged from 14.8 to 78.4, averaging 32.1. The entrenchment ratio ranged from 1.58 to 9.60, averaging 3.35. The sinuosity from the selected stream reaches ranged from 1.05 to 2.25, averaging 1.19. The stream reach width-to-depth ratio, entrenchment ratio, sinuosity, and level II classification (Rosgen, 1994) are presented in table 7.
Classification of Selected Stream Reaches
According to the Rosgen (1994) level II stream system, half of the sites were classified as B-type streams, and half were classified as C-type streams. Comparisons of geomorphic parameters were made using two-sample, one-tailed t-tests assuming unequal variance to determine differences in stream geomorphology between the two classifications. B-type streams had lower upstream watershed (10-85) slope (means of 79 and 252 ft/mi, respectively; p-value = 0.048), greater hydraulic radii (means of 3.01 and 4.99 ft, respectively; p-value = 0.044), and depths (means of 3.26 and 5.14 ft, respectively; p-value = 0.054) than C-type streams. C-type streams had finer D50 bar material size fractions (means of 6.04 and 15.15 mm, respectively; p-value = 0.051) and D85 (means of 22.7 and 55.7 mm, respectively; p-value = 0.048) than B-type streams.
These stream types were also compared for drainage basin land cover. B-type streams had less barren land (rocks, sand, and clay (means of 0.002 and 0.081 percent, respectively; p-value = 0.038) than C-type streams. B-type streams also had less woody wetlands (means of 0.015 and 0.050 percent, respectively; p-value = 0.098) and emergent herbaceous wetlands (means of 0.002 and 0.017 percent, respectively; p-value = 0.036) than C-type streams.
Table 7.
Summary of bankfull dimensions and stream morphological attributes for selected stream reaches in the Boston Mountains in Arkansas (USGS, 2024; Kroes and Ruhl-Whittle, 2025).[Station names from U.S. Geological Survey (USGS; 2024); AR, Arkansas; mi2, square mile; ft, foot; ft2, square foot; ft/ft; foot per foot. The suffix “/1” indicates the presence of bedrock within the study reach]
| Map no. (fig. 1B) | USGS station name (table 1) | Drainage area (mi2) | Bankfull top width (ft) | Bankfull mean depth (ft) | Width-to-depth ratio | Bankfull cross-sectional area (ft2) | Flood-prone width (ft) | Entrenchment ratio | Valley slope (ft/ft) | Water-surface slope (ft/ft) | Sinuosity | Hydraulic radius | Level II stream reach classification (Rosgen, 1994) |
|---|---|---|---|---|---|---|---|---|---|---|---|---|---|
| 1 | Mikes Creek Tributary nr Ozone, AR | 0.19 | 13.4 | 1.1 | 14.8 | 14.4 | 37 | 2.73 | 0.0570 | 0.0492 | 1.16 | 0.91 | C1b/1 |
| 2 | Trace Creek Tributary near Marshall, AR | 0.24 | 9.66 | 0.8 | 18.0 | 7.76 | 39 | 4.27 | 0.0139 | 0.0124 | 1.12 | 0.71 | C1/1 |
| 3 | Tick Creek near Leslie, AR | 1.58 | 64.3 | 1.6 | 43.2 | 99.5 | 122 | 2.00 | 0.0154 | 0.0138 | 1.11 | 1.52 | B1c/1 |
| 4 | Maxwell Creek at Kingston, AR | 2.75 | 47.9 | 2.7 | 22.2 | 119 | 261 | 5.04 | 0.0085 | 0.0079 | 1.07 | 2.00 | C1/1 |
| 5 | Jack Creek near Winfrey, AR | 6.87 | 84.7 | 3.3 | 29.3 | 259 | 275 | 3.02 | 0.0107 | 0.0089 | 1.21 | 3.14 | C1/1 |
| 6 | Smith Creek near Boxley, AR | 8.33 | 59.5 | 3.9 | 15.5 | 231 | 100 | 1.70 | 0.0142 | 0.0135 | 1.05 | 3.71 | B1c/1 |
| 7 | Jones Creek at Winfrey, AR | 20.3 | 106 | 4.2 | 28.0 | 421 | 165 | 1.58 | 0.0054 | 0.0048 | 1.14 | 4.06 | B1c/1 |
| 8 | Frog Bayou at Winfrey, AR | 54.9 | 135 | 3.8 | 44.5 | 516 | 864 | 6.50 | 0.0047 | 0.0045 | 1.06 | 3.71 | C1/1 |
| 9 | Buffalo River near Boxley, AR | 59.2 | 147 | 6.1 | 23.9 | 868 | 340 | 2.38 | 0.0050 | 0.0046 | 1.09 | 5.91 | B1c/1 |
| 10 | Richland Creek near Witts Spring, AR | 67.3 | 186 | 6.4 | 35.0 | 1,080 | 272 | 1.62 | 0.0082 | 0.0079 | 1.05 | 5.97 | C1/1 |
| 11 | Bear Creek near Silver Hill, AR | 78.5 | 152 | 5.5 | 28.4 | 837 | 1,534 | 9.60 | 0.0061 | 0.0055 | 1.11 | 5.35 | B1c/1 |
| 12 | Big Piney Creek near Dover, AR | 274 | 255 | 7.7 | 38.5 | 1,899 | 479 | 2.14 | 0.0042 | 0.0038 | 1.09 | 7.52 | B1c/1 |
| 13 | Middle Fork of Little Red River at Shirley, AR | 302 | 285 | 4.7 | 78.4 | 1,338 | 736 | 2.53 | 0.0020 | 0.0009 | 2.25 | 4.60 | C1/1 |
| 14 | Mulberry River near Mulberry, AR | 373 | 204 | 7.0 | 29.2 | 1,446 | 357 | 1.75 | 0.0017 | 0.0015 | 1.09 | 6.86 | B1c |
Regional Hydraulic Geometry Relations
Regional hydraulic geometry curves were constructed by plotting bankfull discharge and measured bankfull geometry dimensions (cross-sectional area, mean depth, and top width) from stable reaches and the associated bankfull streamflow against the contributing drainage area (table 7; fig. 8). Regression equations were derived from these hydraulic geometry curves and express the mathematical relation (power functions, Y = aXb) between the bankfull channel dimensions (Y) and the contributing drainage areas (X). The regression equations and corresponding 95-percent confidence and prediction intervals are presented on the regional hydraulic geometry curves (fig. 8). The 95-percent confidence intervals define a range of values that have a 95-percent probability of encompassing the results for other B- or C-type streams within the Boston Mountains physiographic section. The prediction intervals predict the 95-percent probability ranges for estimates of channel dimensions for a single stream of a given drainage area in the Boston Mountains physiographic section. The drainage areas of the studied stream reaches ranged from 0.19 to 373 square miles.
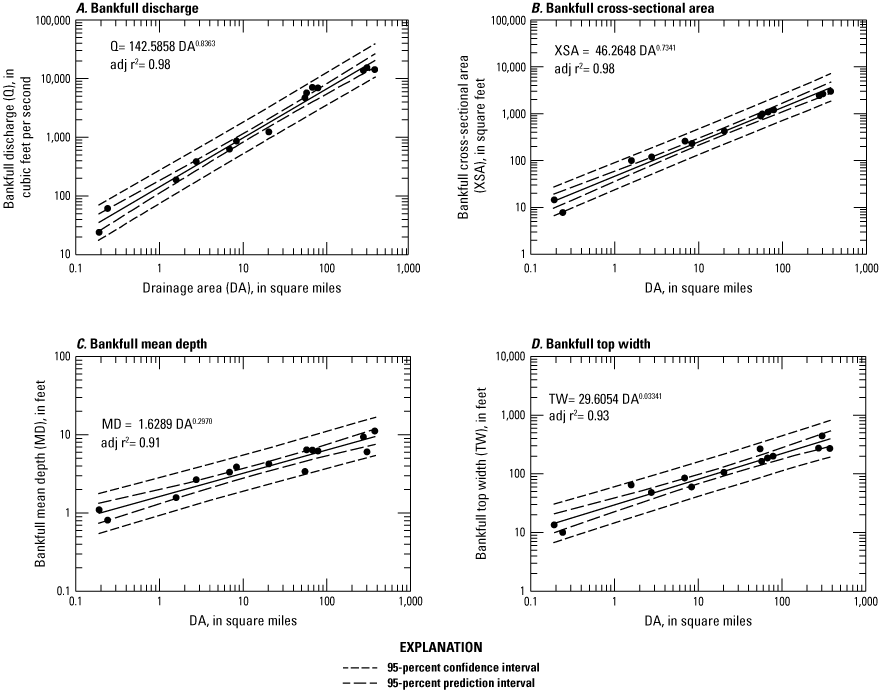
Regional hydraulic geometry curves of bankfull channel dimensions as a function of drainage area for selected streams in the Boston Mountains in Arkansas, with 95-percent confidence and prediction intervals (Kroes and Ruhl-Whittle, 2025).
The regression equations for bankfull streamflow (eq. 3), bankfull channel cross-sectional area (eq. 4), mean depth (eq. 5) and top width (eq. 6) as a function of the contributing drainage area for streams in Boston Mountains in Arkansas are
whereLimitations of This Study
For this study, the selection of bankfull stage was initially assumed to be associated with a streamflow that has a recurrence interval of approximately 1.5 years. This assumption may be an oversimplification (Thorne and others, 1997), even though other researchers have found bankfull stages associated with streamflows between 1- and 2-year recurrence intervals (Rosgen, 1994; Harman and Jennings, 1999). If the bankfull recurrence interval at a site is outside the assumed range of a 1- to 2-year recurrence interval, the bankfull channel may have been incorrectly identified (White, 2001). Additionally, B-type stream channels do not have a true floodplain. Selection of bankfull indicators along B-type streams is limited to discontinuous depositional surfaces along the channel banks.
The data and regional curves presented in this report are intended to provide users with stream hydraulic geometry information about the current conditions of stable B- and C-type streams in the Boston Mountains physiographic section in Arkansas. This study did not examine stable A-, D-, or E-type streams because no streamgages were located on these stream types. The curves presented in this report should be applied to only B- and C-type streams.
Appropriate use of the data presented in this report is left to the user. These data are suitable for most assessment and planning activities, including scaling natural stream restoration projects, habitat assessments of similar stream types, and prediction of natural stream-channel geometry. These data should be used in conjunction with other data for design purposes including analysis of peak flows, watershed assessments, and stream stability assessments.
Summary
Representative regional hydraulic geometry curves were developed for the Boston Mountains in Arkansas. The locations of 14 study reaches and streamgages operated by the U.S. Geological Survey and distributed across the Boston Mountains study area were selected for analysis on the basis of the following criteria: the streamgage had approximately 20 years or more of streamflow record; the watershed above the streamgage had a minimal amount of urbanization and controlled drainage; the stream reaches above and below the streamgage were stable; and, as much as possible, the distribution of drainage basin sizes and geographic distribution across the Boston Mountains was sufficient to facilitate the development of these regional curves. These curves may be used in the design, planning, and permitting of roadways, floodplain developments, and stream modifications. Bridges, culverts, and bank armoring are designed with these regional curves to determine appropriate sizing and materials used.
The 14 selected streamgage sites had drainage basins ranging from 0.19 to 373 square miles and were distributed across 5 of the 9 eight-digit hydrologic units that are partially or totally within the Boston Mountains in Arkansas, representing 83 percent of the Boston Mountains’ area when smaller watersheds inside larger watersheds are subtracted (table 1). As a result of differential erosion of the rock types underlying the Boston Mountains, 8 of the 14 study reaches were underlain by sandstone and shale formations, with the remainder underlain by limestone, a combination of limestone and shale, or a combination of sandstone, shale, and limestone. The land cover within the watersheds above the study reaches was on average 84 percent forest, 12 percent undeveloped open land (shrub/scrub, grassland/herbaceous, or pasture/hay) open land, and 3.1 percent developed (table 5). Compared to the Boston Mountains as a whole, these watersheds had 6 percent more forest, 6 percent less undeveloped open land, and 2.2 percent more development.
Channel morphological metrics of stream cross sections and longitudinal profiles were measured at each of the 14 study reaches. Cross-section width-to-depth ratios ranged from 14.8 to 78.4, averaging 32.1; entrenchment ratios ranged from 1.58 to 9.60, averaging 3.35; sinuosity ranged from 1.05 to 2.25, averaging 1.19; and water-surface slopes ranged from 0.0009 to 0.0492 foot per foot. Cobble was the dominant streambed particle size measured at four of the eight measured reaches, and gravel was the dominant particle size at the four remaining locations. Indirect calculations of particle size transported at bankfull flows (greater than 100 millimeters) indicated possible cobble dominance of streambed material at another four of the unsampled study reaches and possible gravel dominance at another two reaches. Bedrock was identified as streambed material at seven of the eight study reaches where streambed material was analyzed. Based on these channel morphological metrics, 7 of the 14 study reaches were classified as Rosgen level II B-type streams, and 7 were classified as C-type streams.
Regional hydraulic geometry curves express the mathematical relation between the bankfull channel dimensions and the contributing drainage areas. Regional hydraulic curves for the Boston Mountains in Arkansas were constructed from the channel morphological metrics collected at the 14 study reaches by plotting measured bankfull geometry dimensions (cross-sectional area, top width, and mean depth) from stable riffle sections and the associated bankfull streamflow against the contributing drainage area. The resulting curves had adjusted coefficients of determination values ranging from 0.91 to 0.98.
References Cited
Anderson, J.R., Hardy, E.E., Roach, J.T., and Witmer, R.E., 1976, A land use and land cover classification system for use with remote sensor data: U.S. Geological Survey Professional Paper 964, 28 p. [Also available at https://doi.org/10.3133/pp964.]
Arkansas GIS Office, 2017, 1 Meter DEM Viewer: Arkansas GIS database, accessed April 15, 2024, at https://gis.arkansas.gov/dis/viewer/dem/dem_viewer/index.html.
Dewitz, J., 2023, National Land Cover Database (NLCD) 2021 products: U.S. Geological Survey data release, accessed April 11, 2025, at https://doi.org/10.5066/P9JZ7AO3.
Ditzler, C., 2017, A glossary of terms used in soil survey and soil classification: Natural Resources Conservation Service, U.S. Department of Agriculture, 38 p., accessed April 11, 2025, at https://www.nrcs.usda.gov/sites/default/files/2022-08/A_Glossary_of_Terms_Used_in_Soil_Survey_and_Classification.pdf.
Evenson, E.J., Orndorff, R.C., Blome, C.D., Böhlke, J.K., Hershberger, P.K., Langenheim, V.E., McCabe, G.J., Morlock, S.E., Reeves, H.W., Verdin, J.P., Weyers, H.S., and Wood, T.M., 2013, U.S. Geological Survey water science strategy—Observing, understanding, predicting, and delivering water science to the Nation: U.S. Geological Survey Circular 1383–G, 49 p., accessed April 11, 2025, at https://doi.org/10.3133/cir1383G.
Graham, D.J., and Midgley, N.G., 2000, Graphical representation of particle shape using triangular diagrams—An Excel spreadsheet method: Earth Surface Processes and Landforms, v. 25, no. 13, p. 1473–1477, accessed April 10, 2025, at https://doi.org/10.1002/1096-9837(200012)25:13%3C1473::AID-ESP158%3E3.0.CO;2-C.
Harman, W.A., and Jennings, G.D., 1999, River course—Application of the Rosgen stream classification system to North Carolina: North Carolina Cooperative Extension Service AG–590–2, accessed February 2005 at https://content.ces.ncsu.edu/application-of-the-rosgen-stream-classification-to-north-carolina.
Hupp, C.R., and Simon, A., 1991, Bank accretion and the development of vegetated depositional surfaces along modified alluvial channels: Geomorphology, v. 4, no. 2, p. 111–124. [Also available at https://doi.org/10.1016/0169-555X(91)90023-4.]
Karstensen, K.A., 2009, Land cover change in the Boston Mountains, 1973–2000: U.S. Geological Survey Open-File Report 2009–1281, 10 p. [Also available at https://doi.org/10.3133/ofr20091281.]
Kroes, D.E., and Brinson, M.M., 2004, Occurrence of riverine wetlands on floodplains along a climatic gradient: Wetlands, v. 24, no. 1, p. 167–177. [Also available at https://www.researchgate.net/publication/226295931_Occurrence_of_riverine_wetlands_on_floodplains_along_a_climatic_gradient.]
Kroes, D.E., and Hupp, C.R., 2010, The effect of channelization on floodplain sediment deposition and subsidence along the Pocomoke River, Maryland: Journal of the American Water Resources Association, v. 46, no. 4, p. 686–699. [Also available at https://doi.org/10.1111/j.1752-1688.2010.00440.x.]
Kroes, D.E., and Ruhl-Whittle, L.S, 2025, Hydraulic geometry of stream channels in the Boston Mountains of Arkansas: U.S. Geological Survey data release, https://doi.org/10.5066/P1XARR7X.
Maxfield, O.O., 1964, Geography of the Boston Mountains: Columbus, Ohio, Ohio State University, Ph.D. dissertation, 194 p., accessed May 29, 2024, at https://etd.ohiolink.edu/acprod/odb_etd/ws/send_file/send?accession=osu1272464367&disposition=inline.
McFarland, J.D., comp., 2004, Stratigraphic summary of Arkansas: Arkansas Geological Commission Information Circular 36, 38 p., accessed April 16, 2024, at https://www.geology.arkansas.gov/docs/pdf/publication/information-circulars/IC-36.pdf.
McKeown, F.A., Jones-Cecil, M., Askew, B.L., and McGrath, M.B., 1988, Analysis of stream-profile data and inferred tectonic activity, Eastern Ozark Mountains Region: U.S. Geological Survey Bulletin 1807, 35 p., 2 pls., accessed March 18, 2024, at https://doi.org/10.3133/b1807.
Nofziger, D.L., 2000, Overview of major land resource areas in Southern Region from USDA publication, in Scott, H.D., ed., Water and chemical transport in soils of the Southeastern USA: Southern Cooperative Series Bulletin #395, accessed March 18, 2024, at http://soilphysics.okstate.edu/S257/mlra0.htm.
Office of the Arkansas State Climatologist, 2014, Climate of Arkansas: Arkansas Natural Resources Commission, 8 p., accessed March 18, 2024, at https://www.agriculture.arkansas.gov/wp-content/uploads/2020/05/Climate_of_Arkansas_maybe_from_2014.pdf.
Omernik, J.M., and Griffith, G.E., 2014, Ecoregions of the conterminous United States—Evolution of a hierarchical spatial framework: Environmental Management, v. 54, no. 6, p. 1249–1266. [Also available at https://doi.org/10.1007/s00267-014-0364-1.]
Pugh, A.L., and Redman, R.K., 2019, Regional hydraulic geometry characteristics of stream channels in the Ouachita Mountains of Arkansas: U.S. Geological Survey Data Series 1104, 25 p., accessed April 11, 2025, at https://doi.org/10.3133/ds1104.
Purdue, A.H., 1907, Description of the Winslow quadrangle: U.S. Geological Survey Geologic Atlas of the United States Folio 154, 6 p., accessed March 18, 2024, at https://pubs.usgs.gov/gf/154/text.pdf.
Rydlund, P.H., Jr., and Densmore, B.K., 2012, Methods of practice and guidelines for using survey grade global navigation satellite systems (GNSS) to establish vertical datum in the United States Geological Survey: U.S. Geological Survey Techniques and Methods, book 11, chap. D1, 102 p., 4 app., accessed January 11, 2022, at https://pubs.usgs.gov/tm/11d1/.
Simon, A., and Hupp, C.R., 1986, Channel evolution in modified Tennessee channels, in Proceedings of the Fourth Federal Interagency Sedimentation Conference—Volume 2, Las Vegas, Nev., March 24–27, 1986, Proceedings: Interagency Advisory Committee on Water Data, Subcommittee on Sedimentation, p. 71–82.
U.S. Census Bureau, 2020, 2020 Census: U.S. Census Bureau database, accessed April 15, 2024, at https://www.census.gov/programs-surveys/decennial-census/decade/2020/2020-census-main.html.
U.S. Climate Data, 2024, Climate Fayetteville—Arkansas: U.S. Climate Data database, accessed April 15, 2024, at https://www.usclimatedata.com/climate/fayetteville/arkansas/united-states/usar0189.
U.S. Department of Agriculture, Natural Resources Conservation Service [USDA, NRCS], 2017, Website for Official Soil Series Descriptions and Series Classification, accessed January 2017, at https://soilseries.sc.egov.usda.gov/.
U.S. Environmental Protection Agency [EPA], 2010, Level IV ecoregions of Arkansas, accessed April 15, 2025, at https://dmap-prod-oms-edc.s3.us-east-1.amazonaws.com/ORD/Ecoregions/ar/ar_eco_l4.htm.
U.S. Geological Survey [USGS], 2016, Watershed Boundary Dataset, accessed December 15, 2016, at http://nhd.usgs.gov/wbd.html.
U.S. Geological Survey [USGS], 2024, StreamStats: U.S. Geological Survey database, accessed April 11, 2025, at https://streamstats.usgs.gov/ss/.
U.S. Geological Survey [USGS], 2025, USGS water data for the Nation: U.S. Geological Survey National Water Information System database, accessed May 1, 2025, at https://doi.org/10.5066/F7P55KJN.
Conversion Factors
U.S. customary units to International System of Units
Temperature in degrees Fahrenheit (°F) may be converted to degrees Celsius (°C) as follows:
°C = (°F – 32) / 1.8.
Datums
Vertical coordinate information is referenced to the North American Vertical Datum of 1988 (NAVD 88).
Horizontal coordinate information is referenced to the North American Datum of 1983 (NAD 83).
Elevation, as used in this report, refers to distance above NAVD 88.
For more information about this publication, contact
Director, Lower Mississippi-Gulf Water Science Center
U.S. Geological Survey
640 Grassmere Park, Suite 100
Nashville, TN 37211
For additional information, visit
https://www.usgs.gov/centers/lmg-water/
Publishing support provided by
U.S. Geological Survey Science Publishing Network,
Lafayette Publishing Service Center
Disclaimers
Any use of trade, firm, or product names is for descriptive purposes only and does not imply endorsement by the U.S. Government.
Although this information product, for the most part, is in the public domain, it also may contain copyrighted materials as noted in the text. Permission to reproduce copyrighted items must be secured from the copyright owner.
Suggested Citation
Kroes, D.E., Ruhl-Whittle, L., Pieri, A.C., and Pugh, A.L., 2025, Regional hydraulic geometry characteristics of stream channels in the Boston Mountains in Arkansas: U.S. Geological Survey Scientific Investigations Report 2025–5083, 28 p., https://doi.org/10.3133/sir20255083.
ISSN: 2328-0328 (online)
Study Area
| Publication type | Report |
|---|---|
| Publication Subtype | USGS Numbered Series |
| Title | Regional hydraulic geometry characteristics of stream channels in the Boston Mountains in Arkansas |
| Series title | Scientific Investigations Report |
| Series number | 2025-5083 |
| DOI | 10.3133/sir20255083 |
| Publication Date | September 29, 2025 |
| Year Published | 2025 |
| Language | English |
| Publisher | U.S. Geological Survey |
| Publisher location | Reston, VA |
| Contributing office(s) | Lower Mississippi-Gulf Water Science Center |
| Description | Report: vii, 28 p.; Data Release |
| Country | United States |
| State | Arkansas, Oklahoma |
| Other Geospatial | Boston Mountains |
| Online Only (Y/N) | Y |