

Methods for Estimating Daily Upstream Location of the Freshwater-Saltwater Interface along the Maurice and Cohansey Rivers, New Jersey
Links
- Document: Report (4 MB pdf) , HTML , XML
- Data Release: USGS data release - Measurements of specific conductance at selected locations along the Maurice and Cohansey Rivers in New Jersey from 2021-24
- NGMDB Index Page: National Geologic Map Database Index Page (html)
- Download citation as: RIS | Dublin Core
Acknowledgments
The authors would like to thank Doug Burns, Brian Pellerin, and the USGS Next Generation Water Observing Systems (NGWOS) program for providing support for this pilot study. Additionally, the authors would like to thank the following USGS New Jersey Water Science Center colleagues for their contributions to the planning, installation, data collection, calibration, and analysis of data used in this study: Erika Bernal, Bradley Bjorklund, Anna Boetsma, Zachary Bunnell, Jonathan Cohl, Robert Schmidt, Andrew Seaman, Jason Shvanda, John Trainor, and Esmeralda Vargas and USGS Colleague Reviewers: Salme Cook and Marissa Rossi Cassell.
Abstract
The Delaware River basin (DRB) provides drinking water to 15 million people in the surrounding area. Water is frequently withdrawn from the freshwater reaches of streams, above head of tide, in the DRB for use as public drinking water. During extended periods of low flow, saltwater can move upstream, which can threaten drinking-water supplies in the basin. Due to spatial patterns in bathymetry, tidal influences within the DRB, and varying weather conditions, it can be hard to predict the movement and upstream extent of the freshwater-saltwater interface, often defined as the salt-front. Although there is a relationship that predicts this location in the main stem of the Delaware River, there lacks a relationship for its tributaries, such as the Maurice and Cohansey Rivers in southwestern New Jersey. In this study, a relationship was developed between daily specific conductance (SC) at gage locations along the tidal river reaches of the Maurice and Cohansey Rivers to the daily upstream location of the salt-front. The study augmented existing real-time tide gage data with the collection of water temperature and specific conductance data to develop the relationship. Additionally, longitudinal profiles upstream of the selected tide gages were conducted during a range of high tide conditions to define the location of the salt-front. Equations were then developed that related the daily SC measured at the tide gage to the upstream location of the salt-front. The equations were used to estimate the daily upstream location of the salt-front for the period of July 15, 2021, to July 15, 2024. This work can aid in understanding the propagation of saltwater upstream, which can affect local communities and crop farmers along these tidal reaches of the DRB.
Introduction
Cumberland County (located in the southwestern part of New Jersey) has a rich agricultural history (Harrison, 2013) and contains two major rivers—the Cohansey and the Maurice Rivers—within its boundaries (fig. 1). The Cohansey River flows through the northwestern area of the County and the Maurice River flows centrally through the County. Both rivers connect to the eastern part of Delaware Bay. Agricultural and industrial users along tidally influenced rivers and in the adjacent communities have a need to understand when and how saltwater moves up through the tributaries of the lower Delaware River basin (DRB) since saltwater intrusion can directly decrease crop yield, as most crops are highly sensitive to saline soil (Mondal and others, 2023). Local, county, and state officials could also benefit from understanding how saltwater moves through these tributaries as these data can support water-resource management.
With continued effects of sea-level rise, coastal waters are reaching further inland causing changes (Mondal and others, 2023) in infrastructure and aquatic ecosystems. Better quantitative water-quality information on the dynamics of the tidal Delaware River, Delaware Bay, and other nearby tidally influenced tributaries could inform municipalities, engineers, and scientists seeking to understand these dynamics. Freshwater systems in the headwaters of tributaries like the Maurice or Cohansey Rivers can become damaged when salinity intrudes into freshwater reaches (Cook and others, 2023). During the record drought in the 1960s (Barksdale, 1968), the saltwater-freshwater interface (also known as the salt-front) was near river mile (RM) 102 along the Delaware River and affected public-supply groundwater wells in Camden, New Jersey, and approached the nearby public supply intake across the Delaware River in Philadelphia, Pennsylvania (Hutson and others, 2010). During this major drought (and other subsequent less severe droughts), it is unclear how saltwater may have moved upstream along the Cohansey and Maurice Rivers.
The U.S. Geological Survey (USGS) has been studying the intrusion of saltwater into the Delaware Bay and River for decades, with published documents dating back to the 1950s (Durfor and Keighton, 1954; Cohen, 1957). Even prior to the 1950s, Cohen (1957) referenced that the Pennsylvania Department of Health issued a comprehensive report of the study of salinity in the Delaware Estuary as early as 1935. Durfor and Keighton (1954) described saltwater intrusion within the Delaware River, which was primarily driven by prolonged periods of low rates of river flow combined with saltwater moving upstream the river’s bottom and mixing partly with the river-surface water as a result of tidal currents, streamflow, and navigational activities, such as boating. Since then, Hutson and others (2010) described concerns about the movement of salinity into water-supply in the DRB due to expanding populations, proposed energy-production activities in groundwater-dependent watersheds, and the unknown instream needs of aquatic ecosystems.
Although studies about salinity and saltwater movement in the Delaware River and Delaware Bay date back many decades, tributaries like the Maurice and Cohansey Rivers have been largely neglected from these studies. To address this information gap, the USGS collected data along three major tributaries to the Delaware Bay to estimate the daily location of the saltwater-freshwater interface; however, one of these three tributaries, Alloway Creek, was not included in the final study because of insufficient data showing specific conductance (SC) signatures peaking during different tidal signatures. This study contains methods to estimate the daily location of the salt-front by relating salt-front locations from longitudinal surveys to SC from sensors deployed at tide gages along the Maurice and Cohansey Rivers.
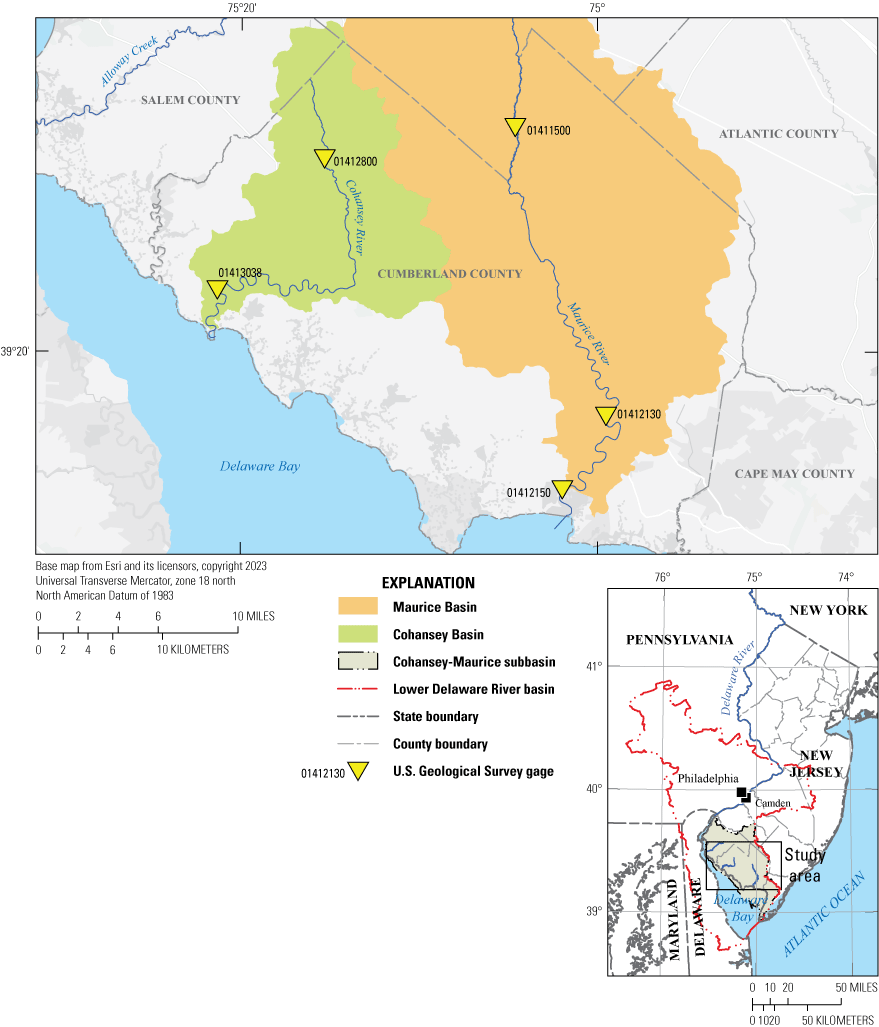
Map showing the lower Delaware River basin, Cumberland County, New Jersey, and locations of U.S. Geological Survey gages along the reaches of the Maurice and Cohansey Rivers.
Purpose and Scope
This report describes the methods and results of an investigative study to monitor and predict the movement of saltwater along the Maurice and Cohansey Rivers, located in the southwestern portion of the New Jersey coastline. The study utilized the location of existing USGS tide gages (on the Maurice and Cohansey Rivers) and deployed additional equipment to measure and record SC and water temperature. Using these SC data, methods were developed to estimate the daily upstream location of the salt-front in the Maurice and Cohansey Rivers. The salt-front is defined as an average value of 1,100 SC (in microsiemens per centimeter [μS/cm] at 25 degrees Celsius [°C]) in the water column. The methods developed in this study primarily focused on relating the daily SC at two selected gages along the Maurice River and one selected gage on the Cohansey River to the most upstream daily-average location in RMs of the salt-front.
Study Area
The study area included the tidally influenced reaches of the Maurice and Cohansey Rivers, which are both tributaries to the Delaware Bay and located on the southwestern portion of the New Jersey coastline. These rivers are part of southern New Jersey’s Coastal Plain in the Cohansey-Maurice subbasin, part of the lower DRB with its geology consisting of sand, silt, and clay materials (Hutson and others, 2010). Land use around the Cohansey and Maurice Rivers is dominated by coastal wetlands, agricultural use and contains urban areas within the cities of Millville and Bridgeton (Delaware River Basin Commission, 2016). In 2010, the water use in the Cohansey-Maurice subbasin was 50.3 million gallons per day of fresh surface water and 3 billion gallons per day of saline surface water, totaling to 3.05 billion gallons per day of total surface water (Hutson and others, 2010). The U.S. Department of Agriculture and local Cumberland County farmers are concerned of saltwater intrusion affecting agriculture farming in the Cohansey-Maurice subbasin as saltwater from surface water and groundwater begins to flood crops that cannot tolerate high levels of chloride (Held, 2024).
Two tide gages along these rivers, the Maurice River at Bivalve, New Jersey (N.J.) (USGS site no. 01412150) and the Cohansey River at Greenwich, N.J. (USGS site no. 01413038), both located in Cumberland County, were preexisting as part of the USGS New Jersey Tide Network. This study leveraged the existing tide gage infrastructure to expand data collection to include SC with water temperature for the purpose of developing methods to estimate the location of the salt-front using the daily-average value of SC. The existing tide gage at the Maurice River at Bivalve, N.J., is located about 2.3 RMs above the mouth of the Maurice River whereas the Cohansey River at Greenwich, N.J. tide gage is located about 3.9 RMs above the mouth of the Cohansey River (fig. 2). Both of these tide gages are located close enough to the confluence (the area where bodies of water join) with the Delaware Bay that the daily concentrations of SC are high, ranging from 3,000–37,000 µS/cm (U.S. Geological Survey, 2026).
The length of the tidal reach of the Maurice River measures about 22.4 RMs, beginning at the mouth (RM 0.0) at Maurice River Cove and extending upstream to Union Lake Dam in the City of Millville, N.J. Tributaries that flow into the tidal reach of the Maurice River and are downstream of Union Lake include the Muskee Creek (RM 11.5), the Manumuskin River (RM 13.4), and the Manantico Creek (RM 16.7) entering from the right bank, and Laurel Lake (RM 16.8) entering from the left bank (fig. 2A). This reach of the Maurice River contains sections surrounded by salt marshes and areas of light industry, agriculture, and residential communities (Held, 2024). The nontidal reach of the Maurice River extends further upstream from the Union Lake Dam and contains a USGS streamgage, Maurice River at Norma, N.J. (USGS site no. 01412500) (fig. 1).
Similarly, the Cohansey River is a total of 20.6 RMs between Sunset Lake Reservoir in Bridgeton City Park to Cohansey Cove on the Delaware Bay (fig. 2B). An additional streamgage, Cohansey River at Seeley, N.J. (USGS site no. 01412800) is located upstream of Sunset Lake (fig. 1). Tributaries that flow into the Cohansey River downstream of Sunset Lake include Pine Mount Creek (RM 4.2), Clarks Pond (RM 15.5), Rocaps Run (RM 17.1), and Island Branch (RM 17.7). These tributaries are substantially shorter and narrower than the extended tributaries in the Maurice River. Salt-marsh sections begin to surround the Cohansey River downstream of Island Branch (fig. 2B). Like the Maurice River, many nontidal headwards extend upstream Sunset Lake into Salem County through Cumberland County.
The Maurice and Cohansey Rivers are tributaries to the Delaware Bay that allow saltwater fluctuations from the Bay to encroach upstream from the mouth during normal tidal cycles. The variability of salinity concentrations in these tributaries is linked to saltwater conditions in the bay. Factors influencing the distribution of salinity into the estuary include freshwater streamflow, wind stress, and gravitational circulation that results from the horizontal salt gradient to a vertical salt gradient (Hansen and Rattray, 1965; de Vries and Weiss, 2001; and Zhu and others, 2020). During periods of low streamflow, low-frequency subtidal motions and wind-driven transport can push salt further upstream (Zhu and others 2020; Cook and others, 2023). Long-term trends in sea-level rise also pose a concern to saltwater intrusion surrounding tidal rivers and may risk farmland (Mondal and others, 2023). A better understanding of the movement of saltwater in tributaries like the Maurice and Cohansey Rivers will help describe current and future vulnerabilities of smaller rivers and streams to saltwater intrusion.
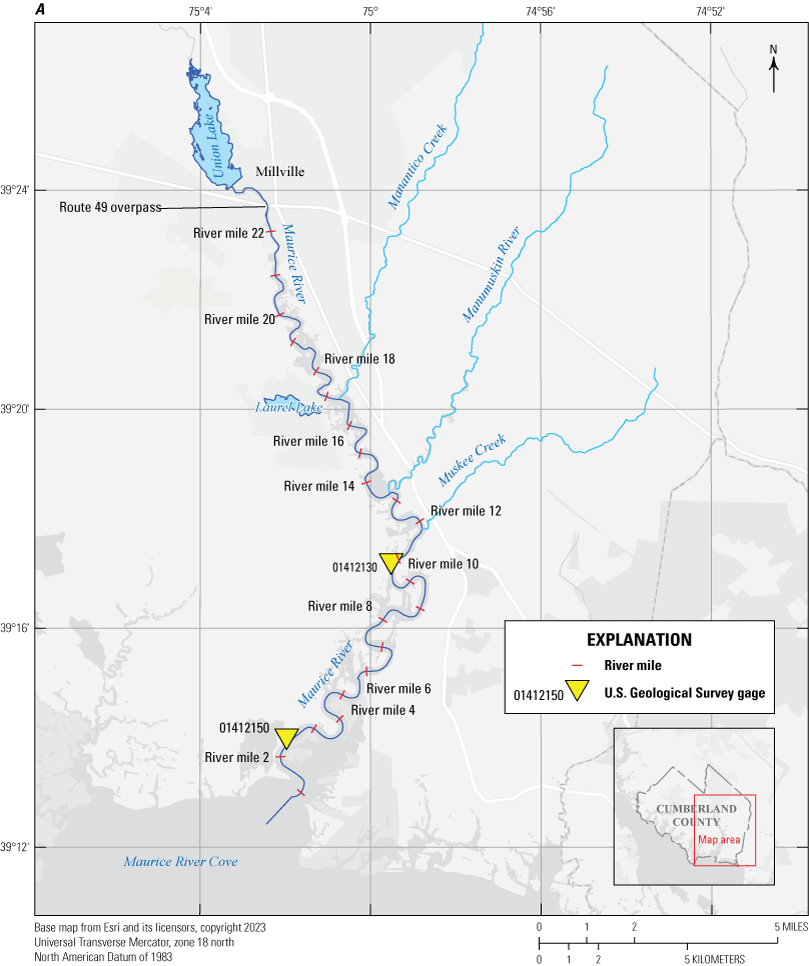
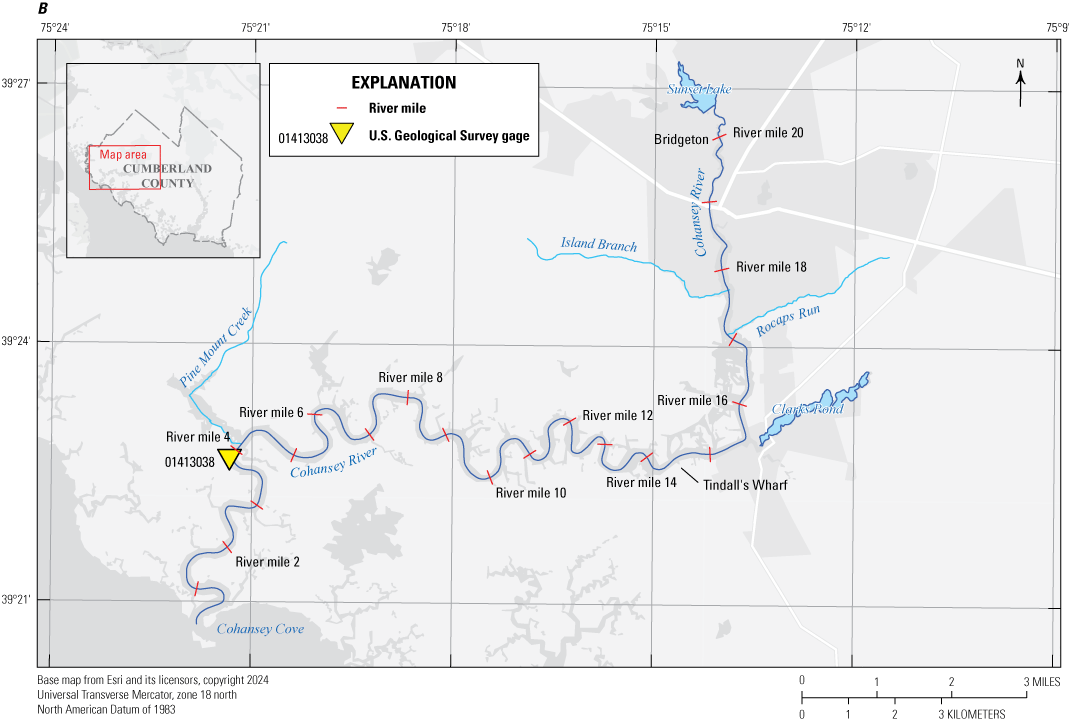
Maps showing a close-up view of the tidal reaches included in this study, river miles measured from the mouth of each river, and U.S. Geological Survey gages used in the study. A, Maurice River, and B, Cohansey River.
Methods of Data Collection
To evaluate the movement of saltwater in the Maurice and Cohansey Rivers, data were collected at one or more locations along each river. The existing tide gages, the Maurice River at Bivalve, N.J., and the Cohansey River at Greenwich, N.J., collect continuous tidal-elevation data every 6-minutes and transmit these data using satellite telemetry (the process of collecting and transmitting data from satellites to ground stations). For simplicity, the Maurice River at Bivalve, N.J. tide gage will be referred to as “Bivalve” and the Cohansey River at Greenwich, N.J. tide gage will be known as “Greenwich” throughout the report. This existing infrastructure and equipment were leveraged to reduce redundancy and costs by the installation of multiparameter water-quality sondes to record water temperature (°C) and SC (µS/cm) at the same 6-minute frequency as the tidal-elevation data. After the multiparameter water-quality sondes were installed at the existing tide gages, it became clear that the range of recorded SC would not provide enough resolution to develop a good fit for an equation to relate SC to salt-front locations. Additional reconnaissance trips were performed to identify potential locations upstream of the existing tide gages to install additional multiparameter water-quality sondes.
A new gage was installed—Maurice River at Mauricetown, N.J. (USGS site no. 01412130) (fig. 2A), approximately 10.8 RMs above the mouth of the Maurice River, to collect SC data further upstream where the SC was lower (200–29,000 µS/cm) (U.S. Geological Survey, 2026) than Bivalve which contains the defined salt-front, as well as to provide higher spatial resolution of SC data for developing a relationship between gage daily-average SC values with the salt-front location. For simplicity, the Maurice River at Mauricetown, N.J., SC gage will be referred to as “Mauricetown” throughout the report. A suitable location for an additional gage along the Cohansey River could not be determined, so the study relies on the SC data collected at the Greenwich tide gage to develop methods for estimating the location of the salt-front in the Cohansey River.
Defining the Salt-Front
The salt-front in tidally influenced rivers and streams has many definitions and generally depends upon the water body and the needs of local stakeholders. In this study, the salt-front is measured as the arithmetic average of three vertical readings of SC in the water column taken in the approximate center of the river channel that equal 1,100 µS/cm. This SC value was selected based on the assumption that the correlation between SC and chloride in these tributaries would be similar to the 250 milligrams per liter (mg/L) of chloride to SC relation in the Delaware and Hudson Rivers (Department of the Army Corps of Engineers, 1982; Delaware River Basin Commission, 2023). This selection is based on the U.S. Environmental Protection Agency’s secondary drinking-water chloride standard of 250 mg/L as well as consistency with data from previous studies. (Department of the Army Corps of Engineers, 1982; de Vries and Weiss, 2001; Delaware River Basin Commission, 2023; U.S. Environmental Protection Agency, 2025).
The U.S. Environmental Protection Agency’s secondary drinking-water standard for chloride is based on the anticipated concentration when drinking water would taste salty to the general consumer. The 250 mg/L chloride concentration is considered the extreme limit for all domestic uses, such as drinking, cooking, and washing (Department of the Army Corps of Engineers, 1982). The Delaware River Basin Commission also defines the salt-front as having a chloride concentration of 250 mg/L; however, their definition is based on a 7-day average concentration, whereas this study uses a daily average (Delaware River Basin Commission, 2023).
Although the study of chloride in the tributaries was beyond the scope of this study, one water-quality sample was collected along the Maurice River on January 29, 2024. The sample was collected and analyzed for chloride concentration as a simple one-point check to evaluate if the initial study assumption was valid or within 25-percent of the assumed correlation with the Delaware River studies such as the Department of the Army Corps of Engineers (1982), U.S. Environmental Protection Agency (2025), and Delaware River Basin Commission (2023).
Analysis of Specific Conductance Gage Data
SC and water-temperature data were collected by deploying multiparameter water-quality sondes (fig. 3B) at the USGS gages used in this study (fig. 3A). Water-quality data-collection techniques were followed in accordance with Chapter A6.3 Specific Conductance (U.S. Geological Survey, 2019) in the National Field Manual for the Collection of Water-Quality Data. Additional guidelines and standard procedures for continuous water-quality monitors can be found in Guidelines and Standard Procedures for Continuous Water-Quality Monitors: Station Operation, Record Computation, and Data Reporting (Wagner and others, 2006). The multiparameter water-quality sondes were serviced every 8 weeks. During each service visit, they were assessed for fouling (accumulation of unwanted material) and properly cleaned and calibrated, as necessary. The water temperature readings were also confirmed to be within criteria using a calibrated thermistor (field meter), which is routinely checked in accordance with water-quality field-collection methods described in Chapter A6.1 (Wilde, 2006).
The period of SC data used in this study at the Maurice and Cohansey Rivers extended from July 15, 2021, through July 15, 2024. During this period, 6-minute SC data ranged from 3,140–37,100 µS/cm at Bivalve, 130–29,700 µS/cm at Mauricetown, and 3,710–32,600 µS/cm at Greenwich (U.S. Geological Survey, 2026). Although data were collected and analyzed at 6-minute intervals, these data were aggregated into daily-average values of SC when used in the calculations to estimate the daily upstream location of the salt-front (fig. 4).
The daily-average SC for the indicated study period of 2021–2024 ranged from 9,340–33,600 µS/cm at Bivalve, 443–23,900 µS/cm at Mauricetown, and 5,690–27,000 µS/cm at Greenwich. Located downstream of the Mauricetown gage, the Bivalve gage naturally recorded higher SC readings for the entire study period because the Bivalve gage is closer to the mouth of the Maurice River and is affected by higher salinity concentrations from the Delaware Bay. The Mauricetown gage is most upstream of the tributary gages and generally recorded the lowest concentrations of SC.
The daily-average SC concentrations from October 2021 through about April 2022 were generally consistent and showed inter-range variability, then transitioned to a decreasing pattern for all gages. The time period between April to May 2022 indicated the beginning of a shift in increasing average SC concentrations into October through November 2022. The fall 2022 through fall of 2023 showed generally consistent SC concentrations with little fluctuations except for May 2023. After the late fall and winter 2023, SC concentrations decreased to the lowest values measured during the study period in January and March/April of 2024. Specific conductance values increased from late spring of 2024 through the end of the study period in mid-July 2024 (fig. 4).
During late April and early May 2023, a large rainfall runoff event flushed the salinity in both tributaries, which reduced the computed daily-average SC down to about 16,600 µS/cm on May 7, 2023, at the Bivalve gage, below 2,500 µS/cm on May 6, 2023, at the Mauricetown gage, and about 13,000 µS/cm on May 16, 2023, at the Greenwich gage (fig. 4). In contrast, the maximum daily-average SC occurred after a period of gradual increase and was computed on August 17, 2022, at the Mauricetown gage, October 2, 2022, at the Bivalve gage, and October 13, 2022, at the Greenwich gage. All real-time SC data from the Bivalve, Greenwich, and Mauricetown gages are available online at the USGS National Water Information System (U.S. Geological Survey, 2026).
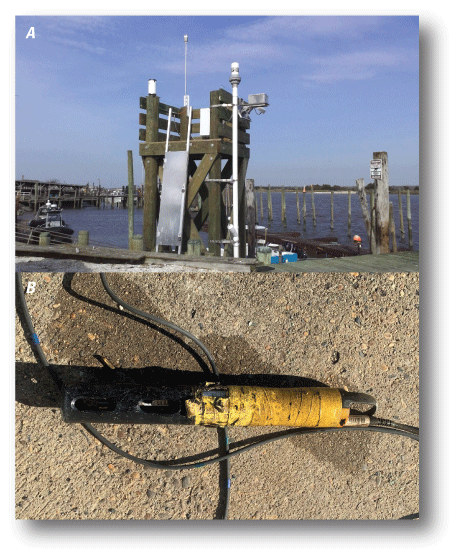
Photographs of A, Maurice River at Bivalve, New Jersey (USGS site no. 01412150) tide gage and B, a close-up view of a multiparameter water-quality sonde after it was removed for cleaning and calibration.
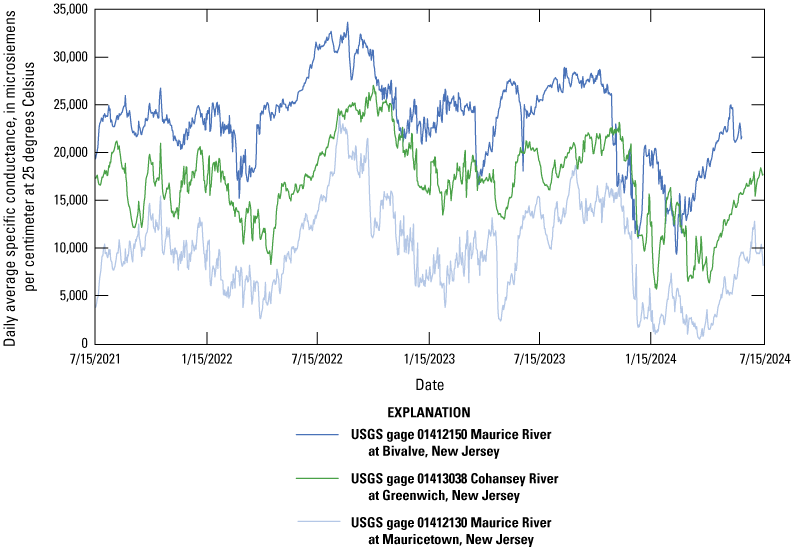
Graph showing daily average values of specific conductance at Maurice River at Bivalve, New Jersey (U.S. Geological Survey [USGS] site no. 01412150) tide gage, Cohansey River at Greenwich, New Jersey (USGS site no. 01413038) tide gage, and Maurice River at Mauricetown, New Jersey (USGS site no. 01412130) specific conductance gage between July 15, 2021–July 15, 2024.
Measuring the Location of the Salt-Front
The salt-front was recorded at the location where the average SC concentration of three depths in the thalweg (a line connecting the deepest points along the stream channel) of the river was equal to 1,100 µS/cm. To determine this location, in situ measurements of SC were required. Data collection was done at or near high-slack tide using a power boat and a calibrated multiparameter water-quality sonde to measure SC and water temperature at three depths at specific locations along the river until the salt-front location was found. The depths used to compute the average SC and water temperature reading were 80 percent, 50 percent, and 20 percent of the total depth of the water column at each cross-section. The total depth of the water column was determined using a mounted depth finder located onboard the boat. To help ensure accurate identification of the salt-front, data were collected from at least one location that was further upstream with a value less than 1,100 µS/cm during each survey. To help ensure accurate identification of the salt-front, data were collected from at least one location that was further upstream with a value less than 1,100 µS/cm during each survey. This was to provide data to accurately compute the correct location of the salt-front by interpolating between the RM location of the average SC values greater than and less than the 1,100 µS/cm (Closson and others, 2026). Each location where SC was collected was marked by a waypoint (point of latitude and longitude location marked by a boat mounted global positioning system) and later plotted on a scale of RMs upstream of the mouth (fig. 5). For this study, the mouth of each tributary was defined at the confluence with the Delaware Bay as zero RMs (fig. 2). A total of 14 boat surveys were completed between October 2021–April 2024 on the Maurice River, and 12 boat surveys were completed between December 2021–January 2024 on the Cohansey River, targeting a field-survey schedule of every 8 weeks per tributary. All longitudinal survey SC data from the Maurice and Cohansey Rivers are available online (Closson and others, 2026).
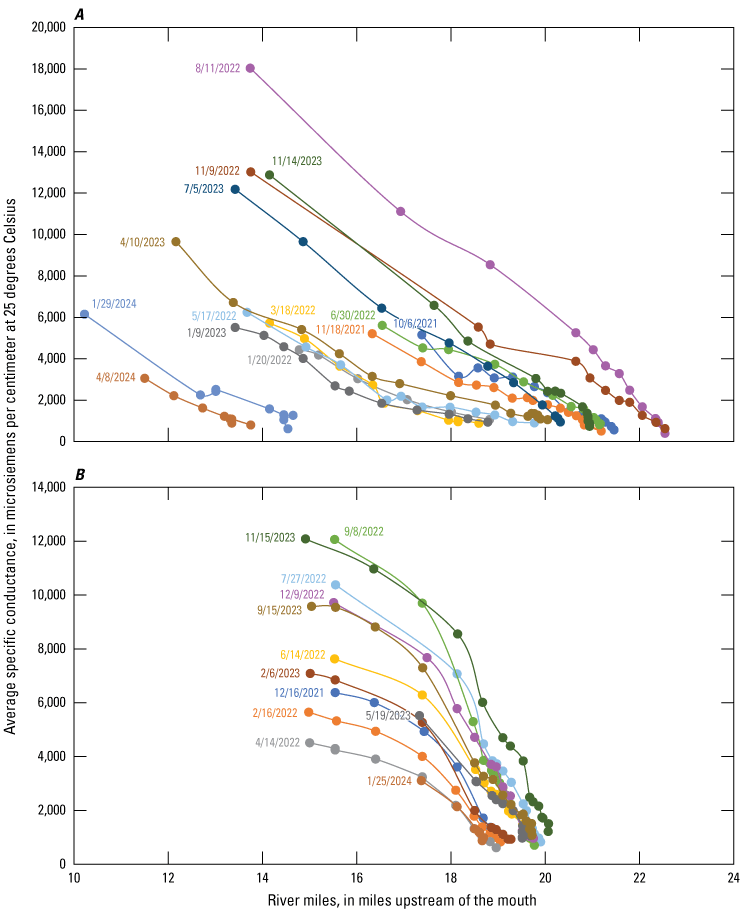
Graphs showing the specific conductance measurements and associated river mile for the longitudinal surveys used in this study. A, Maurice River and B, Cohansey River.
Developing Methods for Estimating the Upstream Location of the Salt-Front
This study used daily-average SC concentration at the gages and RM locations of associated longitudinal surveys of SC to estimate the daily upstream location of the salt-front. The movement of the salt-front in the Maurice and Cohansey Rivers is complicated because the reaches are influenced by tides and freshwater streamflow at the upstream end of each reach. The semidiurnal nature of the tides in New Jersey confirms a mix of both higher-high tides and lower-high tides and are typical for most days. The timing of slack high tides and weather conditions influenced the ability to collect longitudinal river surveys each day.
Afterwards, a relationship was developed by fitting a curve to the daily average SC at the gage and the upstream location of the salt-front (fig. 6). To establish a good fit between the daily SC and the upstream location of the salt-front, a third-order polynomial equation was used for Bivalve, Greenwich, and Mauricetown daily-average SC. Salinity driven parameters (such as tidal water-surface elevation, wind effects, and streamflow) were not included as coefficients within the estimated equations and are beyond the scope of this study.
It was assumed that dynamic factors (such as wind, tide cycles, freshwater input, and runoff) constantly influenced the location of the salt-front. The use of daily-average SC to estimate the daily upstream location of the salt-front was chosen to mitigate high-frequency events (such as semidiurnal-tide signatures and wind effects) but still allow the capture of lower frequency events such as spring- and neap-tide cycles and the river’s response to larger streamflow events. According to de Vries and Weiss (2001), daily mean values (as opposed to time-interval values) related better in regression equations when predicting the measured salt-front location on the Hudson River, New York.
A total of three equations were developed to estimate the daily upstream location of the salt-front using the daily average SC from the gages along the Maurice and Cohansey Rivers. On the Maurice River, the Mauricetown gage is located about 10.8 RMs upstream from the mouth and closer to the salt-front locations, and the Bivalve gage is about 2.3 RMs upstream from the mouth and further from the salt-front locations. It was anticipated that the proximity of the Bivalve gage to the confluence with the Delaware Bay would result in higher concentrations of SC earlier in the salt-front movement cycle. The Mauricetown gage was installed further upstream from the Bivalve gage to provide for a more representative dataset of SC. The upstream location had channel characteristics that were more consistent with the upstream reach and the further distance from the mouth extended the time it takes for SC concentrations to become saturated in the cross-section and no longer provided a reproducible change in concentration that could be correlated to changes in reach concentration. It was theorized that, by moving the gage’s location further upstream, influences from vertically well mixed SC from tides near the confluence with the Delaware Bay would be reduced and thus provide higher incremental resolution of daily SC concentrations to develop an equation to estimate the salt-front at greater distances upstream.
A total of 14 longitudinal surveys were completed along the Maurice River. For the Mauricetown gage, the average error between the measured location of the salt-front during the longitudinal-river surveys and the fitted-equation estimates was 0.1 RMs. The corresponding standard error was about 0.1 RMs and the median error was about 0.1 RMs (eq. 1). The equation fitted to the Bivalve gage data (eq. 2) resulted in an average error of 0.0 RMs, a median error of about 0.1 RMs, and a standard error of about 0.2 RMs due to scatter in the salt-front measurement locations. The Mauricetown gage was determined to be the best overall equation for estimating the daily upstream location of the salt-front along the Maurice River based on lower-error statistics of the curve-fitted equation (eq. 1; fig. 6A).
(1)
(2)
SFRM
is the estimated location of the salt-front, in river miles, M and B refer to the Mauricetown and Bivalve gages, respectively;
SCM
is the daily average specific conductance in µS/cm at the Maurice River at Mauricetown gage; and
SCB
is the daily average specific conductance in µS/cm at the Maurice River at Bivalve gage.
Similar to the Bivalve gage in the Maurice River, the Greenwich gage in the Cohansey River is located about 3.9 RMs upstream from the confluence with the Delaware Bay. The Cohansey River had a smaller range of salt-front locations compared to the Maurice River; however, there was similar scatter in measured salt-front locations to those at the Bivalve gage. This scatter in these salt-front location data is likely due in part to the tidal and meteorological influences from the Delaware Bay. An acceptable location to install an additional short-term gage to collect SC data further upstream could not be located, although this was anticipated for the Cohansey River due to lack of infrastructure along the riverbank. The resulting equation for the Greenwich gage (eq. 3) was developed using data from 12 longitudinal-river surveys and had an average error of 0.0 RMs, a median error of 0.0 RMs, and a standard error of 0.1 RMs. These errors are lower than the errors from equation 1 and equation 2 due to the smaller range of salt-front locations along the Cohansey River. The final fitted curves for estimating the location of the daily upstream location of the salt-front in the Maurice and Cohansey Rivers are shown below (fig. 6B).
(3)
SFRMG
is the estimated location of the salt-front, in river miles, subscript G refers to the Greenwich gage; and
SCG
is the daily average specific conductance in µS/cm at the Cohansey River at Greenwich gage.
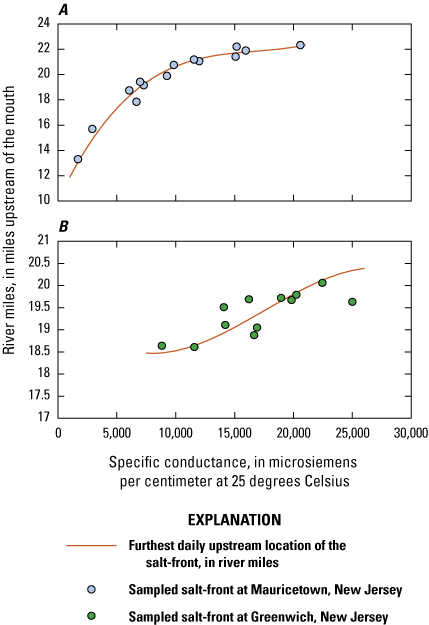
Graphs showing the relation between daily upstream location of the salt-front and the measured location of the salt-front during longitudinal surveys. A, Maurice River at Mauricetown, New Jersey, and B, Cohansey River at Greenwich.
Analysis of Estimated Salt-front Location in the Maurice and Cohansey Rivers
The salt-front movements in the Maurice and Cohansey Rivers are primarily driven by tidal action and streamflow. Factors that play a role in salt-front movements include wind-stress on the water’s surface (especially winds parallel with the Delaware Bay) and gravitational circulation, as mentioned earlier in the Study Area section. Depending on the path of a strong coastal storm or hurricane, salt-front movements can also be affected through sea-level changes, wind direction and velocity, and runoff from precipitation (Cohen and McCarthy, 1962).
During a 3-year period between July 15, 2021, and July 15, 2024, calculations using the Mauricetown equation (eq. 1) showed seasonal patterns of the salt-front location movement (fig. 7A) along with a few anomalies due to coastal storms. These seasonal variations show that salt-front locations are the furthest downstream during the spring season (March through May), with an average salt-front location at RM 19.0. During the months of April and May (when freshwater streamflow into the tidal reach generally peaked much higher than the long-term median flow for those months at Maurice River at Norma, N.J., USGS site no. 01411500) (U.S. Geological Survey, 2026), the equation estimated that the salt-front reached its furthest distance downstream during the study period. For example, the daily upstream location of the salt-front was estimated as far as RM 14.4 on April 12, 2022, RM 14.0 on May 7, 2023, and RM 10.9 on April 1, 2024 (fig. 8A). The Maurice River at Norma, N.J. streamgage, located approximately 8 miles upstream of the Union Lake dam, computed streamflow of 297 cubic feet per second (ft3/s) on April 9, 2022, 730 ft3/s on May 2, 2023, and 985 ft3/s on March 25, 2024 (U.S. Geological Survey, 2026). The computed streamflow at this gage is assumed to have an influence on the daily upstream location of salt-front locations because streamflow peaked 3–5 days before the daily estimate.
The summer to fall season (June through November) (fig. 7A) demonstrated a gradual movement of the salt-front upstream, with a median salt-front location between RM 21 and 22. The maximum range of RM locations for the salt-front were mostly calculated during this period (fig. 8A). The furthest estimated upstream location of the salt-front along the Maurice River from June–November 2021 was RM 21.7 and occurred on October 30, 2021, from a coastal low-pressure event. The furthest upstream estimated location of the salt-front in 2022 was RM 23.2 on August 18, 2022, and RM 22.0 on September 7, 2023.
A strong coastal low-pressure event affected the New Jersey region between October 29 and 30, 2021 causing coastal flooding with many local tidal gages exceeding flood stage, including some instances of moderate to major flooding on the Chesapeake Bay, Delaware Bay, and tidal Delaware River (National Weather Service, 2021). The Maurice River at Norma, N.J., (USGS site no. 014115000) streamgage recorded a streamflow of 178 ft3/s on October 30, 2021, about 40 percent less than the 2022 water-year-maximum streamflow of 297 ft3/s that occurred on April 8–9, 2022 (U.S. Geological Survey, 2026), indicating that major coastal storms producing storm tides can affect salinity movement upstream along these tributaries, even when freshwater streamflow occurs. During strong coastal storms, such as the October 29 and 30, 2021, event, offshore wind pushes surface water (in the form of gravitational waves) from the Atlantic Ocean into the Delaware Bay and further upstream tidal tributaries, which causes coastal flooding. This results in further RM salt-front locations during storm tides. The amount of streamflow, frequency of storm tides, as well as strength and duration of wind-driven transport determines where the location of the salt-front will be.
On August 18, 2022, the Maurice River at Norma, N.J., (USGS site no. 01411500) streamgage recorded a streamflow of 37.0 ft3/s, which was close to the 2022 water-year-minimum streamflow of 34.6 ft3/s recorded between August 26–27, 2022 (U.S. Geological Survey, 2026). This pattern repeated on September 7, 2023, when a flow of 43.1 ft3/s was recorded as the 2023 water-year-minimum streamflow (U.S. Geological Survey, 2026) and coincided with the maximum-upstream location of the salt-front. A pattern of downstream salt-front movement from a notable runoff event on May 2, 2023, estimated the salt-front between RMs 10–15. Periods of lower flows between May and June 2023 caused the salt-front to encroach back upstream, and these periods were documented along the Maurice River (fig. 8A).
The salt-front estimate along the Cohansey River had a somewhat similar pattern compared to the Maurice River, but with less seasonal variability (fig. 7B). Larger and more frequent runoff events pushed the salt-front downstream in both the Cohansey and in the Maurice Rivers; however, the estimate shows smaller range differences of the salt-front in RMs in the Cohansey River (fig. 8B). Between July 15, 2021, to July 15, 2024, the upstream location of the salt-front in the Maurice River was more variable, with a range of 13.0 RMs compared to the Cohansey River with a range of 1.9 RMs. Notably, from about July 4, 2022, to August 18, 2022, the salt-front in the Cohansey River gradually moved upstream from a location of about 19.4 RMs to a location of 20.3 RMs, primarily driven by lower-freshwater streamflow and high tides peaking near or above an elevation of 4.0 feet at the Greenwich tide gage. Subsequently, the salt-front continued to maintain a location of 20.2 RMs or greater through September 18, 2022, even though the Cohansey River at Seeley, N.J. streamgage (USGS site no. 01412800), a nontidal streamgage located about 3.5 miles upstream of Bridgeton, N.J., recorded a streamflow peak of about 135 ft3/s on September 6, 2022 (U.S. Geological Survey, 2026), which suggests an influence from a high tide of 4.3 feet which was recorded on September 8, 2022, at the Greenwich gage. The daily upstream salt-front location between July 15, 2021, through July 15, 2024, along the Cohansey River ranged from about 18.5 RMs on April 29, 2022, to 20.4 RMs on October 14, 2022. All salt-front estimate data for Bivalve, Greenwich, and Mauricetown gages are available online at the USGS National Water Information System (U.S. Geological Survey, 2026).
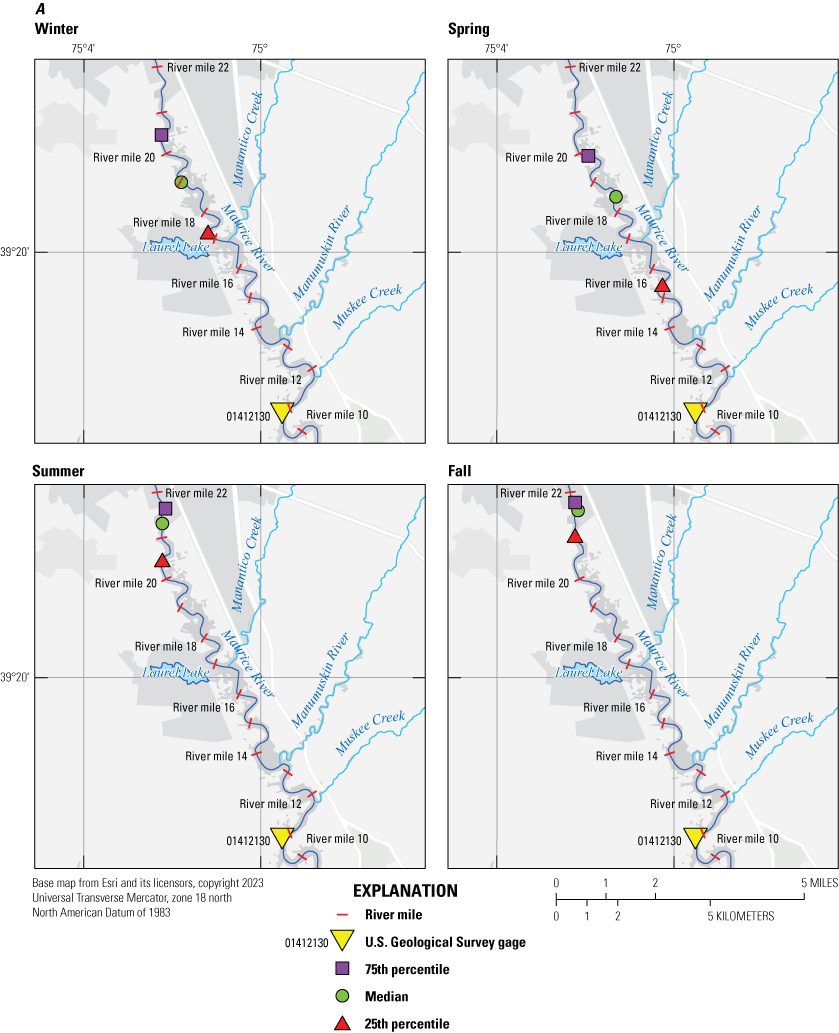
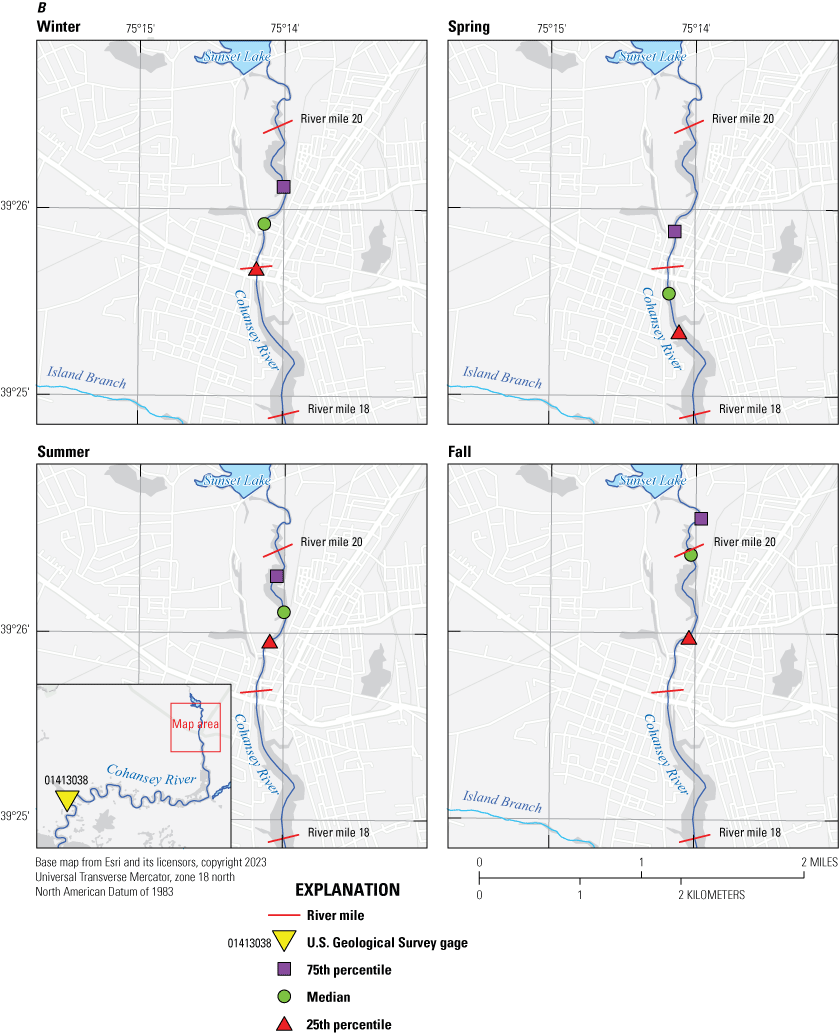
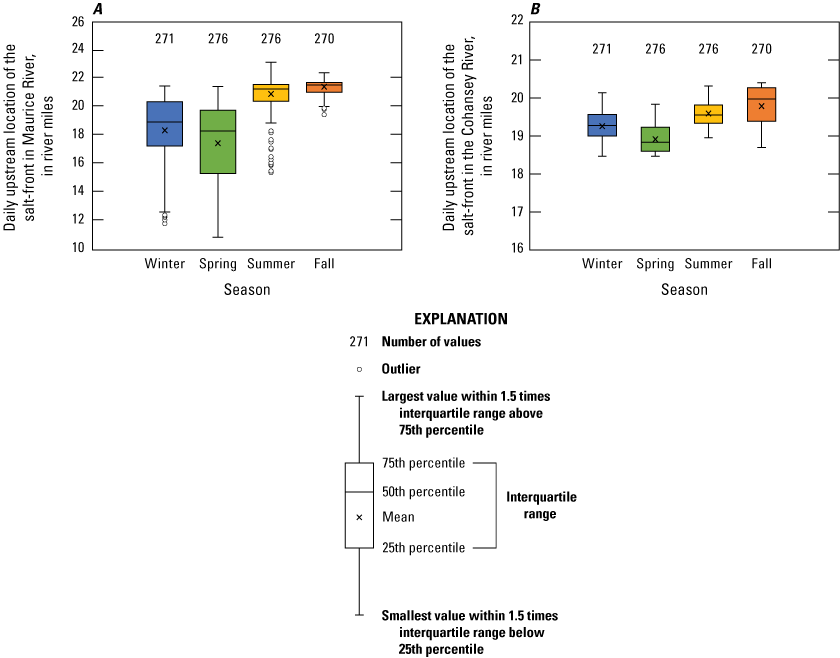
Maps and corresponding box plots showing the A, Maurice River and B, Cohansey River daily upstream salt-front locations at the 25th, median, and 75th percentiles from July 15, 2021, to July 15, 2024.
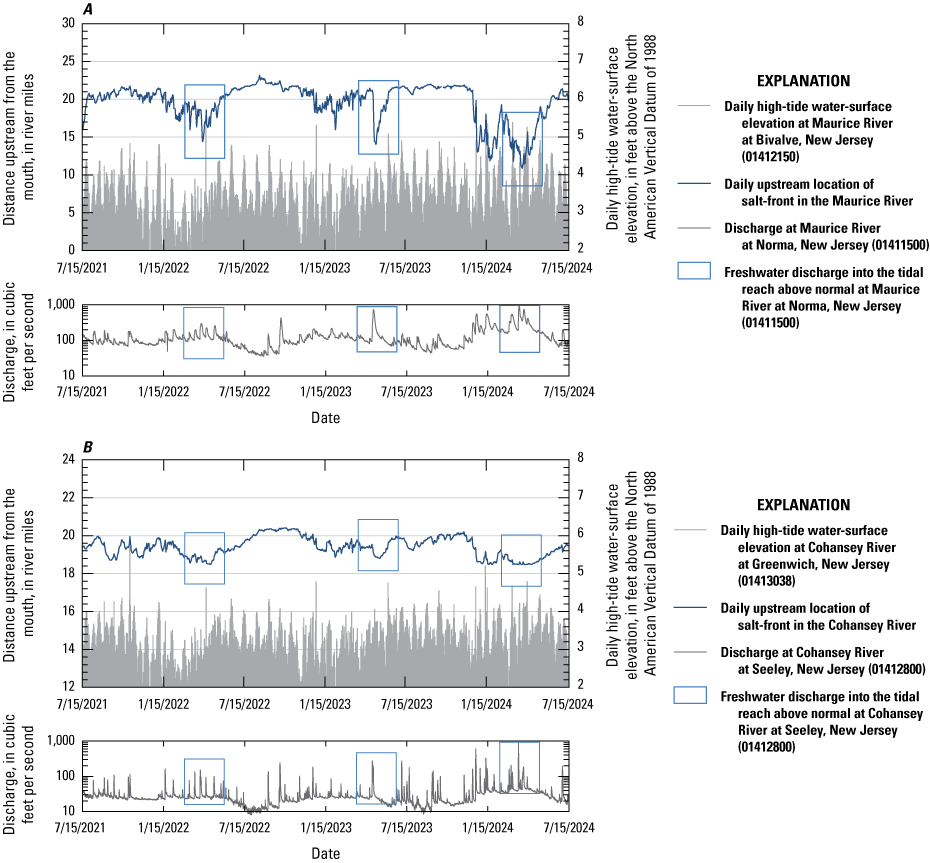
Graphs showing the A, daily location of the salt-front along the Maurice River, daily high tide at Maurice River at Bivalve, New Jersey (USGS site no. 01412150) and streamflow from Maurice River at Norma, New Jersey (USGS site no. 01411500) and B, the daily location of the salt-front along the Cohansey River, daily high tide at Cohansey River at Greenwich, New Jersey (USGS site no. 01413038) and streamflow from Cohansey River at Seeley, New Jersey (USGS site no. 01412800).
Estimating Average Chloride Concentration in Tributaries
This study focused on the development of methods to estimate the daily upstream location of the salt-front in the selected tributaries to the Delaware River. Estimates of the relation of SC to chloride concentration was outside the scope of this study. This study defined the salt-front as the location where SC concentration equaled 1,100 µS/cm at the deepest part of the river channel. That definition was based partly on the research of other studies on the Delaware and Hudson Rivers (Cohen, 1957; de Vries and Weiss, 2001; Delaware River Basin Commission, 2023).
As a single-point check, this study collected three chloride samples on the Maurice River to evaluate whether the relationship between SC and chloride concentration was within 50 percent of the actual chloride concentration (Closson and others, 2026). After interpolating between two samples collected on January 29, 2024, these data had an SC value of 950 µS/cm and a chloride concentration of about 250 mg/L; however, these data provided some context that the assumptions relating SC to chloride concentrations were generally reasonable. A better-defined relation between chloride concentration and SC within the Maurice and Cohansey Rivers could help refine the definition of the salt-front to better align with water-consumption guidelines.
Discussion of Published Literature on Chloride Concentration and Specific Conductance
Although defining the connection between chloride concentration and SC within these tributaries was beyond the scope of this study, the study examined published literature for the mainstem Delaware and Hudson Rivers related to SC and salinity. The Delaware State Geological Survey published a report in 1957 which included equations to estimate the relationship of chloride to SC (Cohen, 1957). Using the equation from Cohen, (1957, p. 13), an SC of about 1,155 µS/cm is estimated for a chloride concentration of 250 mg/L. The USGS published a water-supply paper that included an equation to estimate the relation between chloride and SC with the SC ranging from 4,000 to 16,000 µS/cm and is referred to in historic reports as micromhos, where 1 micromho equals 1 microsiemen (Cohen and McCarthy, 1962, p. 9). This range of SC corresponds to a chloride concentration of 1,199 to 5,194 mg/L. When the linear equation is extrapolated down to estimate the SC for a chloride concentration of 250 mg/L, it computes to 1,150 µS/cm. The USGS also published a study that included a relation of SC to chloride along the Hudson River (de Vries and Weiss, 2001). Using the relation of SC to chloride concentration equation in de Vries and Weiss (2001), SC was estimated of about 1,050 µS/cm for a chloride concentration of 250 mg/L (Cohen, 1957, p. 13; de Vries and Weiss, 2001, p. 13).
Summary
The Maurice and Cohansey Rivers are tributaries to the Delaware Bay and are subject to tidal influences in the lower parts of each river reach. Although tidal processes drive saltwater from the ocean upstream, it is difficult to predict the timing and extent of salt intrusion in these systems. The agriculture, light industry, and small residential community could benefit from a better understanding of how saltwater and the salt-front moves in these reaches.
This study was funded by the USGS Next Generation Water Observing Systems program as a pilot study to develop methods to estimate the daily upstream location of the salt-front. Specific conductance (SC) and water-temperature data were collected on the Maurice and Cohansey Rivers to supplement existing tidal data for the period of July 15, 2021, through July 15, 2024. In this study, the salt-front was defined as the location where the average SC concentration in the thalweg of the river was 1,100 microsiemens per centimeter (µS/cm). Each SC longitudinal survey measurement in the river reach was defined from the mouth to approximately the head of tide. An equation was developed for the Maurice River at the Mauricetown, New Jersey (N.J.) (USGS site no. 01412130) gage using data from 14 longitudinal river surveys with a standard error of the estimate of 0.1 river miles (RMs). The equation for the Cohansey River at Greenwich, N.J. gage used data from 12 longitudinal river surveys and had a resulting standard error of the estimate of about 0.1 RMs. Calculations using the Maurice River equation had a more uniform distribution of survey data points compared to the calculations from the Cohansey River equation, which appeared to show more scatter and less precision along the range of SC and RMs. The scatter in data was potentially because of the gage location closer to the mouth of the Cohansey River and higher influence from tidal fluctuations and hydrodynamic processes.
During the study period, the Maurice River model (fig. 8A) estimated the daily upstream location of the salt-front from as low as 10.8 RMs in April 2024 and a maximum of 23.2 RMs in August 2022. The Cohansey River model (fig. 8B) estimated the range of the daily salt-front from as far downstream as 18.5 RMs between March 12 to April 23, 2024, and a maximum daily upstream location of 20.4 RMs in October 2022. The study found that as freshwater-runoff streamflow recedes, the salt-front gradually begins to move upstream. Review of estimated salt-front locations seemed to indicate salt-front movement upstream in the Maurice River was primarily driven by low freshwater inputs and consistent average or above-average high tides. Notable salt-front movement downstream along the river reach was almost always a result of a freshwater runoff event and not heavily influenced by below normal (neap) tides alone. The Cohansey River seemed to be more responsive to runoff and tidal variation. It is noted that the primary driver of downstream movement was a notable rainfall-runoff event, but more variability in salt-front location was visible in these final estimated data (fig. 8B).
Developing a relationship between the SC in these rivers and the chloride concentration was beyond the scope of the study. The selection of 1,100 µS/cm to define the salt-front was based primarily on the review of published literature for the Delaware and Hudson Rivers (Department of the Army Corps of Engineers, 1982; de Vries and Weiss, 2001; Delaware River Basin Commission, 2023).
References Cited
Barksdale, H.C., 1968, The northeast water supply crisis of the 1960's: U.S. Geological Survey Monograph, 14 p., accessed May 1, 2025, at https://doi.org/10.3133/70039594.
Closson, J.L., Suro, T.P., Bunnell, Z.J., 2026, Salinity intrusion along the Maurice and Cohansey Rivers in New Jersey between July 2021 through July 2024: U.S. Geological Survey data release, https://doi.org/10.5066/P13AFSIP.
Cohen, B., 1957, Salinity of water in the Delaware Estuary: U.S. Geological Survey Open-File Report 57–20, p. 7, 13. [Also available at https://pubs.usgs.gov/publication/ofr5720.]
Cohen, B., and McCarthy, L.T., Jr., 1962, Salinity of the Delaware Estuary: U.S. Geological Survey Water-Supply Paper 1586–B, p. 6–9, 33, accessed January 8, 2024, at https://doi.org/10.3133/wsp1586B.
Cook, S.E., Warner, J.C., and Russel, K.L., 2023, A numerical investigation of the mechanisms controlling salt intrusion in the Delaware Bay estuary: Estuarine, Coastal and Shelf Science, v. 283, p. 1–3, accessed August 19, 2024, at https://doi.org/10.1016/j.ecss.2023.108257.
de Vries, P.M., and Weiss, L.A., 2001, Salt-front movement in the Hudson River estuary, New York—Simulations by one-dimensional flow and solute-transport models: U.S. Geologic Survey Water-Resources Investigations Report 99–4024, p. 2, 6, 8, 13, accessed August 21, 2024, at https://doi.org/10.3133/wri994024.
Delaware River Basin Commission, 2016, Delaware River Basin: Delaware River Basin Commission webpage, accessed April 30, 2025, at https://www.nj.gov/drbc/library/images/DRB_land-cover.jpg.
Delaware River Basin Commission, 2023, Salt front: Delaware River Basin Commission webpage, accessed August 20, 2024, at https://drbc.net/Sky/hydro/saltfront.html.
Durfor, C.N., and Keighton, W.B., 1954, Chemical characteristics of Delaware River water, Trenton, New Jersey, to Marcus Hook, Pennsylvania: U.S. Geological Survey Water Supply Paper 1262, p. 24, 35, 1 pl., accessed August 20, 2024, at https://doi.org/10.3133/wsp1262.
Hansen, D.V., and Rattray, M., Jr., 1965, Gravitational circulation in straits and estuaries: Journal of Marine Research, v. 23, no. 2, p. 104, accessed August 20, 2024, at https://elischolar.library.yale.edu/journal_of_marine_research/1048.
Harrison, C.H., 2013, Cumberland County New Jersey—265 years of history: Charleston, South Carolina, The History Press, [variously paged], accessed April 30, 2025, at https://books.google.com/books?id=Z592CQAAQBAJ&printsec=frontcover#v=onepage&q&f=false.
Held, L., 2024, As saltwater encroaches on farms, solutions emerge from the marshes: New Jersey Spotlight News and Civil Eats, January 16, 2024, accessed May 5, 2025, at https://www.njspotlightnews.org/special-report/climate-change-already-changing-what-some-farmers-can-grow-south-jersey-salt-hay-marsh-grasses-salt-enc roachment/.
Hutson, S.S., Linsey, K.S., Ludlow, R.A., Reyes, B., and Shourds, J.L., 2010, Estimated use of water in the Delaware River Basin in Delaware, New Jersey, New York, and Pennsylvania: U.S. Geological Survey Scientific Investigations Report 2015–5142, p. 4, 6, 11, 19, accessed August 20, 2024, at https://doi.org/10.3133/sir20155142.
Mondal, P., Walter, M., Miller, J., Epanchin-Niell, R., Gedan, K., Yawatkar, V., Nguyen, E., and Tully, K.L., 2023, The spread and cost of saltwater intrusion in the U.S. Mid-Atlantic: Nature Sustainability, v. 6, p. 1352–1362, accessed April 30, 2025, at https://doi.org/10.1038/s41893-023-01186-6.
National Weather Service, 2021, October 29–30—Coastal storm brings major tidal flooding: National Weather Service webpage, accessed July 16, 2024, at https://www.weather.gov/phi/eventreview20211029.
U.S. Environmental Protection Agency, 2025, National secondary drinking water regulations (NSDWRs): U.S. Environmental Protection Agency website, accessed February 3, 2025, at https://www.epa.gov/sdwa/drinking-water-regulations-and-contaminants
U.S. Geological Survey, 2019, Specific conductance: U.S. Geological Survey Techniques and Methods, book 9, chap. A6.3, p. 8–10, accessed April 30, 2025, at https://doi.org/10.3133/tm9A6.3. [Supersedes USGS Techniques of Water-Resources Investigations, book 9, chap. A6.3, ver. 1.2.]
U.S. Geological Survey, 2026, USGS water data for the Nation: U.S. Geological Survey National Water Information System database, accessed January 7, 2026, at http://doi.org/10.5066/F7P55KJN.
Wagner, R.J., Boulger, R.W., Jr., Oblinger, C.J., and Smith, B.A., 2006, Guidelines and standard procedures for continuous water-quality monitors—Station operation, record computation, and data reporting: U.S. Geological Survey Techniques and Methods book 1, chap. D3, 51 p., 8 attachments, accessed August 21, 2024, at https://doi.org/10.3133/tm1D3. [Supersedes Water Resources Investigations Report 00–4252.]
Wilde, F.D., 2006, Chapter A6 section 6.1 temperature (version 2): U.S. Geological Survey Techniques of Water-Resources Investigations, book 9, chap. 6.1, accessed July 31, 2025, at https://doi.org/10.3133/twri09A6.1.
Zhu, J., Cheng, X., Li, L., Wu, H., Gu, J., and Lyu, H., 2020, Dynamic mechanism of an extremely severe saltwater intrusion in the Changjiang estuary in February 2014: Hydrology and Earth System Sciences, v. 24, no. 10, p. 5043–5056, accessed August 21, 2024, at https://doi.org/10.5194/hess-24-5043-2020.
Conversion Factors
International System of Units to U.S. customary units
Temperature in degrees Celsius (°C) may be converted to degrees Fahrenheit (°F) as follows:
°F = (1.8 × °C) + 32.
Temperature in degrees Fahrenheit (°F) may be converted to degrees Celsius (°C) as follows:
°C = (°F – 32) / 1.8.
Datum
Vertical coordinate information is referenced to the North American Vertical Datum of 1988 (NAVD 88).
Horizontal coordinate information is referenced to the North American Datum of 1983 (NAD 83).
Altitude, as used in this report, refers to distance above the vertical datum.
Supplemental Information
Specific conductance is given in microsiemens per centimeter at 25 degrees Celsius (µS/cm at 25°C).
Concentrations of chemical constituents in water are given in milligrams per liter (mg/L).
A water year is the 12-month period from October 1 through September 30 of the following year and is designated by the calendar year in which it ends.
For more information, contact:
Director, New Jersey Water Science Center
3450 Princeton Pike, Suite 110
Lawrenceville, New Jersey 08648
Or go to our website at https://www.usgs.gov/centers/new-jersey-water-science-center.
Publishing support provided by the Baltimore Publishing Service Center
Disclaimers
Any use of trade, firm, or product names is for descriptive purposes only and does not imply endorsement by the U.S. Government.
Although this information product, for the most part, is in the public domain, it also may contain copyrighted materials as noted in the text. Permission to reproduce copyrighted items must be secured from the copyright owner.
Suggested Citation
Closson, J.L., Suro, T.P., and Niemoczynski, L.M., 2026, Methods for estimating daily upstream location of the freshwater-saltwater interface along the Maurice and Cohansey Rivers, New Jersey: U.S. Geological Survey Scientific Investigations Report 2025–5090, 19 p., https://doi.org/10.3133/sir20255090.
ISSN: 2328-0328 (online)
Study Area
| Publication type | Report |
|---|---|
| Publication Subtype | USGS Numbered Series |
| Title | Methods for estimating daily upstream location of the freshwater-saltwater interface along the Maurice and Cohansey Rivers, New Jersey |
| Series title | Scientific Investigations Report |
| Series number | 2025-5090 |
| DOI | 10.3133/sir20255090 |
| Publication Date | April 02, 2026 |
| Year Published | 2026 |
| Language | English |
| Publisher | U.S. Geological Survey |
| Publisher location | Reston, VA |
| Contributing office(s) | New Jersey Water Science Center |
| Description | Report: v, 19 p.; Data Release |
| Country | United States |
| State | New Jersey |
| Other Geospatial | Maurice and Cohansey Rivers |
| Online Only (Y/N) | Y |
| Additional Online Files (Y/N) | N |