

Opportunities and Challenges in Using Solid Phase Adsorption Toxin Tracking (SPATT) Samplers for Monitoring Cyanotoxins in Freshwater and Estuarine Environments
Links
- Document: Report (9.8 MB pdf) , HTML , XML
- Data Releases:
- USGS data release - Cyanotoxin concentrations in extracts from cyanobacteria colonies, plankton net tows, and Solid Phase Adsorption Toxin Tracking (SPATT) samplers in western rivers, lakes, and reservoirs, including drinking water sources in the Oregon Cascades: 2016-2020
- USGS data release - Cyanotoxin Concentrations in Extracts from Solid Phase Adsorption Toxin Tracking (SPATT) and Diffusive Gradients in Thin-Films (DGT) Samplers in Owasco Lake, Seneca Lake, and Skaneateles Lake, Finger Lakes Region, New York, 2019
- USGS data release - Cyanobacteria, Cyanotoxin, Cyanotoxin Synthetase Gene, and other Water-Quality Data Collected from Five River Basins in the North Atlantic Appalachian Region, August through September, 2020
- USGS data release - Cyanotoxins in the California Sacramento-San Joaquin Delta: Fixed Station Solid Phase Adsorption Toxin Tracking (SPATT) samplers
- USGS data release - Cyanotoxin concentrations in extracts from Solid Phase Adsorption Toxin Tracking (SPATT) samplers and other water-quality data collected from the Salem River, New Jersey, July-October, 2020
- USGS data release - Cyanobacteria, other water-quality, and discharge data collected from the Raritan River Basin, New Jersey, August 2020 through August 2021
- NGMDB Index Page: National Geologic Map Database Index Page (html)
- Download citation as: RIS | Dublin Core
Acknowledgments
The authors thank David Alvarez, U.S. Geological Survey; Raphael Kudela, University of California at Santa Cruz; Judy Westrick, Lumigen Instrument Center at Wayne State University; and Gregory Boyer, State University of New York Environmental Science and Forestry, for their technical and analytical guidance and input. The authors also thank the numerous cooperators who helped make this data synthesis effort possible: California Delta Stewardship Council, California Delta Regional Monitoring Program, California Department of Water Resources, California State Water Resources Control Board, New Jersey Department of Environmental Protection, New Jersey Water Supply Authority, Montclair State University, Monmouth University, New York State Department of Environmental Conservation, Clackamas River Water Providers, City of Salem, Eugene Water and Electric Board, Oregon Department of Environmental Quality, Wisconsin Department of Natural Resources, Tennessee State University, and the National Park Service.
Abstract
Cyanobacterial toxins (cyanotoxins) represent a substantial threat to drinking water supplies and safe recreational uses of freshwater resources in watersheds worldwide. Monitoring cyanotoxins can be difficult because toxin events are variable in both space and time, are not always persistent, can be moved easily by wind and currents, and may be degraded biotically or abiotically. Thus, monitoring programs that collect discrete samples on a monthly or even bimonthly interval can miss key events and underestimate cyanotoxin risk or if they capture a high-concentration event, can give a false impression that cyanotoxins are a widespread health hazard. The use of Solid Phase Adsorption Toxin Tracking (SPATT) samplers helps address this issue by providing a time-weighted average estimate of dissolved cyanotoxin occurrence and relative concentrations. SPATT samplers have been used as a complement to traditional monitoring programs and can help elucidate cyanotoxin dynamics. SPATT samplers have been used by six U.S. Geological Survey (USGS) Water Science Centers (New York, California, Oregon, Upper Midwest, New Jersey, and Lower Mississippi-Gulf) to monitor various cyanotoxins in waterbodies such as streams, rivers, lakes, waterfalls, estuaries, and drinking-water intakes. Despite their use across the USGS, there is little guidance available to ensure consistent approaches and data quality across the Bureau. This report summarizes best practices for SPATT deployment and analysis, synthesizes data and describes lessons learned from USGS studies, identifies priority knowledge gaps, and offers considerations for future targeted experiments to help improve data collection and interpretation.
Introduction
Cyanobacterial toxins (hereafter referred to as cyanotoxins or toxins) are a threat to water quality in aquatic ecosystems across the globe (Chorus and Welker, 2021). These secondary metabolites can be produced by numerous cyanobacterial taxa and generally are classified by their primary target organ system(s), which includes hepatotoxins (microcystins, nodularins, and cylindrospermopsins) and neurotoxins (anatoxins and saxitoxins; Bláha and others, 2009; Kaushik and Balasubramanian, 2013; Chorus and Welker, 2021). Many cyanotoxin classes have numerous congeners (Kelly and others, 2019) that can vary in toxicity (Chaffin and others, 2023). Microcystin, for example, has 246 documented congeners (Spoof and Catherine, 2016), which are identified by 2 variable amino acid positions on the molecule (Gupta and others, 2003). Most cyanotoxins are produced intracellularly but can be released into the environment through lysis of cell membranes (Paerl and Otten, 2013) during senescence or environmental stress (Merel and others, 2013). In coastal areas, cells can lyse when transported into water of higher salinity (Bormans and others, 2019; Kruk and others, 2021). Unlike most other cyanotoxins, cylindrospermopsins are thought to be actively transported by cells into the surrounding environment (Scarlett and others, 2020). At elevated concentrations, microcystins can be dangerous to humans, livestock, pets, and wild animals through acute exposure (Miller and others, 2010; Wood, 2016; Metcalf and others, 2021). The effects of chronic exposure to low concentrations of microcystins remain poorly understood, but carcinogenic effects of chronic low exposure have been reported in mice (Nishiwaki-Matsushima and others, 1992). Anatoxins, saxitoxins, and cylindrospermopsins can also cause acute and chronic health effects but are not as well studied as microcystins (Carmichael, 2001; Bláha and others, 2009; Carmichael and Boyer, 2016; Wood, 2016; Chorus and Welker, 2021). Cyanotoxins can move through food webs (Garcia and others, 2010; Ferrão-Filho and Kozlowsky-Suzuki, 2011), with evidence indicating this pathway can negatively affect invertebrates and vertebrates as well (Miller and others, 2010; Ferrão-Filho and Kozlowsky-Suzuki, 2011; Moy and others, 2016; Mehinto and others, 2021).
Given the risks of cyanotoxin exposure across aquatic ecosystems, routine monitoring is critical (Kudela, 2011). However, monitoring cyanotoxins is challenging because events can be episodic or ephemeral, and not all blooms of cyanobacteria produce cyanotoxins (Graham and others, 2012; Carmichael and Boyer, 2016; Preece and others, 2017; Peacock and others, 2018; Tatters and others, 2019, 2021). Cyanotoxin concentrations can vary spatially and temporally with the movement of water from winds, tides, seiches, or river flows, making traditional discrete sampling techniques inherently biased (Kudela, 2011; Peacock and others, 2018; Tatters and others, 2021). In some instances, discrete samples may underestimate cyanotoxin concentrations if ambient concentrations are below the detection limit of the analytical tools used (Kudela, 2011). Solid Phase Adsorption Toxin Tracking (SPATT) samplers can complement discrete water sampling and address some of the shortcomings of the discrete sampling approach by integrating varying cyanotoxin concentrations over time and concentrating cyanotoxins in the water column that would otherwise not be measurable (MacKenzie and others, 2004; MacKenzie, 2010). In addition, the use of a passive sampler such as the SPATT, can provide useful information regarding environmental conditions over time in studies where taking numerous discrete samples would be financially or logistically impractical (Alvarez and others, 2004).
The history of SPATT sampler development and efficacy for a wide range of algal toxins and cyanotoxins in marine and freshwater environments has been reviewed by Kudela (2017), Roué and others (2018), and Kamali and others (2022). SPATT samplers were first developed to mimic the exposure of bivalves for monitoring marine algal toxins (MacKenzie and others, 2004; MacKenzie, 2010). Several years later, researchers began to use SPATT samplers in freshwaters to study cyanotoxin transport in river systems (Miller and others, 2010; Kudela, 2011; Wood and others, 2011). The episodic transport of cyanotoxins from upstream sources makes SPATT samplers a useful tool for monitoring downstream river cyanotoxin concentrations over time. SPATT samplers were used to study microcystin transport from freshwaters into the coastal ocean in California (Kudela, 2011; Gibble and Kudela, 2014; Tatters and others, 2021) and were useful in determining the cause of an otter mortality event (Miller and others, 2010). Researchers also have explored SPATT samplers as a tool for understanding the effect of anatoxins (Wood and others, 2011; Bouma-Gregson and others, 2018) and nodularins (Wood and others, 2012) produced by benthic cyanobacterial mats in rivers and lakes. SPATT samplers typically are comprised of synthetic adsorbent resin beads encased in a porous mesh (MacKenzie and others, 2004; Roué and others, 2018). The samplers are deployed in the environment for a period of hours to months (depending on study objectives) to obtain a semiquantitative spatial- and temporal-weighted average of cyanotoxin concentration (MacKenzie and others, 2004; MacKenzie, 2010; Kudela, 2011; Roué and others, 2018). The SPATT approach is considered semiquantitative as toxin concentrations adsorbed to the resin cannot be directly related to toxin concentrations in the environment (Lane and others, 2010; Kudela, 2011, 2017).
SPATT samplers have been used in cyanotoxin monitoring programs and research studies worldwide (Roué and others, 2018), but there remain unknowns with regard to standardized protocols for their use and analysis. For example, in their review, Roué and others (2018) noted that the type and quantity of adsorbent resin used, deployment length, and conditions of a given environment could affect cyanotoxin adsorption onto SPATT samplers. Variations in SPATT sampler construction, pre- and post-deployment storage and processing, and extraction protocols exist across the literature and in several U.S. Geological Survey (USGS) cyanotoxin studies that used SPATT methodologies. Through synthesis of these USGS studies, this report aims to identify knowledge gaps and best practices that will refine SPATT methods, reduce data uncertainties, and improve the quality of data collected with these passive sampling devices.
Purpose and Scope
SPATT samplers were developed more than 20 years ago (MacKenzie and others, 2004), and despite their widespread global use for cyanotoxins, there is little specific guidance available to ensure consistent methods and data quality across studies. Although a USGS Techniques and Methods report (Alvarez, 2010) has been developed for two other passive sampling devices, semipermeable membrane devices (SPMD) and Polar Organic Chemical Integrated Samplers (POCIS) and includes best practices for general use of passive samplers, there are important SPATT-specific considerations that are not addressed in that report. Because SPATT samplers are an underdeveloped tool for cyanotoxin monitoring, we currently (2026) lack the data needed to compile a field manual or a USGS Techniques and Methods report. To move toward the goal of generating more consistent SPATT data, this report (1) provides information about how to use SPATT samplers in cyanotoxin research and monitoring studies by describing the lessons learned from 12 studies led by USGS researchers and (2) identifies key knowledge and science gaps that could be filled to improve the use of SPATT samplers and help ensure data are being interpreted consistently and appropriately.
Passive Samplers
Passive sampling devices, like SPATT, accumulate dissolved molecules through diffusion, which is driven by a difference in chemical concentration between the surrounding water and sampler material (Górecki and Namieśnik, 2002; Kot-Wasik and others, 2007). As passive sampling devices, they can be deployed in the environment for an extended period without moving parts or the need for close supervision (Górecki and Namieśnik, 2002). The use of passive samplers is expanding in water-quality studies (Kot-Wasik and others, 2007; Silvani and others, 2017; Godlewska and others, 2021) and cyanotoxin monitoring (Zendong and others, 2016; Roué and others, 2018; Kamali and others, 2022) because they can overcome limitations linked to discrete sampling (Kudela, 2017). Advantages of passive samplers include the ability to integrate the occurrence of dissolved molecules over long periods (from days to weeks to months), capacity to capture episodic or ephemeral events, relative low cost, and ease of use (Kudela, 2017; Roué and others, 2018; Kamali and others, 2022). Passive samplers are particularly suited to flowing and tidal systems, which pose challenges to the interpretation of discrete data because of the rapid movement of large volumes of water.
There are two types of passive samplers typically used in aquatic environments: (1) equilibrium and (2) non-equilibrium or integrative samplers. Equilibrium samplers are designed to allow equilibration between concentrations in the surrounding water and the amount adsorbed to the sampler, whereas integrative samplers are designed to not reach equilibrium with the surrounding water during deployment (Kot-Wasik and others, 2007; Kudela, 2017). Integrative samplers such as SPATT, POCIS, and organic diffusive gradients in thin films (o-DGT; table 1), have a high capacity for collecting the compounds of interest and are effective in environments where concentrations of the target molecule vary through time (Kot-Wasik and others, 2007; Kudela, 2017). Integrative samplers can accumulate and concentrate very low, but ecologically relevant, concentrations of a target compound over a longer deployment period (Vrana and others, 2005; Kot-Wasik and others, 2007), making them especially useful in cyanotoxin research.
Table 1.
Types of integrative passive samplers that have been used to examine cyanotoxins in aquatic environments.[HLB, hydrophilic-lipophilic balanced; o-DGT, organic diffusive gradients in thin film; POCIS, Polar Organic Chemical Integrated Samplers; SPATT, Solid Phase Adsorption Toxin Tracking; µm, micrometer]
| Sampler | Membrane pore size | Sorbent | Cyanotoxins reported in publications | Benefits | Limitations | References |
|---|---|---|---|---|---|---|
| POCIS | 0.1 µm | Synthetic adsorbent resin; Oasis HLB preferred | Microcystins, cylindrospermopsins | Biofouling-resistant membrane | Semiquantitative concentrations, calibration required | Alvarez and others, 2004; Kot-Wasik and others, 2007; Nyoni and others, 2017; Brophy and others, 2019; Yao and others, 2019; Kim and others, 2021; Kamali and others, 2022 |
| o-DGT | Varies, if protective membrane is used | Synthetic adsorbent resin; XAD18 preferred | Microcystins | Quantitative concentrations, reduced sensitivity to hydrodynamic conditions | Physically fragile, calibration required | Zhang and Davison, 1995; Kot-Wasik and others, 2007; D’Angelo, 2019; Wang and others, 2022 |
| SPATT | 100 µm | Synthetic adsorbent resin; HP20 preferred | Microcystins, nodularins, anatoxins, saxitoxins, cylindrospermopsins | Simple, cost effective, widely used for cyanotoxins | Semiquantitative concentrations, lack of calibration and validation | MacKenzie, 2010; MacKenzie and others, 2004; Lane and others, 2010; Kudela, 2011, 2017, 2020; Wood and others, 2011; Roué and others, 2018; Howard and others, 2022; Kamali and others, 2022 |
Although these three integrative samplers have the ability to accumulate a variety of target molecules in a range of aquatic environments, SPATT samplers have been used most widely to target cyanotoxins, and more broadly, algal toxins in recent decades (MacKenzie and others, 2004; Kudela, 2017; Roué and others, 2018). Publications using o-DGT and POCIS samplers are limited to microcystin and cylindrospermopsin accumulation (table 1). POCIS and o-DGT samplers historically have been used to sample pesticides, pharmaceuticals, and metals (Kot-Wasik and others, 2007; D’Angelo, 2019); however, recent studies have examined their utility as microcystin and cylindrospermopsin monitoring devices (Nyoni and others, 2017; Brophy and others, 2019; Yao and others, 2019; Kim and others, 2021; Wang and others, 2022). POCIS samplers, like SPATT samplers, can provide semiquantitative cyanotoxin concentrations. Because o-DGT sampler construction requires a diffusive layer that may or may not be protected by an additional protective layer, they can be calibrated before use in the field to provide quantitative cyanotoxin concentrations (Kot-Wasik and others, 2007; D’Angelo, 2019; Wang and others, 2022). Compared to SPATT or POCIS samplers, o-DGT samplers generally are more difficult to construct (table 1).
U.S. Geological Survey Solid Phase Adsorption Toxin Tracking Studies
There have been at least 12 USGS efforts across 20 states that have included the use of SPATT samplers for cyanotoxin monitoring, research, and outreach (fig. 1; table 2). Collectively, these studies included a broad range of aquatic environments, and their designs and approaches served as the foundation for the synthesis provided in this report. Together, these 12 USGS studies used SPATT samplers to address broad purposes, including (1) assessment of methods and performance for cyanotoxin measurements; (2) understanding how SPATT approaches fit into the cyanotoxin sampling and monitoring toolbox; and (3) evaluation of occurrence, spatiotemporal variability, and transport of cyanotoxins (table 2).
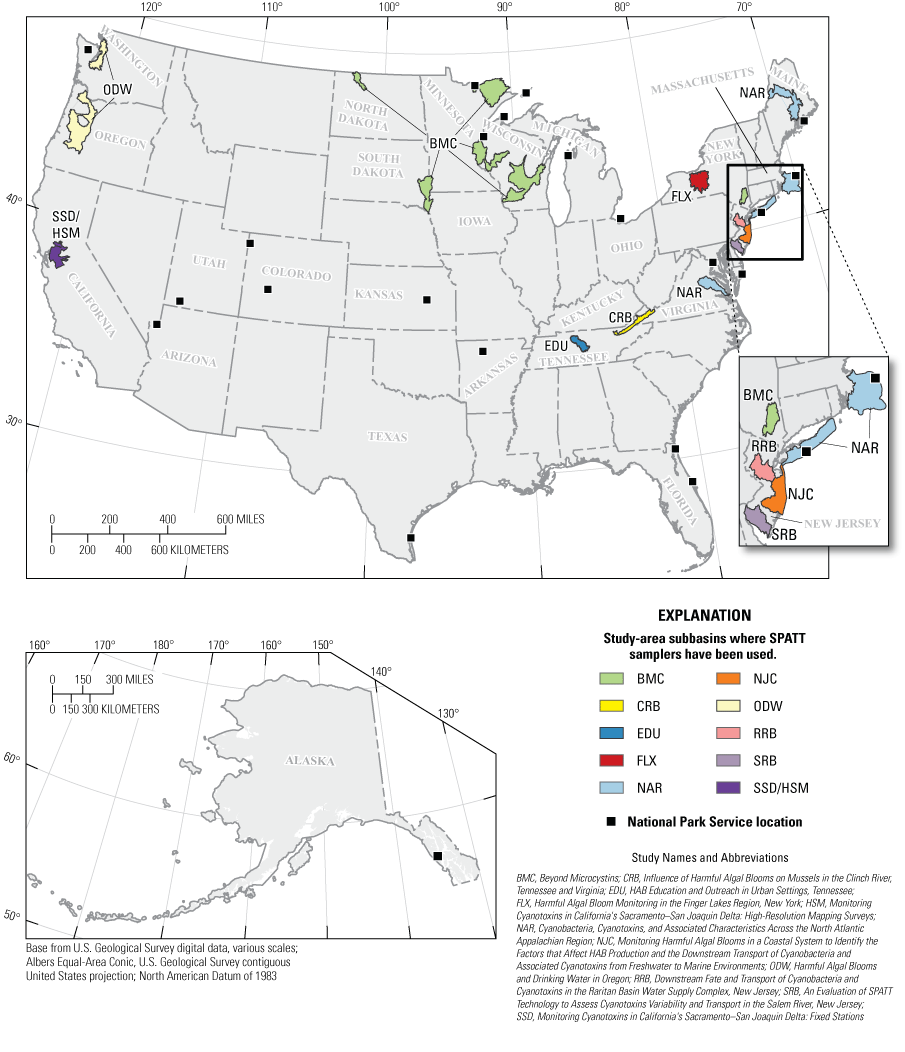
Study locations where the Solid Phase Adsorption Toxin Tracking (SPATT) samplers have been used in U.S. Geological Survey cyanotoxin studies synthesized in this report. Note that each designated study subbasin encompasses all sampling sites in a study and may be a combination of two or more subbasins.
Table 2.
U.S. Geological Survey studies that have used Solid Phase Adsorption Toxin Tracking (SPATT) samplers for measuring cyanotoxins that were reviewed in this report.[Other environments include drinking water sources (ODW and RRB studies) and waterfalls (BMC study). Abbreviations: abbr., abbreviation; HABs, harmful algal blooms; NPS, National Park Service; USGS, U.S. Geological Survey; X, study was relevant to each environment; —, not applicable]
SPATT samplers have been used at the watershed scale to evaluate the spatiotemporal occurrence of cyanotoxins in the Raritan River Basin and Salem River Basin in New Jersey (table 2; accompanying data releases Spitz and others, 2025; Trevino and others, 2025) and numerous river basins in Oregon (Clackamas, North Santiam, McKenzie, Willamette, and Tualatin River Basins [not shown]; Harmful Algal Blooms and Drinking Water in Oregon [ODW] study; fig. 1; accompanying data release Carpenter and Wise, 2023; Carpenter and others, 2025). In these studies, SPATT samplers were concurrently deployed in multiple locations along river corridors to generate a consistent time series of time-integrated cyanotoxin concentrations. In the Harmful Algal Bloom Monitoring in the Finger Lakes Region, New York (FLX) study in New York (accompanying data release Stouder and others, 2024), SPATT samplers were deployed at multiple water depths to study cyanotoxin occurrence throughout the water column. SPATT samplers have also been used at the regional scale to compare cyanotoxin occurrence and diversity among watersheds in Wisconsin, North Dakota, and Minnesota (Beyond Microcystins [BMC] study). Although the regional scale SPATT deployment necessitated lower spatial sampling density compared to a watershed-scale SPATT study, the regional scale can give information on cyanotoxin patterns across ecosystems, climate regimes, and large geological features. A joint USGS and National Park Service study (Rapid Response Strategy for Potential Toxin Exposures from Harmful Algal Blooms in Coastal and Shoreline Areas of National Parks [NPS]) used SPATT samplers to monitor cyanotoxins and establish rapid response protocols in 22 national parks and National Parks Service managed areas across the United States.
SPATT samplers have been used to study the transport of cyanotoxins across the freshwater to marine interface (Cyanobacteria, Cyanotoxins, and Associated Characteristics Across the North Atlantic Appalachian Region [NAR; accompanying data release Trevino and others, 2024], Monitoring Harmful Algal Blooms in a Coastal System to Identify the Factors that Affect HAB Production and the Downstream Transport of Cyanobacteria and Associated Cyanotoxins from Freshwater to Marine Environments [NJC], Monitoring Cyanotoxins in California's Sacramento–San Joaquin Delta: Fixed Stations [SSD; accompanying data release Bouma-Gregson and others, 2025], and Monitoring Cyanotoxins in California's Sacramento–San Joaquin Delta: High-Resolution Mapping Surveys [HSM] studies; table 2). These studies focused on lowland rivers and estuaries to evaluate the transport of cyanotoxins into the coastal ocean. In the Sacramento–San Joaquin Delta, in California (HSM study), SPATT samplers were deployed in a boat-based flow-through chamber to collect spatially integrated data. SPATT samplers were swapped out as the boat traveled through different regions of the Sacramento–San Joaquin Delta, providing insight into the drivers, sources, and transport of cyanotoxins. SPATT samplers have also been used to examine the transfer of cyanotoxins to shellfish in rivers of Tennessee and Virginia (Influence of Harmful Algal Blooms on Mussels in the Clinch River, Tennessee and Virginia [CRB] study). There are many endangered or threatened species of mussels in the southeastern United States, and understanding the effect of cyanotoxins on their health is important to their continued management. Additionally, SPATT samplers have been used as educational tools, helping students from diverse backgrounds learn about environmental biology, water chemistry, laboratory methods, and biotechnology, all while doing cyanotoxin research in local urban waterways (HAB Education and Outreach in Urban Settings, Tennessee [EDU] study). The diversity in geography and scope of these 12 USGS SPATT studies provide numerous lessons learned in the generation and interpretation of cyanotoxin data.
Key Takeaways
-
• SPATT samplers can provide a time-weighted average estimate of dissolved cyanotoxin concentration and complement traditional discrete sampling.
-
• SPATT samplers can be used to monitor cyanotoxins in various waterbodies, including streams, rivers, lakes, estuaries, and drinking-water intakes.
-
• SPATT samplers accumulate dissolved molecules through diffusion, tracking the occurrence of dissolved molecules over many days and capturing episodic events.
-
• There have been at least 12 recently completed USGS efforts across 20 states that have included the use of SPATT samplers for cyanotoxin monitoring, research, and outreach.
-
• This report synthesizes lessons learned from these USGS efforts and identifies key knowledge gaps.
Generating Solid Phase Adsorption Toxin Tracking Data
Generating data using SPATT samplers can be done in a variety of ways that can be tailored to project objectives and the deployment environment. Generally, SPATT samplers are constructed using adsorbent resin secured in mesh and then securely deployed into the environment for a period of time. SPATT construction materials and designs, deployment methods, and potential interference consideration are discussed in more detail in the next sections.
Solid Phase Adsorption Toxin Tracking Sampler Construction
SPATT samplers generally are constructed using mesh and an adsorbent resin to which dissolved cyanotoxins in the environment can adsorb to. However, there are numerous commercially available sorbents and standard sampler designs that can be used depending on the cyanotoxin(s) of interest, deployment environment, and supplies available to a research program. These construction options are described in more detail in the next sections, with examples from the 12 USGS studies listed in table 3.
Table 3.
Solid Phase Adsorption Toxin Tracking (SPATT) sampler design, deployment approach, and deployment duration that have been used in U.S. Geological Survey studies.[All studies used 100-micrometer Nitex mesh for sampler membranes and 3 grams of HP20 Diaion resin as the sorbent. Abbreviations: abbr., abbreviation; BMC, Beyond Microcystins; CRB, Influence of Harmful Algal Blooms on Mussels in the Clinch River, Tennessee and Virginia; EDU, HAB Education and Outreach in Urban Settings, Tennessee; FLX, Harmful Algal Bloom Monitoring in the Finger Lakes Region, New York; HSM, Monitoring Cyanotoxins in California's Sacramento–San Joaquin Delta: High-Resolution Mapping Surveys; NAR, Cyanobacteria, Cyanotoxins, and Associated Characteristics Across the North Atlantic Appalachian Region; NJC, Monitoring Harmful Algal Blooms in a Coastal System to Identify the Factors that Affect HAB Production and the Downstream Transport of Cyanobacteria and Associated Cyanotoxins from Freshwater to Marine Environments; NPS, Rapid Response Strategy for Potential Toxin Exposures from Harmful Algal Blooms in Coastal and Shoreline Areas of National Parks; ODW, Harmful Algal Blooms and Drinking Water in Oregon; RRB, Downstream Fate and Transport of Cyanobacteria and Cyanotoxins in the Raritan Basin Water Supply Complex, New Jersey; SRB, An Evaluation of SPATT Technology to Assess Cyanotoxins Variability and Transport in the Salem River, New Jersey; SSD, Monitoring Cyanotoxins in California's Sacramento–San Joaquin Delta: Fixed Stations]
Sorbents
Numerous studies have assessed the utility of different sorbent resins with a variety of target cyanotoxins (as reviewed by Roué and others [2018]). More than 15 commercially available resins have been used to successfully sorb cyanotoxins using SPATT samplers (Roué and others, 2018). HP20 (DIAION, Mitsubishi Chemical Company, Tokyo, Japan), a porous, cross-linked, styrene-divinylbenzene resin, generally is considered a versatile resin that can adsorb multiple types of cyanotoxins and is commonly used in SPATT samplers (MacKenzie and others, 2004; Kudela, 2017, 2020; Roué and others, 2018). Because HP20 adsorbs a variety of cyanotoxins, it is an especially useful resin to use when multiple cyanotoxins are of interest (Kudela, 2017; Bouma-Gregson and others, 2018; Roué and others, 2018). Kudela (2020) and Negrey and others (2023) note that HP20 offers excellent adsorption and desorption capabilities for numerous cyanotoxins, while other resins like Oasis Hydrophilic-Lipophilic Balance (HLB; Waters Corporation, Milford, Massachusetts), Strata-X (Phenomenex, Torrance, California), and SP700 (SEPABEADS, Mitsubishi Chemical Company, Tokyo, Japan) have different properties that could be appropriate for different toxins, environments, or research objectives. HLB resin has been used to examine nodularins and anatoxins in freshwater reservoirs and lakes and has demonstrated high adsorption, as did HP20 when samplers were co-deployed (Kohoutek and others, 2008; Kudela, 2020; North Coast Regional Water Quality Control Board, 2022b). Strata-X had high capacity and fast kinetics when used to examine microcystins (Kudela, 2020) and has been determined to effectively adsorb anatoxin-a, especially during short deployment periods (Wood and others, 2011). Similarly, SP700 has indicated high adsorption capacities for microcystins in laboratory trials (MacKenzie, 2010; Zhao and others, 2013). The cost of different resins is often a consideration in the design of SPATT samplers. Kudela (2020) noted that the relatively low cost of HP20 has contributed to its common use in SPATT studies.
A range of resin masses have been examined in the literature, but Zendong and others (2016) detected that 3 grams (g) of resin performed better than 0.3 g or 10 g. The USGS studies referenced in this report (tables 2, 3) used 3 g of the HP20 resin as the sorbent, like most researchers deploying SPATT samplers (Kudela, 2017). The HP20 resin may arrive from the manufacturer containing moisture or sorbed water from the atmosphere; if this water is not removed in a desiccator, total resin mass used for a SPATT sampler may not be accurate. Although humidity can be quantified, it is often preferred to remove this water before weighing the resin to ensure the desired mass is consistently used in each SPATT sampler. In preparation for SPATT construction in the HSD and SSD studies (table 2), researchers dried the resin at 60 degrees Celsius (°C) for as much as 72 hours to remove moisture. The resin was then stored in a sealed amber glass jar or covered beaker in a desiccator until use. When weighing resin, a static deionizer can be used to eliminate or reduce electrostatic charges, making the resin easier to weigh and work with. Researchers preparing resin for use in the ODW study (table 2) did not bake resin but instead placed the resin in a desiccator and only proceeded with SPATT construction when the resin readily flowed and no longer visibly clumped together. None of the other USGS studies desiccated or baked the resin before SPATT construction. However, potential issues were noted in the NPS and RRB studies where post-deployment weights were less than the original pre-deployment weights. With no visible loss of resin during the field deployment, and best efforts to collect all resin from the samplers before extraction, researchers hypothesized that the original resin weight may have contained moisture resulting in the higher pre-deployment weight. In these instances, the original pre-deployment resin weight (3 g) is typically factored into the final concentration calculations (Negrey and others, 2023).
The resin needs to be activated before use to remove impurities and swell the resin beads, which opens up the pores and expands the surface area of the resin (Qi and others, 2014). The USGS studies used 100 percent methanol to activate SPATT resin (Lane and others, 2010; Kudela, 2017). Negrey and others (2023) recommend a 24-hour activation period during which the resin is fully immersed in methanol. However, suggested activation periods in the literature range from 2 hours (Li and others, 2016) to 48 hours (Fux and others, 2008). Lane and others (2010) also recommend sonication after methanol rinsing to remove residue, but this step was not incorporated into the USGS studies. After activation, the resin is rinsed with deionized or organic free water and then stored in deionized water at 4–6 °C until deployment (Negrey and others, 2023) because the resin needs to remain hydrated after activation so that the pores do not collapse. All of the USGS studies kept activated SPATT samplers in sealed bags of deionized or organic free water after activation through deployment in the field.
The sorption of cyanotoxins to SPATT resin is influenced by several environmental factors that can introduce potential uncertainty. For example, SPATT samplers bind cyanotoxins, along with a host of other non-target analytes, such as dissolved organic matter (Wu and others, 2011) or salinity (Fan and others, 2014) that may cause interference during deployment or analysis. Armstrong and others (2025) examined how phenolic compounds that can readily bind to SPATT resin may interfere with cyanotoxin adsorption in an estuary. The presence of the phenolic compounds caused matrix interference and greatly reduced microcystin detection (Armstrong and others, 2025). Because cyanotoxins diffuse from the surrounding ambient water through the boundary layer or region of laminar, rather than turbulent, flow and are then sorbed (Booij and others, 2017) to the SPATT resin, changes in the hydrodynamics (water velocity) of a sampling area may impact cyanotoxin sorption. Sorption rates often increase with elevated flow rates, but the direction of flow relative to the SPATT sampler position and turbulence levels may also play a role (Booij and others, 2017) and warrant further investigation.
Sampler Types
There are two common styles of SPATT samplers: (1) the sachet (fig. 2A) and (2) the hoop (fig. 2B). Both styles can be constructed in a variety of sizes and shapes. The sachet style consists of resin encased in a piece of 100-micrometer (µm) mesh nylon fabric, or Nitex (Wildco, Yulee, Florida), that is folded in half and heat-sealed on the three open sides to contain the resin (fig. 2A). The hoop style consists of resin encased between a single piece folded in half, or two separate pieces, of 100-µm mesh nylon fabric, which are then held together by an embroidery hoop (fig. 2B). Alternatively, it is possible to use a combination of both types of samplers, as demonstrated in the HSD and SSD studies (table 2; fig. 2C). This hybrid design features one 12.7-centimeter (cm) hoop with two triangle-shaped, heat-sealed sachets held in place by the hoop (fig. 2C). In these examples, the hoop acts solely as an attachment point and does not seal the nylon mesh. The style of SPATT sampler used, as well as the size of the sachet or hoop, may affect the ability of the resin to adsorb the target cyanotoxin in each sampling medium; however, effects of sampler design on performance have not been studied.
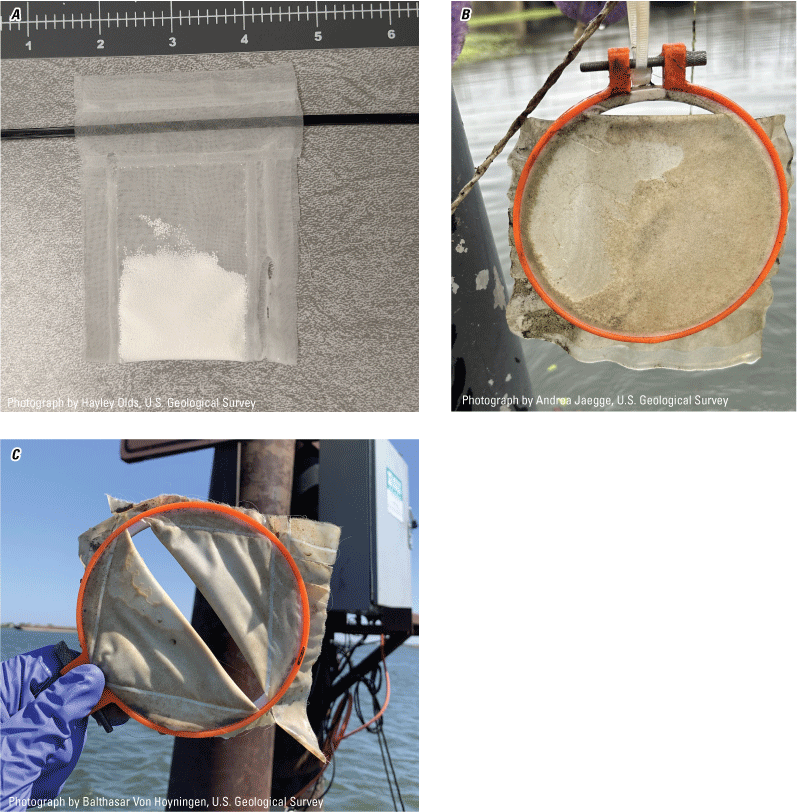
Examples of the different styles of Solid Phase Adsorption Toxin Tracking (SPATT) samplers: A, sachet; B, hoop; and C, combination of the sachet and hoop.
Each SPATT sampler type offers advantages and disadvantages in ease of construction, deployment, and extraction. The sachet generally is lower cost because they are smaller and require less nylon mesh fabric and methanol during activation. The sachet may allow for larger batch sampler preparation because more of the smaller, malleable sachets can be activated at once, as compared to the bulkier, rigid hoops. However, because of their flexible nature, the sachet style sampler has the potential to fold over during a deployment period, which could potentially result in reduced exposure surface area. One key advantage of the hoop is the ease of deployment; the hoop offers a secure attachment point for zip ties or other fasteners, and they do not need a heat-seal, relieving any concern that the heat-seal may fail during deployment. The RRB study (table 2) lost about 5 percent of the sachets deployed because of sealing issues. During the ODW study (table 2), the use of heat-sealed sachets was attempted, but it was discovered that the nylon mesh was prone to melting and, in the end, the deployment of hoops was done to ensure the resin remained secure during deployment. With the hybrid hoop-and-sachet design, despite the additional support from the hoop, sachets were detected during the SSD study without resin on two occasions, suggesting the heat-seal failed. In addition to secure seals, hoops spread the resin across the diameter of the hoop, resulting in a larger surface area in direct contact with the water, which may allow for increased adsorption of the target dissolved molecule, though this needs to be explored further. Sewing in additional patterns to help evenly distribute the resin throughout the surface of the sampler could aid in even exposure of the resin to the cyanotoxins in the water. Hoops and sachet SPATT samplers have both been successfully used across a variety of aquatic systems worldwide, and the decision to implement one style or another will ultimately depend on the study objectives, resources available, and the deployment environment.
Key Takeaways
-
• SPATT samplers are constructed using mesh and an adsorbent resin, with various commercially available sorbents and sampler designs.
-
• The HP20 resin is more commonly used in cyanotoxin SPATT research or monitoring studies than other resins.
-
• Hoops and sachet style SPATT samplers have been used successfully.
-
• Environmental conditions and SPATT sampler design may affect adsorption and desorption kinetics and warrants further study.
Deploying Solid Phase Adsorption Toxin Tracking Samplers
There are several factors to consider before deploying SPATT samplers in the environment, including the infrastructure to which the SPATT samplers will be secured, the length of time samplers can be left in the environment, potential fouling interference, and the depth of deployment. These factors will depend on the research or monitoring questions being asked and the characteristics of the deployment environment, which are described in more detail in the following text.
Deployment Infrastructure
Depending on site characteristics, such as water depth, site access, and existing infrastructure, there are a variety of ways to deploy SPATT samplers (fig. 3). Typically, SPATT samplers are secured with rope or zip ties to stable infrastructure like a dock, pipe, or post driven into the substrate (fig. 3A). In turbulent conditions, use of a weighted line may be beneficial to ensure the samplers remain submerged at the desired depth (fig. 3B). For further protection, samplers can be enclosed in a wire cage (fig. 3C) or a plastic tube mounted to a secure dock or post (fig. 3D). Such housings may reduce the buildup of debris around the samplers and can prevent loss if, for example, a sampler becomes detached but remains inside the housing. The SPATT hoops deployed in the HSM study (table 2) were mounted inside of a cooler attached to a flow-through system on a boat (fig. 3E). As the boat proceeded through the sampling transects, hoops were replaced every 30–60 minutes, and the volume of water passing through the hoop was measured using a flow meter (table 3). To target benthic cyanotoxins, MacKenzie and others (2011) successfully placed SPATT sachets in boxes mounted just above the sediment surface. The boxes reportedly protected the sachets from wind and sunlight exposure during low tide (MacKenzie and others, 2011). Depending on site characteristics and study objectives, it may be advantageous to deploy multiple SPATT samplers per sampling location. If the nylon membrane of a SPATT sampler tears, or if a SPATT sampler is lost, stolen, or vandalized, a duplicate sampler could be useful. In the ODW study (table 2), researchers placed SPATT samplers in two locations to help ensure a sampler would be present upon retrieval at priority sampling areas.
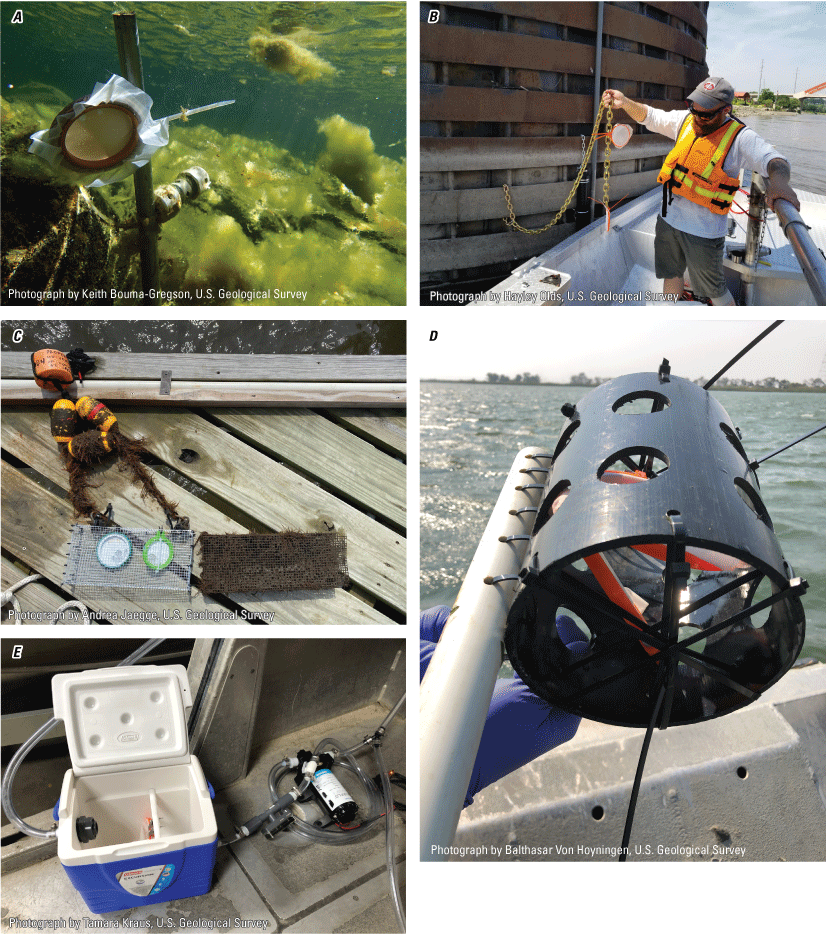
Examples of the different Solid Phase Adsorption Toxin Tracking (SPATT) deployment setups: A, zip tied to a secure structure; B, attached to a weighted line; C, in a cage; D, in plastic tubing; and E, as part of a flow-through system.
Deployment Length
The SPATT sampler deployment length will vary and depends on study objectives, the environment, and the cyanotoxins targeted. Because cyanotoxins may begin to desorb from the resin after a period of time because of approaching equilibrium, uncertainty of SPATT results often increases as the deployment duration increases. Deployments ranging from minutes to hours will be more kinetic, with more adsorption than desorption occurring (Kudela, 2017). As deployment periods lengthen from days to weeks, SPATT samplers behave more like an equilibrium sampler because cyanotoxins will desorb from the resin as environmental concentrations change (Kudela, 2017). If saxitoxin is being monitored, Rodríguez and others (2011) suggest limiting the deployment length to no more than 7 days to limit the loss of toxin from the sampler because saxitoxin is extremely hydrophilic and tends to “leak” out of synthetic resins. Studies that included the examination of saxitoxin with SPATTs have shown mixed results (Lane and others, 2010; Hattenrath-Lehmann and others, 2018). In addition, the potential for interference from fouling by suspended particles, periphyton, or animals may increase with longer deployments. Such fouling not only potentially affects adsorption and desorption kinetics, but the presence of organic and inorganic particles can complicate extraction procedures by clogging filters, which was the case during the RRB study (table 2) where sediments clogged the filters, adding substantial time to the extraction process. A solution recently implemented by researchers at the USGS Upper Midwest and New York Water Science Centers to avoid clogging is the addition of quartz wool to the extraction column. The wool is added before the resin and included in all pre-rinse steps. The quartz wool helps create a second filter barrier and has shown promise in reducing clogging in the extraction column.
As deployment lengths increase and equilibrium is approached or achieved, cyanotoxins may desorb from the SPATT resin, resulting in a loss of information from the start of the deployment period (Kudela, 2020). The time-weighted average concentrations are dependent on the properties of the sampler (resin), mass of resin, water conditions, chemical properties of the cyanotoxin(s), and exposure period (Górecki and Namieśnik, 2002; Kudela, 2011). When studying microcystin kinetics in a simulated field study, Kudela (2020) determined that the HP20 resin provides a representative time-weighted average after 7 deployment days, and anything longer is weighted toward the end of the deployment period. Therefore, deployments longer than 1 week would be biased toward the final days of the deployment period. Effects of deployment length on the SPATT results were evaluated by the California North Coast Regional Water Quality Control Board (2022a) and the SRB study by deploying multiple samplers at once and retrieving them at different times (Box 1—Assessing the Impact of Deployment Length on Solid Phase Adsorption Toxin Tracking Concentrations). These studies show that longer deployment times do not consistently result in higher cyanotoxin concentrations extracted from SPATT samplers. Additional testing in the ODW study (table 1) indicated consistently lower concentrations with long deployments (26–34 days) compared to shorter, weeklong deployments. Oregon drinking water researchers hypothesize that the lower concentrations obtained from the month-long deployments could be the result of equilibrium changes through the sampling period or possible degradation or desorption of the cyanotoxins. Although the ability to integrate averages through time makes it tempting to deploy SPATT samplers for multiple weeks, longer deployments do have some drawbacks, and researchers must balance their tolerance for uncertainty in the SPATT result, expected variation of cyanotoxins in the environment, and resources available to support sampling efforts when deciding the deployment length for a project.
SPATT sampler deployments in most published studies have been from days to weeks (Roué and others, 2018; Anderson and others, 2023). Most of the SPATT sampler deployments for the USGS studies listed in table 2 were done for several weeks (table 3). The SPATT sampler deployment frequency often matches the sampling frequency for many discrete water-quality monitoring programs, which enables field staff to collect samples on a consistent day of the week. Shorter deployments also have been done with success. Wood and others (2018) did diel SPATT sampling with sequential 2-hour deployments to track sub-daily variations in anatoxin concentrations. Additionally, the HSM study (table 3) and Peacock and others (2018) deployed SPATT samplers in flow-through systems for 30-plus minutes to track spatial variation in cyanotoxin concentrations along a boat track. When collecting discrete samples from a site, multiple-hour SPATT deployment can be convenient if other samples or data are collected at a site for a similar period of several hours. A SPATT sampler can be deployed upon arrival at the site and subsequently retrieved when all other sampling is completed.
Box 1. Assessing the Impact of Deployment Length on Solid Phase Adsorption Toxin Tracking Concentrations
In July 2020, the New Jersey Water Science Center did an intensive sampling effort to evaluate SPATT deployment lengths across three sites (Salem River Reservoir, Fox Mill Lake, and Memorial Lake [not shown]) in the Delaware River Basin (SRB study; table 2; fig. 4; Spitz and others, 2025). The Salem River Reservoir represents the farthest upstream site, followed by Fox Mill Lake, and then Memorial Lake; all three sites are characterized as flowing impoundments. Microcystins and saxitoxins have previously been documented in discrete water samples collected in Fox Mill Lake, with concentrations reaching maxima of 3.41 and 0.15 μg/L, respectively (Getto, 2021). Cyanotoxins had not previously been detected in Memorial Lake or the Salem River Reservoir but were suspected to be present. To further investigate cyanotoxin dynamics and determine optimal SPATT deployment length in the Delaware River Basin, seven SPATT samplers were deployed at the three sampling sites on day one of the experiment. During the weeklong experiment, one SPATT sampler was retrieved from the three sites each day. Microcystin, cylindrospermopsin, and saxitoxin concentrations (in nanograms per gram [ng/g]) were then quantified using enzyme-linked immunosorbent assay (ELISA) methods.
Results from this study indicated that microcystins, cylindrospermopsins, and saxitoxins were detected throughout the deployment week across the three sites and that they co-occurred 100 percent of the time (fig. 4). With the exception of saxitoxins detected at the Salem River Reservoir site (−7.89 percent after the 7-day deployment compared to the 1-day deployment), microcystin and anatoxin concentrations (ng/g) ranged between 7.61 and 633 percent higher after the 7-day deployment compared to the 1-day deployment, respectively (fig. 4). The Fox Mill Lake site showed the largest differences between the 1-day and 7-day deployments, with increases of 600, 222, and 633 percent for microcystin, cylindrospermopsin, and saxitoxin concentrations, respectively (fig. 4). These findings indicate that choosing a deployment period depends on the study objectives and the physicochemical dynamics at a given sampling site. For example, 1-day deployments were able to determine the presence of microcystins, cylindrospermopsins, and saxitoxins across the three sampling sites. As a monitoring and early warning tool, single-day deployments at these sites across the Delaware River Basin may be effective.
At a sampling site like Fox Mill Lake, where microcystins and saxitoxins have previously been detected and negatively affected the ecosystem (turtle shell disease; Getto, 2021), longer deployment periods may be necessary to fully capture toxin dynamics. The continued increase in microcystin and cylindrospermopsin concentrations at Fox Mill Lake through the 7-day deployment indicates that these toxins could continue to adsorb for longer periods (fig. 4), depending on the environmental conditions. However, it is also possible that there was simply more cellular lysis occurring at the end of the 7-day deployment or that water or wind currents pushed toxins to the location of the samplers toward the end of the experiment. In addition to considering a longer deployment at the Fox Mill Lake site and understanding the underlying physicochemical conditions, linking discrete cyanotoxin samples to SPATT findings could provide the insight needed to determine future deployment lengths needed at this site.
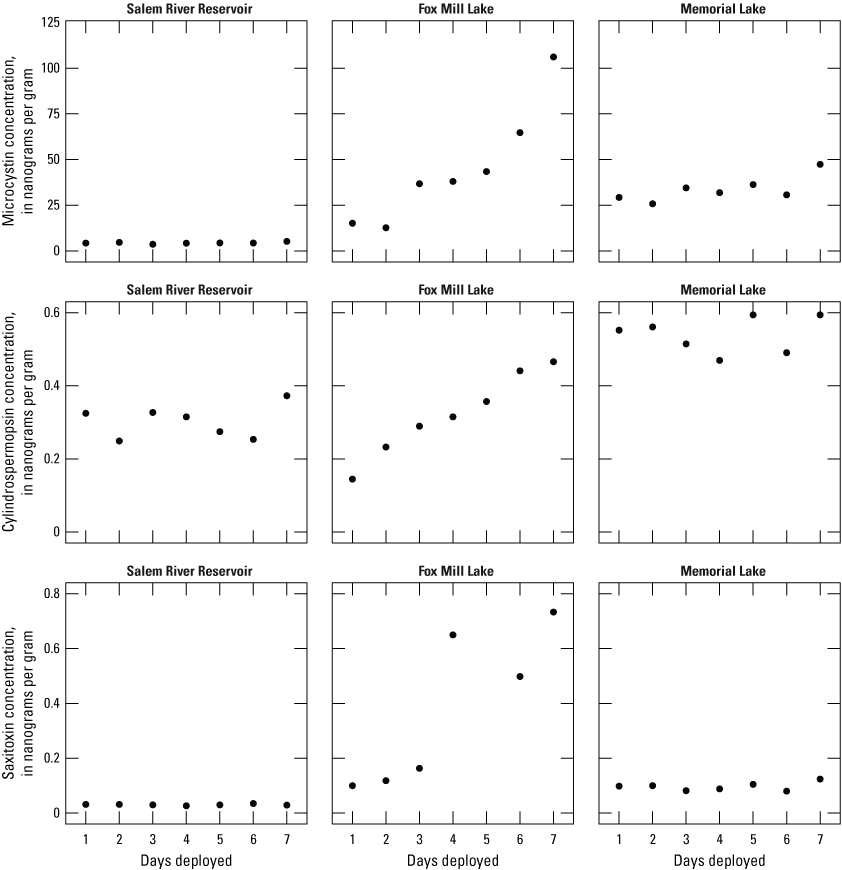
Microcystin, cylindrospermopsin, and saxitoxin concentrations (nanograms per gram [ng/g]) through the 7-day deployment length trial at Salem River Reservoir, Fox Mill Lake, and Memorial Lake in the Delaware River Basin, New Jersey (Salem River Basin study; table 2). Data summarized from Spitz and others (2025).
Fouling
Fouling, the accumulation of organic, inorganic, or biological material on instrumentation submerged in water, often affects sensor operation and data quality (Vanysacker and others, 2014; Delgado and others, 2021). On passive samplers like SPATT hoops or sachets, fouling has been known to affect permeability (Richardson and others, 2002; Lane and others, 2010), which could lead to over or underestimates of cyanotoxin concentrations. Fouling reduces flow through the sampler and limits contact between the resin and the water column, potentially leading to underestimates of cyanotoxin concentration. An additional fouling consideration is the contamination of SPATT resin by particles that would increase the final dry weight of the resin, which is used to normalize cyanotoxin concentration during the final calculation steps (Negrey and others, 2023). In these instances, the ODW study (table 2) included using the pre-deployment resin weight during the final calculations to ensure any additional, unwanted weight did not underestimate cyanotoxin concentrations. The effects of fouling on sample mass can be reduced by thoroughly rinsing SPATT samplers with field water during retrieval to wash away fine particles (Negrey and others, 2023), although this may result in the loss of saxitoxin from the sampler because of its hydrophilic nature; if saxitoxin is of interest, these rinses should be considered as part of the extract (Rodríguez and others, 2011). Other common anti-fouling strategies used for aquatic devices deployed for periods of time include the use of specialized coatings or paint and wipers or brushes (Delgado and others, 2021). However, currently (2026) these anti-fouling approaches have not been tested in conjunction with SPATT samplers.
Biofouling, or the growth and deposition of bacterial cells on a membrane (Vanysacker and others, 2014), may affect SPATT samplers but has not been the focus of research studies to date (2026). Copper cages or mesh envelopes have been successfully used with other passive samplers (Jeong and others, 2018) to deter biofouling (Magin and others, 2010), but these techniques have yet to be implemented with SPATT samplers. USGS researchers have hypothesized potential positive and negative feedback scenarios that could arise from biofouling. For example, if toxigenic cyanobacteria are able to grow on SPATT sampler surfaces (or on cages or pipes if enclosed), locally produced cyanotoxins could also be adsorbed onto the resin, resulting in overestimates of ambient cyanotoxin concentrations. Conversely, bacteria capable of cyanotoxin biodegradation (Edwards and others, 2008; Chaffin and others, 2022) could grow on SPATT sampler surfaces, potentially degrading cyanotoxins before they can be adsorbed onto the resin. In this scenario, the cyanotoxin concentration derived from the SPATT sampler may underestimate ambient cyanotoxin concentrations. Because expression of biodegradation genes has been linked to previous microcystin exposure (Dexter and others, 2021), this scenario would be most relevant to water bodies with recurring cyanobacteria blooms. Wood and others (2011) suggest that future SPATT experiments could examine the ability of various membranes to prevent biodegradation once cyanotoxins are sorbed onto the resin.
Deployment Depth
Like deployment length, appropriate deployment depths for SPATT samplers will be site- and study-specific. Deployment depth could target a known depth of interest, such as drinking water intakes (Beecher, 2022) or bivalve habitats (MacKenzie and others, 2011). Additionally, if historical phytoplankton or environmental data were collected at fixed depths, SPATT sampling efforts could also be focused there. Alternatively, multiple SPATT samplers could be deployed to capture differences in concentration through the water column, which may be informative when studying stratified systems. During the FLX study (table 2), this approach was used to examine cyanotoxin concentrations at near surface (1 m), mid depth (13 m), and bottom depth (26 m) in several New York lakes (Box 2—Solid Phase Adsorption Toxin Tracking Use to Determine Cyanotoxin Occurrence Across Multiple Depths). In this study, increased microcystin concentrations at bottom depths later in the sampling season were detected, which would have been missed if only surface samples were considered (fig. 5). During the ODW study, SPATT samplers were deployed at varying depths, at the surface and at 1 m deep. After 1-month deployments, cylindrospermopsin and anatoxin concentrations were elevated at the 1 m depth. Anatoxin concentrations were over 30 times higher at 1 m compared to surface samples, and cylindrospermopsins were above the detection limit only at 1 m depth (Carpenter and Wise, 2023). These studies highlight the importance of considering multiple deployment depths, as ecologically relevant increases in cyanotoxin concentration may occur deeper in the water column across varying levels of temperature, viscosity, or other parameters.
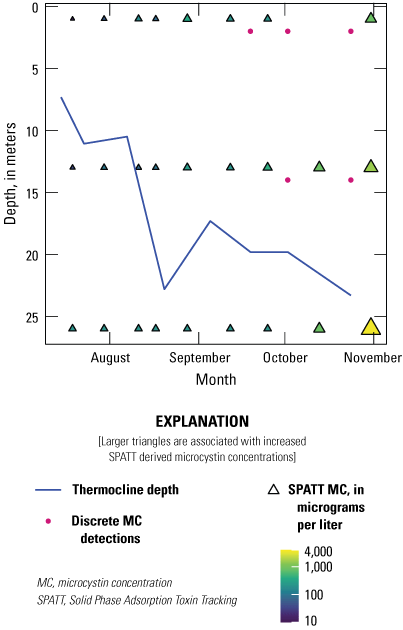
Data from Owasco Lake, one of the Finger Lakes of New York, including microcystin (MC) concentration (micrograms per liter [µg/L]) from Solid Phase Adsorption Toxin Tracking (SPATT) samplers (triangles) and microcystin detections in discrete samples (pink points) collected at near surface (1 meter [m]), mid (13 m), and near bottom (26 m) depths from July to November 2019. The solid blue line represents the thermocline depth (m). Data summarized from Stouder and others (2024).
When deploying SPATT samplers at sites with variable water elevations, caution must be taken to ensure that the SPATT samplers remain submerged. The NAR study (table 2), for example, lost numerous sachet style samplers because water levels dropped during the deployment period. Floats can be used to keep the samplers at a desired depth despite changes in water elevation (fig. 3C). In macrotidal systems prone to large changes in water elevation, the use of weighted lines (fig. 3B) or securing SPATT samplers to submerged structures (fig. 3A) may ensure the samplers remain submerged. Deployment depth also may reduce effects of physical damage in high energy aquatic environments or interference by humans through vandalism or theft. During the FLX study (table 2), it was reported that SPATT samplers deployed near the surface were subject to enhanced loss or damage compared to samplers at mid or near bottom depths (Johnston and others, 2025). About 78 percent of SPATT samplers deployed at the surface were recovered intact, whereas more than 90 percent of the samplers deployed deeper into the water column were successfully retrieved. Deploying SPATT samplers with a tag listing the contact information of the study lead and a brief description of the sampler purpose may help prevent vandalism if the samplers are encountered by the public (fig. 6). It may be good practice to deploy samplers in protected areas that are inaccessible to the public or at deeper depths to minimize effects of wave or current action and theft or damage. It also might be helpful to deploy multiple SPATT samplers at a site as a precaution in the case of loss, damage, or theft.
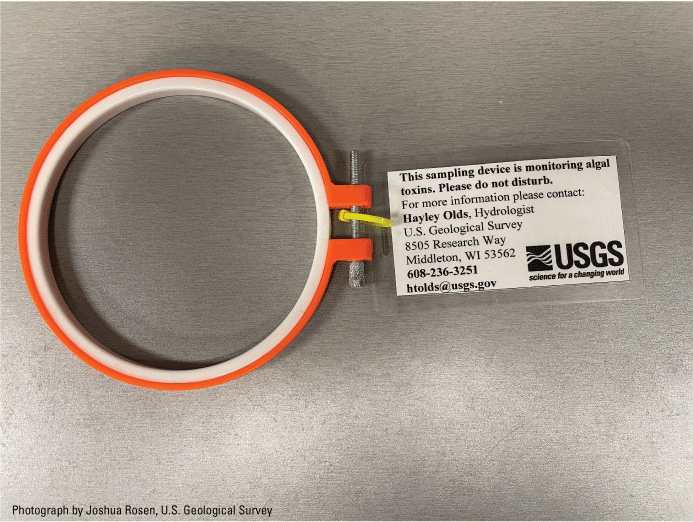
Example of an identification tag attached to a Solid Phase Adsorption Toxin Tracking (SPATT) sampler hoop during deployment. Informative tags can help reduce interference, theft, and vandalism while SPATT samplers are deployed in high traffic environments.
Deploying SPATT samplers at depth or in shade may deter effects of photodegradation on cyanotoxins sorbed to SPATT samplers. The transparency of the nylon mesh means any sorbed organic compounds are potentially susceptible to photodegradation. Numerous cyanotoxins have been shown to rapidly degrade upon exposure to different types of radiation: photosynthetic active radiation, ultraviolet A (UV-A), and ultraviolet B (UV-B; Wörmer and others, 2010; Kurtz and others, 2021). There are still large data gaps and uncertainty of the degradation rates and transformation products for other cyanotoxins, such as anatoxins, nodularins, and variants of cylindrospermopsin and microcystin. In lentic systems, like the FLX study (Box 2—Solid Phase Adsorption Toxin Tracking Use to Determine Cyanotoxin Occurrence Across Multiple Depths), epilimnion turnover and depth distribution of SPATT samplers with regards to light availability must be considered. The effect of photodegradation on SPATT sampler concentrations is yet uncertain and warrants further investigation.
Box 2. Solid Phase Adsorption Toxin Tracking Use to Determine Cyanotoxin Occurrence Across Multiple Depths
Results from the FLX study (Johnston and others, 2025) show variability in microcystin concentrations from SPATT samplers deployed at three depths (1 m: near surface, 13 m: mid depth, and 26 m: bottom) in Owasco Lake, New York, from July to November 2019 (fig. 5). Although microcystin was detected in all SPATT extracts, there were relatively few detections in concurrent discrete samples. Based on SPATT sampler results, microcystin was present throughout the water column over the study period, whereas detections in discrete samples occurred only at the near surface and mid depths late in the season (fig. 5). These results are comparable to those of other studies in which SPATT have documented the presence of microcystin in waterbodies of coastal California, even when absent in discrete grab samples (Kudela, 2011; Howard and others, 2017; Peacock and others, 2018). The pattern with depth in Owasco Lake may be attributed to the fact that dissolved and intracellular cyanotoxins are measured in discrete samples (Lane and others, 2010; Kudela, 2011), and there was likely an increased concentration of cyanobacterial cells at these mid- and near-surface depths.
Results from the FLX study indicate increased microcystin concentrations from SPATT samplers later in the season, particularly at the mid- and near-bottom depths (fig. 5). These observations may be indicative of surface bloom senescence, settling of cyanobacterial cells, and subsequent release of intracellular cyanotoxins (Ross and others, 2006) deeper in the water column. The lower microcystin concentrations detected near surface could be the result of increased photodegradation (Kurtz and others, 2021). It is useful to compare results from the FLX study to those of Schnetzer and others (2017), who did lab experiments to examine changes in particulate and dissolved concentrations of domoic acid produced by the marine diatom Pseudo-nitzschia australis. During an 88-day incubation period, Schnetzer and others (2017) simulated a surface bloom, followed by algal senescence and descent into the deeper, colder water below. Although concentrations of particulate domoic acid decreased when the experiment shifted from warm, highlight to cold, dark conditions, dissolved domoic acid concentrations continued to increase despite the conditions. SPATT samplers deployed during the formation of marine snow or organic detritus more than 0.5 millimeter in size (Dilling and Brzezinski, 2004), measured concentrations of domoic acid as high as 480 ng/g resin, showing that the sinking cells are an important source of downward flux of dissolved domoic acid (Schnetzer and others, 2017).
Although dissolved microcystin or other cyanotoxins may be released from cyanobacterial biomass as it sinks, cyanotoxins also may mix across the thermocline because of an internal seiche. As indicated by the increasing thermocline depth (fig. 5), mixing was further enhanced in the autumn months. As the surface water cooled and stratification was reduced, mixing of lake water across the water column likely provided another path for downward flux of microcystin (fig. 5; Reinl and others, 2021). These results illustrate the importance of considering multiple depths of deployment, particularly in deep, stratified systems; this is especially true in low nutrient lakes such as the Finger Lakes of New York, which are characterized by low open-water concentrations of cyanotoxins (Prestigiacomo and others, 2023).
Key Takeaways
-
• Ensuring SPATT samplers remain intact, in place, and submerged during a deployment period is critical.
-
• There is no single optimal SPATT sampler deployment length or depth; study objectives and deployment environment should be considered.
-
• Longer SPATT deployment times do not necessarily result in higher cyanotoxin concentrations.
-
• Fouling and photodegradation may affect the ability of SPATT samplers to adsorb cyanotoxins and warrant further study.
Cyanotoxin Extraction and Analyses
After retrieval from the environment, SPATT samplers must go through extraction and analysis steps to obtain time-integrative cyanotoxin concentrations. Commonly used extraction protocols and the advantages and disadvantages of ELISA and mass spectrometry methods are discussed in detail in the next sections.
Extraction Methods
There is not a standard USGS method for the extraction of cyanotoxins from SPATT samplers. The most common methods used in USGS studies are based on the Negrey and others (2023) method, adapted from Lane and others (2010) and Kudela (2011). Upon retrieval, SPATT samplers are lightly rinsed with ambient water and shaken to remove detritus, sediment, and any excess water. Removing particles that have fouled the SPATT sampler, especially sediment, helps ease the extraction process by reducing the chance of filter clogging during extraction. After rinsing, SPATT samplers are stored on wet or dry ice during transport and either immediately extracted or kept frozen until extraction in a laboratory. Although SPATT extracts typically are kept frozen (less than or equal to 20 °C) before and in between individual analyses, it is unknown how fast the cyanotoxins in the extract degrade when frozen. The degradation rate likely is dependent on the individual cyanotoxin, the final solvent concentration (50-percent methanol or reconstituted in lower concentration of methanol depending on the cyanotoxin and analysis being used), as well as the number of times (and duration) the extract is removed from frozen storage for analysis. For microcystins, anatoxin-a, and nodularin, Negrey and others (2023) reported no difference in recovery of each toxin after 3 months in storage at −20 and −80 °C.
Cyanotoxin extraction from the SPATT resin is done using a known volume of organic solvent to desorb organic compounds from the resin (MacKenzie and others, 2004; Lane and others, 2010; Zendong and others, 2016). In the Negrey and others (2023) method, SPATT samplers are disassembled and transferred to chromatography columns. The cyanotoxins are then eluted from the resin by pulling a solvent through the column under light vacuum pressure. The method uses three extractions of either 50-percent methanol, 50-percent methanol with ammonium acetate, or 100-percent methanol with formic acid, depending on the cyanotoxin to be analyzed (table 2 in Negrey and others, 2023). The extracts can be combined before analysis or analyzed individually and then summed together (Negrey and others, 2023). Although the Negrey and others (2023) method has been widely used, there are several other published methods for extracting cyanotoxins from SPATT samplers (MacKenzie and others, 2004; Fux and others, 2008; Wood and others, 2011, 2012; Zhao and others, 2013; Zendong and others, 2016; Hattenrath-Lehmann and others, 2018; Onofrio and others, 2020). Additionally, there are methods similar to Negrey and others (2023), which either involve soaking the resin in methanol, followed by filtration, drying and reconstitution (MacKenzie and others, 2004; Hattenrath-Lehmann and others, 2018), placing SPATT resin into an extraction column and eluting cyanotoxins with solvent under gravity or a vacuum (Fux and others, 2008; Zendong and others, 2016), or placing resin into a container, submerging with a solvent, and then shaking for a period of time (Wood and others, 2011, 2012; Zhao and others, 2013). After extraction, an aliquot of the sample is then collected and the cyanotoxins are analyzed, typically using ELISA or liquid chromatography and mass spectrometry (LC-MS) methods.
Although a 50-percent methanol solution has been used as the extraction solvent for SPATT work in USGS and other studies (Negrey and others, 2023), other extraction solvents could yield better recoveries for all or individual cyanotoxins. For example, Negrey and others (2023) suggests using 100-percent methanol combined with 2-percent formic acid in the first extraction step to improve recovery for anatoxin-a because it is notoriously unstable in alkaline conditions. Additionally, analysts in the SSD study (table 2) determined that using formic acid in conjunction with methanol improved recovery for numerous microcystin congeners (fig. 7). Otherwise, little work has been done to investigate improved extraction methods with different cyanotoxin and resin combinations. Another source of uncertainty is if the cyanotoxins are fully desorbed from the resin during the extraction procedure or if some remain behind, possibly resulting in a low bias in the final cyanotoxin concentration measured in the extract. The desorption properties of each cyanotoxin may be affected by other compounds, organic matter for example (Wu and others, 2011), that may bind to the resin during deployment, making desorption characteristics somewhat dependent on the deployment site.
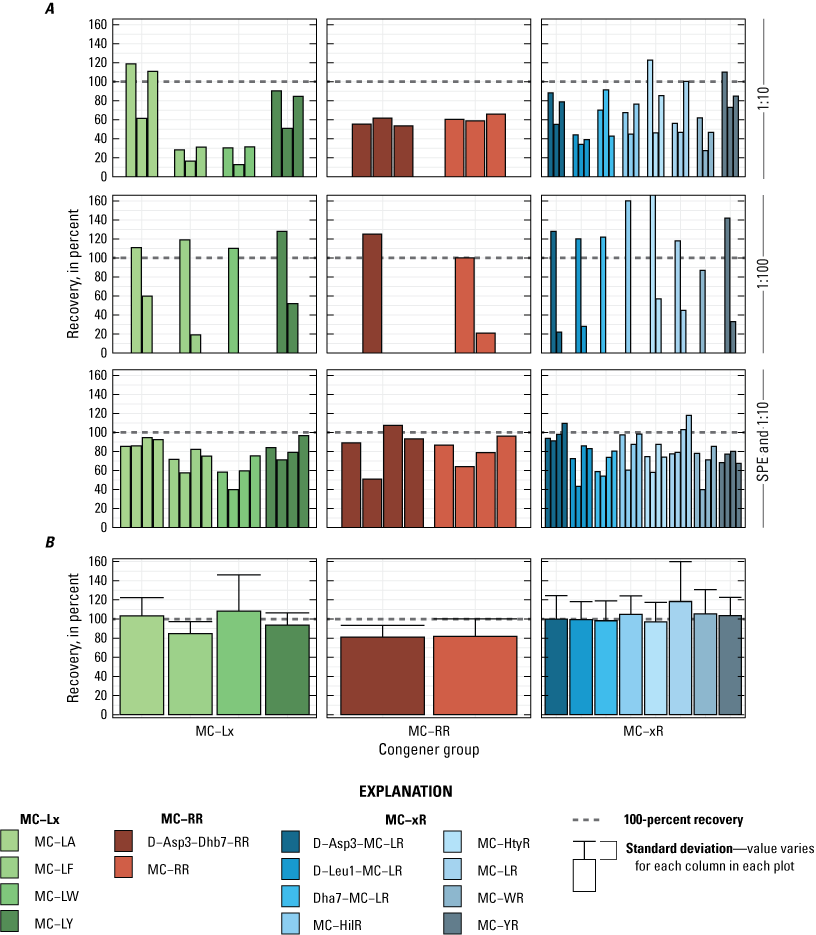
Spike recovery analysis of microcystins extracted from Solid Phase Adsorption Toxin Tracking (SPATT) samplers used in the Cyanotoxin monitoring in the Sacramento–San Joaquin Delta study (SSD) in 2021. A, spike recovery (in percent) for multiple microcystin congeners using two dilution factors (1:10 and 1:100) and solid phase extraction (SPE); and B, spike recovery (in percent) following the reversed extraction method to limit the amount of time the microcystins were in contact with the formic acid. Bars of the same color within each panel are replicates of the congener. Note, column represents a class of microcystin congener (MC-Lx, MC-RR, and MC-xR) and the “x” is a symbol for any amino acid at that variable position. Data summarized from Bouma-Gregson and others (2025).
Analyzing Solid Phase Adsorption Toxin Tracking Sampler Extracts—Enzyme-Linked Immunosorbent Assay
ELISAs are widely used to indirectly examine cyanotoxin presence and concentration (He and others, 2016; Filatova and others, 2020). ELISA methods are relatively inexpensive, can be learned quickly by most laboratories, and are commercially available. Several ELISA kits are produced by several manufacturers for measuring microcystins and nodularins, anatoxins, saxitoxins, and cylindrospermopsins. ELISA methods are particularly beneficial as a screening tool to determine if cyanotoxins are in a sample and to track relative changes in cyanotoxin concentration through time (Guo and others, 2017). Despite these advantages, ELISA has seen little use as an analytical methodology for SPATT extracts, other than its use by MacKenzie and others (2004), Lane and others (2010), and Kudela (2011); of these, only Kudela (2011) studied a freshwater system. Additionally, the FLX study compared ELISA with MS methods for analyzing SPATT extracts (Johnston and others, 2025).
There are several disadvantages to using ELISA methods to analyze environmental samples. ELISA methods cannot differentiate among various congeners of a specific cyanotoxin in a sample, so ELISA results often are reported as total cyanotoxin concentrations (North Coast Regional Water Quality Control Board, 2022a). Additionally, because of the structural similarities between microcystin and nodularin molecules (both contain the ADDA [2S,3S,4E,6E,8S,9S)-3-Amino-9-methoxy-2,6,8-trimethyl-10-phenyl-4,6-decadienoic acid] moiety), these cyanotoxins cannot be differentiated using ELISA, and results typically provide the sum of microcystins and nodularins in a single sample (Fischer and others, 2001). The ELISA method also has a relatively narrow dynamic range without prior dilution, and cyanotoxin concentrations cannot exceed about 5 micrograms per liter (µg/L) depending on the specific ELISA kit used (Guo and others, 2017). Because SPATT samplers have a high capacity for concentrating cyanotoxins, it is common for the extracts to exceed this maximum allowable concentration for the ELISA analysis. If this exceedance occurs, samples must be diluted and reanalyzed to bring the concentration within the ELISA test range, requiring additional expenses in labor and supplies. An important consideration noted by Jia and others (2022) is that, depending on the dilution factor used, cyanotoxin concentrations can differ, sometimes by a factor of more than 2. This difference is because the calibration curve is most accurate at and near its inflection point where the ratio between signal change and concentration is greatest (Sasaki and Mitchell, 2001). As such, the accuracy of a given dilution may depend on where on the calibration curve it falls. In addition, if the salinity of the final extract is not known, the accuracy of the quantitation may be affected because many commercial ELISA kits will not function properly outside of their specified salinity range (Gold Standard Diagnostics, 2024a, b, c, d383940); this may present a problem when analyzing estuarine samples.
Methanol, the recommended SPATT extraction solvent (Negrey and others, 2023), also can interfere with ELISA chemistry (Metcalf and others, 2000). Metcalf and others (2000) determined that methanol can mobilize key components of the ELISA microplate wells, resulting in an overabundance of binding sites and overestimates of cyanotoxin concentrations. Diluting SPATT extracts that are composed of 50–100 percent methanol is required to avoid these possible matrix interferences. Alternatively, extracts can be evaporated to dryness and reconstituted in an aqueous matrix with a methanol concentration below the maximum specified by the kit manufacturer (Gold Standard Diagnostics, 2024a, b, c, d). This evaporation step can be done at room temperature in a fume hood or using a nitrogen evaporator. The CRB and EDU studies (table 2) used an evaporator manifold to reduce methanol concentrations and then reconstituted each sample with high quality, distilled laboratory water. It is important to note that this method potentially concentrates any contaminants present that may inhibit ELISA analysis. An important consideration if analyzing multiple cyanotoxins with ELISA is to ensure that the methanol concentration is below the lowest methanol limit across all assays.
Given the interferences previously noted with immunoassays, such as organic matter, salinity, and phenolic compounds (Wu and others, 2011; Fan and others, 2014; Armstrong and others, 2025), along with the potential false negatives or positives and high bias demonstrated by the FLX study (Johnston and others, 2025), there is still uncertainty regarding the effectiveness of ELISA as an analytical method with the SPATT extract matrix. With the experience of other researchers in modifying immunoassays to eliminate matrix interference, for example by adding methanol to standards (Nunes and others, 1998; Huang and Sedlak, 2001; Hanselman and others, 2004; Silva and others, 2014; Liu and others, 2023), it is likely that these matrix issues can be resolved with further laboratory experimentation.
Analyzing Solid Phase Adsorption Toxin Tracking Sampler Extracts—Mass Spectrometry
Mass spectrometry (MS) methods are widely used to directly quantify cyanotoxin concentration and composition with high sensitivity and high throughput (Humpage and others, 2010). Notably, MS methods can measure concentrations of individual cyanotoxin congeners (Moore and others, 2016), but quantification is restricted to congeners that have analytical standards available (Jia and others, 2022). Given that only a few dozen known congeners have standards, MS methods can underestimate cyanotoxin concentrations if a sample is dominated by a congener for which no standard has been developed (Birbeck and others, 2019; Jia and others, 2022). Unlike the ELISA methods, MS requires a skilled analyst and expensive instrumentation; however, once MS methods are established and validated, sample analysis can be time and cost effective.
Comparison studies have demonstrated discrepancies between ELISA and MS cyanotoxin results (Birbeck and others, 2019; Jia and others, 2022; Box 3—Analysis of Solid Phase Adsorption Toxin Tracking Extracts by Enzyme-linked Immunosorbent Assay and Mass Spectrometry Methods). Cyanotoxin concentrations obtained through MS methods are often lower, depending on the group of cyanotoxins targeted (MacKenzie and others, 2004; Guo and others, 2017; Roy-Lachapelle and others, 2021). In the FLX study (Johnston and others, 2025), microcystin concentrations were consistently lower when measured using MS compared to ELISA (Box 3—Analysis of Solid Phase Adsorption Toxin Tracking Extracts by Enzyme-linked Immunosorbent Assay and Mass Spectrometry Methods; fig. 8). Anatoxin, however, showed consistently higher concentrations measured by MS compared to ELISA (Box 3—Analysis of Solid Phase Adsorption Toxin Tracking Extracts by Enzyme-linked Immunosorbent Assay and Mass Spectrometry Methods; fig. 8). These patterns also can be seasonally dependent (Birbeck and others, 2019). Agreement between ELISA and MS results occurred through summer months, but by fall, values diverged, with MS values remaining lower than the ELISA results (Birbeck and others, 2019). Birbeck and others (2019) hypothesized that biodegradation products accumulated in the fall after the summer bloom period, resulting in overestimated cyanotoxin concentrations from the ELISA methods.
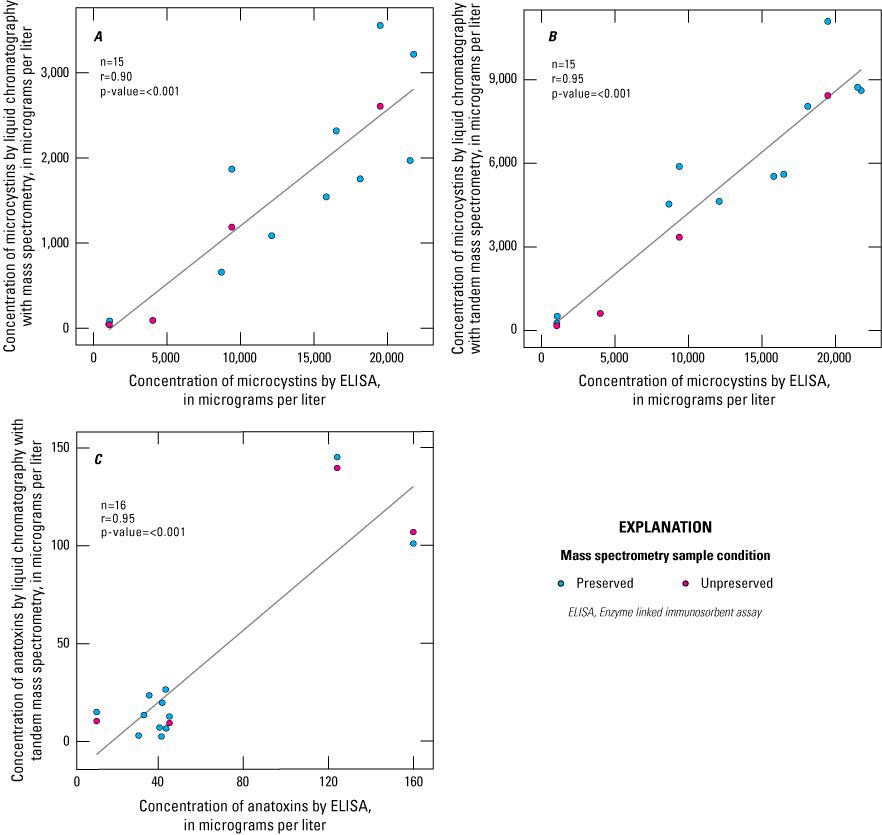
A, Linear correlation of microcystin concentration (micrograms per liter [µg/L] [ng/g]) in Solid Phase Adsorption Toxin Tracking (SPATT) extracts determined by enzyme-linked immunosorbent assay (ELISA) and liquid chromatography and mass spectrometry (LC-MS) (r=0.90); B, linear correlation of microcystin concentration (µg/L) in SPATT extracts determined by ELISA and liquid chromatography and tandem mass spectrometry (LC-MS/MS) (r=0.95); and C, linear correlation of anatoxin concentration (µg/L) in SPATT extracts determined by ELISA and liquid chromatography and tandem mass spectrometry (r=0.95). The black line represents a simple linear regression between the parameters. Data summarized from Stouder and others (2024).
As with ELISA, matrix interference issues can occur when analyzing SPATT extracts using MS methods. Analysts working with extracts from the SSD study (table 2) determined that samples extracted in methanol acidified with formic acid failed quality assurance/quality control (QA/QC) checks (Box 4—Reducing Matrix Effects to Improve Cyanotoxin Detection). Analysts had to troubleshoot and alter their protocols to limit the time microcystin molecules were exposed to formic acid through the extraction process (Box 4—Reducing Matrix Effects to Improve Cyanotoxin Detection). Although analysts may be able to anticipate matrix interference issues and make needed adjustments to the analytical process, there may be unknown compounds in the sample matrix that could interfere with the analysis and bias the result. For example, if electrospray ionization is used in the mass spectrometer, it is possible that salts in the sample may affect ionization efficiency because they are nonvolatile and likely not detected in the same concentration as in the calibration standards (King and others, 2000), which can result in ionization suppression or possibly ionization enhancement, biasing the results (George and others, 2018). Although matrix interference issues are part of most analytical methods, the relatively recent (2004) advent of SPATT technology means that there is limited knowledge of possible interferences and thus greater uncertainty in analytical results. Like ELISA methods and the SSD study, it is likely that future laboratory experimentation and method development will reduce matrix interference issues.
Box 3. Analysis of Solid Phase Adsorption Toxin Tracking Extracts by Enzyme-linked Immunosorbent Assay and Mass Spectrometry Methods
As part of the FLX study (table 2; Box 1—Assessing the Impact of Deployment Length on Solid Phase Adsorption Toxin Tracking Concentrations; Johnston and others, 2025), SPATT extracts were analyzed using ELISA and MS for microcystin and anatoxin to compare analytical methods (fig. 8). Extracts were analyzed by ELISA and liquid chromatography and tandem mass spectrometry (LC-MS/MS) for microcystin and anatoxin. Microcystin was additionally analyzed by LC-MS. LC-MS/MS can detect compounds at lower concentrations that might be missed by the LC-MS method. SPATT extracts were preserved using manufacturer-provided diluent for anatoxin analysis based on recommended guidance for ELISA kit use. No preservative is recommended for microcystin analysis by ELISA. To investigate the effect of the preservative on MS methods, preserved and unpreserved aliquots of SPATT extracts were analyzed for microcystin and anatoxin.
Extracts from SPATT samplers deployed in three New York Finger Lakes between June and November 2019 across multiple depths were analyzed (detailed methods described in Johnston and others, 2025), but only samples with concentrations above their respective reporting limits are shown (fig. 8). Linear regression analyses that compare ELISA to MS are displayed for microcystin (figs. 8A, 8B) and anatoxin (fig. 8C). Although strongly correlated (r is greater than or equal to 0.9), microcystin concentrations varied substantially among the ELISA and the two MS methods (figs. 8A, 8B). Microcystin concentrations measured by ELISA were consistently higher than those measured by LC-MS/MS or LC-MS (figs. 8A, 8B). These results indicated that relations among the methods were linear and can provide insights to relative patterns in the spatial and temporal distribution of microcystin. The higher concentrations detected using ELISA may be due to matrix interference, the limited number of congeners that can be detected by mass spectrometry, or a combination of both, as discussed previously. Microcystin concentrations by LC-MS/MS were frequently above the detection limit (100 percent) compared to LC-MS (60 percent); however, the LC-MS method generally had a higher detection limit compared to the LC-MS/MS method, which likely contributed to the lower frequency of concentrations above the detection limit.
Anatoxin was confirmed by MS in about 30 percent of extracts. This discovery indicates the ELISA analysis for anatoxin is potentially subject to false positives, possibly because of the presence of large amounts of dissolved organic matter in the SPATT extracts (Nunes and others, 1998; Huang and Sedlak, 2001; Hanselman and others, 2004; Silva and others, 2014). Anatoxin concentrations measured by ELISA were consistently higher than those measured by LC-MS/MS (fig. 8C). Despite differences in concentration, the relation between anatoxin concentrations, as measured by MS and ELISA, were strongly linear and statistically significant (fig. 8C). Although strongly correlated when all data are included (r=0.95), the anatoxin ELISA and MS correlation decreases to 0.03 when a pair of outliers are removed, providing further evidence suggesting false positives from the ELISA method. Further investigation of possible matrix effects in ELISA, as well as better knowledge of ELISA cross-reactivity to different anatoxin congeners, would provide more insight into the relation between the ELISA and MS concentrations.
Box 4. Reducing Matrix Effects to Improve Cyanotoxin Detection
Matrix interference issues occurred during analysis of microcystins extracted from SPATT samplers deployed in the SSD study (table 2). The initial MS process used was based on the method for anatoxin described in Negrey and others (2023). This method involved extracting cyanotoxins in 100-percent methanol acidified with 2-percent formic acid, followed by two additional extractions in 50-percent methanol, without formic acid. The modified method then combined the three extracts, evaporated them under nitrogen gas, and then reconstituted the cyanotoxins in 8 milliliters of organic free water. However, when the reconstituted samples were loaded onto the mass spectrometer, retention times began shifting, positive control QA/QC samples were too variable, and spike-recovery values were low and variable (fig. 7A; Bouma-Gregson and others, 2025). The laboratory scientists thought compounds in the SPATT extract were interfering with the chromatography column and tested three method variations to try to correct these issues. The sample was diluted 10 times (×; method 1), 100× (method 2), and the sample went through solid phase extraction (SPE) before being diluted 10× (method 3). The results did not improve with the 10× dilution, and although the retention times and positive controls improved with the 100× dilution, the spike-recovery values were still too variable (fig. 7A). The SPE method had the best spike-recovery results of the three methods, but the addition of an SPE step added additional costs and time to the method; therefore, additional methods were explored.
The laboratory scientists suspected that interactions between the formic acid and microcystin molecules likely were the root of the issue; therefore, rather than beginning the extractions with the acidified methanol, the order of the extractions was reversed (50-percent methanol, 50-percent methanol, and 100-percent methanol with 0.5-percent formic acid). Additionally, the three extracts were not combined until immediately before the evaporation step to reduce the amount of time microcystin was in contact with the formic acid. With that modification, spike recoveries were closer to 100 percent (fig. 7B) than any of the original three methods and it did not require the SPE step, which saved time and money. Although Negrey and others (2023) did not observe any interference between formic acid and microcystins, this was not the case for the SPATT samplers deployed in the SSD study; however, the interference from formic acid was limited only to microcystins (fig. 7) and anabaenopeptins (data not shown). Anatoxins and cylindrospermopsins were not affected by the formic acid (data not shown). Depending on the instrument and sample matrix, formic acid may cause interference when analyzing microcystins from SPATT extracts. The full method for these extractions and analyses are in appendix 1.
Relating Solid Phase Adsorption Toxin Tracking Data to Discrete Cyanotoxin and Ancillary Data
Directly relating cyanotoxin data collected using SPATT samplers to other discrete cyanotoxin, environmental, genetic, or phytoplankton community datasets collected before, during, or after the deployment period is a limitation. Efforts have been made to determine adsorption and desorption kinetics of several cyanotoxin and resin combinations in laboratory settings, but performance is not consistent once samplers are deployed into variable field environments (MacKenzie and others, 2004; Lane and others, 2010; Zhao and others, 2013; Kudela, 2017; Roué and others, 2018). Without accurate adsorption/desorption rates, calibrating SPATT samplers to units used in discrete sampling or regulatory contexts, like the mass of cyanotoxin per volume of medium (for example, micrograms of cyanotoxin per liter of water [µg/L]), is not possible. Similarly, when benthic periphyton or other tissues are analyzed, cyanotoxin concentration is reported as mass cyanotoxin per mass of dry weight or ash-free dry weight of the medium (for example, µg/g dry weight) and cannot be directly compared to SPATT results either. Concentrations from SPATT samplers generally are reported as the mass of cyanotoxin per gram of resin (ng/g) or adsorption rate during the total deployment period (ng/g per day). These differences in reporting units and unknown adsorption and desorption kinetics make it challenging to directly compare SPATT results to water or benthic sample concentrations (Lane and others, 2010; Kudela, 2011, 2017; Jia and others, 2022). However, because of the passive nature of SPATT samplers, they are often part of larger research or monitoring projects, and in those instances, results need to be indirectly compared and interpreted alongside other parameters.
Of the 12 USGS SPATT studies featured in this report (tables 2, 3), most include collection of discrete cyanotoxin samples when SPATT samplers are deployed or retrieved. Collecting discrete water samples at these times provides information about the conditions at the start or end of a SPATT sampler deployment period but could miss pulses at times in between. Discrete samples also could be collected within a SPATT sampler deployment period, which would provide information about how cyanotoxin concentrations varied while the sampler was deployed. Another reason SPATT samplers generally complement rather than replace discrete sampling is because SPATT samplers only adsorb dissolved cyanotoxins in the environment (Lane and others, 2010; Kudela, 2011, 2017; Roué and others, 2018). Tatters and others (2021) suggest that differences detected between discrete and SPATT sample concentrations could be the result of the cyanobacterial cells remaining intact, not allowing cyanotoxins to be released in the dissolved form into the environment. During the study, they detected cylindrospermopsins only in discrete samples and saxitoxins and nodularins only in the SPATT samples (Tatters and others, 2021). With variation in the fraction and concentration in an environment, using multiple lines of evidence from SPATT samplers and discrete cyanotoxin samples (especially if analyzing for total and dissolved cyanotoxins) can help tease apart the complexity of cyanotoxin dynamics in natural water-body systems. In the FLX study (table 2; Box 2—Solid Phase Adsorption Toxin Tracking Use to Determine Cyanotoxin Occurrence Across Multiple Depths; Box 4—Reducing Matrix Effects to Improve Cyanotoxin Detection), early season deployments provided some evidence of early cyanotoxin detection as the SPATT samplers integrated low levels of cyanotoxins earlier than they were detected using discrete sampling. Discrete samples may be used to help validate the relative cyanotoxin concentrations but because of the dynamic nature of cyanotoxin production, persistence, and transport, cyanotoxin content is highly variable, and the relation between passive samplers and discrete samples will not be static.
In addition to discrete cyanotoxin data, phytoplankton identification and enumeration, environmental DNA, including cyanotoxin synthetase gene quantification and metagenomics, and additional co-occurring contaminants or water-quality parameters can supplement and provide context to SPATT studies (Graham and others, 2012, 2020; Francy and others, 2015, 2016; Zuellig and others, 2021; Linz and others, 2023). SPATT data may be augmented with these additional types of samples to identify potential cyanotoxin producers, which may include planktonic or benthic cyanobacteria such as Microcystis, Oscillatoria, Microcoleus, Nostoc, Dolichospermum, and many others. These taxa may be concentrated, cultured, and tested for the production of cyanotoxins, which may help explain the occurrences detected using SPATT samplers. It is important to remember that like discrete cyanotoxin data, these supplementary methodologies also are discrete samples and thus representations of an ecosystem at one moment in time, so results must be interpreted carefully (Lane and others, 2010; MacKenzie, 2010; Rodríguez and others, 2011; Zendong and others, 2016; Roué and others, 2018). In addition, the relation among cyanotoxin occurrence, abundance of potential cyanobacterial producers, and quantity of cyanotoxin synthetase genes can be complex. Because of the documented unreliability between cyanobacteria presence and cyanotoxin production (Lane and others, 2010; MacKenzie, 2010; Rodríguez and others, 2011; Peacock and others, 2018; Roué and others, 2018), they are not considered substitutes for cyanotoxin sampling. Similarly, the presence of cyanotoxin synthetase genes in the environment does not guarantee that the genes are actively being expressed, and therefore producing cyanotoxins (Pacheco and others, 2016). Cyanotoxins and cyanotoxin synthetase genes may persist longer in the environment than the causative cyanobacteria, which can create misleading co-occurrences with other potential cyanotoxin-producing species (Graham and others, 2012, 2020; Otten and others, 2015; Pacheco and others, 2016; Preece and others, 2017). Despite the challenges in comparing discrete data with SPATT results, cyanotoxin synthetase gene analysis may provide useful compliments to cyanotoxin data (Graham and others, 2012, 2020; Zuellig and others, 2021).
Ancillary water-quality measurements like temperature, salinity, nutrient concentrations, or pH can provide context if questions regarding drivers of cyanotoxin concentration and production are of interest (Paerl and Otten, 2013; Francy and others, 2015; Matson and others, 2020; Tatters and others, 2021; Howard and others, 2022; Anderson and others, 2023). However, like discrete cyanotoxin data, phytoplankton identification and enumeration, and cyanotoxin synthetase gene quantification, these discrete data also suffer from the same snapshot-in-time challenge. To help combat this issue, sondes were deployed during the FLX study at the same depths as SPATT samplers (1 m, 13 m, and 26 m) to ensure continuous water-quality data were collected during each deployment. Supplementary discrete sampling could be done during a SPATT deployment but would require additional staff time and analysis costs. Measurements of photosynthetically active radiation or light intensity also can provide insight on photodegradation potential if SPATT samplers are deployed in direct sunlight near the surface of a water body (Kurtz and others, 2021). Together, discrete cyanotoxin concentrations, information from phytoplankton communities, as well as an understanding of the biogeochemical factors affecting a system, can provide context needed to help interpret cyanotoxin concentrations collected using SPATT samplers.
Quality Assurance and Quality Control
Quality-assurance and quality-control measures are an important part of laboratory best practices. As with many environmental studies, replicates, blanks, and spikes can be used to ensure data validity and help with SPATT data interpretation (U.S. Geological Survey, variously dated). The number of potential QA/QC samples will depend on the study objectives and finding a balance among cost, necessity, and robustness. Across the 12 USGS studies discussed in this report (tables 2, 3), QA/QC procedures were not consistent. Generally, studies that examine cyanotoxins using commercially available ELISA test kits follow published methods for SPATT sampler assembly and extraction (Negrey and others, 2023) and U.S. Environmental Protection Agency (EPA) Method 546 for the analysis of microcystins and nodularins (U.S. Environmental Protection Agency, 2016). Some studies (SRB and NAR) also have adopted the quality control requirements of EPA Method 546 for the analysis of other cyanotoxins (cylindrospermopsin, anatoxin-a, saxitoxin) by ELISA. Built into most commercially available ELISA test kits are several standards, a control, and a blank; all standards, controls, blanks, and samples are analyzed in duplicate or triplicate, and if any of the method-specified QA/QC measures are outside of the prescribed limits, results are not valid and must be reanalyzed. Concentrations below the lowest non-zero standard are reported as non-detects, although for some studies (SRB and NAR), concentrations below the second lowest non-zero standard were reported as non-detects, with concentrations between the lowest and second lowest non-zero standards noted as being between the detection limit and reporting limit. In the NJC study (table 2), samples were analyzed using these ELISA methods, but a subset of extracts (between 5 and 20 percent) were sent to an outside laboratory for additional MS analysis to ensure validity of the data. As described in Box 4—Reducing Matrix Effects to Improve Cyanotoxin Detection, the FLX study (table 2) scientists used a combination of ELISA and MS analyses to compare results obtained from three analytical methods.
In addition to analytical controls (Box 3—Analysis of Solid Phase Adsorption Toxin Tracking Extracts by Enzyme-linked Immunosorbent Assay and Mass Spectrometry Methods), field replicates are an important component of robust QA/QC programs. Field replicates typically are deployed in the same location and for the same amount of time as field samplers to test for variability in the samplers themselves. As a best practice, SPATT samplers are deployed during most USGS studies in duplicate. In instances where both SPATT samplers are successfully recovered, the additional SPATT sampler may be analyzed as a field replicate. During the SRB study, replicate SPATT hoops were analyzed for microcystins, cylindrospermopsins, and saxitoxins and mean relative percentage differences of 13.5, 16.3 and 8.8 percent were detected, respectively, from six or seven sampling sites (Spitz and others, 2025). In other instances, increased variation may be expected between SPATT field replicates if there are variations in sampler construction (for example, sampler style, size, amount of resin used, and so on) or subtle variations in the flow around the multiple samplers deployed in each environment.
Blanks can be used to account for analytical interference from any contamination that may occur during sampler construction, deployment, processing, or analysis. Fabrication blanks are built concurrently with the field-deployed SPATT samplers but remain frozen in the laboratory until extraction. Extraction would then happen at the same time and in the same manner as the field samplers to account for any contamination during the construction, storage, extraction, or analysis steps. Separately, field blanks are built concurrently with field-deployed SPATT samplers and transported to the field sites in the same manner as the field samplers but are not deployed. In most cases, SPATT samplers are transported in bags filled with organic free water on ice. Upon arrival at the field site, field blanks are removed and exposed to the air for about the same amount of time it takes to place the field SPATT sampler into the water. This field blank can account for any potential contamination during transportation or deployment. Field blanks also can account for any potential deposition of aerosolized cyanotoxins during deployment or retrieval. And finally, laboratory blanks are extracted at the same time as SPATT samplers to account for any contamination during the extraction, evaporation, or reconstitution steps. During the SRB and FLX studies, laboratory blanks were processed the same way as the field samples, but the extraction column did not contain any resin beads. There was no contamination in extraction blanks using this QA/QC process during the FLX study. Although a rare occurrence, of the 17 laboratory blanks analyzed for the SRB study, 1 cylindrospermopsin blank failed and was above the 0.05 µg/L QA/QC threshold, indicating possible contamination during the extraction, evaporation, or reconstitution steps. In contrast, the ODW study included one laboratory blank per extraction batch and never had a blank with a positive detection.
Lastly, spikes can be used to determine recovery of the targeted analyte and examine potential analytical interference and effects on identification and quantitation. Matrix spikes are prepared with a known concentration of the targeted cyanotoxin, which then go through all the same processing and analysis steps as an environmental sample. Matrix spikes can help determine if the sample matrix affects detection of the targeted cyanotoxin. Separate matrix spikes must be prepared to account for each cyanotoxin of interest. Additional procedural spikes can determine the recovery of a targeted cyanotoxin during specific processing step, or throughout the process. This type of spike would be made without the SPATT sample matrix. After discussions with the laboratory doing the analyses, procedural spikes were used to evaluate samples from the SSD study (table 2). After every 20 samples were analyzed, an ultrapure water sample spiked to a known concentration (1 part per billion) was examined to ensure the instrument stayed within QA/QC thresholds. Ensuring a combination of replicates, blanks, and spikes are collected and analyzed during a study can ensure accurate and valid SPATT data are collected.
Key Takeaways
-
• Extraction of cyanotoxins from SPATT samplers generally is performed using a solvent to desorb organic compounds from the resin; there is currently (2026) no standard USGS method.
-
• Enzyme-linked immunosorbent assays (ELISA) and mass spectrometry (MS) are the most commonly used methods to analyze SPATT sampler extracts.
-
• Directly relating cyanotoxin data collected using SPATT samplers to other discrete cyanotoxin, phytoplankton, or water-quality data can be challenging but can supplement and provide context for the time-integrated findings.
-
• Although there are no standard QA/QC measures for SPATT samplers currently (2026), a combination of replicates, blanks, and spikes can ensure accurate and valid data.
Conclusions and Considerations for Future Science
Advances in cyanotoxin measurement capabilities have helped inform management and monitoring efforts across aquatic ecosystems worldwide. Passive samplers like SPATT can be used to provide a more complete understanding of cyanotoxin occurrence and dynamics, provide a foundation for researchers to analyze trends over short (daily to weekly) and long (seasonal or interannual) time scales (Kohoutek and others, 2008; Wood and others, 2012), compare water bodies (Zendong and others, 2016), or monitor effects of natural or anthropogenic ecosystem disturbance (Gibble and Kudela, 2014). SPATT samplers can be especially useful because cyanotoxin concentrations are highly variable over space and time (Lane and others, 2010; MacKenzie, 2010; Rodríguez and others, 2011; Zendong and others, 2016; Roué and others, 2018). Because of their ability to accumulate cyanotoxins that may be persistent but in low concentrations, SPATT samplers offer users more sensitivity compared to traditional discrete sampling methods for determining the presence or absence of a cyanotoxin in the system. Furthermore, the use of SPATT samplers allows for flexibility in terms of deployment length and depth, the number of cyanotoxins that can be detected at once, and the methods with which sampler extracts can be analyzed. Depending on laboratory resources and the research or monitoring questions being addressed, SPATT sampling and analysis protocols can be tailored to meet system or project-specific needs. SPATT samplers can be used to supplement discrete cyanotoxin sampling methods for research or exploratory studies, understanding seasonality within a system, and comparisons between or within watersheds.
SPATT samplers also have the potential benefit of providing early detection for cyanotoxins (MacKenzie and others, 2004), even compared with molecular techniques, which can trigger more intensive discrete cyanotoxin monitoring by regulatory agencies if needed. Although the use of SPATT samplers for early detection/warning purposes has shown mixed success in marine environments (MacKenzie and others, 2004; Lane and others, 2010; Hattenrath-Lehmann and others, 2018), relatively little work has been done in freshwater environments to examine the utility of SPATTs as an early detection/warning tool. Results from the FLX study indicate promising results, especially if ELISA matrix interference issues can be corrected. However, there are additional laboratory and analytical limitations to using SPATT samplers as an early detection/warning tool. The process of extracting the cyanotoxins from the SPATT resin beads can be onerous, especially when processing many samples or when preparing the samples for analysis by ELISA, which requires additional evaporation and reconstitution steps. The labor-intensive nature of the extraction process can limit the use of SPATT sampling for use as an early warning mechanism because it is questionable if the extraction and analysis can be completed rapidly enough to provide the needed lead time for managers to enact a warning.
The 12 USGS studies discussed throughout this report used similar construction protocols for SPATT samplers (tables 1, 2), but deployment, extraction, analysis, and quality-control measures varied. Although SPATT samplers offer many advantages, they are only able to adsorb dissolved cyanotoxins and thus cannot detect the particulate, or intracellular, fraction. SPATT samplers may underestimate cyanotoxin concentrations (Lane and others, 2010; Wood and others, 2011), and they also cannot provide a time-weighted average concentration of total cyanotoxin at a given deployment site. Current suggested cyanotoxin thresholds for recreational waters and drinking water are based on the total cyanotoxin concentration (U.S. Environmental Protection Agency, 2019a, b; Chorus and Welker, 2021); therefore, the concentrations derived from SPATT samples are not pertinent to health or water-quality thresholds (North Coast Regional Water Quality Control Board, 2022a). SPATT data also cannot be converted into units that are used in the regulatory guidelines established for drinking or recreational waters. Although regulatory thresholds do not currently (2026) exist for benthic cyanobacterial mats (North Coast Regional Water Quality Control Board, 2022a), cyanotoxin concentrations derived from SPATT samplers also cannot be directly compared to discrete benthic algal mat cyanotoxin concentrations because of differences in reporting units. Ultimately, a combination of sampling methods may provide the most complete picture of cyanotoxin occurrence in a system. Despite the lack of standardized protocols for resin amount and type, construction style (for example, hoop, sachet, or a combination), extraction solvent type and amount, and QA/QC measures, as the use of SPATT samplers continues and method uncertainties are addressed, it is likely these limitations will be improved.
Information Gaps and Key Research Considerations
In spite of the progress that has been made since SPATT samplers were developed in 2004 (MacKenzie and others, 2004), there are many information gaps that hamper their widespread adoption into monitoring programs. There is little guidance that can provide consistent use and data quality. Across the USGS, SPATT protocols (table 3) are primarily based on procedures published by Negrey and others (2023) and information included in reviews from Roué and others (2018) and Kamali and others (2022). The recommendations in these sources vary in terms of SPATT preparation, deployment, and extraction guidance, and therefore further methodological research is warranted to ensure SPATT data are being produced and interpreted consistently. Through preparation of this report, USGS researchers identified seven priority research and monitoring themes, each with specific questions that when answered, may improve the use of SPATT samplers in the future (table 4). For example, research providing information about how deployment and storage time (before extraction) affects SPATT sampler results (table 4) would be helpful in the interpretation of SPATT data. Deployment periods in the literature range from hours (Wood and others, 2011), to weeks (Peacock and others, 2018), to monthly intervals (Anderson and others, 2023). Similar variation in deployment length occurred within the USGS studies discussed throughout this report, with deployment periods that ranged from minutes to monthly intervals (table 3). It is unlikely that there is a single, optimal deployment period for SPATT samplers, given varying aquatic environments and study objectives. However, determining the factors (for example, previously collected discrete cyanotoxin data or flow rates, as suggested by the SRB study; Box 1—Assessing the Impact of Deployment Length on Solid Phase Adsorption Toxin Tracking Concentrations) that influence deployment time would inform future study designs.
Table 4.
Research and monitoring themes and questions to develop procedures to use and interpret Solid Phase Adsorption Toxin Tracking (SPATT) sampler results.Questions remain about cyanotoxin adsorption and desorption kinetics to and from the SPATT sampler resin in relation to deployment duration and the environmental conditions. Research has focused on the desorption kinetics of cyanotoxins off of the SPATT resin using a variety of solvents for analysis by MS or ELISA (Fux and others, 2008; Kudela, 2011; Wood and others, 2011; Zhao and others, 2013); however, natural desorption of cyanotoxins in a variety of environments and hydrologic conditions has yet to be fully explored. Questions also remain regarding the effect of long-term storage on SPATT samplers frozen after retrieval and extraction (Kudela, 2017). Wood and others (2011) did not detect anatoxin degradation products after extraction of samples frozen at −20 °C, suggesting their stability. Negrey and others (2023) examined the consequences of storing extracts loaded with anatoxins, microcystins, and nodularins stored at −20 °C and −80 °C for as much as 90 days and determined no statistical difference in percentage recovery of all cyanotoxins. However, SPATT samplers often are stored for periods longer than 90 days, and understanding longer term storage effects (for example, as much as 6 months) on additional cyanotoxins of interest (for example, cylindrospermopsins, saxitoxins) will further improve the quality of SPATT data.
Biofouling and photodegradation of adsorbed cyanotoxins also require further examination. The literature suggests that biofouling can affect passive samplers (Richardson and others, 2002; Lane and others, 2010), but to our knowledge, this has not been examined in detail using SPATT samplers. Fouling has the potential to bias SPATT sampler results up or down, therefore understanding the effects of fouling warrants further study. Similarly, direct and indirect photodegradation, phenomena known to degrade cyanotoxins at the water surface (Parker and others, 2016; Kurtz and others, 2021), could affect cyanotoxins once they are sorbed onto SPATT resin in the environment. A better understanding of photodegradation effects to SPATT derived cyanotoxin concentrations could allow for improvements in deployment strategies (for example, ensuring SPATT samplers are shaded if deployed at the surface) and increased measurement accuracy. Other priority information gaps identified include SPATT sampler design, resin activation periods, efficient extraction methods, and QA/QC (table 4). Addressing these knowledge gaps through field and laboratory experimentation is likely to provide new information, refine SPATT methods, and ensure consistent generation and interpretation of SPATT data across USGS and the broader cyanotoxin research community.
Integrating Solid Phase Adsorption Toxin Tracking into Research and Monitoring Programs
Integrating SPATT sampling techniques into established and developing cyanotoxin research and monitoring programs will allow for improved understanding and management of freshwater, brackish, and marine ecosystems (Kudela, 2017; Howard and others, 2022). Three key components of an effective HAB monitoring strategy described by Howard and others (2022) include ensuring efforts are coordinated, detecting multiple toxin groups, and using a combination of discrete and passive sampling techniques to fully capture toxin dynamics. An excellent example of SPATT implementation into a coordinated monitoring program is the nationwide NPS study (table 2; Box 5—Implementation of Solid Phase Adsorption Toxin Tracking Monitoring into Nationwide Harmful Algal Bloom Monitoring Toolbox). This study, part of the USGS-NPS Water Quality Partnership, was established with the goal of improving the toolbox available to park staff to identify and respond to algal blooms and toxin events in national park units across the United States (NPS study; Box 5—Implementation of Solid Phase Adsorption Toxin Tracking Monitoring into Nationwide Harmful Algal Bloom Monitoring Toolbox). U.S. Geological Survey researchers provided guidance to enable park staff and volunteers to deploy and retrieve SPATT samplers. The use of SPATT samplers allowed park staff to look for multiple cyanotoxins, pair discrete toxin and environmental data with their SPATT deployments and use consistent methodology across the 22 national park units (2025; Box 5—Implementation of Solid Phase Adsorption Toxin Tracking Monitoring into Nationwide Harmful Algal Bloom Monitoring Toolbox; fig. 1).
Inclusion of SPATT samplers in research programs can be an effective way to better understand cyanotoxin occurrence, drivers, transport, and composition in lentic, lotic, and benthic ecosystems. Keeping in mind that SPATT and discrete cyanotoxin sampling techniques are complimentary and not interchangeable, this combination of techniques can provide multiple lines of evidence to better understand cyanotoxins in dynamic systems. In lotic systems like rivers or estuaries where water movement from tides, winds, or river flows can transport cyanotoxins long distances, time-integrating SPATT samplers can capture downstream cyanotoxin events that could otherwise be missed (Kudela, 2017). For example, deploying SPATT samplers up and downstream could provide insights for potential transport or degradation that may occur in a lotic system. Bouma-Gregson and others (2018) detected consistently higher anatoxin and microcystin accumulation upstream, which, when analyzed with other data collected during this study, indicated that increased discharge or reduced cyanotoxin production likely resulted in the lower accumulation downstream, depending on the site. Similarly, in the Southern California Bight, SPATT samplers were deployed along several creeks and rivers flowing into the estuary to examine cyanotoxin dispersal and sources (Tatters and others, 2019). Using a combination of discrete and SPATT sampling techniques, Tatters and others (2019) detected elevated toxin concentrations downstream, which indicated that transport may play an important role in cyanotoxin dispersal in this system. The use of SPATT samplers in this study also helped demonstrate the need for a thorough and coordinated cyanotoxin monitoring program in this estuary. These studies (Bouma-Gregson and others, 2018; Tatters and others, 2019) also highlight the importance of considering benthic sources of cyanotoxins to the water column. The ODW study also detected benthic cyanobacteria in surface net tow samples associated with SPATT deployments. The genera Nostoc and Tolypothrix were detected in a large number of samples that also contained neurotoxins (Carpenter and Wise, 2023; Carpenter and others, 2025), further indicating that mixing or migration of benthic cyanobacteria to the water column may contribute to detections reported using SPATT samplers (McCarthy and others, 2014).
In lentic systems, SPATT samplers can be used to identify cyanotoxin dynamics at a fixed location. This identification can help to understand longitudinal patterns in cyanotoxin concentrations and, for lakes and reservoirs, the occurrence of cyanotoxins at various depths. These data can be one of multiple lines of evidence that shed light on the patterns of occurrence and drivers within a water body or watershed. Wiltsie and others (2018) deployed SPATT samplers in a lake used as a source of drinking water to examine drivers and seasonal patterns of cyanotoxin occurrence and composition. Multiple cyanotoxins were detected at both SPATT sampler locations where SPATTs were deployed year-round, with more frequency compared to accompanying discrete samples. The FLX study also demonstrated the effective use of SPATT sampling to examine seasonal cyanotoxin concentrations through the water column (Box 4—Reducing Matrix Effects to Improve Cyanotoxin Detection). This information is especially important to consider in deep lakes or reservoirs where seasonal stratification occurs. As demonstrated throughout this report, using examples from 12 USGS projects (table 2), SPATT samplers can complement research programs in numerous ways. With continued laboratory and field research to fill known knowledge gaps and improve the use of SPATT samplers (table 4), incorporation into monitoring programs and other investigations can become more consistent and widespread.
Box 5. Implementation of Solid Phase Adsorption Toxin Tracking Monitoring into Nationwide Harmful Algal Bloom Monitoring Toolbox
In 2018, the NPS identified algal blooms as a priority management issue in marine and Great Lakes parks. Because national parks are popular for recreation, and in some areas their lakes and rivers are used as backcountry drinking water sources, an internally available toolkit was developed to provide monitoring resources to park managers (fig. 9). The USGS partnered with NPS to develop a suite of algal bloom monitoring methods in a coordinated and cost-effective manner that included SPATT samplers (NPS study). SPATT samplers are available to national park units at a low cost, and guidance from USGS includes training videos and protocols. The SPATT samplers are deployed in high recreation areas in rivers, lakes, and marine environments and analyzed for 32 freshwater and 25 marine algal toxins using LC-MS/MS methods. Protocols established by the USGS suggest that park staff and volunteers collect discrete cyanotoxin and phytoplankton community samples when SPATT samplers are retrieved from the field and that water-quality measurements be taken with a multi-parameter sonde before deployment and retrieval. SPATT methods have been implemented in 22 national park units across the United States (fig. 1), and detections of anabaenopeptins and microcystins have occurred so far. These data, alongside guidance provided by the toolkit, provide park staff with the knowledge to monitor, prepare, and respond to algal bloom or cyanotoxin events in NPS waters.
National Park Service (NPS) harmful algal bloom (HAB) monitoring toolkit available internally to park managers and staff nationwide. Solid Phase Adsorption Toxin Tracking (SPATT) samplers are one of numerous monitoring methods available to park staff and volunteers depending on the information needed.
Summary
Cyanobacterial toxins pose a substantial threat to water quality worldwide, making regular monitoring essential. However, monitoring can be difficult because cyanotoxin events are unpredictable, and not all cyanobacteria consistently produce toxins. Although traditional discrete cyanotoxin sampling methods may be biased, Solid Phase Adsorption Toxin Tracking (SPATT) samplers can help address these challenges by providing an average cyanotoxin concentration over time. SPATT samplers have been used in various U.S. Geological Survey (USGS) research programs because of their ability to complement discrete samples, low cost, and ease of deployment. However, despite recent advancements, there are still gaps in knowledge that hinder the broader use of SPATT samplers and the development of standardized protocols across the Bureau. Various aspects of SPATT sampler use warrant further study, including optimal deployment times, effective extraction methods, sampler design, environmental variables affecting adsorption and desorption kinetics, and best quality assurance and control practices. Addressing these identified research gaps will improve the reliability of SPATT data collected across USGS and enhance cyanotoxin monitoring efforts in the future.
References Cited
Alvarez, D.A., 2010, Guidelines for the use of the semipermeable membrane device (SPMD) and the polar organic chemical integrative sampler (POCIS) in environmental monitoring studies: U.S. Geological Survey Techniques and Methods, book 1, chap. D4, 28 p., accessed September 9, 2023, at https://pubs.usgs.gov/tm/tm1d4/.
Alvarez, D.A., Petty, J.D., Huckins, J.N., Jones-Lepp, T.L., Getting, D.T., Goddard, J.P., and Manahan, S.E., 2004, Development of a passive, in situ, integrative sampler for hydrophilic organic contaminants in aquatic environments: Environmental Toxicology and Chemistry, v. 23, no. 7, p. 1640–1648. [Available at https://doi.org/10.1897/03-603.]
Anderson, M., Valera, M., and Schnetzer, A., 2023, Co-occurrence of freshwater and marine phycotoxins—A record of microcystins and domoic acid in Bogue Sound, North Carolina (2015 to 2020): Harmful Algae, v. 125, 12 p. [Available at https://doi.org/10.1016/j.hal.2023.102412.]
Armstrong, C.T., Sakowicz, G.P., Smith, J.L., Sanderson, M.P., Reece, K.S., and Place, A.R., 2025, Phycotoxins along two New Jersey estuaries—Limitations of passive samplers in a complex system: Estuaries and Coasts, v. 48, no. 106, 20 p. [Available at https://doi.org/10.1007/s12237-025-01536-x.]
Beecher, A.A., 2022, Monitoring cyanotoxins in the western basin of Lake Erie using emerging technologies: Toledo, Ohio, The University of Toledo, master’s thesis, 18 p., accessed February 1, 2024, at https://www.proquest.com/openview/0732864fc4c89e0c45e4a5e3ffee6857/1?cbl=18750&diss=y&pq-origsite=gscholar.
Birbeck, J.A., Westrick, J.A., O’Neill, G.M., Spies, B., and Szlag, D.C., 2019, Comparative analysis of microcystin prevalence in Michigan lakes by online concentration LC/MS/MS and ELISA: Toxins, v. 11, no. 1, 16 p. [Available at https://doi.org/10.3390/toxins11010013.]
Bláha, L., Babica, P., and Maršálek, B., 2009, Toxins produced in cyanobacterial water blooms—Toxicity and risks: Interdisciplinary Toxicology, v. 2, no. 2, p. 36–41. [Available at https://doi.org/10.2478/v10102-009-0006-2.]
Booij, K., Maarsen, N.L., Theeuwen, M., and Van Bommel, R., 2017, A method to account for the effect of hydrodynamics on polar organic compound uptake by passive samplers: Environmental Toxicology and Chemistry, v. 36, no. 6, p. 1517–1524. [Available at https://doi.org/10.1002/etc.3700.]
Bormans, M., Amzil, Z., Mineaud, E., Brient, L., Savar, V., Robert, E., and Lance, E., 2019, Demonstrated transfer of cyanobacteria and cyanotoxins along a freshwater-marine continuum in France: Harmful Algae, v. 87, 11 p. [Available at https://doi.org/10.1016/j.hal.2019.101639.]
Bouma-Gregson, K., Kudela, R.M., and Power, M.E., 2018, Widespread anatoxin-a detection in benthic cyanobacterial mats throughout a river network: PLoS ONE, v. 13, no. 5, 21 p. [Available at https://doi.org/10.1371/journal.pone.0197669.]
Bouma-Gregson, K., Sturgeon, C.L., Cone, K.C., Uebner, M.Q., Baxter, T.J., Nakatsuka, K., Hansen, A.M., Richardson, E.T., Westrick, J., Szlag Silva, R., Bergamaschi, B.A., and Kraus, T.E.C., 2025, Cyanotoxins in the California Sacramento–San Joaquin Delta—Fixed Station Solid Phase Adsorption Toxin Tracking (SPATT) samplers: U.S. Geological Survey data release, https://doi.org/10.5066/P13ZCBI5.
Brophy, M.J., Mackie, A.L., Park, Y., and Gagnon, G.A., 2019, Exploring the detection of microcystin-LR using polar organic chemical integrative samplers (POCIS): Environmental Science—Processes & Impacts, v. 21, no. 4, p. 659–666. [Available at https://doi.org/10.1039/C8EM00569A.]
Carmichael, W.W., 2001, Health effects of toxin-producing cyanobacteria—“The CyanoHABs”: Human and Ecological Risk Assessment, v. 7, no. 5, p. 1393–1407. [Available at https://doi.org/10.1080/20018091095087.]
Carmichael, W.W., and Boyer, G.L., 2016, Health impacts from cyanobacteria harmful algae blooms—Implications for the North American Great Lakes: Harmful Algae, v. 54, p. 194–212. [Available at https://doi.org/10.1016/j.hal.2016.02.002.]
Carpenter, K.D., and Wise, D.R., 2023, Cyanotoxin concentrations in extracts from cyanobacteria colonies, plankton net tows, and solid phase adsorption toxin tracking (SPATT) samplers in western rivers, lakes, and reservoirs, including drinking water sources in the Oregon Cascades—2016–2020: U.S. Geological Survey data release, https://doi.org/10.5066/P96VPGH7.
Carpenter, K.D., Rosen, B.H., Donahue, D., Duncan, K., Hilbrandt, B., Lewis, C., Swan, K., Triplett, T., and Welch, E., 2025, Reservoir and riverine sources of cyanotoxins in Oregon’s Cascade Range rivers tapped for drinking water supply: Phycology, v. 5, no. 16, 33 p. [Available at https://doi.org/10.3390/phycology5020016.]
Chaffin, J.D., Westrick, J.A., Furr, E., Birbeck, J.A., Reitz, L.A., Stanislawczyk, K., Li, W., Weber, P.K., Bridgeman, T.B., Davis, T.W., and Mayali, X., 2022, Quantification of microcystin production and biodegradation rates in the western basin of Lake Erie: Limnology and Oceanography, v. 67, no. 7, p. 1470–1483. [Available at https://doi.org/10.1002/lno.12096.]
Chaffin, J.D., Westrick, J.A., Reitz, L.A., and Bridgeman, T.B., 2023, Microcystin congeners in Lake Erie follow the seasonal pattern of nitrogen availability: Harmful Algae, v. 127, 12 p. [Available at https://doi.org/10.1016/j.hal.2023.102466.]
Chorus, I., and Welker, M., eds., 2021, Toxic cyanobacteria in water—A guide to their public health consequences, monitoring and management (2d ed.): London, CRC Press, 858 p. [Available at https://doi.org/10.1201/9781003081449.]
D’Angelo, E., 2019, Development and evaluation of a sensitive, diffusive gradients in thin-films (DGT) method for determining microcystin-LR concentrations in freshwater and seawater: Harmful Algae, v. 89, 9 p. [Available at https://doi.org/10.1016/j.hal.2019.101668.]
Delgado, A., Briciu-Burghina, C., and Regan, F., 2021, Antifouling strategies for sensors used in water monitoring—Review and future perspectives: Sensors, v. 21, no. 2, 25 p. [Available at https://doi.org/10.3390/s21020389.]
Dexter, J., McCormick, A.J., Fu, P., and Dziga, D., 2021, Microcystinase—A review of the natural occurrence, heterologous expression, and biotechnological application of MlrA: Water Research, v. 189, 15 p. [Available at https://doi.org/10.1016/j.watres.2020.116646.]
Dilling, L., and Brzezinski, M.A., 2004, Quantifying marine snow as a food choice for zooplankton using stable silicon isotope tracers: Journal of Plankton Research, v. 26, no. 9, p. 1105–1114. [Available at https://doi.org/10.1093/plankt/fbh103.]
Edwards, C., Graham, D., Fowler, N., and Lawton, L.A., 2008, Biodegradation of microcystins and nodularin in freshwaters: Chemosphere, v. 73, no. 8, p. 1315–1321. [Available at https://doi.org/10.1016/j.chemosphere.2008.07.015.]
Fan, L., Sun, G., Qiu, J., Ma, Q., Hess, P., and Li, A., 2014, Effect of seawater salinity on pore-size distribution on a poly(styrene)-based HP20 resin and its adsorption of diarrhetic shellfish toxins: Journal of Chromatography A, v. 1373, p. 1–8. [Available at https://doi.org/10.1016/j.chroma.2014.11.008.]
Ferrão-Filho, A.D.S., and Kozlowsky-Suzuki, B., 2011, Cyanotoxins—Bioaccumulation and effects on aquatic animals: Marine Drugs, v. 9, no. 12, p. 2729–2772. [Available at https://doi.org/10.3390/md9122729.]
Filatova, D., Picardo, M., Núñez, O., and Farré, M., 2020, Analysis, levels and seasonal variation of cyanotoxins in freshwater ecosystems: Trends in Environmental Analytical Chemistry, v. 26, 9 p. [Available at https://doi.org/10.1016/j.teac.2020.e00091.]
Fischer, W.J., Garthwaite, I., Miles, C.O., Ross, K.M., Aggen, J.B., Chamberlin, A.R., Towers, N.R., and Dietrich, D.R., 2001, Congener-independent immunoassay for microcystins and nodularins: Environmental Science & Technology, v. 35, no. 24, p. 4849–4856. [Available at https://doi.org/10.1021/es011182f.]
Francy, D.S., Brady, A.M.G., Ecker, C.D., Graham, J.L., Stelzer, E.A., Struffolino, P., Dwyer, D.F., and Loftin, K.A., 2016, Estimating microcystin levels at recreational sites in western Lake Erie and Ohio: Harmful Algae, v. 58, p. 23–34. [Available at https://doi.org/10.1016/j.hal.2016.07.003.]
Francy, D.S., Graham, J.L., Stelzer, E.A., Ecker, C.D., Brady, A.M.G., Struffolino, P., and Loftin, K.A., 2015, Water quality, cyanobacteria, and environmental factors and their relations to microcystin concentrations for use in predictive models at Ohio Lake Erie and Inland Lake recreational sites, 2013–14: U.S. Geological Survey Scientific Investigations Report 2015–5120, 58 p., accessed February 1, 2024, at https://doi.org/10.3133/sir20155120.
Fux, E., Marcaillou, C., Mondeguer, F., Bire, R., and Hess, P., 2008, Field and mesocosm trials on passive sampling for the study of adsorption and desorption behaviour of lipophilic toxins with a focus on OA and DTX1: Harmful Algae, v. 7, no. 5, p. 574–583. [Available at https://doi.org/10.1016/j.hal.2007.12.008.]
Garcia, A.C., Bargu, S., Dash, P., Rabalais, N.N., Sutor, M., Morrison, W., and Walker, N.D., 2010, Evaluating the potential risk of microcystins to blue crab (Callinectes sapidus) fisheries and human health in a eutrophic estuary: Harmful Algae, v. 9, no. 2, p. 134–143. [Available at https://doi.org/10.1016/j.hal.2009.08.011.]
George, R., Haywood, A., Khan, S., Radovanovic, M., Simmonds, J., and Norris, R., 2018, Enhancement and suppression of ionization in drug analysis using HPLC-MS/MS in support of therapeutic drug monitoring—A review of current knowledge of its minimization and assessment: Therapeutic Drug Monitoring, v. 40, no. 1, p. 1–8.
Getto, S., 2021, Investigating the effects of harmful cyanobacterial blooms on the vulnerability to shell disease of northern red-bellied turtles (Pseudemys rubriventris) in New Jersey: Montclair State University, Master of Science thesis, 68 p. [Available at https://digitalcommons.montclair.edu/etd/771.]
Gibble, C.M., and Kudela, R.M., 2014, Detection of persistent microcystin toxins at the land-sea interface in Monterey Bay, California: Harmful Algae, v. 39, p. 146–153. [Available at https://doi.org/10.1016/j.hal.2014.07.004.]
Godlewska, K., Stepnowski, P., and Paszkiewicz, M., 2021, Pollutant analysis using passive samplers—Principles, sorbents, calibration and applications—A review: Environmental Chemistry Letters, v. 19, p. 465–520. [Available at https://doi.org/10.1007/s10311-020-01079-6.]
Gold Standard Diagnostics, 2024a, ABRAXIS anatoxin-a ELISA microtiter plate—Enzyme-linked immunosorbent assay for the determination of anatoxin-a* in water and contaminated samples: Gold Standard Diagnostics Product No. 520060, 2 p., accessed April 24, 2024, at https://www.goldstandarddiagnostics.us/media/16937/ug-21-057-rev-06-abraxis-anatoxin-a-elisa_520060.pdf.
Gold Standard Diagnostics, 2024b, ABRAXIS cylindrospermopsin ELISA microtiter plate—Enzyme-linked immunosorbent assay for the determination of cylindrospermopsin in water and contaminated samples: Gold Standard Diagnostics Product No. 522011, 2 p., accessed April 24, 2024, at https://www.goldstandarddiagnostics.us/media/16949/ug-21-059-rev-04-abraxis-cylindrospermopsin-elisa_522011.pdf.
Gold Standard Diagnostics, 2024c, ABRAXIS microcystins-ADDA ELISA microtiter plate—Enzyme-linked immunosorbent assay for the congener-independent determination of microcystins and nodularins in water samples: Gold Standard Diagnostics Product No. 520011, 2 p., accessed April 24, 2024, at https://www.goldstandarddiagnostics.us/media/16938/ug-21-052-rev-03-abraxis-microcystins-adda-elisa_520011.pdf.
Gold Standard Diagnostics, 2024d, ABRAXIS saxitoxin (PSP) ELISA microtiter plate—Enzyme-linked immunosorbent assay for the determination of saxitoxin (PSP) in water and contaminated samples: Gold Standard Diagnostics Product No. 52255B, 2 p., accessed April 24, 2024, at https://www.goldstandarddiagnostics.us/media/16933/ug-21-081-rev-05-abraxis-saxitoxin-elisa_52255b.pdf.
Górecki, T., and Namieśnik, J., 2002, Passive sampling: TrAC Trends in Analytical Chemistry, v. 21, no. 4, p. 276–291. [Available at https://doi.org/10.1016/S0165-9936(02)00407-7.]
Graham, J.L., Dubrovsky, N.M., Foster, G.M., King, L.R., Loftin, K.A., Rosen, B.H., and Stelzer, E.A., 2020, Cyanotoxin occurrence in large rivers of the United States: Inland Waters, v. 10, no. 1, p. 109–117. [Available at https://doi.org/10.1080/20442041.2019.1700749.]
Graham, J.L., Ziegler, A.C., Loving, B.L., and Loftin, K.A., 2012, Fate and transport of cyanobacteria and associated toxins and taste-and-odor compounds from upstream reservoir releases in the Kansas River, Kansas, September and October 2011: U.S. Geological Survey Scientific Investigations Report 2012–5129, 65 p. [Available at https://doi.org/10.3133/sir20125129.]
Guo, Y.C., Lee, A.K., Yates, R.S., Liang, S., and Rochelle, P.A., 2017, Analysis of microcystins in drinking water by ELISA and LC/MS/MS: American Water Works Association, v. 109, no. 3, p. 13–25. [Available at https://doi.org/10.5942/jawwa.2017.109.0027.]
Gupta, N., Pant, S.C., Vijayaraghavan, R., and Rao, P.V.L., 2003, Comparative toxicity evaluation of cyanobacterial cyclic peptide toxin microcystin variants (LR, RR, YR) in mice: Toxicology, v. 188, nos. 2–3, p. 285–296. [Available at https://doi.org/10.1016/S0300-483X(03)00112-4.]
Hanselman, T.A., Graetz, D.A., and Wilkie, A.C., 2004, Comparison of three enzyme immunoassays for measuring 17β‐Estradiol in flushed dairy manure wastewater: Journal of Environmental Quality, v. 33, no. 5, p. 1919–1923. [Available at https://doi.org/10.2134/jeq2004.1919.]
Hattenrath-Lehmann, T.K., Lusty, M.W., Wallace, R.B., Haynes, B., Wang, Z., Broadwater, M., Deeds, J.R., Morton, S.L., Hastback, W., Porter, L., Chytalo, K., and Gobler, C.J., 2018, Evaluation of rapid, early warning approaches to track shellfish toxins associated with Dinophysis and Alexandrium blooms: Marine Drugs, v. 16, no. 1, 19 p. [Available at https://doi.org/10.3390/md16010028.]
He, X., Liu, Y.-L., Conklin, A., Westrick, J., Weavers, L.K., Dionysiou, D.D., Lenhart, J.J., Mouser, P.J., Szlag, D., and Walker, H.W., 2016, Toxic cyanobacteria and drinking water—Impacts, detection, and treatment: Harmful Algae, v. 54, p. 174–193. [Available at https://doi.org/10.1016/j.hal.2016.01.001.]
Howard, M.D.A., Nagoda, C., Kudela, R.M., Hayashi, K., Tatters, A., Caron, D.A., Busse, L., Brown, J., Sutula, M., and Stein, E.D., 2017, Microcystin prevalence throughout lentic waterbodies in coastal southern California: Toxins, v. 9, no. 7, 21 p. [Available at https://doi.org/10.3390/toxins9070231.]
Howard, M.D.A., Smith, J., Caron, D.A., Kudela, R.M., Loftin, K., Hayashi, K., Fadness, R., Fricke, S., Kann, J., Roethler, M., Tatters, A., and Theroux, S., 2022, Integrative monitoring strategy for marine and freshwater harmful algal blooms and toxins across the freshwater‐to‐marine continuum: Integrated Environmental Assessment and Management, v. 19, no. 3, p. 586–604. [Available at https://doi.org/10.1002/ieam.4651.]
Huang, C.-H., and Sedlak, D.L., 2001, Analysis of estrogenic hormones in municipal wastewater effluent and surface water using enzyme-linked immunosorbent assay and gas chromatography/tandem mass spectrometry: Environmental Toxicology and Chemistry, v. 20, no. 1, p. 133–139. [Available at https://doi.org/10.1002/etc.5620200114.]
Humpage, A.R., Magalhaes, V.F., and Froscio, S.M., 2010, Comparison of analytical tools and biological assays for detection of paralytic shellfish poisoning toxins: Analytical and Bioanalytical Chemistry, v. 397, p. 1655–1671. [Available at https://doi.org/10.1007/s00216-010-3459-4.]
Jeong, Y., Schäffer, A., and Smith, K., 2018, A comparison of equilibrium and kinetic passive sampling for the monitoring of aquatic organic contaminants in German rivers: Water Research, v. 145, p. 248–258. [Available at https://doi.org/10.1016/j.watres.2018.08.016.]
Jia, A., Guo, Y.C., Di Giovanni, G.D., Prescott, M.D., Li, W.L., and Garcia, E.A., 2022, Improving the quantification of cyanotoxins using a mass balance-based effective concentration-equivalent concentration approach: Environmental Science & Technology, v. 56, no. 20, p. 14418–14426. [Available at https://doi.org/10.1021/acs.est.2c03194.]
Johnston, B.D., Stouder, M.D.W., Gorney, R.M., Rosen, J.J., Carpenter, K.D., Wei, B., and Boyer, G.L., 2025, Evaluation of passive samplers for cyanotoxin detection by immunoassay and chromatographic-mass spectrometry: U.S. Geological Survey Scientific Investigations Report 2025–5046, 37 p., accessed August 7, 2025, at https://doi.org/10.3133/sir20255046.
Kamali, N., Abbas, F., Lehane, M., Griew, M., and Furey, A., 2022, A review of in situ methods—Solid phase adsorption toxin tracking (SPATT) and polar organic chemical integrative sampler (POCIS) for the collection and concentration of marine biotoxins and pharmaceuticals in environmental waters: Molecules, v. 27, no. 22, 59 p. [Available at https://doi.org/10.3390/molecules27227898.]
Kaushik, R., and Balasubramanian, R., 2013, Methods and approaches used for detection of cyanotoxins in environmental samples—A review: Critical Reviews in Environmental Science and Technology, v. 43, no. 13, p. 1349–1383. [Available at https://doi.org/10.1080/10643389.2011.644224.]
Kelly, L.T., Bouma-Gregson, K., Puddick, J., Fadness, R., Ryan, K.G., Davis, T.W., and Wood, S.A., 2019, Multiple cyanotoxin congeners produced by sub-dominant cyanobacterial taxa in riverine cyanobacterial and algal mats: PLOS One, v. 14, no. 12, 15 p. [Available at https://doi.org/10.1371/journal.pone.0220422.]
Kim, M., Hong, S., Cha, J., Kim, Y., Lee, C.-E., An, Y., and Shin, K.-H., 2021, Multimedia distributions and the fate of microcystins from freshwater discharge in the Geum River Estuary, South Korea—Applicability of POCIS for monitoring of microalgal biotoxins: Environmental Pollution, v. 291. [Available at https://doi.org/10.1016/j.envpol.2021.118222.]
King, R., Bonfiglio, R., Fernandez-Metzler, C., Miller-Stein, C., and Olah, T., 2000, Mechanistic investigation of ionization suppression in electrospray ionization: Journal of the American Society for Mass Spectrometry, v. 11, no. 11, p. 942–950. [Available at https://doi.org/10.1016/S1044-0305(00)00163-X.]
Kohoutek, J., Babica, P., Bláha, L., and Maršálek, B., 2008, A novel approach for monitoring of cyanobacterial toxins—Development and evaluation of the passive sampler for microcystins: Analytical and Bioanalytical Chemistry, v. 390, no. 4, p. 1167–1172. [Available at https://doi.org/10.1007/s00216-007-1785-y.]
Kot-Wasik, A., Zabiegała, B., Urbanowicz, M., Dominiak, E., Wasik, A., and Namieśnik, J., 2007, Advances in passive sampling in environmental studies: Analytica Chimica Acta, v. 602, no. 2, p. 141–163. [Available at https://doi.org/10.1016/j.aca.2007.09.013.]
Kruk, C., Martínez, A., Martínez De La Escalera, G., Trinchin, R., Manta, G., Segura, A.M., Piccini, C., Brena, B., Yannicelli, B., Fabiano, G., and Calliari, D., 2021, Rapid freshwater discharge on the coastal ocean as a mean of long distance spreading of an unprecedented toxic cyanobacteria bloom: Science of the Total Environment, v. 754, 13 p. [Available at https://doi.org/10.1016/j.scitotenv.2020.142362.]
Kudela, R.M., 2011, Characterization and deployment of solid phase adsorption toxin tracking (SPATT) resin for monitoring of microcystins in fresh and saltwater: Harmful Algae, v. 11, p. 117–125. [Available at https://doi.org/10.1016/j.hal.2011.08.006.]
Kudela, R.M., 2017, Passive sampling for freshwater and marine algal toxins, chap. 11 of Diogène, J., Campàs, M., eds., Comprehensive analytical chemistry—Recent advances in the analysis of marine toxins: Amsterdam, Netherlands, Elsevier, v. 78, p. 379–409. [Available at https://doi.org/10.1016/bs.coac.2017.08.006.]
Kurtz, T., Zeng, T., and Rosario-Ortiz, F.L., 2021, Photodegradation of cyanotoxins in surface waters: Water Research, v. 192, 17 p. [Available at https://doi.org/10.1016/j.watres.2021.116804.]
Lane, J.Q., Roddam, C.M., Langlois, G.W., and Kudela, R.M., 2010, Application of solid phase adsorption toxin tracking (SPATT) for field detection of the hydrophilic phycotoxins domoic acid and saxitoxin in coastal California: Limnology and Oceanography—Methods, v. 8, no. 11, p. 645–660. [Available at https://doi.org/10.4319/lom.2010.8.0645.]
Li, F.-L., Li, Z.-X., Guo, M.-M., Wu, H.-Y., Zhang, T.-T., and Song, C.-H., 2016, Investigation of diarrhetic shellfish toxins in Lingshan Bay, Yellow Sea, China, using solid-phase adsorption toxin tracking (SPATT): Food Additives & Contaminants—Part A, v. 33, no. 8, p. 1367–1373. [Available at https://doi.org/10.1080/19440049.2016.1200752.]
Linz, D.M., Sienkiewicz, N., Struewing, I., Stelzer, E.A., Graham, J.L., and Lu, J., 2023, Metagenomic mapping of cyanobacteria and potential cyanotoxin producing taxa in large rivers of the United States: Scientific Reports, v. 13, no. 1, 13 p. [Available at https://doi.org/10.1038/s41598-023-29037-6.]
Liu, J., Xing, Y., Lin, Y., Xie, Y., and Zhou, X., 2023, Effect of pretreatment approach on the ELISA-based detection of cyanotoxins in water—Analysis and application: Science of the Total Environment, v. 871. [Available at https://doi.org/10.1016/j.scitotenv.2023.161988.]
MacKenzie, L.A., 2010, In situ passive solid-phase adsorption of micro-algal biotoxins as a monitoring tool: Current Opinion in Biotechnology, v. 21, no. 3, p. 326–331. [Available at https://doi.org/10.1016/j.copbio.2010.01.013.]
MacKenzie, L., Beuzenberg, V., Holland, P., McNabb, P., and Selwood, A., 2004, Solid phase adsorption toxin tracking (SPATT)—A new monitoring tool that simulates the biotoxin contamination of filter feeding bivalves: Toxicon, v. 44, no. 8, p. 901–918. [Available at https://doi.org/10.1016/j.toxicon.2004.08.020.]
MacKenzie, L.A., Selwood, A.I., McNabb, P., and Rhodes, L., 2011, Benthic dinoflagellate toxins in two warm-temperate estuaries—Rangaunu and Parengarenga Harbours, Northland, New Zealand: Harmful Algae, v. 10, no. 6, p. 559–566. [Available at https://doi.org/10.1016/j.hal.2011.02.007.]
Magin, C.M., Cooper, S.P., and Brennan, A.B., 2010, Non-toxic antifouling strategies: Materials Today, v. 13, no. 4, p. 36–44. [Available at https://doi.org/10.1016/S1369-7021(10)70058-4.]
Matson, P.G., Boyer, G.L., Bridgeman, T.B., Bullerjahn, G.S., Kane, D.D., McKay, R.M.L., McKindles, K.M., Raymond, H.A., Snyder, B.K., Stumpf, R.P., and Davis, T.W., 2020, Physical drivers facilitating a toxigenic cyanobacterial bloom in a major Great Lakes tributary: Limnology and Oceanography, v. 65, no. 12, p. 2866–2882. [Available at https://doi.org/10.1002/lno.11558.]
McCarthy, M., Van Pelt, F.N.A.M., Bane, V., O’Halloran, J., and Furey, A., 2014, Application of passive (SPATT) and active sampling methods in the profiling and monitoring of marine biotoxins: Toxicon, v. 89, p. 77–86. [Available at https://doi.org/10.1016/j.toxicon.2014.07.005.]
Mehinto, A.C., Smith, J., Wenger, E., Stanton, B., Linville, R., Brooks, B.W., Sutula, M.A., and Howard, M.D.A., 2021, Synthesis of ecotoxicological studies on cyanotoxins in freshwater habitats—Evaluating the basis for developing thresholds protective of aquatic life in the United States: Science of the Total Environment, v. 795, 8 p. [Available at https://doi.org/10.1016/j.scitotenv.2021.148864.]
Merel, S., Walker, D., Chicana, R., Snyder, S., Baurès, E., and Thomas, O., 2013, State of knowledge and concerns on cyanobacterial blooms and cyanotoxins: Environment International, v. 59, p. 303–327. [Available at https://doi.org/10.1016/j.envint.2013.06.013.]
Metcalf, J.S., Hyenstrand, P., Beattie, K.A., and Codd, G.A., 2000, Effects of physicochemical variables and cyanobacterial extracts on the immunoassay of microcystin-LR by two ELISA kits: Journal of Applied Microbiology, v. 89, no. 3, p. 532–538. [Available at https://doi.org/10.1046/j.1365-2672.2000.01141.x.]
Metcalf, J.S., Tischbein, M., Cox, P.A., and Stommel, E.W., 2021, Cyanotoxins and the nervous system: Toxins, v. 13, no. 9, 19 p. [Available at https://doi.org/10.3390/toxins13090660.]
Miller, M.A., Kudela, R.M., Mekebri, A., Crane, D., Oates, S.C., Tinker, M.T., Staedler, M., Miller, W.A., Toy-Choutka, S., Dominik, C., Hardin, D., Langlois, G., Murray, M., Ward, K., and Jessup, D.A., 2010, Evidence for a novel marine harmful algal bloom—Cyanotoxin (microcystin) transfer from land to sea otters: PLoS ONE, v. 5, no. 9, 11 p. [Available at https://doi.org/10.1371/journal.pone.0012576.]
Moore, C.E., Juan, J., Lin, Y., Gaskill, C.L., and Puschner, B., 2016, Comparison of protein phosphatase inhibition assay with LC-MS/MS for diagnosis of microcystin toxicosis in veterinary cases: Marine Drugs, v. 14, no. 3, 16 p. [Available at https://doi.org/10.3390/md14030054.]
Moy, N.J., Dodson, J., Tassone, S.J., Bukaveckas, P.A., and Bulluck, L.P., 2016, Biotransport of algal toxins to riparian food webs: Environmental Science & Technology, v. 50, no. 18, p. 10007–10014. [Available at https://doi.org/10.1021/acs.est.6b02760.]
Negrey, K., Howard, M., Smith, J., Kudela, R., and Caron, D., 2023, Standard operating procedure for Solid Phase Adsorption Toxin Testing (SPATT) assemblage and extraction of HAB toxins v2 V.1: University of California Santa Cruz, accessed October 3, 2023, at https://doi.org/10.17504/protocols.io.dm6gpb255lzp/v1.
Nishiwaki-Matsushima, R., Ohta, T., Nishiwaki, S., Suganuma, M., Kohyama, K., Ishikawa, T., Carmichael, W.W., and Fujiki, H., 1992, Liver tumor promotion by the cyanobacterial cyclic peptide toxin microcystin-LR: Journal of Cancer Research and Clinical Oncology, v. 118, no. 6, p. 420–424. [Available at https://doi.org/10.1007/BF01629424.]
North Coast Regional Water Quality Control Board, 2022a, Benthic cyanobacteria and cyanotoxin monitoring in northern California rivers, 2016–2019: Santa Rosa, Calif., North Coast Regional Water Quality Control Board, Freshwater Harmful Algal Bloom Monitoring and Response Program, [variously paged], accessed January 31, 2024, at https://www.waterboards.ca.gov/northcoast/water_issues/programs/swamp/pdf/20220208_Final_North_Coast_Benthic_Cyano_Report_2016-2019_ADA.pdf.
North Coast Regional Water Quality Control Board, 2022b, Cyanotoxin monitoring with SPATT passive samplers in northern California rivers, 2019: North Coast Regional Water Quality Control Board, Freshwater Harmful Algal Bloom Monitoring and Response Program, [variously paged], accessed March 11, 2024, at https://www.waterboards.ca.gov/northcoast/water_issues/programs/swamp/pdf/SPATT_Report_2019_ADA.pdf.
Nunes, G.S., Toscano, I.A., and Barceló, D., 1998, Analysis of pesticides in food and environmental samples by enzyme-linked immunosorbent assays: Trends in Analytical Chemistry, v. 17, no. 2, p. 79–87. [Available at https://doi.org/10.1016/S0165-9936(97)00116-7.]
Nyoni, H., Mamba, B.B., and Msagati, T.A.M., 2017, Development of a silicone-membrane passive sampler for monitoring cylindrospermopsin and microcystin LR-YR-RR in natural waters: Physics and Chemistry of the Earth, Parts A/B/C, v. 100, p. 189–200. [Available at https://doi.org/10.1016/j.pce.2016.10.010.]
Onofrio, M.D., Mallet, C.R., Place, A.R., and Smith, J.L., 2020, A screening tool for the direct analysis of marine and freshwater phycotoxins in organic SPATT extracts from the Chesapeake Bay: Toxins, v. 12, no. 5, 18 p. [Available at https://doi.org/10.3390/toxins12050322.]
Otten, T.G., Crosswell, J.R., Mackey, S., and Dreher, T.W., 2015, Application of molecular tools for Microbial source tracking and public health risk assessment of a microcystis bloom traversing 300km of the Klamath River: Harmful Algae, v. 46, p. 71–81. [Available at https://doi.org/10.1016/j.hal.2015.05.007.]
Pacheco, A.B.F., Guedes, I.A., and Azevedo, S.M.F.O., 2016, Is qPCR a reliable indicator of cyanotoxin risk in freshwater?: Toxins, v. 8, no. 6, 26 p. [Available at https://doi.org/10.3390/toxins8060172.]
Paerl, H.W., and Otten, T.G., 2013, Harmful cyanobacterial blooms—Causes, consequences, and controls: Microbial Ecology, v. 65, no. 4, p. 995–1010. [Available at https://doi.org/10.1007/s00248-012-0159-y.]
Parker, K.M., Reichwaldt, E.S., Ghadouani, A., and Mitch, W.A., 2016, Halogen radicals promote the photodegradation of microcystins in estuarine systems: Environmental Science & Technology, v. 50, no. 16, p. 8505–8513. [Available at https://doi.org/10.1021/acs.est.6b01801.]
Peacock, M.B., Gibble, C.M., Senn, D.B., Cloern, J.E., and Kudela, R.M., 2018, Blurred lines—Multiple freshwater and marine algal toxins at the land-sea interface of San Francisco Bay, California: Harmful Algae, v. 73, p. 138–147. [Available at https://doi.org/10.1016/j.hal.2018.02.005.]
Preece, E.P., Hardy, F.J., Moore, B.C., and Bryan, M., 2017, A review of microcystin detections in estuarine and marine waters—Environmental implications and human health risk: Harmful Algae, v. 61, p. 31–45. [Available at https://doi.org/10.1016/j.hal.2016.11.006.]
Prestigiacomo, A.R., Gorney, R.M., Hyde, J.B., Davis, C., and Clinkhammer, A., 2023, Patterns and impacts of cyanobacteria in a deep, thermally stratified, oligotrophic lake: AWWA Water Science, v. 5, no. 2, 18 p. [Available at https://doi.org/10.1002/aws2.1326.]
Qi, H., Zhao, S., Fu, H., Wen, J., and Jia, X., 2014, Enhancement of ascomycin production in Streptomyces hygroscopicus var. ascomyceticus by combining resin HP20 addition and metabolic profiling analysis: Journal of Industrial Microbiology & Biotechnology, v. 41, no. 9, p. 1365–1374. [Available at https://doi.org/10.1007/s10295-014-1473-9.]
Reinl, K.L., Brookes, J.D., Carey, C.C., Harris, T.D., Ibelings, B.W., Morales‐Williams, A.M., De Senerpont Domis, L.N., Atkins, K.S., Isles, P.D.F., Mesman, J.P., North, R.L., Rudstam, L.G., Stelzer, J.A.A., Venkiteswaran, J.J., Yokota, K., and Zhan, Q., 2021, Cyanobacterial blooms in oligotrophic lakes—Shifting the high‐nutrient paradigm: Freshwater Biology, v. 66, no. 9, p. 1846–1859. [Available at https://doi.org/10.1111/fwb.13791.]
Richardson, B.J., Lam, P.K.S., Zheng, G.J., McClellan, K.E., and De Luca-Abbott, S.B., 2002, Biofouling confounds the uptake of trace organic contaminants by semi-permeable membrane devices (SPMDs): Marine Pollution Bulletin, v. 44, no. 12, p. 1372–1379. [Available at https://doi.org/10.1016/S0025-326X(02)00263-1.]
Rodríguez, P., Alfonso, A., Turrell, E., Lacaze, J.-P., and Botana, L.M., 2011, Study of solid phase adsorption of paralytic shellfish poisoning toxins (PSP) onto different resins: Harmful Algae, v. 10, no. 5, p. 447–455. [Available at https://doi.org/10.1016/j.hal.2011.02.005.]
Ross, C., Santiago-Vázquez, L., and Paul, V., 2006, Toxin release in response to oxidative stress and programmed cell death in the cyanobacterium microcystis aeruginosa: Aquatic Toxicology (Amsterdam, Netherlands), v. 78, no. 1, p. 66–73. [Available at https://doi.org/10.1016/j.aquatox.2006.02.007.]
Roué, M., Darius, H.T., and Chinain, M., 2018, Solid phase adsorption toxin tracking (SPATT) technology for the monitoring of aquatic toxins—A review: Toxins, v. 10, no. 4, 28 p. [Available at https://doi.org/10.3390/toxins10040167.]
Roy-Lachapelle, A., Solliec, M., Sauvé, S., and Gagnon, C., 2021, Evaluation of ELISA-based method for total anabaenopeptins determination and comparative analysis with on-line SPE-UHPLC-HRMS in freshwater cyanobacterial blooms: Talanta, v. 223, 9 p. [Available at https://doi.org/10.1016/j.talanta.2020.121802.]
Sasaki, D., and Mitchell, R.A., 2001, How to obtain reproducible quantitative ELISA results: Oxford Biomedical Research, 11 p. [Available at https://www.oxfordbiomed.com/sites/default/files/2017-02/How%20to%20Obtain%20Reproducible%20Quantitative%20ELISA%20results.pdf.]
Scarlett, K.R., Kim, S., Lovin, L.M., Chatterjee, S., Scott, J.T., and Brooks, B.W., 2020, Global scanning of cylindrospermopsin—Critical review and analysis of aquatic occurrence, bioaccumulation, toxicity and health hazards: Science of the Total Environment, v. 738, 14 p. [Available at https://doi.org/10.1016/j.scitotenv.2020.139807.]
Schnetzer, A., Lampe, R.H., Benitez-Nelson, C.R., Marchetti, A., Osburn, C.L., and Tatters, A.O., 2017, Marine snow formation by the toxin-producing diatom, Pseudo-nitzschia australis: Harmful Algae, v. 61, p. 23–30. [Available at https://doi.org/10.1016/j.hal.2016.11.008.]
Silva, C.P., Lima, D.L.D., Schneider, R.J., Otero, M., and Esteves, V.I., 2014, Evaluation of the anthropogenic input of caffeine in surface waters of the north and center of Portugal by ELISA: Science of the Total Environment, v. 479–480, p. 227–232. [Available at https://doi.org/10.1016/j.scitotenv.2014.01.120.]
Silvani, L., Riccardi, C., Eek, E., Papini, M.P., Morin, N.A.O., Cornelissen, G., Oen, A.M.P., and Hale, S.E., 2017, Monitoring alkylphenols in water using the polar organic chemical integrative sampler (POCIS)—Determining sampling rates via the extraction of PES membranes and Oasis beads: Chemosphere, v. 184, p. 1362–1371. [Available at https://doi.org/10.1016/j.chemosphere.2017.06.083.]
Spitz, F.J., Heckathorn, H.A., Rosen, J.J., Bowen, K.M., and Trevino, J.M., 2025, Cyanotoxin concentrations in extracts from Solid Phase Adsorption Toxin Tracking (SPATT) samplers and other water-quality data collected from the Salem River, New Jersey, July–October 2020: U.S. Geological Survey data release, https://doi.org/10.5066/P1UOSRNB.
Spoof, L., and Catherine, A., 2016, Appendix 3—Tables of microcystins and nodularins, in Meriluoto, J., Spoof, L., and Codd, G.A., eds., Handbook of cyanobacterial monitoring and cyanotoxin analysis: Chichester, West Sussex, John Wiley & Sons, Inc., p. 526–537. [Available at https://doi.org/10.1002/9781119068761.app3.]
Stouder, M.D.W., Boyer, G.L., Carpenter, K.D., D’Angelo, E.M., Gorney, R.M., and Rosen, J.J., 2024, Cyanotoxin concentrations in extracts from solid phase adsorption toxin tracking (SPATT) and diffusive gradients in thin-films (DGT) samplers in Owasco Lake, Seneca Lake, and Skaneateles Lake, Finger Lakes Region, New York, 2019: U.S. Geological Survey data release, https://doi.org/10.5066/P9OZR89E.
Tatters, A.O., Howard, M.D.A., Nagoda, C., Fetscher, A.E., Kudela, R.M., and Caron, D.A., 2019, Heterogeneity of toxin-producing cyanobacteria and cyanotoxins in coastal watersheds of southern California: Estuaries and Coasts, v. 42, p. 958–975. [Available at https://doi.org/10.1007/s12237-019-00546-w.]
Tatters, A.O., Smith, J., Kudela, R.M., Hayashi, K., Howard, M.D.A., Donovan, A.R., Loftin, K.A., and Caron, D.A., 2021, The tide turns—Episodic and localized cross-contamination of a California coastline with cyanotoxins: Harmful Algae, v. 103, 13 p. [Available at https://doi.org/10.1016/j.hal.2021.102003.]
Trevino, J.M., Graham, J.L., Foster, G.M., Gifford, S.R., Rosen, J.J., Coles, J.F., Culbertson, C.W., Heckathorn, H.A., Jastram, J.D., Olds, H.T., Schill, W.B., and Stelzer, E.A., 2024, Cyanobacteria, cyanotoxin, cyanotoxin synthetase gene, and other water-quality data collected from five river basins in the North Atlantic Appalachian Region, August through September 2020: U.S. Geological Survey data release, https://doi.org/10.5066/P94LAHHM.
Trevino, J.M., Gorney, R.M., Clonan, K.R., Heckathorn, H.A., Spitz, F.J., and Feinson, L.S., 2025, Cyanobacteria, other water-quality, and discharge data collected from the Raritan River Basin, New Jersey, August 2020 through August 2021: U.S. Geological Survey data release, https://doi.org/10.5066/P1S5DQ6A.
U.S. Environmental Protection Agency, 2016, Method 546—Determination of total microcystins and nodularins in drinking water and ambient water by adda enzyme-linked immunosorbent assay: U.S. Environmental Protection Agency, 21 p., accessed September 27, 2023, at https://www.epa.gov/sites/default/files/2016-09/documents/method-546-determination-total-microcystins-nodularins-drinking-water-ambient-water-adda-enz yme-linked-immunosorbent-assay.pdf.
U.S. Environmental Protection Agency, 2019a, Cyanobacteria and cyanotoxins—Information for drinking water systems: U.S. Environmental Protection Agency, 11 p., accessed October 3, 2023, at https://www.epa.gov/sites/default/files/2014-08/documents/cyanobacteria_factsheet.pdf.
U.S. Environmental Protection Agency, 2019b, Recommendations for cyanobacteria and cyanotoxin monitoring in recreational waters: U.S. Environmental Protection Agency, 16 p., accessed October 3, 2023, at https://www.epa.gov/sites/default/files/2019-09/documents/recommend-cyano-rec-water-2019-update.pdf.
U.S. Geological Survey, [variously dated], National field manual for the collection of water-quality data (NFM): U.S. Geological Survey web page, accessed April 24, 2024, at https://www.usgs.gov/mission-areas/water-resources/science/national-field-manual-collection-water-quality-data-nfm?qt-science_center_objects=0#qt-scie nce_center_objects.
Vanysacker, L., Boerjan, B., Declerck, P., and Vankelecom, I.F.J., 2014, Biofouling ecology as a means to better understand membrane biofouling: Applied Microbiology and Biotechnology, v. 98, p. 8047–8072. [Available at https://doi.org/10.1007/s00253-014-5921-2.]
Vrana, B., Allan, I.J., Greenwood, R., Mills, G.A., Dominiak, E., Svensson, K., Knutsson, J., and Morrison, G., 2005, Passive sampling techniques for monitoring pollutants in water: Trends in Analytical Chemistry, v. 24, no. 10, p. 845–868. [Available at https://doi.org/10.1016/j.trac.2005.06.006.]
Wang, P., Du, B., Smith, J., Lao, W., Wong, C.S., and Zeng, E.Y., 2022, Development and field evaluation of the organic-diffusive gradients in thin-films (o-DGT) passive water sampler for microcystins: Chemosphere, v. 287, no. 1, 9 p. [Available at https://doi.org/10.1016/j.chemosphere.2021.132079.]
Wiltsie, D., Schnetzer, A., Green, J., Vander Borgh, M., and Fensin, E., 2018, Algal blooms and cyanotoxins in Jordan Lake, North Carolina: Toxins, v. 10, no. 2, 23 p. [Available at https://doi.org/10.3390/toxins10020092.]
Wood, R., 2016, Acute animal and human poisonings from cyanotoxin exposure—A review of the literature: Environment International, v. 91, p. 276–282. [Available at https://doi.org/10.1016/j.envint.2016.02.026.]
Wood, S.A., Biessy, L., and Puddick, J., 2018, Anatoxins are consistently released into the water of streams with microcoleus autumnalis-dominated (cyanobacteria) proliferations: Harmful Algae, v. 80, p. 88–95. [Available at https://doi.org/10.1016/j.hal.2018.10.001.]
Wood, S.A., Holland, P.T., and MacKenzie, L., 2011, Development of solid phase adsorption toxin tracking (SPATT) for monitoring anatoxin-a and homoanatoxin-a in river water: Chemosphere, v. 82, no. 6, p. 888–894. [Available at https://doi.org/10.1016/j.chemosphere.2010.10.055.]
Wood, S.A., Kuhajek, J.M., deWinton, M., and Phillips, N.R., 2012, Species composition and cyanotoxin production in periphyton mats from three lakes of varying trophic status: FEMS Microbiology Ecology, v. 79, no. 2, p. 312–326. [Available at https://doi.org/10.1111/j.1574-6941.2011.01217.x.]
Wörmer, L., Huerta-Fontela, M., Cirés, S., Carrasco, D., and Quesada, A., 2010, Natural photodegradation of the cyanobacterial toxins microcystin and cylindrospermopsin: Environmental Science & Technology, v. 44, no. 8, p. 3002–3007. [Available at https://doi.org/10.1021/es9036012.]
Wu, X., Xiao, B., Li, R., Wang, C., Huang, J., and Wang, Z., 2011, Mechanisms and factors affecting sorption of microcystins onto natural sediments: Environmental Science & Technology, v. 45, no. 7, p. 2641–2647. [Available at https://doi.org/10.1021/es103729m.]
Yao, L., Steinman, A.D., Wan, X., Shu, X., and Xie, L., 2019, A new method based on diffusive gradients in thin films for in situ monitoring microcystin-LR in waters: Scientific Reports, v. 9, no. 1, 8 p. [Available at https://doi.org/10.1038/s41598-019-53835-6.]
Zendong, Z., Bertrand, S., Herrenknecht, C., Abadie, E., Jauzein, C., Lemée, R., Gouriou, J., Amzil, Z., and Hess, P., 2016, Passive sampling and high resolution mass spectrometry for chemical profiling of French coastal areas with a focus on marine biotoxins: Environmental Science & Technology, v. 50, no. 16, p. 8522–8529. [Available at https://doi.org/10.1021/acs.est.6b02081.]
Zhang, H., and Davison, W., 1995, Performance characteristics of diffusion gradients in thin films for the in situ measurement of trace metals in aqueous solution: Analytical Chemistry, v. 67, no. 19, p. 3391–3400. [Available at https://doi.org/10.1021/ac00115a005.]
Zhao, H., Qiu, J., Fan, H., and Li, A., 2013, Mechanism and application of solid phase adsorption toxin tracking for monitoring microcystins: Journal of Chromatography A, v. 1300, p. 159–164. [Available at https://doi.org/10.1016/j.chroma.2013.02.048.]
Zuellig, R.E., Graham, J.L., Stelzer, E.A., Loftin, K.A., and Rosen, B.H., 2021, Cyanobacteria, cyanotoxin synthetase gene, and cyanotoxin occurrence among selected large river sites of the conterminous United States, 2017–18: U.S. Geological Survey Scientific Investigations Report 2021–5121, 22 p. [Available at https://doi.org/10.3133/sir20215121.]
Appendix 1. Reducing Matrix Effects to Improve Cyanotoxin Detection
References Cited
Bouma-Gregson, K., Sturgeon, C.L., Cone, K.C., Uebner, M.Q., Baxter, T.J., Nakatsuka, K., Hansen, A.M., Richardson, E.T., Westrick, J., Szlag Silva, R., Bergamaschi, B.A., and Kraus, T.E.C., 2025, Cyanotoxins in the California Sacramento–San Joaquin Delta—Fixed Station Solid Phase Adsorption Toxin Tracking (SPATT) samplers: U.S. Geological Survey data release, https://doi.org/10.5066/P13ZCBI5.
Conversion Factors
International System of Units to U.S. customary units
Temperature in degrees Fahrenheit (°F) may be converted to degrees Celsius (°C) as follows:
°C = (°F − 32) / 1.8.
Supplemental Information
Concentrations of chemical constituents in water are in micrograms per liter (µg/L).
Concentrations of cyanotoxins measured using Solid Phase Adsorption Toxin Tracking samplers are in either nanograms of toxin per gram of resin (ng/g), nanograms of toxin per gram of resin per day (ng/g/day), or micrograms per liter (µg/L).
Concentration of cyanotoxins in benthic periphyton or other tissues are reported in micrograms per gram (µg/g) dry weight.
Pore size is in micrometers (µm) and length is in centimeters (cm) or millimeters (mm).
Abbreviations
×
times
°C
degrees Celsius
BMAA
β-Methylamino-L-alanine
BMC
Beyond Microcystins
CRB
Influence of Harmful Algal Blooms on Mussels in the Clinch River, Tennessee and Virginia
DOC
dissolved organic carbon
EDU
HAB Education and Outreach in Urban Settings, Tennessee
ELISA
enzyme-linked immunosorbent assay
EPA
U.S. Environmental Protection Agency
FLX
Harmful Algal Bloom Monitoring in the Finger Lakes Region, New York
HAB
harmful algal bloom
HSM
Monitoring Cyanotoxins in California's Sacramento–San Joaquin Delta: High-Resolution Mapping Surveys
LC-MS
liquid chromatography and mass spectrometry
LC-MS/MS
liquid chromatography and tandem mass spectrometry
MC
microcystin
MS
mass spectrometry
NAR
Cyanobacteria, Cyanotoxins, and Associated Characteristics Across the North Atlantic Appalachian Region
NJC
Monitoring Harmful Algal Blooms in a Coastal System to Identify the Factors that Affect HAB Production and the Downstream Transport of Cyanobacteria and Associated Cyanotoxins from Freshwater to Marine Environments
NPS
Rapid Response Strategy for Potential Toxin Exposures from Harmful Algal Blooms in Coastal and Shoreline Areas of National Parks
NYWSC
New York Water Science Center
o-DGT
organic diffusive gradients in thin film
ODW
Harmful Algal Blooms and Drinking Water in Oregon
POCIS
polar organic chemical integrated sampler
QA/QC
quality assurance/quality control
RRB
Downstream Fate and Transport of Cyanobacteria and Cyanotoxins in the Raritan Basin Water Supply Complex, New Jersey
SPATT
Solid Phase Adsorption Toxin Tracking
SPE
solid phase extraction
SPMD
semipermeable membrane device
SRB
An Evaluation of SPATT Technology to Assess Cyanotoxins Variability and Transport in the Salem River, New Jersey
SSD
Monitoring Cyanotoxins in California's Sacramento–San Joaquin Delta: Fixed Stations
USGS
U.S. Geological Survey
UV-A
ultraviolet A
UV-B
ultraviolet B
For more information concerning the research in this report, contact the
Director, California Water Science Center
U.S. Geological Survey
6000 J Street, Placer Hall
Sacramento, California 95819
https://www.usgs.gov/centers/california-water-science-center
Publishing support provided by the USGS Science Publishing Network,
Sacramento Publishing Service Center
Disclaimers
Any use of trade, firm, or product names is for descriptive purposes only and does not imply endorsement by the U.S. Government.
Although this information product, for the most part, is in the public domain, it also may contain copyrighted materials as noted in the text. Permission to reproduce copyrighted items must be secured from the copyright owner.
Suggested Citation
Jaegge, A.C., Bouma-Gregson, K., Byl, T.D., Carpenter, K.D., Christensen, V.G., Gorney, R.M., Graham, J.L., Heckathorn, H.A., Olds, H.T., Reilly, P.A., Rosen, J.J., and Stouder, M.D., 2026, Opportunities and challenges in using Solid Phase Adsorption Toxin Tracking (SPATT) samplers for monitoring cyanotoxins in freshwater and estuarine environments: U.S. Geological Survey Scientific Investigations Report 2025–5093, 39 p., https://doi.org/10.3133/sir20255093.
ISSN: 2328-0328 (online)
Study Area
| Publication type | Report |
|---|---|
| Publication Subtype | USGS Numbered Series |
| Title | Opportunities and challenges in using Solid Phase Adsorption Toxin Tracking (SPATT) samplers for monitoring cyanotoxins in freshwater and estuarine environments |
| Series title | Scientific Investigations Report |
| Series number | 2025-5093 |
| DOI | 10.3133/sir20255093 |
| Publication Date | April 13, 2026 |
| Year Published | 2026 |
| Language | English |
| Publisher | U.S. Geological Survey |
| Publisher location | Reston, VA |
| Contributing office(s) | California Water Science Center |
| Description | Report: x, 39 p.; 6 Data Releases |
| Country | United States |
| Online Only (Y/N) | Y |