

Comparison of Two Precipitation Gage Networks in Cook County, Illinois
Links
- Document: Report (22 MB pdf) , HTML , XML
- Table: Appendix 1 (zip) - Table 1.1
- Dataset: USGS National Water Information System database - USGS water data for the Nation
- NGMDB Index Page: National Geologic Map Database Index Page (html)
- Download citation as: RIS | Dublin Core
Abstract
The Cook County Precipitation Network is a set of 25 precipitation gages established within Cook County, Illinois, on approximately a 5- to 7-mile square grid and used by the U.S. Army Corps of Engineers to help account for diversions of water from Lake Michigan to the State of Illinois. The transition from the precipitation gage network operated by the Illinois State Water Survey to the precipitation gage network operated by the U.S. Geological Survey (USGS) was compared for periods of overlapping data. This transition took place from May through September during the 2019 water year. The USGS was able to establish replacement precipitation gages at 17 of the 25 sites by the conclusion of the overlapping operational period.
The double-mass curve method was used to compare the two networks by creating a graph of the cumulated data collected by the Illinois State Water Survey and the comparable data collected by the USGS. Breaks in the double-mass curve method are caused by a change in the relation between variables. The eight sites that were installed following the overlapping period have a gap in the recorded data; however, the slope of the line for each of the eight sites is nearly equivalent to the previous data. In general, the cumulated precipitation data from the two networks were similar. Three sites had greater than 8-percent difference in their cumulative data ratios, located at Cicero, Ping Tom Park at Chicago, and South Shore, Ill.
Plain Language Summary
The Cook County Precipitation Network includes 25 precipitation gages spread out across Cook County, Illinois. These gages help the U.S. Army Corps of Engineers track how much water is diverted from Lake Michigan into Illinois. In 2019, the responsibility for operating and maintaining these gages shifted from the Illinois State Water Survey to the U.S. Geological Survey. To evaluate the data consistency during the transition, the two organizations operated their networks at the same time for a few months (May to September 2019). During this period, the U.S. Geological Survey installed new gages at 17 of the 25 sites. The remaining 8 sites were installed later, resulting in data gaps for those sites. An analytical method called a double-mass curve was used to compare the data from both networks. Overall, the precipitation totals from both networks were very similar. However, three sites had cumulative data ratio differences greater than 8 percent.
Introduction
In response to a 1967 U.S. Supreme Court Decree (Wisconsin v. Illinois, 388 U.S.426 [1967]) amended in 1980 (U.S. Supreme Court, Wisconsin v. Illinois, 449 U.S.48 [1980]), a Lake Michigan Diversion Accounting (LMDA) program has been developed by the U.S. Army Corps of Engineers (USACE), Chicago District and the State of Illinois as part of the interstate Great Lakes water regulatory program. In 1986, Congress passed the Water Resources Development Act (Public Law 99–662, 100 Stat. 4082) that stipulates the USACE is responsible for the flow measurement and computation of annual diversion accounting for the State of Illinois’ Lake Michigan Diversion. Illinois’ Lake Michigan Diversion is made up of three components: domestic water supply, direct diversion, and stormwater runoff (Illinois Department of Natural Resources, 2025). This report focuses on the stormwater runoff component of the LMDA program.
The USACE simulates stormwater runoff with the Hydrological Simulation Program–FORTRAN (HSPF) models covering the ungaged portion of the diverted Lake Michigan drainage basin. The HSPF software uses an array of empirical equations to continuously compute the flux and storage of stormwater. By adjusting key parameters used in these empirical equations to match the measured streamflow of a real drainage basin, an HSPF model can be calibrated to simulate outflows and other input scenarios. Precipitation time series are required as inputs for the simulations. Detailed descriptions of the background, authorities, and accounting procedures of the LMDA program are presented through annual accounting reports, technical reports, and other related studies and publications (U.S. Army Corps of Engineers, 2025).
Comparison of Networks
The Illinois State Water Survey (ISWS) operated a 25-site precipitation network in Cook County, Illinois, from 1989 to 2019 in cooperation with the USACE (Bauer, 2019). The network collects data across the Lake Michigan, Calumet-Sag Channel, and Des Plaines River drainage basins to provide precipitation measurements for HSPF modeling and diversion accounting. The USACE requested the U.S. Geological Survey (USGS) install new equipment and begin operation of the Cook County Precipitation Network, following a recommendation from the Eighth Technical Committee Review of 2018 (Espey and others, 2019). The purpose of this report is to describe the methods and results of the comparison of these two precipitation networks. The comparison includes data from the ISWS Cook County Rain Gage Network from 1989 to 2019 and the USGS Cook County Precipitation Network from 2019 to 2023.
Newer precipitation devices using digital mass (weight) through pressure load cell technology were selected to replace Belfort conventional weighing-bucket methods that use mechanical linkages and digital chart recording. The replacement USGS gage locations were to be as feasibly close as possible to the ISWS network gages. The final ISWS gage locations and the new USGS locations are shown in figure 1. Some sites were moved because of less-than-ideal measurement conditions, and others were moved owing to unobtainable land-owner permission. All but two USGS gages were established within a 1-kilometer radius of the final ISWS gage coordinates. The gage locations for Chicago Heights and Lemont, Ill., were collocated with USGS streamgages and were just outside of the 1-kilometer radius. A list of the final ISWS gage coordinates and the new USGS gage coordinates is provided in table 1. The USACE provided a data set of monthly precipitation totals for each site within the ISWS network for the period of the ISWS record from October 1989 to September 2019 (refer to appendix 1, table 1.1). A detailed description and photographs of each precipitation gage in the Cook County Precipitation Network are provided in appendix 2.
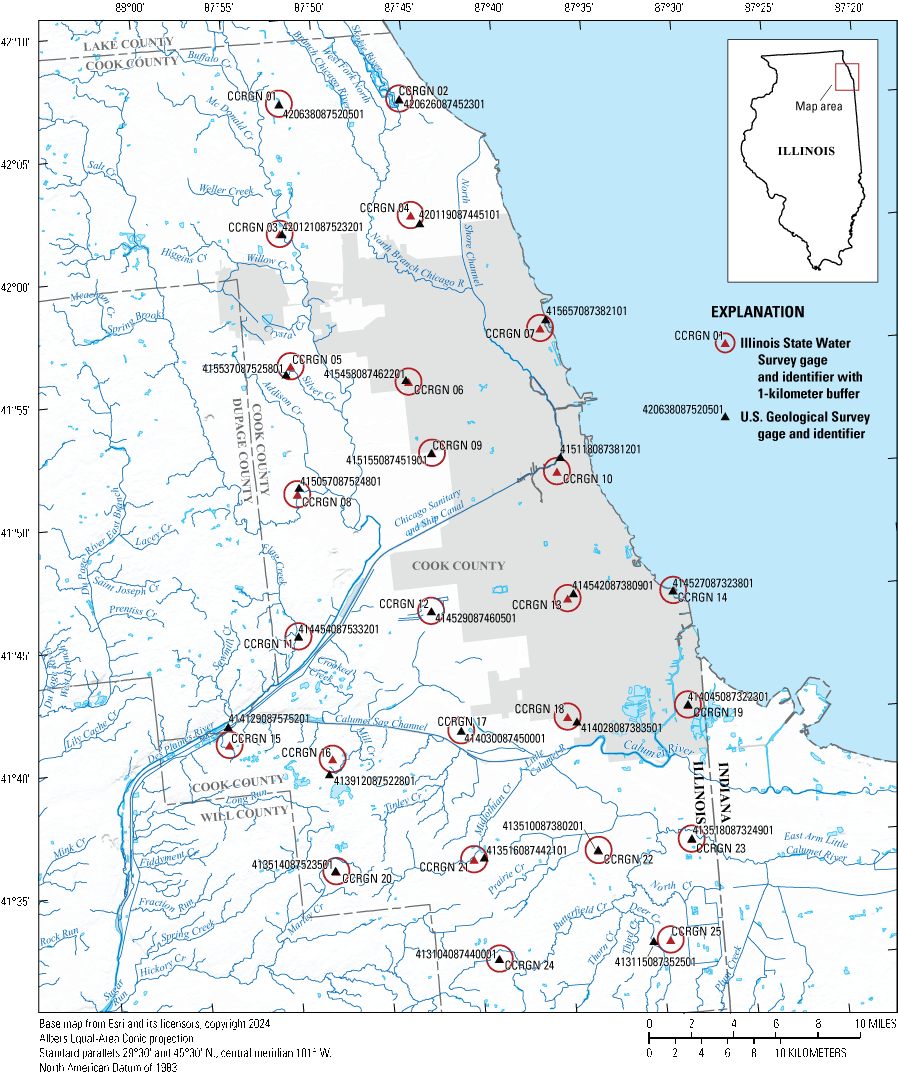
Map of the final locations of the Illinois State Water Survey precipitation gages and the new locations of the U.S. Geological Survey precipitation gages, Cook County, Illinois.
Table 1.
Site coordinates for the Lake Michigan Diversion Accounting program for the final Illinois State Water Survey Cook County Rain Gage Network site locations and the new U.S. Geological Survey Cook County Precipitation Network.[Site coordinates use North American Datum of 1983 horizontal datum. ISWS, Illinois State Water Survey; ID, identifier; USGS, U.S. Geological Survey; N, north; W, west; CCRGN, Cook County Rain Gage Network; CSSC, Chicago Sanitary and Ship Canal]
Network Equipment
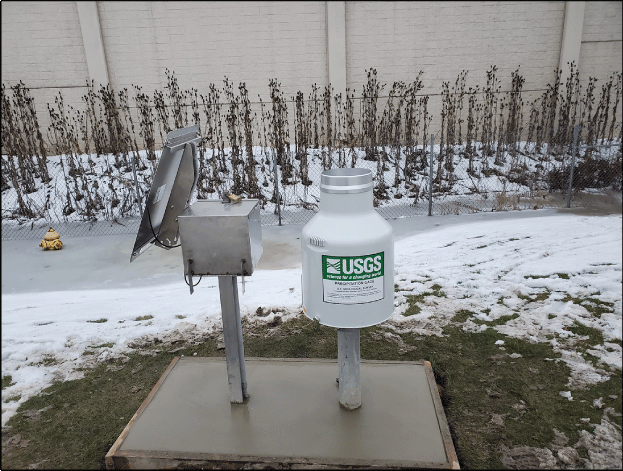
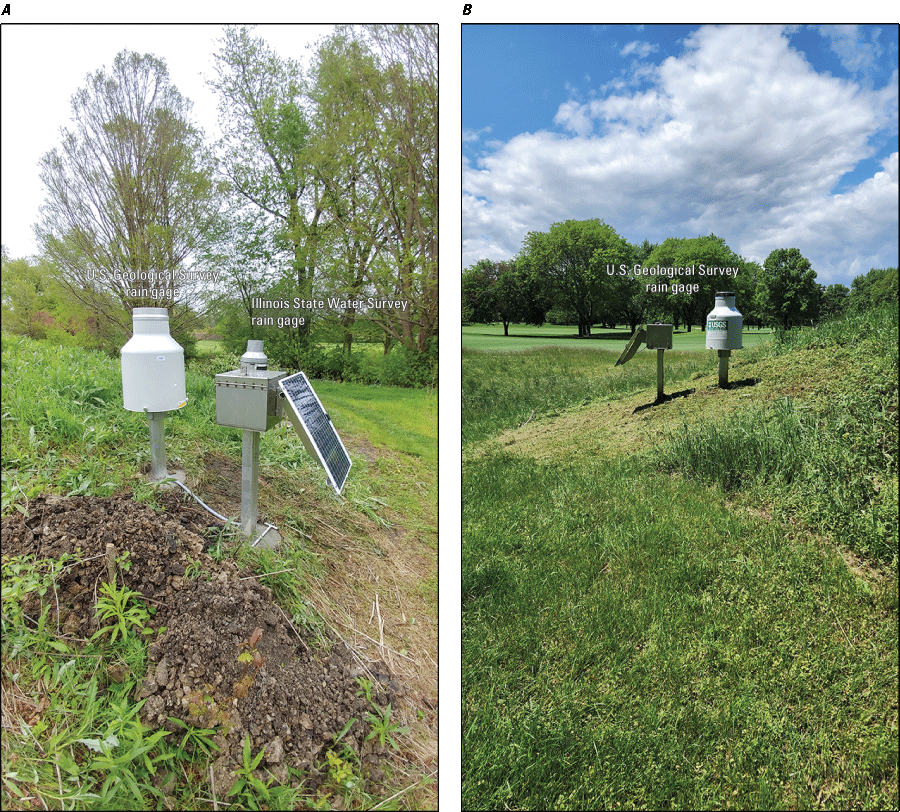
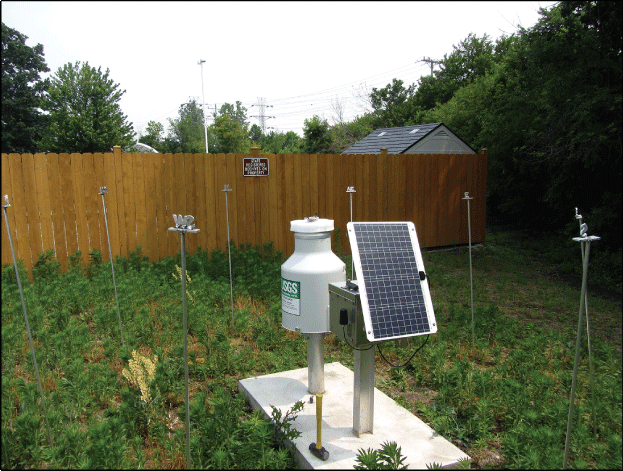
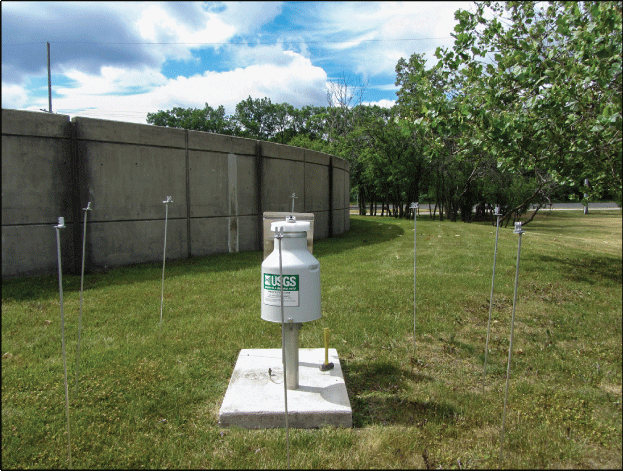
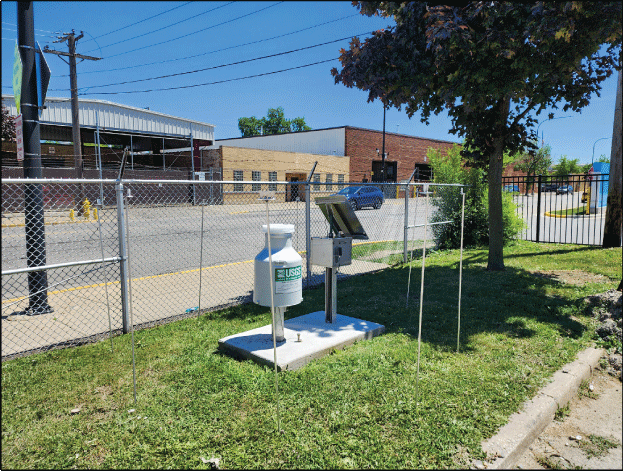
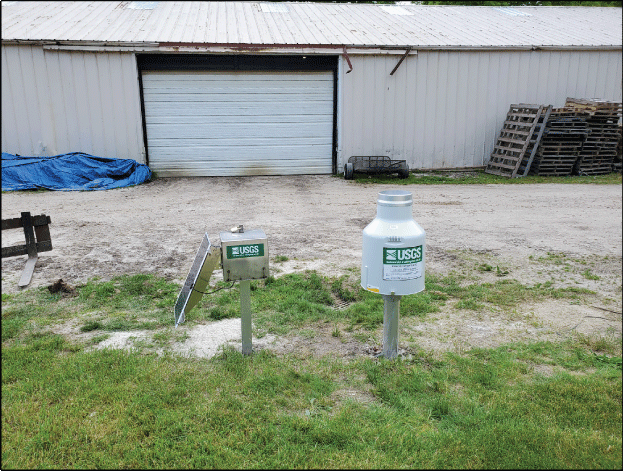
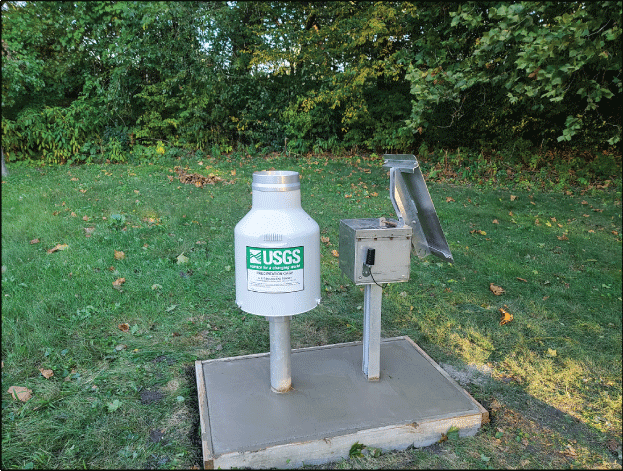
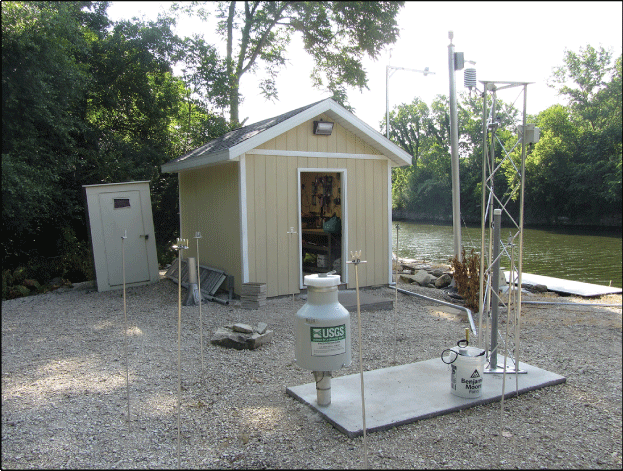
The ISWS maintained a consistent gage setup for all 25 of the Cook County Rain Gage Network gages, consisting of a Belfort Universal Precipitation Gage 5–780, a Campbell Scientific, Inc. CR500 datalogger, a Sierra Wireless Raven cellular modem, a 12-volt battery, and a 10-watt solar panel. The datalogger, modem, and battery were all kept in a small unsecured compartment below the mechanical linkages of the precipitation gage. The precipitation gage was mounted to three posts driven into the ground and periodically leveled. The USGS has maintained the consistent instrumentation within the new network. Each of the USGS gages is equipped with a Campbell Scientific, Inc. CR310/CELL210 datalogger and cellular modem combination unit, an OTT Pluvio2 L weighing bucket type precipitation gage, a 12-volt battery, a 30-watt solar panel, and a voltage regulator. The battery, solar panel, voltage regulator, datalogger, and modem are in a separate secure stainless-steel enclosure adjacent to the precipitation gage. The precipitation gage and the equipment enclosure are mounted to aluminum posts set into the ground with concrete to maintain stable and level operation. A representative example of the ISWS and typical USGS installation setups within the network is shown in figure 2. The USGS precipitation gages are cleaned, calibrated, and serviced at each visit approximately six times per water year (a water year is a continuous 12-month period, from October 1 through September 30, and is designated by the year in which it ends). Servicing includes emptying and cleaning the bucket and wiping off dust and debris from all surfaces inside and outside of the unit. Gages are calibrated with two certified weights and verified using the OTT HydroMet precipitation computer software program. After cleaning and calibration, the weight counter is reset to zero, and the bucket weight is measured. Any deviations outside of a 3-percent error require correction to the data according to the OTT HydroMet manufacturer’s recommendations. Calibrations during initial setup in water year 2019 and through water year 2023 have not had an instrument outside of the 3-percent calibration range.
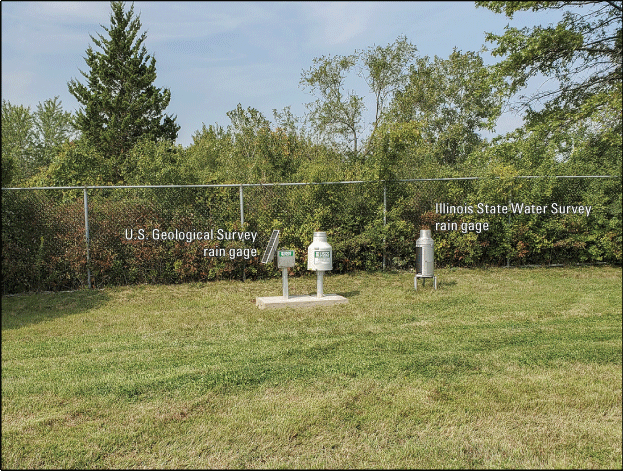
Photograph of the Illinois State Water Survey and U.S. Geological Survey precipitation gage installations at Rain Gage at Orland Park, Illinois (413514087523501). (Photograph by Kevin K. Johnson, U.S. Geological Survey).
Methodology
The network migration began in spring 2019, and the overlapping period of record for each site is dependent on when the USGS gage was installed. The first network gage for the USGS began collecting data on May 20, 2019, and by September 30, 2019, 17 of the 25 network gages were installed and operating (U.S. Geological Survey, 2023). The remaining 8 gages were installed and operated by October 2020. This completed the network migration from ISWS operation to USGS operation, but no overlapping data exists for the last 8 gages. Double mass curves (DMCs) were used to analyze for consistency between the two networks owing to the short timeframe for overlapping comparison data collection. In the DMC method, the cumulative data of one variable versus the cumulative data of a related variable plots as a straight line if the relation between the variables is a fixed ratio (Searcy and Hardison, 1960; Helsel and others, 2020). The ISWS data were used to calculate the cumulative average of the first 17 of the 25 USGS sites established, this cumulative average was used as the fixed variable for individual gage comparisons. These 17 sites were the only USGS sites operating during the overlap period from May 2019 to September 2019. Any breaks in the regression slope of the DMC or changes in the ratio were caused by changes in the collection methods or physical changes such as location or equipment. The changes from ISWS monitoring to USGS monitoring included changes in the collection methods, the location where the data were collected, the equipment collecting the data, and the time-series interval of data collection.
Published monthly precipitation data from the ISWS for all 25 Cook County Rain Gage Network stations for the period of record 1989 to 2019 are shown in appendix 1, table 1.1 (Bauer, 2018, 2019; Bauer and Westcott, 2017; Peppier, 1991a, 1991b, 1993, 1994, 1995; Westcott, 1996, 1997, 1998, 1999, 2000, 2001, 2002, 2003, 2004, 2005, 2006, 2007a, 2007b, 2009, 2010, 2011, 2012, 2013, 2014, 2015, 2016). In appendix 1, table 1.1, precipitation data from October 2019 to September 2023 were retrieved from the USGS National Water Information System (U.S. Geological Survey, 2023) and were included in table 1.1. The ISWS data collection and analysis efforts ended in September 2019. A DMC plot was created for each of the 25 sites that are included in the Cook County Precipitation Network. The DMC plots for each site are shown in figure 3. The x-axis of each plot used the cumulative average precipitation of the 17 ISWS precipitation gages that correspond to the 17 USGS precipitation gages that were operational at the end of the 2019 water year. The y-axis of each plot used the cumulative precipitation for the individual site. The objective for each site was to determine if a break in the slope or a change in the ratio occurred during the transition from ISWS to USGS operation. The break in the slope or change in the ratio would indicate a change has occurred at the site. For each of the sites, a linear regression was applied to obtain the slope of the DMC. The intercept of each regression was set to zero, because there was zero precipitation at the beginning of the record. The regression slope of each site was determined for the ISWS period and the USGS period; the slopes of the sites compared well to each other with an average slope ratio of 1.005. This difference in slope for the two periods is a good indicator of compatible records. The ratio of the individual site to the cumulative average was calculated for the 17 sites with the ISWS data from October 1989 to September 2019. Next, the ratio of the individual site to the cumulative average was calculated for the remaining 8 sites with the USGS data from the first complete month of operating data following installation through September 2023 (U.S. Geological Survey, 2023).
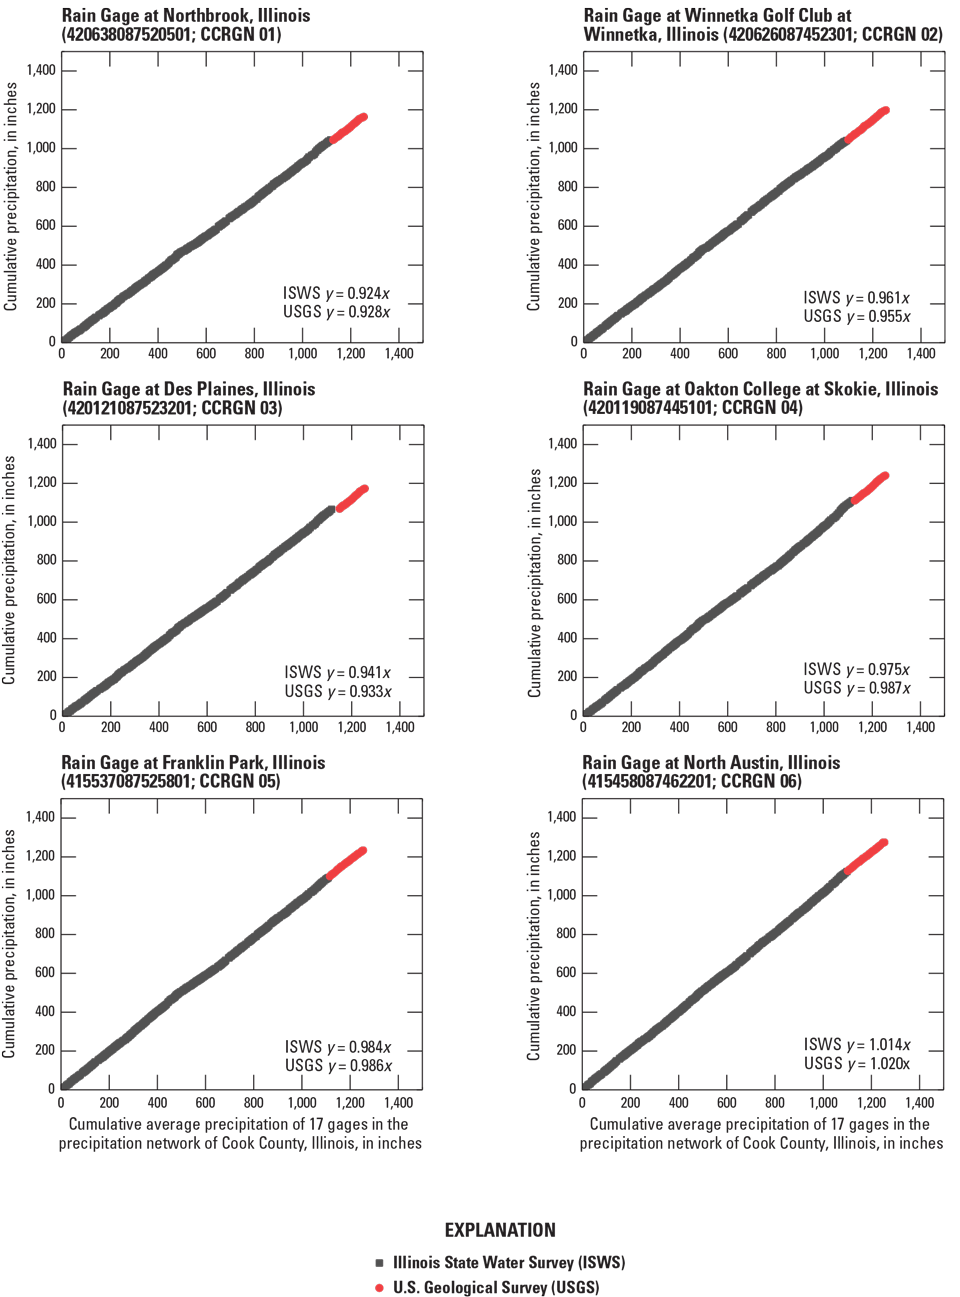
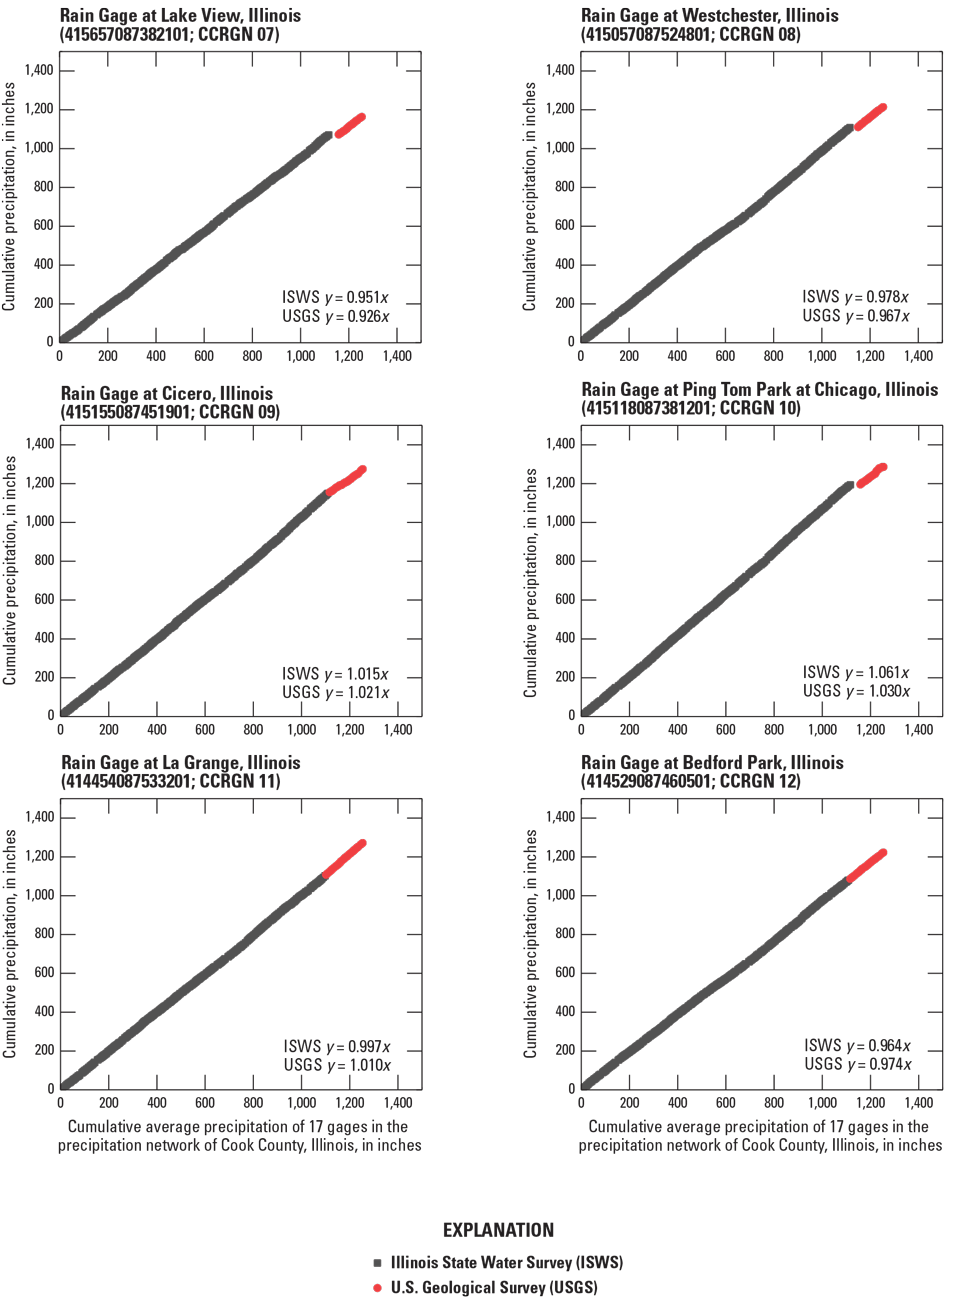
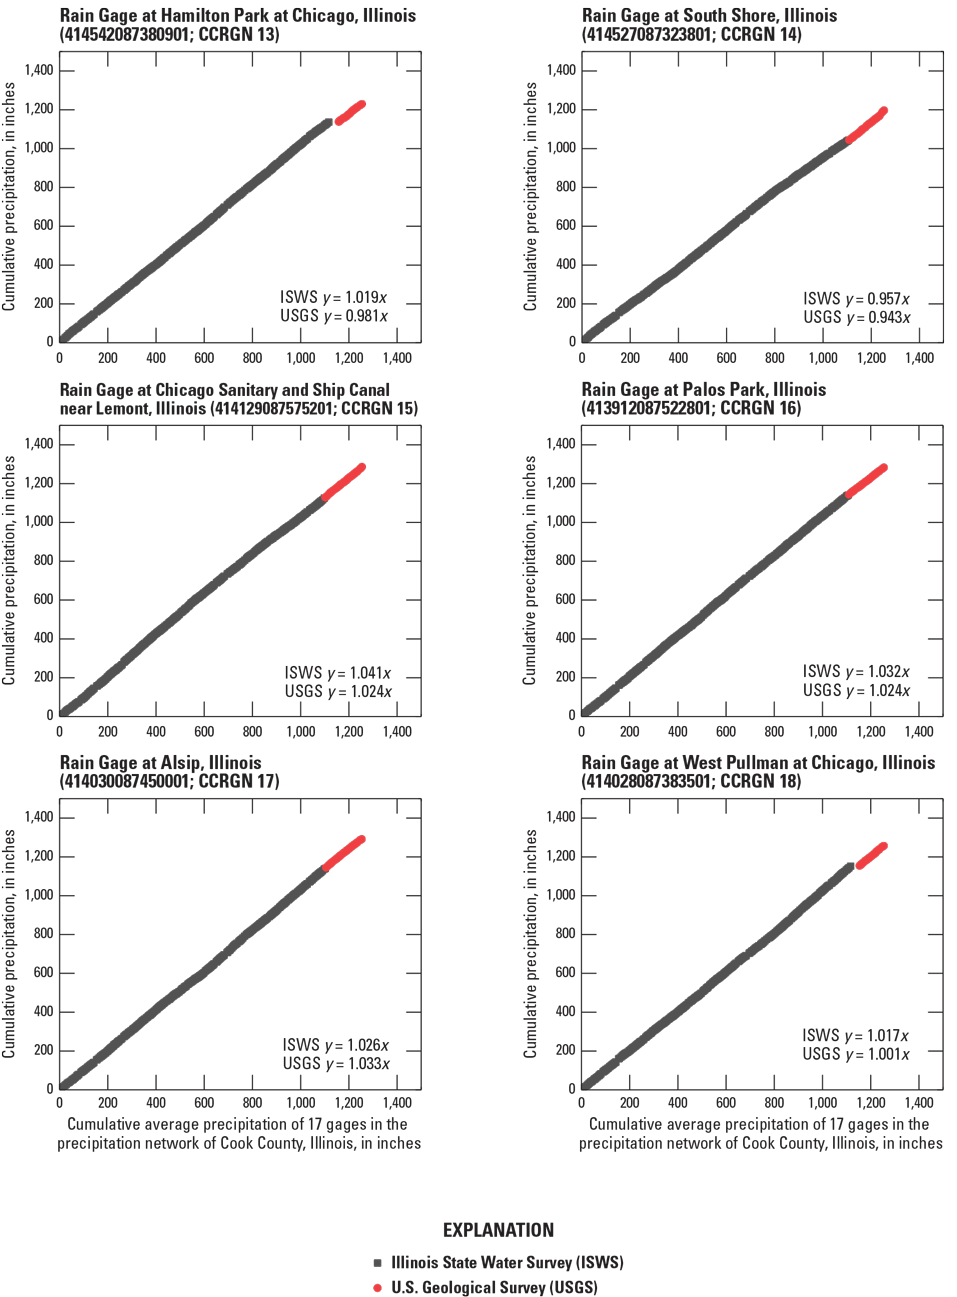
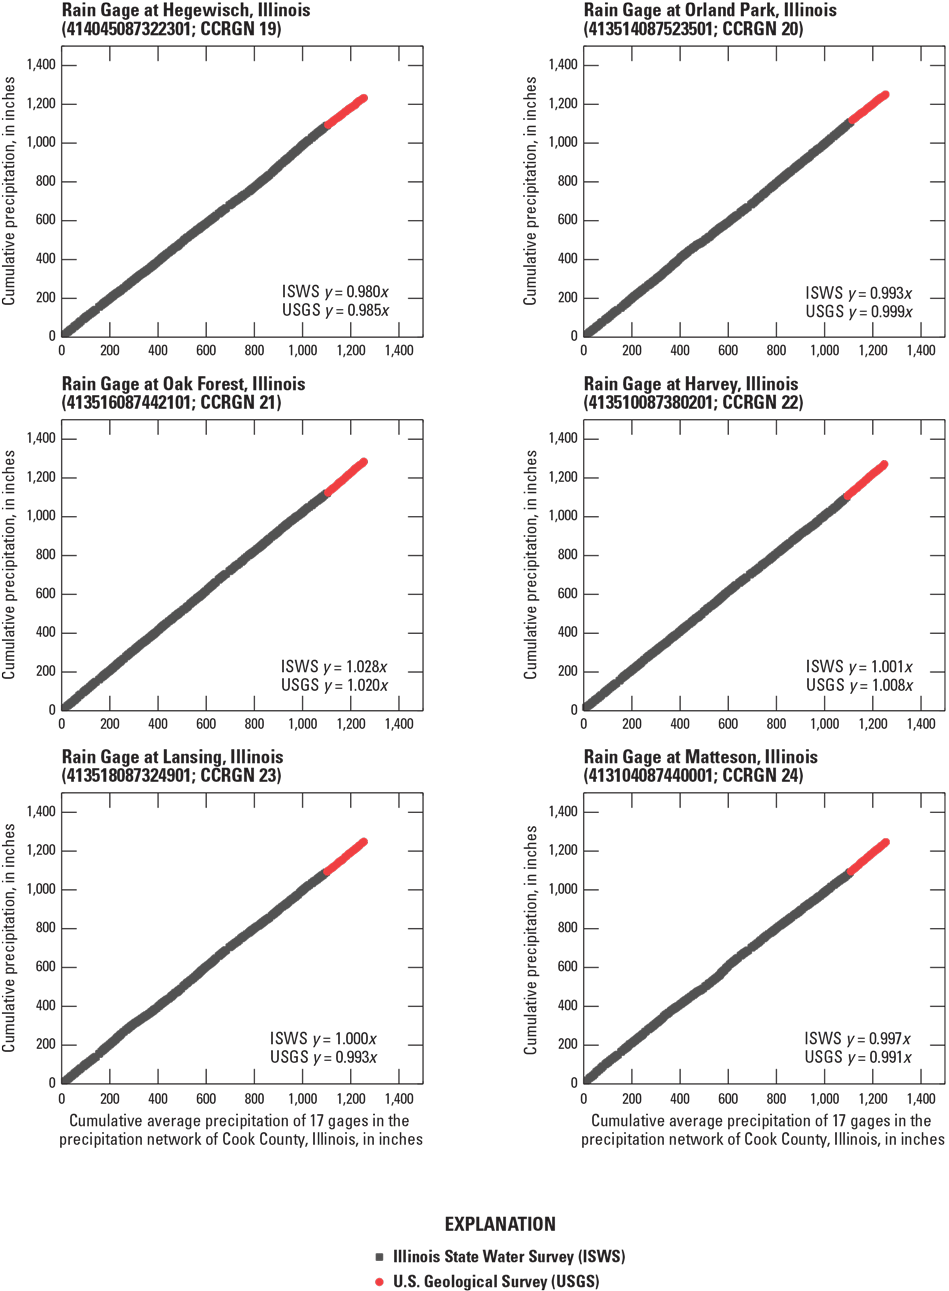
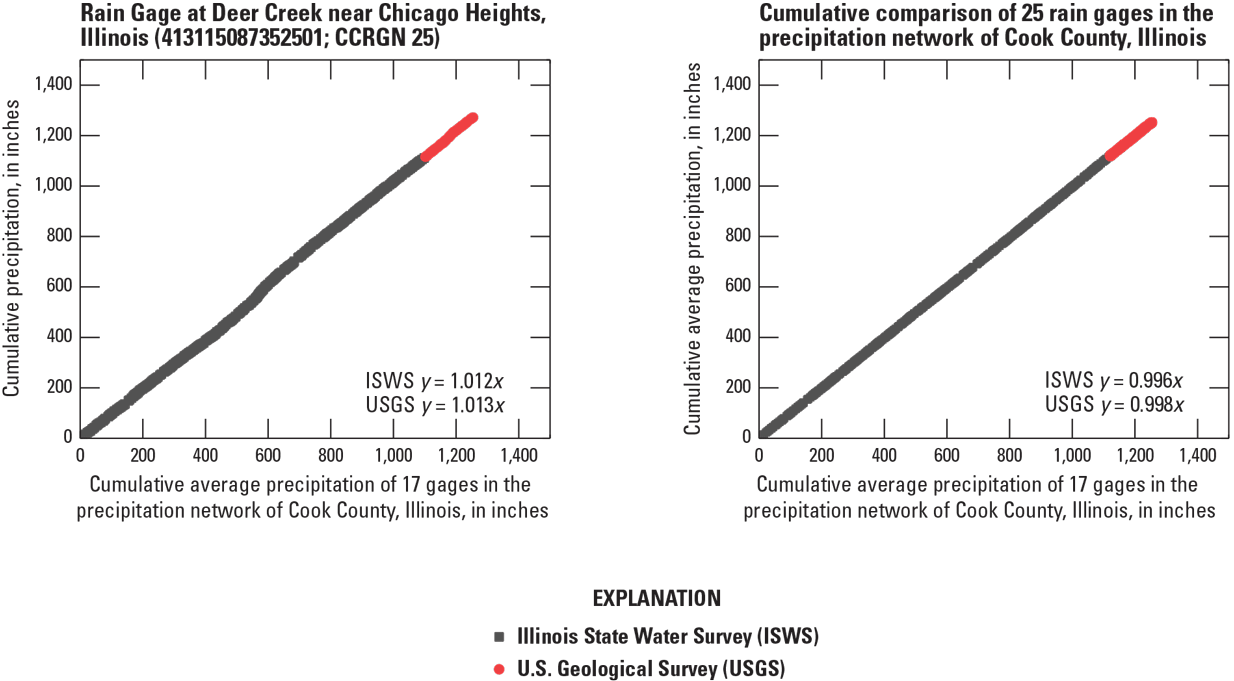
Double mass curve plots of the Illinois State Water Survey and U.S. Geological Survey precipitation networks showing the cumulative average of the network versus the cumulative site precipitation for Cook County, Illinois, from 1989 to 2023.
Table 2.
Site regression slopes from double mass curve calculations for the Illinois State Water Survey and the U.S. Geological Survey precipitation networks.[ISWS, Illinois State Water Survey; ID, identifier; USGS, U.S. Geological Survey; CCRGN, Cook County Rain Gage Network; CSSC, Chicago Sanitary and Ship Canal; NA, not applicable]
Discussion
The eight sites that were not installed during the 2019 water year required a greater effort to obtain landowner permission to install the gage at the site. The ISWS removed all their gaging equipment in October 2019. The Rain Gage at Northbrook, Ill. (USGS station 420638087520501) and the Rain Gage at Oakton College at Skokie, Ill. (420119087445101) were installed in January 2020, leaving a 4-month gap in the precipitation record. In March 2020, the 2019 coronavirus global pandemic delayed the progress on remaining site approvals. The Rain Gage at Des Plaines, Ill. (420121087523201) and the Rain Gage at Westchester, Ill. (415057087524801) were approved and installed in June 2020, resulting in a 9-month gap in the precipitation record. The Rain Gage at West Pullman at Chicago, Ill. (414028087383501) was installed next in August 2020, resulting in an 11-month gap in the precipitation data. By October 2020, the final three sites, Rain Gage at Lake View, Ill. (415657087382101); Rain Gage at Ping Tom Park at Chicago, Ill. (415118087381201); and Rain Gage at Hamilton Park at Chicago, Ill. (414542087380901), were installed after obtaining appropriate permissions. These final sites have the longest precipitation data gap of all USGS replacement gages of 13 months. Evaluation of the DMC plots for these eight sites shows gaps in the lines or break points as abrupt changes in the slope of the lines (fig. 3). Those breakpoints are the result of a lapse in data because of the time required to relocate the precipitation gages starting in October 2019.
Further analysis of the DMCs for these sites (fig. 3) shows that even with the breakpoint in the regression, the slope did not substantially change with the transition from ISWS to USGS operation and maintenance. The difference of less than 4 percent in the DMC regression slopes between the ISWS and USGS precipitation sites shows the two networks are comparable within the reporting accuracy and spatial variability (table 2). The ratios of the cumulative sum of the average precipitation of the 17 initial sites to the cumulative sum of the 25 individual ISWS sites are shown in table 2 within the column labelled “ISWS 1989–2019.” The ratios of the cumulative sum of the average precipitation of the 17 initial sites to the cumulative sum of the individual USGS sites from the time of installation are shown in the column labelled “USGS 2019–23.” The eight sites installed after October 2019 were adjusted with the cumulative average of the 17 sites starting from the value at the end of September 2019. The final column is the ISWS to USGS ratio. This column has three outliers from the other ratios. If the ratio value was greater than plus or minus 0.080, then the change between the networks was significant and needs further consideration. For example, the Rain Gage at Cicero, Ill. (415155087451901) had the largest ratio at 1.194, indicating a difference in the gages. The site is within the Village of Cicero Water Works facility, adjacent to a large, tall water tower (refer to fig. 1 [CCRGN 09] for the location). One possibility for the observed differences is that this structure may cause a rain shadow effect at the gage if the storm comes from the northeast direction. The ISWS gage was at the south end of this same property, further away from the tower, possibly reducing the rain shadow effect. The ninth Technical Review Committee for LMDA recommended installing an additional gage at this site near where the ISWS gage had formerly been located. Following the recommendation, an additional rain gage was installed in March 2024. Concurrent operation of the two precipitation gages is planned for the 2025 and 2026 water years. The analysis of those comparison data is planned for a future date. The second site of interest is the Rain Gage at Ping Tom Park at Chicago, Ill. (415118087381201), where the ratio was 1.136. The ISWS site was in a residential backyard near Chinatown and may have been too close to surrounding buildings, causing a similar rain shadow effect. The USGS gage is in the south corner of Ping Tom Memorial Park and is in an open space where the height of the surrounding objects assures proper exposure to the gage. Despite differences between the two network regressions, no changes are planned for this location. The third location of interest is the Rain Gage at South Shore, Ill. (414527087323801), which had a ratio of 0.886. This site is in a large open grassy area within the Sawyer Water Treatment Facility of Chicago. The former ISWS gage was 15 feet to the north of the USGS location. The primary difference between the two installations is that the ISWS had an Alter-type rain gage wind screen and the USGS gage did not. The South Shore site was the only ISWS rain gage that used a wind screen. The wind screen can minimize the effect of strong winds on the rain measurements and could improve the accuracy of the precipitation data collected at this site. A wind screen could be added to the site in the future if DMC analysis continues to trend away from the ISWS slope.
Overall, the data collected by precipitation gages of the Cook County Precipitation Network compare well to the former network operated by ISWS. The new precipitation gages will continue to provide continuity of record for the Lake Michigan Diversion Accounting program of the U.S. Army Corps of Engineers. The three sites that had cumulative data ratios with a difference of greater than plus or minus 0.080 (8 percent) were further scrutinized, and changes to those sites, as needed, have been made or are planned.
Summary
The Illinois State Water Survey operated the 25-site Cook County Rain Gage Network from 1989 through the 2019 water year. During water year 2019, the U.S. Geological Survey (USGS) began installing and operating the Cook County Precipitation Network, utilizing newer precipitation devices that use digital mass (weight) through pressure load cell technology to replace Belfort conventional weighing-bucket methods that used mechanical linkages and digital chart recording. At the end of water year 2019, the USGS had installed 17 of 25 sites in the Cook County Precipitation Network. Because the overlapping period of data for comparison of differences was short, the double mass curve method was used to evaluate the network gages. All 25 of the network gages were analyzed using the cumulative monthly Illinois State Water Survey data from 1989 to 2019 and the USGS cumulative monthly data from the time of installation through September 2023. The differences in measured precipitation may be attributable to many factors, either in combination or alone, such as the equipment, maintenance and calibration, location of objects near the gage, or other unknown reasons.
From the double mass curve analysis, three sites had cumulative data ratios with a difference of greater than plus or minus 0.080 (8 percent). The three sites from greatest to smallest were Rain Gage at Cicero, Illinois (USGS station 415155087451901); Rain Gage at Ping Tom Park at Chicago, Ill. (415118087381201); and Rain Gage at South Shore, Ill. (414527087323801). A remedy for the Rain Gage at Cicero, Ill., is in progress with the installation of a second gage on site, out of the rain shadow effect of the Cicero water tower. The Rain Gage at Ping Tom Park at Chicago, Ill., is remaining in its current location with the assumption that it is in a better location than the previous network. The Rain Gage at South Shore, Ill., may be enhanced with the installation of a wind screen to reduce the effects of strong winds on the catch of the precipitation. The remaining 22 precipitation gages of the Cook County Precipitation Network compare well to the former network data and will continue to provide continuity of record for the Lake Michigan Diversion Accounting program of the U.S. Army Corps of Engineers.
References Cited
Bauer, E., 2018, Continued operation of a 25-raingage network for collection, reduction, and analysis of precipitation data for Lake Michigan diversion accounting—Water year 2017: Illinois State Water Survey Contract Report 2018–03, 91 p. [Also available at https://www.ideals.illinois.edu/items/108004.]
Bauer, E., 2019, Continued operation of a 25-raingage network for collection, reduction, and analysis of precipitation data for Lake Michigan diversion accounting—Water year 2018: Illinois State Water Survey Contract Report 2019–08, 95 p. [Also available at https://www.ideals.illinois.edu/items/111311.]
Bauer, E., and Westcott, N.E., 2017, Continued operation of a 25-raingage network for collection, reduction, and analysis of precipitation data for Lake Michigan diversion accounting—Water year 2016: Illinois State Water Survey Contract Report 2017–03, 82 p. [Also available at https://www.ideals.illinois.edu/items/104005.]
Espey, W.H., Jr., Melching, C.S., and Muste, M., 2019, Lake Michigan Diversion Committee—Findings of the Eighth Technical Committee for Review of Diversion Flow Measurements and Accounting Procedures: Report prepared for the U.S. Army Corps of Engineers, Chicago District, 175 p. [Also available at https://usace.contentdm.oclc.org/digital/collection/p266001coll1/id/10981/rec/33.]
Helsel, D.R., Hirsch, R.M., Ryberg, K.R., Archfield, S.A., and Gilroy, E.J., 2020, Statistical methods in water resources: U.S. Geological Survey Techniques and Methods, book 4, chap. A3, 458 p., accessed June 2025 at https://doi.org/10.3133/tm4A3.
Illinois Department of Natural Resources, 2025, Lake Michigan water allocation: Illinois Department of Natural Resources, Office of Water Resources webpage, accessed May 29, 2023, at https://dnr.illinois.gov/waterresources/lakemichiganwaterallocation.html.
Peppier, Randy A., 1991a, Installation and operation of a dense raingage network to improve precipitation measurements for Lake Michigan diversion accounting—Water year 1990: Illinois State Water Survey Contract Report 517, 87 p. [Also available at https://www.isws.illinois.edu/pubdoc/CR/ISWSCR-517.pdf.]
Peppier, R.A., 1991b, Continued operation of a raingage network for collection, reduction, and analysis of precipitation data for Lake Michigan diversion accounting—Water year 1991: Illinois State Water Survey Contract Report 520, 65 p. [Also available at https://www.ideals.illinois.edu/items/77123.]
Peppier, R.A., 1993, Continued operation of a raingage network for collection, reduction, and analysis of precipitation data for Lake Michigan diversion accounting—Water year 1992: Illinois State Water Survey Contract Report 551, 59 p. [Also available at https://www.ideals.illinois.edu/items/77621.]
Peppier, R.A., 1994, Continued operation of a raingage network for collection, reduction, and analysis of precipitation data for Lake Michigan diversion accounting—Water year 1993: Illinois State Water Survey Contract Report 573, 60 p. [Also available at https://www.ideals.illinois.edu/items/96666.]
Peppier, R.A., 1995, Continued operation of a raingage network for collection, reduction, and analysis of precipitation data for Lake Michigan diversion accounting—Water year 1994: Illinois State Water Survey Contract Report 585, 48 p. [Also available at https://www.ideals.illinois.edu/items/96677.]
Searcy, James K., and Hardison, Clayton H., 1960, Double-mass curves: U.S. Geological Survey Water-Supply Paper 1541–B, 66 p. [Also available at https://doi.org/10.3133/wsp1541B.]
U.S. Army Corps of Engineers, 2025, Lake Michigan Diversion Accounting Program: U.S. Army Corps of Engineers Digital Library, accessed May 27, 2025, at https://usace.contentdm.oclc.org/digital/search/searchterm/united%20states.%20army.%20corps%20of%20engineers.%20chicago%20district!water%20diversion!L ake%20Michigan%20Diversion%20Accounting/field/creato!subjec!all/mode/exact!exact!all/conn/and!and!and.
U.S. Geological Survey, 2023, USGS water data for the Nation: U.S. Geological Survey National Water Information System database, accessed April 28, 2023, at https://doi.org/10.5066/F7P55KJN.
Westcott, N.E., 1996, Continued operation of a raingage network for collection, reduction, and analysis of precipitation data for Lake Michigan diversion accounting—Water year 1995. Illinois State Water Survey Contract Report 601, 48 p. [Also available at https://www.ideals.illinois.edu/items/96693.]
Westcott, N.E., 1997, Continued operation of a raingage network for collection, reduction, and analysis of precipitation data for Lake Michigan diversion accounting—Water year 1996: Illinois State Water Survey Contract Report 618, 50 p. [Also available at https://www.ideals.illinois.edu/items/96711.]
Westcott, N.E., 1998, Continued operation of a raingage network for collection, reduction, and analysis of precipitation data for Lake Michigan diversion accounting—Water year 1997: Illinois State Water Survey Contract Report 628, 51 p. [Also available at https://www.ideals.illinois.edu/items/96722.]
Westcott, N.E., 1999, Continued operation of a raingage network for collection, reduction, and analysis of precipitation data for Lake Michigan diversion accounting—Water year 1998: Illinois State Water Survey Contract Report 647, 52 p. [Also available at https://www.ideals.illinois.edu/items/96741.]
Westcott, N.E., 2000, Continued operation of a raingage network for collection, reduction, and analysis of precipitation data for Lake Michigan diversion accounting—Water year 1999: Illinois State Water Survey Contract Report 2000–07, 30 p. [Also available at https://www.ideals.illinois.edu/items/96756.]
Westcott, N.E., 2001, Continued operation of a raingage network for collection, reduction, and analysis of precipitation data for Lake Michigan diversion accounting—Water year 2000: Illinois State Water Survey Contract Report 2001–02, 30 p. [Also available at https://www.ideals.illinois.edu/items/96604.]
Westcott, N.E., 2002, Operation, maintenance, and upgrade of a 25-raingage network for collection, reduction, and analysis of precipitation data for Lake Michigan diversion accounting—Water year 2001: Illinois State Water Survey Contract Report 2002–03, 34 p. [Also available at https://www.ideals.illinois.edu/items/96623.]
Westcott, N.E., 2003, Continued operation of a 25-raingage network for collection, reduction, and analysis of precipitation data for Lake Michigan diversion accounting—Water year 2002: Illinois State Water Survey Contract Report 2003–01, 35 p. [Also available at https://www.ideals.illinois.edu/items/96631.]
Westcott, N.E., 2004, Continued operation of a 25-raingage network for collection, reduction, and analysis of precipitation data for Lake Michigan diversion accounting—Water year 2003: Illinois State Water Survey Contract Report 2004–03, 60 p. [Also available at https://www.ideals.illinois.edu/items/96642.]
Westcott, N.E., 2005, Continued operation of a 25-raingage network for collection, reduction, and analysis of precipitation data for Lake Michigan diversion accounting—Water year 2004: Illinois State Water Survey Contract Report 2005–01, 62 p. [Also available at https://www.ideals.illinois.edu/items/96652.]
Westcott, N.E., 2006, Continued operation of a 25-raingage network for collection, reduction, and analysis of precipitation data for Lake Michigan diversion accounting—Water year 2005: Illinois State Water Survey Contract Report 2006–02, 67 p. [Also available at https://www.ideals.illinois.edu/items/8863.]
Westcott, N.E., 2007a, Continued operation of a 25-raingage network for collection, reduction, and analysis of precipitation data for Lake Michigan diversion accounting—Water year 2006: Illinois State Water Survey Contract Report 2007–01, 65 p. [Also available at https://www.ideals.illinois.edu/items/96658.]
Westcott, N.E., 2007b, Continued operation of a 25-raingage network for collection, reduction, and analysis of precipitation data for Lake Michigan diversion accounting—Water year 2007: Illinois State Water Survey Contract Report 2007–09, 67 p. [Also available at https://www.ideals.illinois.edu/items/8845.]
Westcott, N.E., 2009, Continued operation of a 25-raingage network for collection, reduction, and analysis of precipitation data for Lake Michigan diversion accounting—Water year 2008: Illinois State Water Survey Contract Report 2009–04, 69 p. [Also available at https://www.ideals.illinois.edu/items/13461.]
Westcott, N.E., 2010, Continued operation of a 25-raingage network for collection, reduction, and analysis of precipitation data for Lake Michigan diversion accounting—Water year 2009: Illinois State Water Survey Contract Report 2010–03, 68 p. [Also available at https://www.ideals.illinois.edu/items/15146.]
Westcott, N.E., 2011, Upgrade and continued operation of a 25-raingage network for collection, reduction, and analysis of precipitation data for Lake Michigan diversion accounting—Water year 2010: Illinois State Water Survey Contract Report 2011–05, 74 p. [Also available at https://www.ideals.illinois.edu/items/39780.]
Westcott, N.E., 2012, Continued operation of a 25-raingage network for collection, reduction, and analysis of precipitation data for Lake Michigan diversion accounting—Water year 2011: Illinois State Water Survey Contract Report 2012–02, 76 p. [Also available at https://www.ideals.illinois.edu/items/40007.]
Westcott, N.E., 2013, Continued operation of a 25-raingage network for collection, reduction, and analysis of precipitation data for Lake Michigan diversion accounting—Water year 2012: Illinois State Water Survey Contract Report 2013–01, 76 p. [Also available at https://www.ideals.illinois.edu/items/42622.]
Westcott, N.E., 2014, Continued operation of a 25-raingage network for collection, reduction, and analysis of precipitation data for Lake Michigan diversion accounting—Water year 2013: Illinois State Water Survey Contract Report 2014–01, 80 p. [Also available at https://www.ideals.illinois.edu/items/50132.]
Westcott, N.E., 2015, Continued operation of a 25-raingage network for collection, reduction, and analysis of precipitation data for Lake Michigan diversion accounting—Water year 2014: Illinois State Water Survey Contract Report 2015–01, 82 p. [Also available at https://www.ideals.illinois.edu/items/93361.]
Westcott, N.E., 2016, Continued operation of a 25-raingage network for collection, reduction, and analysis of precipitation data for Lake Michigan diversion accounting—Water year 2015: Illinois State Water Survey Contract Report 2016–01, 82 p. [Also available at https://www.ideals.illinois.edu/items/93363.]
Appendix 1. U.S. Army Corps of Engineers Supplied Monthly Data
References Cited
Bauer, E., 2018, Continued operation of a 25-raingage network for collection, reduction, and analysis of precipitation data for Lake Michigan diversion accounting—Water year 2017: Illinois State Water Survey Contract Report 2018–03, 91 p. [Also available at https://www.ideals.illinois.edu/items/108004.]
Bauer, E., 2019, operation of a 25-raingage network for collection, reduction, and analysis of precipitation data for Lake Michigan diversion accounting—Water year 2018: Illinois State Water Survey Contract Report 2019–08, 95 p. [Also available at https://www.ideals.illinois.edu/items/111311.]
Bauer, E., and Westcott, N.E., 2017, Continued operation of a 25-raingage network for collection, reduction, and analysis of precipitation data for Lake Michigan diversion accounting—Water year 2016: Illinois State Water Survey Contract Report 2017–03, 82 p. [Also available at https://www.ideals.illinois.edu/items/104005.]
Peppier, Randy A., 1991a, Installation and operation of a dense raingage network to improve precipitation measurements for Lake Michigan diversion accounting—Water year 1990: Illinois State Water Survey Contract Report 517, 87 p. [Also available at https://www.isws.illinois.edu/pubdoc/CR/ISWSCR-517.pdf.]
Peppier, R.A., 1991b, Continued operation of a raingage network for collection, reduction, and analysis of precipitation data for Lake Michigan diversion accounting—Water year 1991: Illinois State Water Survey Contract Report 520, 65 p. [Also available at https://www.ideals.illinois.edu/items/77123.]
Peppier, R.A., 1993, Continued operation of a raingage network for collection, reduction, and analysis of precipitation data for Lake Michigan diversion accounting—Water year 1992: Illinois State Water Survey Contract Report 551, 59 p. [Also available at https://www.ideals.illinois.edu/items/77621.]
Peppier, R.A., 1994, Continued operation of a raingage network for collection, reduction, and analysis of precipitation data for Lake Michigan diversion accounting—Water year 1993: Illinois State Water Survey Contract Report 573, 60 p. [Also available at https://www.ideals.illinois.edu/items/96666.]
Peppier, R.A., 1995, Continued operation of a raingage network for collection, reduction, and analysis of precipitation data for Lake Michigan diversion accounting—Water year 1994: Illinois State Water Survey Contract Report 585, 48 p. [Also available at https://www.ideals.illinois.edu/items/96677.]
Westcott, N.E., 1996, Continued operation of a raingage network for collection, reduction, and analysis of precipitation data for Lake Michigan diversion accounting—Water year 1995. Illinois State Water Survey Contract Report 601, 48 p. [Also available at https://www.ideals.illinois.edu/items/96693.]
Westcott, N.E., 1997, Continued operation of a raingage network for collection, reduction, and analysis of precipitation data for Lake Michigan diversion accounting—Water year 1996: Illinois State Water Survey Contract Report 618, 50 p. [Also available at https://www.ideals.illinois.edu/items/96711.]
Westcott, N.E., 1998, Continued operation of a raingage network for collection, reduction, and analysis of precipitation data for Lake Michigan diversion accounting—Water year 1997: Illinois State Water Survey Contract Report 628, 51 p. [Also available at https://www.ideals.illinois.edu/items/96722.]
Westcott, N.E., 1999, Continued operation of a raingage network for collection, reduction, and analysis of precipitation data for Lake Michigan diversion accounting—Water year 1998: Illinois State Water Survey Contract Report 647, 52 p. [Also available at https://www.ideals.illinois.edu/items/96741.]
Westcott, N.E., 2000, Continued operation of a raingage network for collection, reduction, and analysis of precipitation data for Lake Michigan diversion accounting—Water year 1999: Illinois State Water Survey Contract Report 2000–07, 30 p. [Also available at https://www.ideals.illinois.edu/items/96756.]
Westcott, N.E., 2001, Continued operation of a raingage network for collection, reduction, and analysis of precipitation data for Lake Michigan diversion accounting—Water year 2000: Illinois State Water Survey Contract Report 2001–02, 30 p. [Also available at https://www.ideals.illinois.edu/items/96604.]
Westcott, N.E., 2002, Operation, maintenance, and upgrade of a 25-raingage network for collection, reduction, and analysis of precipitation data for Lake Michigan diversion accounting—Water year 2001: Illinois State Water Survey Contract Report 2002–03, 34 p. [Also available at https://www.ideals.illinois.edu/items/96623.]
Westcott, N.E., 2003, Continued operation of a 25-raingage network for collection, reduction, and analysis of precipitation data for Lake Michigan diversion accounting—Water year 2002: Illinois State Water Survey Contract Report 2003–01, 35 p. [Also available at https://www.ideals.illinois.edu/items/96631.]
Westcott, N.E., 2004, Continued operation of a 25-raingage network for collection, reduction, and analysis of precipitation data for Lake Michigan diversion accounting—Water year 2003: Illinois State Water Survey Contract Report 2004–03, 60 p. [Also available at https://www.ideals.illinois.edu/items/96642.]
Westcott, N.E., 2005, Continued operation of a 25-raingage network for collection, reduction, and analysis of precipitation data for Lake Michigan diversion accounting—Water year 2004: Illinois State Water Survey Contract Report 2005–01, 62 p. [Also available at https://www.ideals.illinois.edu/items/96652.]
Westcott, N.E., 2006, Continued operation of a 25-raingage network for collection, reduction, and analysis of precipitation data for Lake Michigan diversion accounting—Water year 2005: Illinois State Water Survey Contract Report 2006–02, 67 p. [Also available at https://www.ideals.illinois.edu/items/8863.]
Westcott, N.E., 2007a, Continued operation of a 25-raingage network for collection, reduction, and analysis of precipitation data for Lake Michigan diversion accounting—Water year 2006: Illinois State Water Survey Contract Report 2007–01, 65 p. [Also available at https://www.ideals.illinois.edu/items/96658.]
Westcott, N.E., 2007b, Continued operation of a 25-raingage network for collection, reduction, and analysis of precipitation data for Lake Michigan diversion accounting—Water year 2007: Illinois State Water Survey Contract Report 2007–09, 67 p. [Also available at https://www.ideals.illinois.edu/items/8845.]
Westcott, N.E., 2009, Continued operation of a 25-raingage network for collection, reduction, and analysis of precipitation data for Lake Michigan diversion accounting—Water year 2008: Illinois State Water Survey Contract Report 2009–04, 69 p. [Also available at https://www.ideals.illinois.edu/items/13461.]
Westcott, N.E., 2010, Continued operation of a 25-raingage network for collection, reduction, and analysis of precipitation data for Lake Michigan diversion accounting—Water year 2009: Illinois State Water Survey Contract Report 2010–03, 68 p. [Also available at https://www.ideals.illinois.edu/items/15146.]
Westcott, N.E., 2011, Upgrade and continued operation of a 25-raingage network for collection, reduction, and analysis of precipitation data for Lake Michigan diversion accounting—Water year 2010: Illinois State Water Survey Contract Report 2011–05, 74 p. [Also available at https://www.ideals.illinois.edu/items/39780.]
Westcott, N.E., 2012, Continued operation of a 25-raingage network for collection, reduction, and analysis of precipitation data for Lake Michigan diversion accounting—Water year 2011: Illinois State Water Survey Contract Report 2012–02, 76 p. [Also available at https://www.ideals.illinois.edu/items/40007.]
Westcott, N.E., 2013, Continued operation of a 25-raingage network for collection, reduction, and analysis of precipitation data for Lake Michigan diversion accounting—Water year 2012: Illinois State Water Survey Contract Report 2013–01, 76 p. [Also available at https://www.ideals.illinois.edu/items/42622.]
Westcott, N.E., 2014, Continued operation of a 25-raingage network for collection, reduction, and analysis of precipitation data for Lake Michigan diversion accounting—Water year 2013: Illinois State Water Survey Contract Report 2014–01, 80 p. [Also available at https://www.ideals.illinois.edu/items/50132.]
Westcott, N.E., 2015, Continued operation of a 25-raingage network for collection, reduction, and analysis of precipitation data for Lake Michigan diversion accounting—Water year 2014: Illinois State Water Survey Contract Report 2015–01, 82 p. [Also available at https://www.ideals.illinois.edu/items/93361.]
Westcott, N.E., 2016, Continued operation of a 25-raingage network for collection, reduction, and analysis of precipitation data for Lake Michigan diversion accounting—Water year 2015: Illinois State Water Survey Contract Report 2016–01, 82 p. [Also available at https://www.ideals.illinois.edu/items/93363.]
Appendix 2. Station Descriptions of the U.S. Geological Survey Cook County Precipitation Network
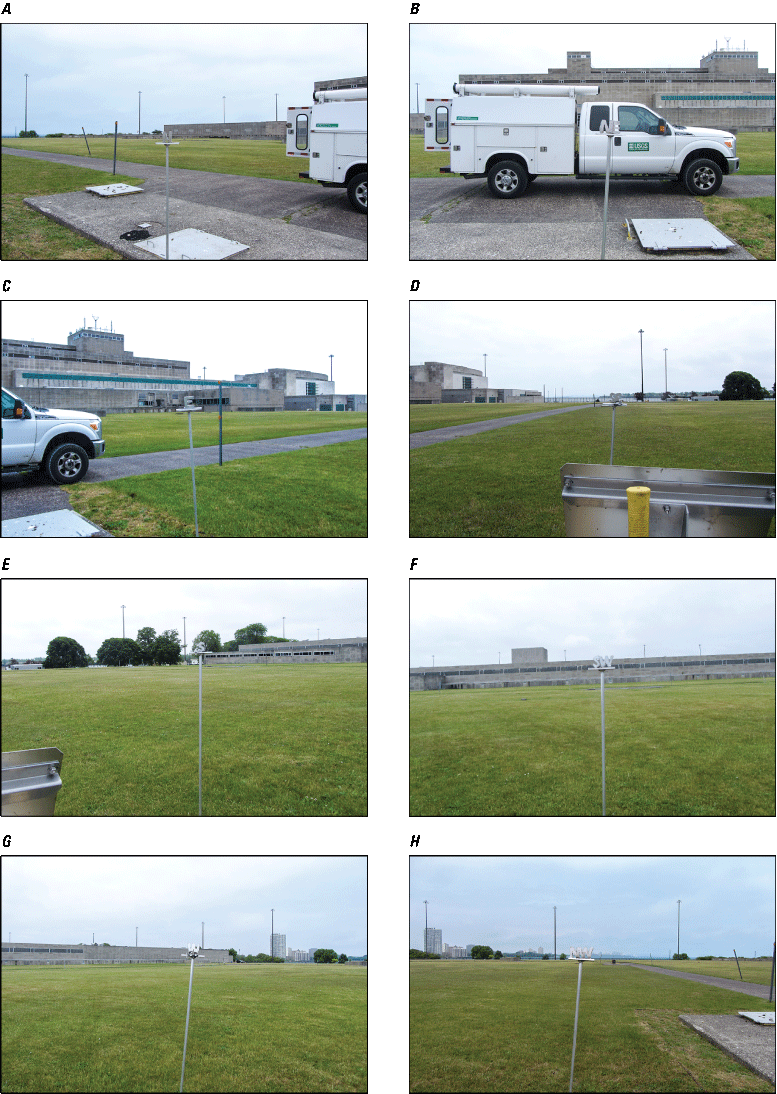
Rain Gage at Northbrook, Illinois (420638087520501)
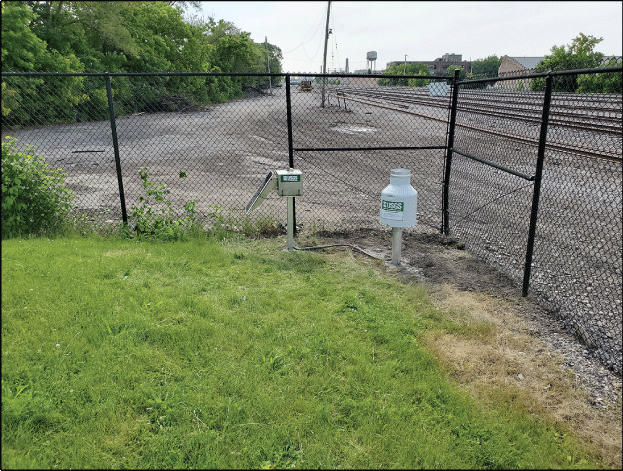
The rain gage is located at north latitude 42.1106250 and west longitude 87.86804722 degrees and is in the northwest corner of Stone Gate Park on the west side of the walking path and due south of the Mission Brook Sanitary District building. The gage was installed on January 27, 2020, and at the time of installation the rain gage operated by the Illinois State Water Survey (ISWS) had been discontinued and removed. No concurrent data between the U.S. Geological Survey (USGS) and the ISWS were collected. The USGS location is 110 feet (33.5 meters) south-southeast of the last known location of the ISWS gage. The gage setup consists of a 1-cubic-foot stainless steel instrument box that houses a Campbell Scientific CR310/Cell210 that is a combination datalogger and cell modem, a 12-volt deep cycle battery, and a solar regulator. A 30-watt solar panel supplements power to the gage and is mounted to the instrument box. An OTT Pluvio2 L weighing bucket type rain gage is mounted on top of a 4-inch (0.102-meter) aluminum pipe 3 feet (0.91 meter) north of the instrument box. For stability, the gage is mounted to a 3-foot by 5-foot concrete pad that is 6 inches thick. The installation setup is shown in figure 2.1. The rim opening of the rain gage is set at 4.05 feet (1.23 meters) above the ground surface.
Photograph of the west view of the Rain Gage at Northbrook, Illinois (420638087520501). Photograph by Kevin K. Johnson, U.S. Geological Survey.
Potential obstruction objects near the gage include the Mission Brook Sanitary District building and some trees adjacent to the building to the north at 31 feet (9.4 meters) from the gage; a tree on the other side of the walking path on the east side at 32 feet (9.8 meters); a sound barrier wall from Interstate 294 on the west side at 41 feet (12.5 meters) from the gage; and no obstructions on the south side (fig. 2.2). The 30-degree horizontal view from the gage is free of obstructions except the west view is blocked by the wall at 50 feet (15.2 meters).
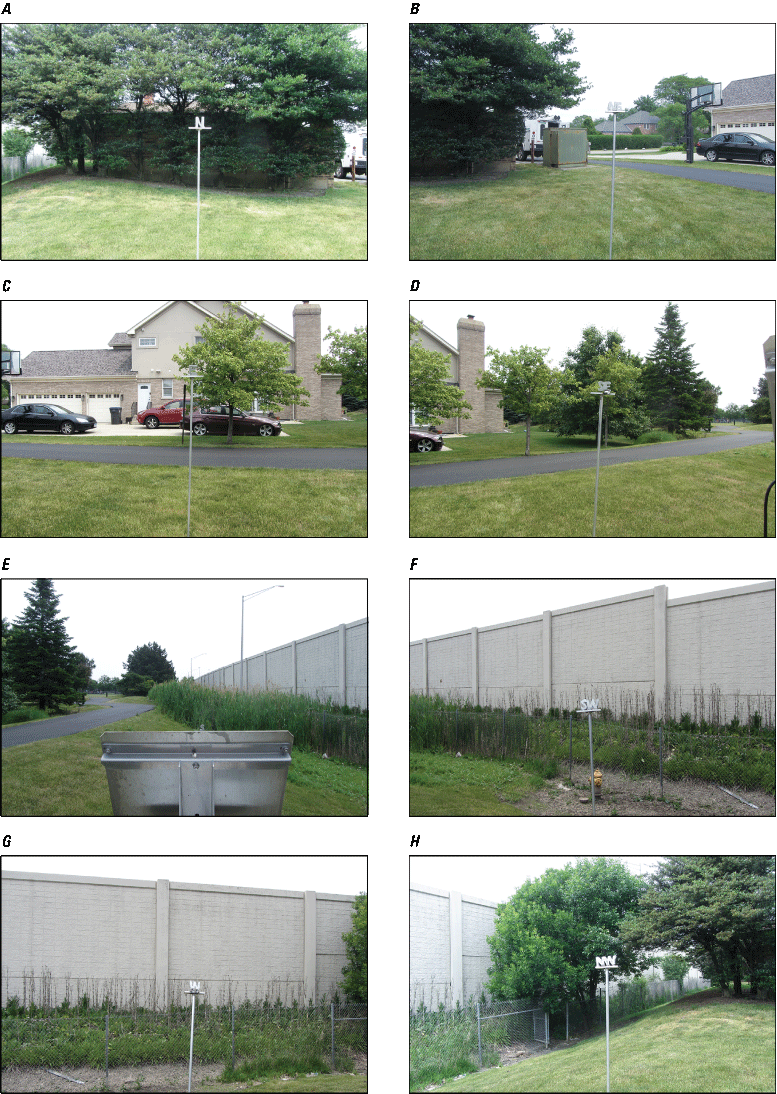
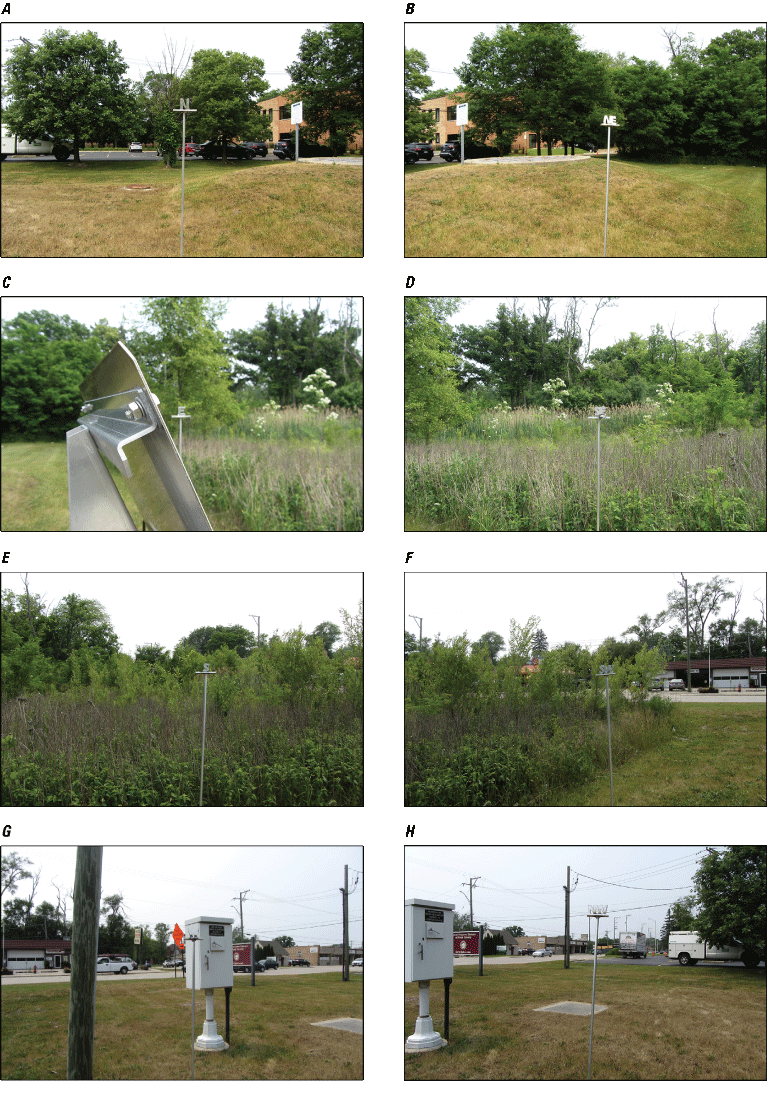
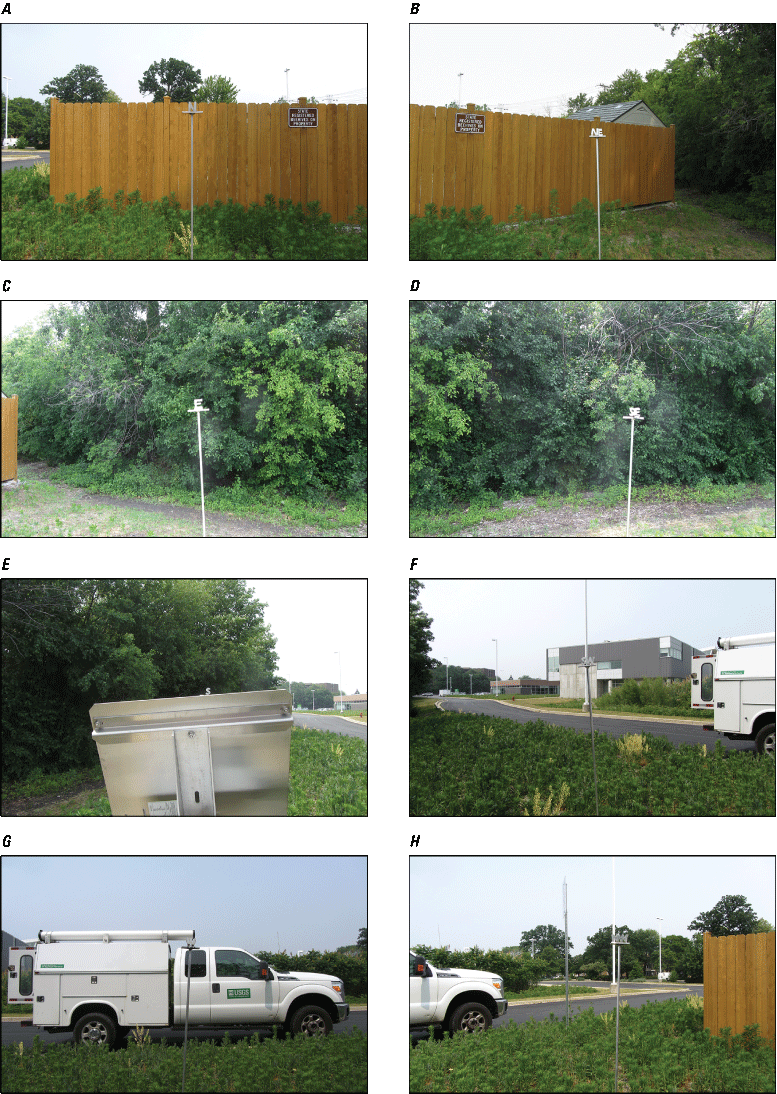
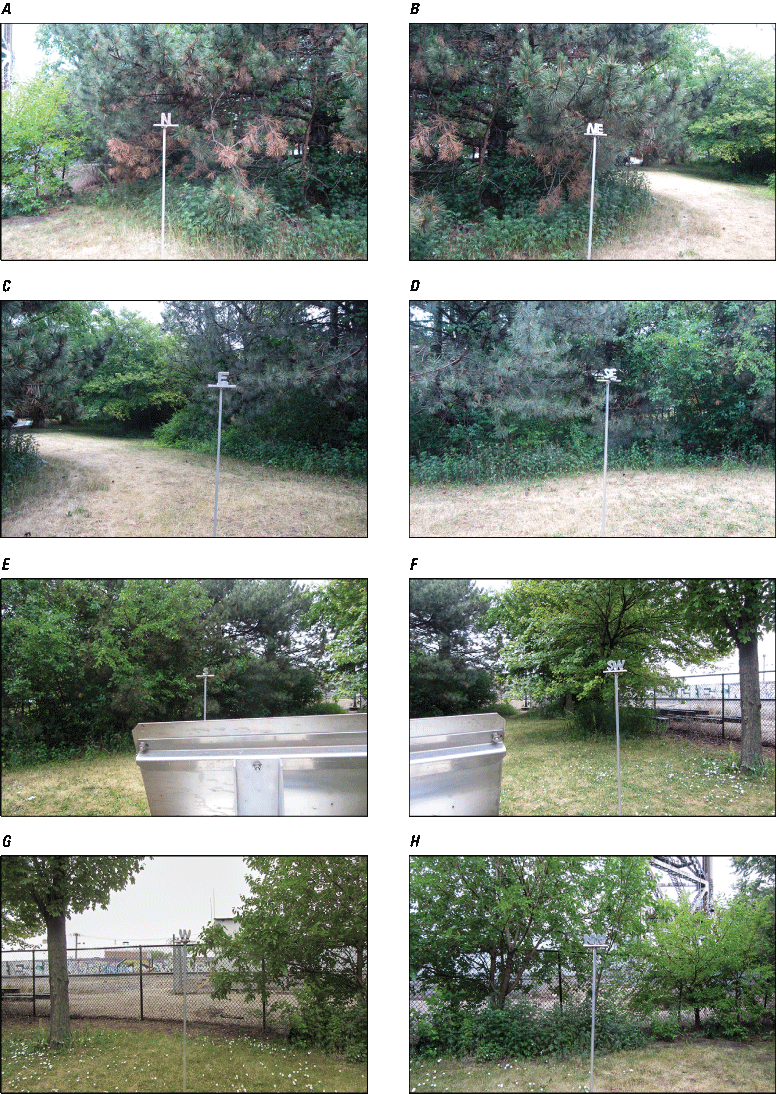
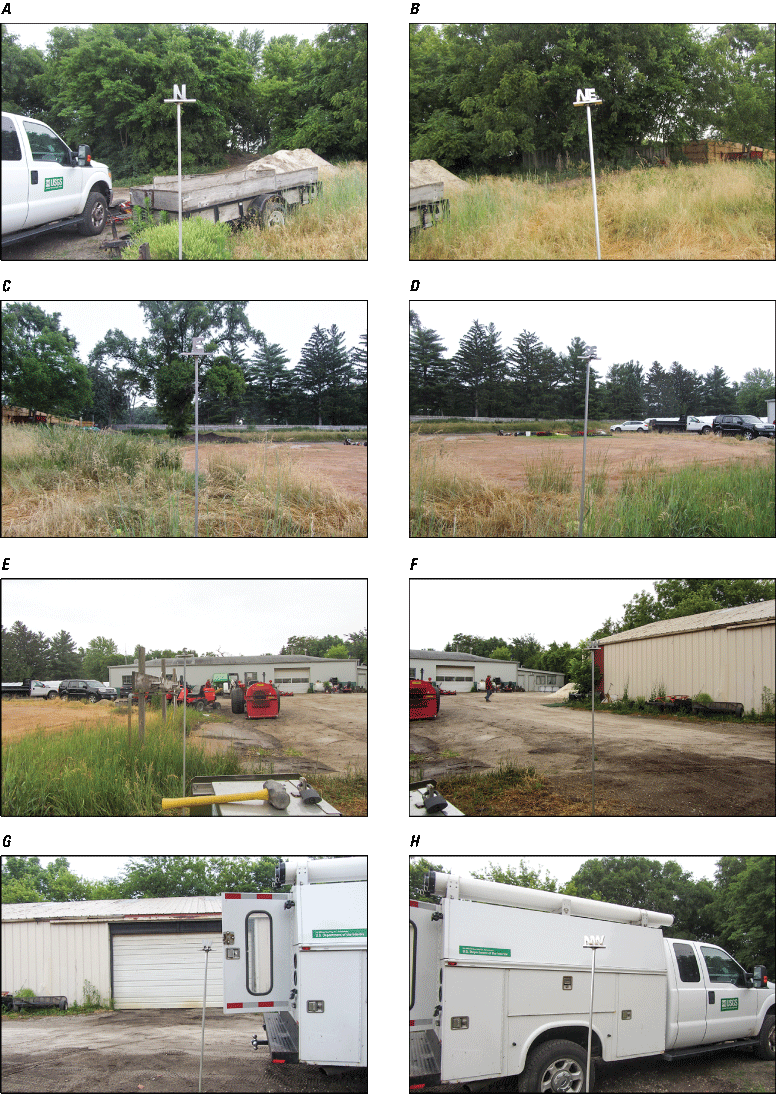
Photographs of Rain Gage at Northbrook, Illinois. A, North view. B, Northeast view. C, East view. D, Southeast view. E, South view. F, Southwest view. G, West view. H, Northwest view. Photographs by Kevin K. Johnson, U.S. Geological Survey.
Rain Gage at Winnetka Golf Club at Winnetka, Illinois (420626087452301)
The rain gage is located at north latitude 42.1072944 and west longitude 87.75661389 degrees and is in the southeast quarter of the golf course near the pond pump house. The gage was installed on May 20, 2019, and at the time of installation was 12 feet (3.66 meters) due west of the rain gage operated by the ISWS. The USGS gage setup consists of a 1-cubic-foot stainless steel instrument box that houses a Campbell Scientific CR310/Cell210 that is a combination datalogger and cell modem, a 12-volt deep cycle battery, and a solar regulator. A 30-watt solar panel supplements power to the gage and is mounted to the instrument box. An OTT Pluvio2 L weighing bucket type rain gage is mounted on top of a 4-inch (0.102-meter) aluminum pipe 3 feet (0.91 meter) north of the instrument box. The rim opening of the rain gage is set at 3.95 feet (1.20 meters) above the ground surface. The gage is approximately mid-slope on an 8- to 10-foot (2.4- to 3.0-meter) mound of dirt covered by prairie grass and small trees. The USGS gage installation is shown in figure 2.3. The ISWS gage, as operated in 2019, is partially visible near the center of the photograph in figure 2.3A behind the USGS gage.
Photographs of the Rain Gage at Winnetka Golf Club at Winnetka, Illinois (420626087452301). A, East view (2019). B, West view (2024). Photographs by Kevin K. Johnson, U.S. Geological Survey.
Potential obstructions near the gage include a young tree line 37 feet (11.3 meters) to the west and prairie grasses in the other three directions. The trees in figure 2.3A are 72 feet (21.9 meters) to the east of the gage. The 30-degree obstruction view has a 44-foot (13.4-meter) distance to the west tree line. Views of the Rain Gage at Winnetka Golf Club at Winnetka, Ill. (420626087452301) are shown in figure 2.4.
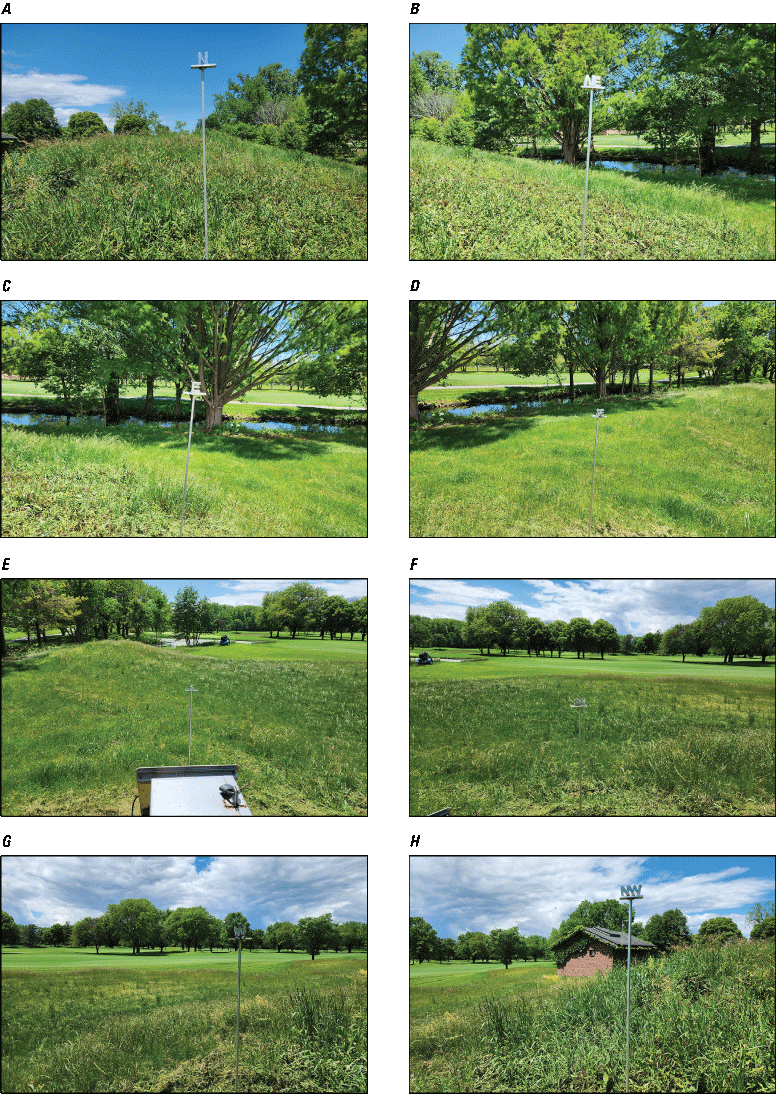
Photographs of Rain Gage at Winnetka Golf Club at Winnetka, Illinois (420626087452301). A, North view. B, Northeast view. C, East view. D, Southeast view. E, South view. F, Southwest view. G, West view. H, Northwest view. Photographs by Kevin K. Johnson, U.S. Geological Survey.
Rain Gage at Des Plaines, Illinois (420121087523201)
The rain gage is located at north latitude 42.0224556 and west longitude 87.87561389 degrees, is on the Cook County Forest Preserve property near the intersection of River Road and Riverview Avenue and is adjacent to a Metropolitan Water Reclamation District drop shaft for the Tunnel and Reservoir Plan on the south side of the parking lot in a grassy area. The gage was installed on June 24, 2020, and at the time of installation the rain gage operated by the ISWS had been discontinued and removed, and no concurrent data between the USGS and the ISWS were collected. The USGS location is 560 feet (171 meters) east of the last known location of the ISWS gage. The gage setup consists of a 1-cubic-foot stainless steel instrument box that houses a Campbell Scientific CR310/Cell210 that is a combination datalogger and cell modem, a 12-volt deep cycle battery, and a solar regulator. A 30-watt solar panel supplements power to the gage and is mounted to the instrument box. An OTT Pluvio2 L weighing bucket type rain gage is mounted on top of a 4-inch (0.102-meter) aluminum pipe 3 feet (0.91 meter) north of the instrument box. The rim opening of the rain gage is set at 4.0 feet (1.22 meters) above the ground surface. For gage stability, the gage is mounted to a 3-foot by 5-foot concrete pad that is 6 inches thick. The installation setup is shown in figure 2.5.
Photograph of the west view of the Rain Gage at Des Plaines, Illinois (420121087523201). Photograph by Kevin K. Johnson, U.S. Geological Survey.
Potential obstructions near the gage include some trees on the other side of the drop shaft opening on the north side at 56 feet (17.1 meters) from the gage; well-maintained grass by the Cook County Forest Preserve District on the east side; a field of prairie grass on the south side; and grass with a power pole on the west side at 17 feet (5.2 meters) from the gage. Generally, the gage is surrounded by well-maintained grass (fig. 2.6). The 30-degree horizontal view from the gage is free of obstructions except for the west view of the power pole that has a slim profile at 22 feet (6.7 meters).
Photographs of Rain Gage at Des Plaines, Illinois (420121087523201). A, North view. B, Northeast view. C, East view. D, Southeast view. E, South view. F, Southwest view. G, West view. H, Northwest view. Photographs by Kevin K. Johnson, U.S. Geological Survey.
Rain Gage at Oakton College at Skokie, Illinois (420119087445101)
The rain gage is located at north latitude 42.0218833 and west longitude 87.74758889 degrees and is in the northeast corner of campus on the east side of the parking lot near the Illinois State Apiary Facility on the Skokie Campus of Oakton College. The gage was installed on January 15, 2020, and at the time of installation the rain gage operated by the ISWS had been discontinued and removed, and no concurrent data between the USGS and ISWS were collected. The USGS location is 2,965 feet (904 meters) southeast of the last known location of the ISWS gage. The gage setup consists of a 1-cubic-foot stainless steel instrument box that houses a Campbell Scientific CR310/Cell210 that is a combination datalogger and cell modem, a 12-volt deep cycle battery, and a solar regulator. A 30-watt solar panel supplements power to the gage and is mounted to the instrument box. An OTT Pluvio2 L weighing bucket type rain gage is mounted on top of a 4-inch (0.102-meter) aluminum pipe 3 feet (0.91 meter) north of the instrument box. The rim opening of the rain gage is set at 3.95 feet (1.20 meters) above the ground surface. For gage stability, the gage is mounted to a 3-foot by 5-foot concrete pad that is 6 inches thick. The installation setup is shown in figure 2.7.
Photograph of the northeast view of the Rain Gage at Oakton College at Skokie, Illinois (420119087445101). Photograph by Kevin K. Johnson, U.S. Geological Survey.
Potential obstructions near the gage include a 6-foot (1.8-meter) wooden fence enclosing the Apiary to the north at 17 feet (5.2 meters) from the gage, a hedge row approximately 12 feet (3.7 meters) tall to the east at 24 feet (7.3 meters) from the gage, and well-maintained prairie grass and driveway asphalt to the south and west. The gage is generally surrounded by well-maintained prairie grass at the Oakton College Skokie Campus facility. The 30-degree horizontal view is clear in all directions (fig. 2.8).
Photographs of Rain Gage at Oakton College at Skokie, Illinois (420119087445101). A, North view. B, Northeast view. C, East view. D, Southeast view. E, South view. F, Southwest view. G, West view. H, Northwest view. Photographs by Kevin K. Johnson, U.S. Geological Survey.
Rain Gage at Franklin Park, Illinois (415537087525801)
The rain gage is located at north latitude 41.9270250 and west longitude 87.88292500 degrees and is on the east side of the Jack B. Williams Reservoir Facility in a grassy area adjacent to the creek that runs adjacent to the reservoir. The gage was installed on September 4, 2019, and at the time of installation was 2,250 feet (686 meters) southwest of the rain gage operated by the ISWS. The gage setup consists of a 1-cubic-foot stainless steel instrument box that houses a Campbell Scientific CR310/Cell210 that is a combination datalogger and cell modem, a 12-volt deep cycle battery, and a solar regulator. A 30-watt solar panel supplements power to the gage and is mounted to the fence rail next to the instrument box. An OTT Pluvio2 L weighing bucket type rain gage is mounted on top of a 4-inch (0.102-meter) aluminum pipe 3 feet (0.91 meter) north of the instrument box. The rim opening of the rain gage is set at 3.95 feet (1.20 meters) above the ground surface. For gage stability, the gage is mounted to a 3-foot by 5-foot concrete pad that is 6 inches thick. The installation setup is shown in figure 2.9.
Photograph of the south view of the Rain Gage at Franklin Park, Illinois (415537087525801). Photograph by Kevin K. Johnson, U.S. Geological Survey.
The gage is mostly surrounded by well-maintained grass. The creek and flood reservoir are to the south, and trees to the north, east, and west are more than 50 feet (15.2 meters) away from the gage. The 30-degree horizontal view is clear (fig. 2.10).
Photographs of Rain Gage at Franklin Park, Illinois (415537087525801). A, North view. B, Northeast view. C, East view. D, Southeast view. E, South view. F, Southwest view. G, West view. H, Northwest view. Photographs by Kevin K. Johnson, U.S. Geological Survey.
Rain Gage at North Austin, Illinois (415458087462201)
The rain gage is located at north latitude 41.9162667 and west longitude 87.75661389 degrees and is in the northwest corner of the LiUNA Chicagoland Laborers Training Center. This site requires prior permission to enter and work on the grounds. The gage was installed on June 6, 2019. At the time of installation, the USGS gage was 830 feet (253 meters) northwest of the rain gage operated by the ISWS. A new location away from areas of active training was selected at the request of LiUNA. The gage setup consists of a 1-cubic-foot stainless steel instrument box that houses a Campbell Scientific CR310/Cell210 that is a combination datalogger and cell modem, a 12-volt deep cycle battery, and a solar regulator. A 30-watt solar panel supplements power to the gage and is mounted to the instrument box. An OTT Pluvio2 L weighing bucket type rain gage is mounted on top of a 4-inch (0.102-meter) aluminum pipe 3 feet (0.91 meter) north of the instrument box. The rim opening of the rain gage is set at 3.97 feet (1.21 meters) above the ground surface. At the request of LiUNA, the installation did not include a concrete pad. The two mounting posts for the gage box and the weighing bucket rain gage are set 3 feet deep in concrete. The installation setup is shown in figure 2.11.
Photograph of the west view of the Rain Gage at North Austin, Illinois (415458087462201). Photograph by Kevin K. Johnson, U.S. Geological Survey.
Potential obstructions near the gage include an 8-foot (2.4-meter) chain link fence to the north at 5 feet (1.5 meters) from the weighing-bucket gage and then a railroad right of way, a grassy hill with a gentle slope, and a tree to the east at 37 feet (11.3 meters) from the gage, a continuation of the grassy hill and the chain link fence to the south, and then the chain link fence is 5 feet (1.5 meters) from the gage and the railroad yard continues to the west. Evaluation of the 30-degree obstructions include the top rail of the chain link fence north and west of the gage, and the east and south are clear. Views of the Rain Gage at North Austin, Ill. (415458087462201) are shown in figure 2.12.
Photographs of Rain Gage at North Austin, Illinois (415458087462201). A, North view. B, Northeast view. C, East view. D, Southeast view. E, South view. F, Southwest view. G, West view. H, Northwest view. Photographs by Kevin K. Johnson, U.S. Geological Survey.
Rain Gage at Lake View, Illinois (415657087382101)
The rain gage is located at north latitude 41.949211 and west longitude 87.63918611 degrees and is in the south end of the Sydney R. Marovitz Golf Course behind the maintenance facility. The gage is on Chicago Park District (CPD) park property that is associated with the golf course and the Belmont Harbor of Lake Michigan. The gage is in a grassy area that is unobstructed by trees or buildings. The gage was installed on October 8, 2020, and at the time of installation the rain gage operated by the ISWS had been discontinued and removed, and no concurrent data between the USGS and the ISWS were collected. The USGS location is 2,725 feet (830 meters) southeast of the last known location of the ISWS gage. The gage setup consists of a 1-cubic-foot stainless steel instrument box that houses a Campbell Scientific CR310/Cell210 that is a combination datalogger and cell modem, a 12-volt deep cycle battery, and a solar regulator. A 30-watt solar panel supplements power to the gage and is mounted to the instrument box. An OTT Pluvio2 L weighing bucket type rain gage is mounted on top of a 4-inch (0.102-meter) aluminum pipe 3 feet (0.91 meter) north of the instrument box. The rim opening of the rain gage is set at 3.95 feet (1.20 meters) above the ground surface. For gage stability, the gage is mounted to a 3-foot by 5-foot concrete pad that is 6 inches thick. The installation setup is shown in figure 2.13.
Photograph of the south view of the Rain Gage at Lake View, Illinois (415657087382101). Photograph by Kevin K. Johnson, U.S. Geological Survey.
Potential obstructions near the gage include an 8-foot (2.4-meter) concrete wall at the maintenance yard 23 feet (7.0 meters) to the north of the gage, a line of large trees to the west beginning at 25 feet (7.6 meters), open grass to the south, and then grass to the east until Lake Michigan at 165 feet (50 meters) from the gage. The surrounding grass is well-maintained by the CPD (fig. 2.14). The 30-degree horizontal view is not obstructed by the wall to the north, the trees to the west are at the 30-foot (9.1-meter) threshold, and the south and east are unobstructed.
Photographs of Rain Gage at Lake View, Illinois (415657087382101). A, North view. B, Northeast view. C, East view. D, Southeast view. E, South view. F, Southwest view. G, West view. H, Northwest view. Photographs by Kevin K. Johnson, U.S. Geological Survey.
Rain Gage at Westchester, Illinois (415057087524801)
The rain gage is located at north latitude 41.8493611 and west longitude 87.87994722 degrees and is in the grassy area on the northwest side of the Village of Westchester Water Department reservoir between Cermak Road and Crestwood Lane. The gage was installed on June 25, 2020, and at the time of installation the rain gage operated by the ISWS had been discontinued and removed, and no concurrent data between the USGS and the ISWS were collected. The USGS location is 1,800 feet (549 meters) north-northeast of the last known location of the ISWS gage. The gage setup consists of a 1-cubic-foot stainless steel instrument box that houses a Campbell Scientific CR310/Cell210 that is a combination datalogger and cell modem, a 12-volt deep cycle battery, and a solar regulator. A 30-watt solar panel supplements power to the gage and is mounted to the instrument box. An OTT Pluvio2 L weighing bucket type rain gage is mounted on top of a 4-inch (0.102-meter) aluminum pipe 3 feet (0.91 meter) north of the instrument box. The rim opening of the rain gage is set at 4.05 feet (1.23 meters) above the ground surface. For gage stability, the gage is mounted to a 3-foot by 5-foot concrete pad that is 6 inches thick. The installation setup is shown in figure 2.15.
Photograph of the south view of the Rain Gage at Westchester, Illinois (415057087524801). Photograph by Kevin K. Johnson, U.S. Geological Survey.
Potential obstructions near the gage include open grass to Crestwood Lane on the north side at 44 feet (13.4 meters) from the gage, a large maple tree to the northeast at 31 feet (9.4 meters), the Village of Westchester Water Department water storage reservoir on the east side at 25 feet (7.6 meters; the reservoir tank is about 10 feet [3.0 meters] from the ground surface to the top and is surrounded by well-maintained grass by the Cook County Forest Preserve District), grass leading to a tree on the south side at 35 feet (10.7 meters), and grass leading to an 8-foot (2.4-meter) fence enclosure for the water department’s backup generator and then 42 feet (12.8 meters) to another tree to the west. Generally, the gage is surrounded by well-maintained grass (fig. 2.16). The 30-degree horizontal view from the gage is free of obstructions except for the trees that are outside of the 30-foot (9.1-meter) radius.
Photographs of Rain Gage at Westchester, Illinois (415057087524801). A, North view. B, Northeast view. C, East view. D, Southeast view. E, South view. F, Southwest view. G, West view. H, Northwest view. Photographs by Kevin K. Johnson, U.S. Geological Survey.
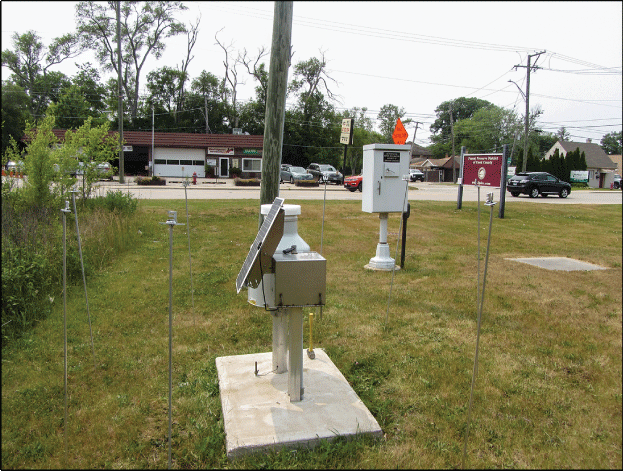
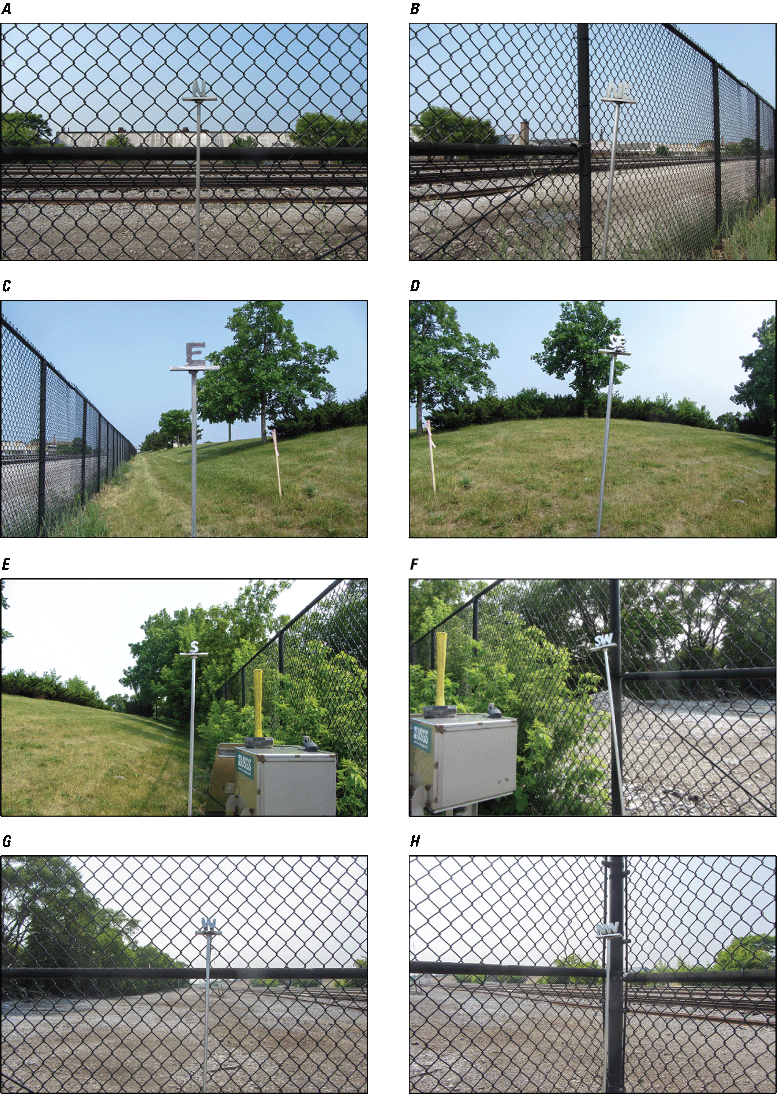
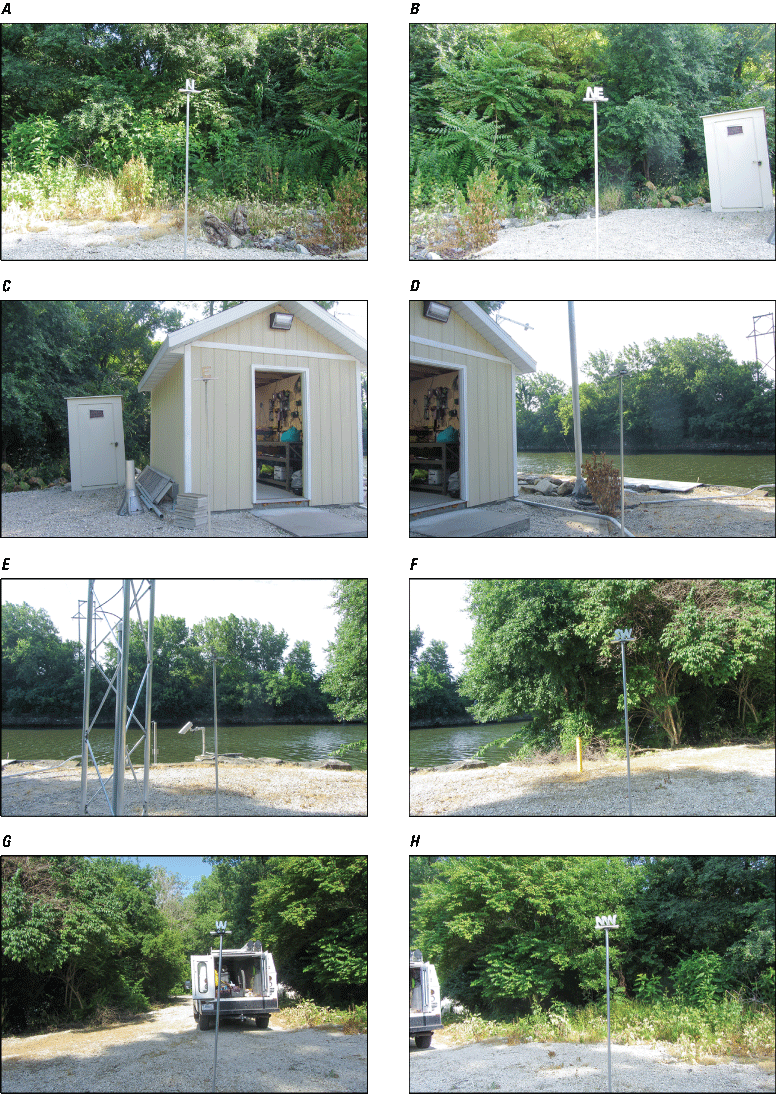
Rain Gage at Cicero, Illinois (415155087451901)
The rain gage is located at north latitude 41.8652056 and west longitude 87.75531111 degrees and is on the west side of the Village of Cicero Water Department Facility in an open grassy area between the water tower and trees along a chain link fence. The gage was installed on September 26, 2019, and at the time of installation was 180 feet (55 meters) west of the rain gage operated by the ISWS. The gage setup consists of a 1-cubic-foot stainless steel instrument box that houses a Campbell Scientific CR310/Cell210 that is a combination datalogger and cell modem, a 12-volt deep cycle battery, and a solar regulator. A 30-watt solar panel supplements power to the gage and is mounted to the instrument box. An OTT Pluvio2 L weighing bucket type rain gage is mounted on top of a 4-inch (0.102-meter) aluminum pipe 3 feet (0.91 meter) north of the instrument box. The rim opening of the rain gage is set at 3.90 feet (1.19 meters) above the ground surface. For gage stability, the gage is mounted to a 3-foot by 5-foot concrete pad that is 6 inches thick. The installation setup is shown in figure 2.17.
Photograph of the north view of the Rain Gage at Cicero, Illinois (415155087451901). Photograph by Kevin K. Johnson, U.S. Geological Survey.
Potential obstructions near the gage include an 8-foot (2.4-meter) chain link fence at 10 feet (3.0 meters) and a warehouse building at 46 feet (14.0 meters) to the west of the gage, grass leading to a tree to the north at 29 feet (8.8 meters), more grass leading to a tree to the south at 43 feet (13.1 meters), and well-maintained grass to the east within the Cicero Water Department facility. There is also a very large water tower that is 47 feet (14.3 meters) from the gage (when measured with Google Earth). This water tower creates a rain shadow effect when a storm approaches from the northeast direction to the gage, though most storms approach from the west or southwest. The gage is generally surrounded by well-maintained grass at the Village of Cicero Water Department. The 30-degree horizontal view is clear in all but the west direction (fig. 2.18) for at least 30 feet (9.1 meters) over the obstructions previously listed. The fence on the west side obscures the 30-degree opening at 13.4 feet (4.1 meters).
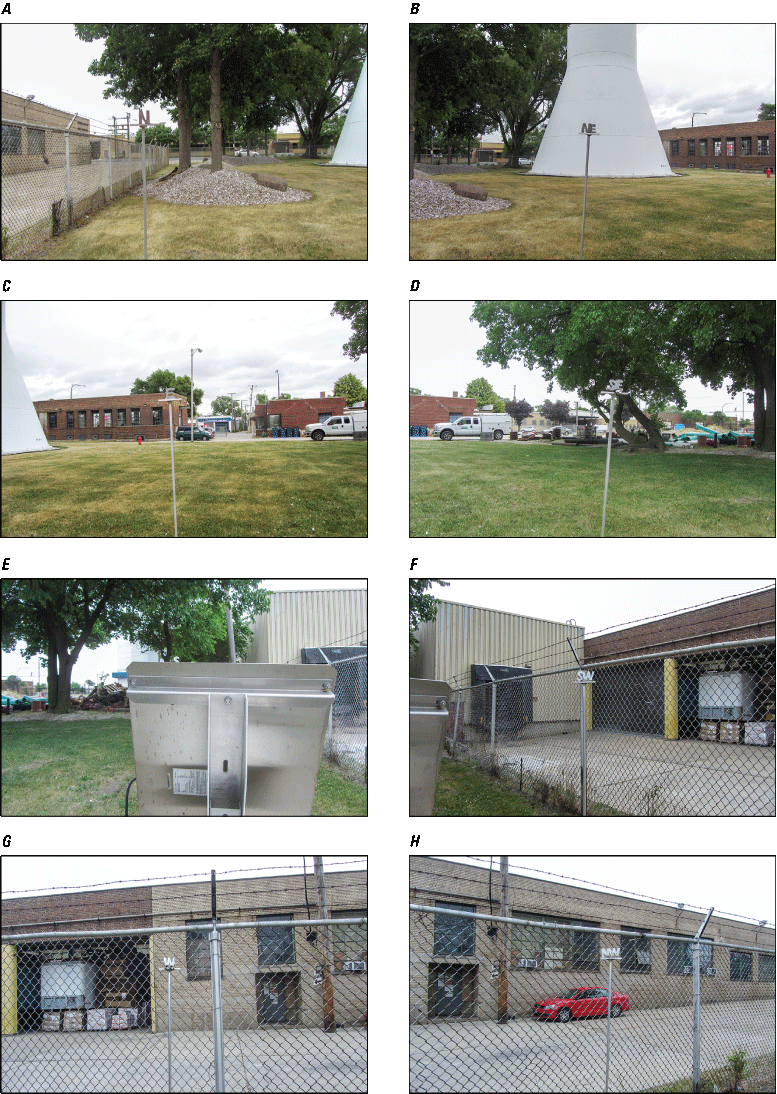
Photographs of Rain Gage at Cicero, Illinois (415155087451901). A, North view. B, Northeast view. C, East view. D, Southeast view. E, South view. F, Southwest view. G, West view. H, Northwest view. Photographs by Kevin K. Johnson, U.S. Geological Survey.
The ninth Technical Review Committee for Lake Michigan Diversion Accounting determined that the new location of the Rain Gage at Cicero, Ill. (415155087451901) was under- reporting when compared to the ISWS rain gage. The under-reporting difference was likely caused by the proximity to the Cicero water tower. The Technical Review Committee recommended an additional gage be installed within the property and closer to the original location of the ISWS rain gage. On March 7, 2024, the second rain gage was installed. The equipment and setup are the same as mentioned previously, but the location is 215 feet southeast of the first USGS rain gage installed (in the southeast corner of the Cicero Water Department property). The new location of the gage is shown in figure 2.19.
Photograph of the north view of the second Rain Gage at Cicero, Illinois (415155087451901). Photograph by Kevin K. Johnson, U.S. Geological Survey.
The second rain gage was installed in a small grassy area that is adjacent to the construction staging area of the water department. There is a chain link fence to the east, a tree to the south, and all other directions are free of obstructions. The view in each direction from the rain gage is shown in figure 2.20.
Photographs of the second Rain Gage at Cicero, Illinois (415155087451901). A, North view. B, Northeast view. C, East view. D, Southeast view. E, South view. F, Southwest view. G, West view. H, Northwest view. Photographs by Kevin K. Johnson, U.S. Geological Survey.
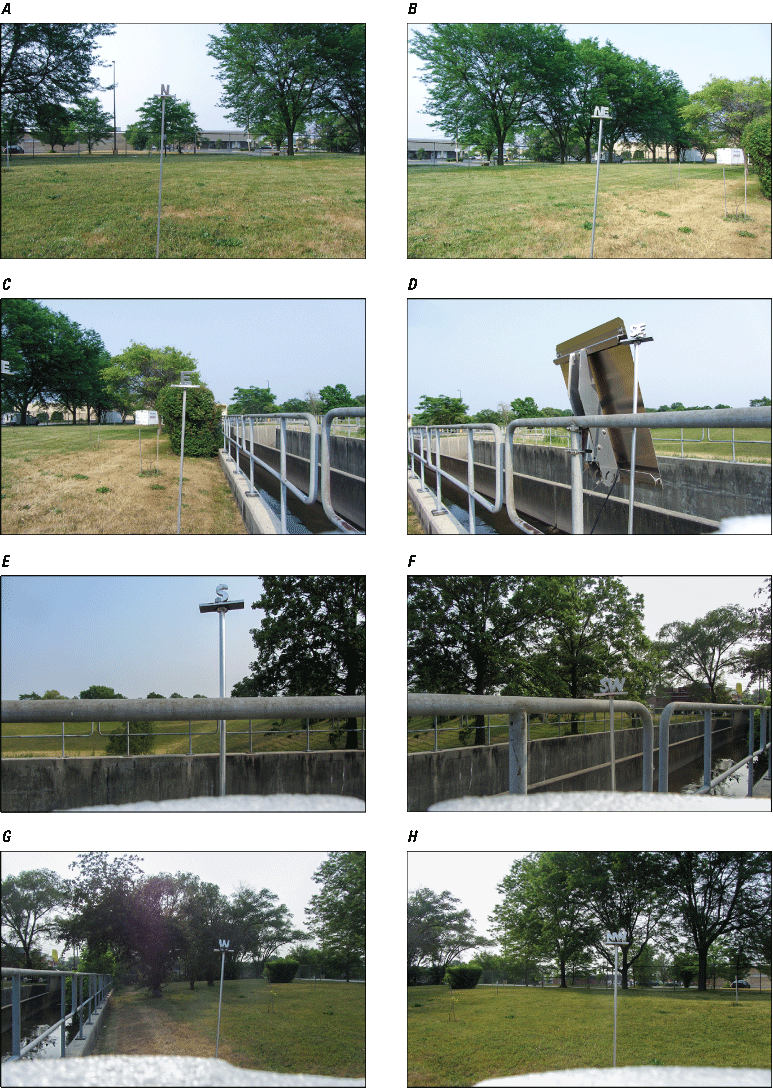
Rain Gage at Ping Tom Park at Chicago, Illinois (415118087381201)
The rain gage is located at north latitude 41.8548694 and west longitude 87.63670278 degrees and is in the southwest corner of CPD Ping Tom Memorial Park. The gage was installed on October 7, 2020, and at the time of installation the rain gage operated by the ISWS had been discontinued and removed, and no concurrent data between the USGS and the ISWS were collected. The USGS location is 3,763 feet (1,147 meters) south-southwest of the last known location of the ISWS gage. The gage setup consists of a 1-cubic-foot stainless steel instrument box that houses a Campbell Scientific CR310/Cell210 that is a combination datalogger and cell modem, a 12-volt deep cycle battery, and a solar regulator. A 30-watt solar panel supplements power to the gage and is mounted to the instrument box. An OTT Pluvio2 L weighing bucket type rain gage is mounted on top of a 4-inch (0.102-meter) aluminum pipe 3 feet (0.91 meter) north of the instrument box. The rim opening of the rain gage is set at 3.95 feet (1.20 meters) above the ground surface. The installation setup is shown in figure 2.21.
Photograph of the west view of the Rain Gage at Ping Tom Park at Chicago, Illinois (415118087381201). Photograph by Kevin K. Johnson, U.S. Geological Survey.
Potential obstructions near the gage include open grass and trees in every direction; the distance between the gage and the trees is 24 feet (7.3 meters) to the north, 19 feet (5.8 meters) to the east, 31 feet (9.4 meters) to the south, and 21 feet (6.4 meters) to a tree and chain link fence line to the west. The surrounding grass is well-maintained by the CPD (fig. 2.22). The 30-degree horizontal view from the gage has the same obstructions as just mentioned.
Photographs of the Rain Gage at Ping Tom Park at Chicago, Illinois (415118087381201). A, North view. B, Northeast view. C, East view. D, Southeast view. E, South view. F, Southwest view. G, West view. H, Northwest view. Photographs by Kevin K. Johnson, U.S. Geological Survey.
Rain Gage at La Grange, Illinois (414454087533201)
The rain gage is located at north latitude 41.7483361 and west longitude 87.89217778 degrees and is in the southwest quarter of the Edgewood Valley Country Club golf course near the putting green in the maintenance area. The gage was installed on June 11, 2019, and at the time of installation was 32 feet (9.8 meters) due north of the rain gage operated by the ISWS. The gage setup consists of a 1-cubic-foot stainless steel instrument box that houses a Campbell Scientific CR310/Cell210 that is a combination datalogger and cell modem, a 12-volt deep cycle battery, and a solar regulator. A 30-watt solar panel supplements power to the gage and is mounted to the instrument box. An OTT Pluvio2 L weighing bucket type rain gage is mounted on top of a 4-inch (0.102-meter) aluminum pipe 3 feet (0.91 meter) north of the instrument box. The rim opening of the rain gage is set at 3.99 feet (1.22 meters) above the ground surface. The installation setup is shown in figure 2.23.
Photograph of the west view of the Rain Gage at La Grange, Illinois (414454087533201). Photograph by Kevin K. Johnson, U.S. Geological Survey.
Potential obstructions near the gage are a golf course maintenance shed 39 feet (11.9 meters) to the west of the gage and open grassy areas and a practice putting green in the other directions. The 30-degree horizontal view is clear in all directions (fig. 2.24) over the maintenance structure and the practice golf putting green.
Photographs of the Rain Gage at La Grange, Illinois (414454087533201). A, North view. B, Northeast view. C, East view. D, Southeast view. E, South view. F, Southwest view. G, West view. H, Northwest view. Photographs by Kevin K. Johnson, U.S. Geological Survey.
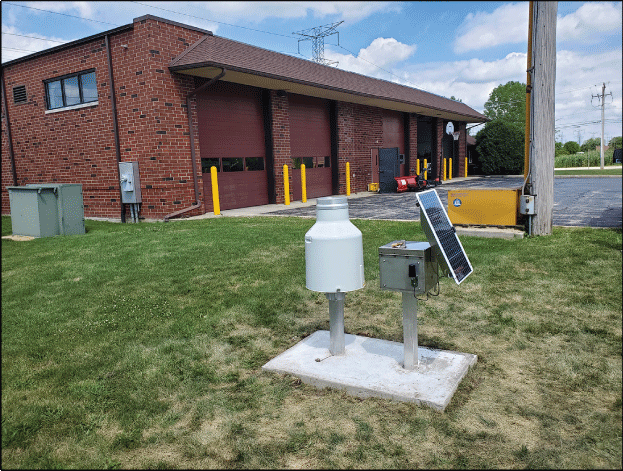
Rain Gage at Bedford Park, Illinois (414529087460501)
The rain gage is located at north latitude 41.7578333 and west longitude 87.76811667 degrees and is on the south side of the parking lot near the retention pond of the Hallstar Corporation facility on 5851West 73rd Street in Bedford Park, Ill. The gage was installed on September 26, 2019, and at the time of installation was 17 feet (5.2 meters) east of the rain gage operated by the ISWS. The gage setup consists of a 1-cubic-foot stainless steel instrument box that houses a Campbell Scientific CR310/Cell210 that is a combination datalogger and cell modem, a 12-volt deep cycle battery, and a solar regulator. A 30-watt solar panel supplements power to the gage and is mounted to the instrument box. An OTT Pluvio2 L weighing bucket type rain gage is mounted on top of a 4-inch (0.102-meter) aluminum pipe 3 feet (0.91 meter) north of the instrument box. The rim opening of the rain gage is set at 3.97 feet (1.21 meters) above the ground surface. The installation setup without a concrete pad is shown in figure 2.25. The ISWS rain gage is shown on the left side of the USGS rain gage in figure 2.25.
Photograph of the southwest view of the Rain Gage at Bedford Park, Illinois (414529087460501). Photograph by Kevin K. Johnson, U.S. Geological Survey.
Potential obstructions near the gage include a large 8-foot (2.4-meter) diameter tank to the north at 19-feet (5.8-meters) from the gage, the loading dock of Hallstar Corporation 63 feet (19.2 meters) to the northeast, a large tree to the east at 57 feet (17.4 meters), a grass-covered storm retention pond to the south, and well-maintained grass and a parking lot to the west. The gage is generally surrounded by well-maintained grass at the Hallstar Corporation facility. The 30-degree horizontal view is clear in all directions (fig. 2.26).
Photographs of the Rain Gage at Bedford Park, Illinois (414529087460501). A, North view. B, Northeast view. C, East view. D, Southeast view. E, South view. F, Southwest view. G, West view. H, Northwest view. Photographs by Kevin K. Johnson, U.S. Geological Survey.
Rain Gage at Hamilton Park at Chicago, Illinois (414542087380901)
The rain gage is located at north latitude 41.7616583 and west longitude 87.63583056 degrees, is in the center of the east side of CPD Hamilton Park and is west of the swimming pool near the footpath. Hamilton Park is located within the Englewood neighborhood of Chicago, Ill. The gage was installed on October 9, 2020, and at the time of installation the rain gage operated by the ISWS had been discontinued and removed, and no concurrent data between the USGS and the ISWS were collected. The USGS location is 1,995 feet (608 meters) northeast of the last known location of the ISWS gage. This was the final gage to be replaced in the Cook County Rain Gage Network of the ISWS. The gage setup consists of a 1-cubic-foot stainless steel instrument box that houses a Campbell Scientific CR310/Cell210 that is a combination datalogger and cell modem, a 12-volt deep cycle battery, and a solar regulator. A 30-watt solar panel supplements power to the gage and is mounted to the instrument box. An OTT Pluvio2 L weighing bucket type rain gage is mounted on top of a 4-inch (0.102-meter) aluminum pipe 3 feet (0.91 meter) north of the instrument box. The rim opening of the rain gage is set at 4.00 feet (1.22 meters) above the ground surface. The installation setup with a concrete pad is shown in figure 2.27.
Photograph of the east view of the Rain Gage at Hamilton Park at Chicago, Illinois (414542087380901). Photograph by Kevin K. Johnson, U.S. Geological Survey.
Potential obstructions near the gage include open grass and trees in three directions. The distance between the gage and the trees is 44 feet (12.4 meters) to the north, 33 feet (10.1 meters) to the east, and 33 feet (10.1 meters) to the south; there is grass and a walking path to the west. The surrounding grass is well-maintained by the CPD (fig. 2.28). The 30-degree horizontal view from the gage has the same obstructions as just mentioned, noting that the 30-foot (9.1-meter) radius is clear.
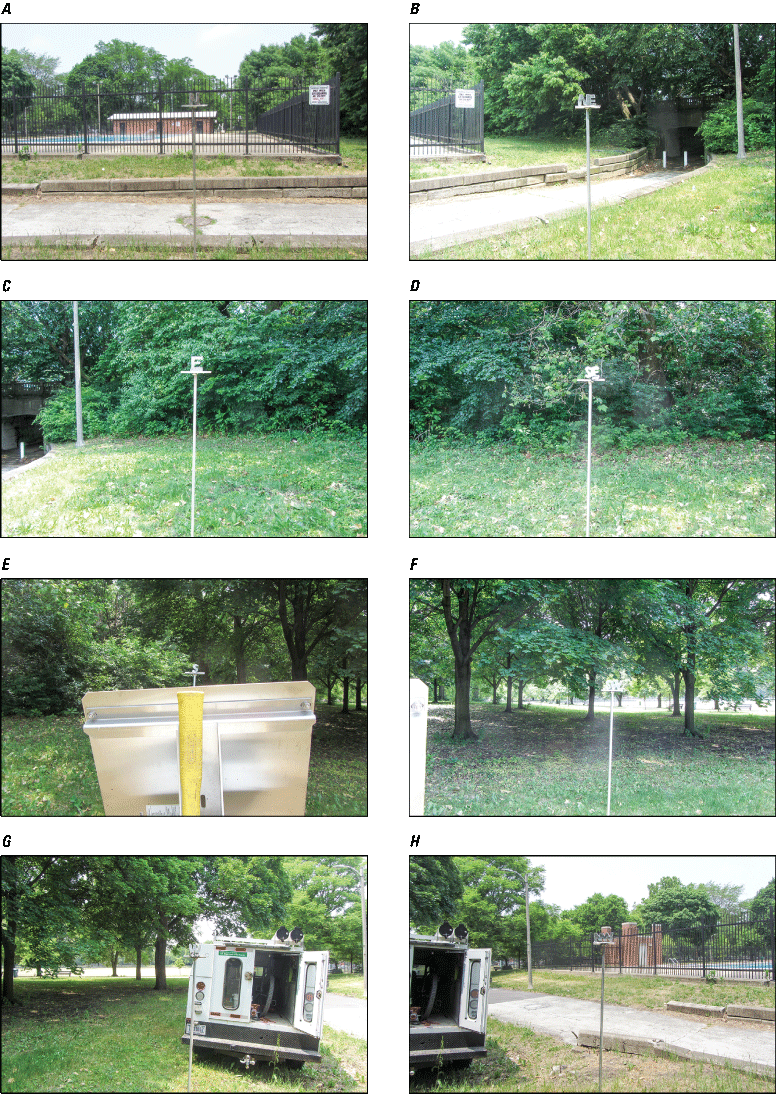
Photographs of the Rain Gage at Hamilton Park at Chicago, Illinois (414542087380901). A, North view. B, Northeast view. C, East view. D, Southeast view. E, South view. F, Southwest view. G, West view. H, Northwest view. Photographs by Kevin K. Johnson, U.S. Geological Survey.
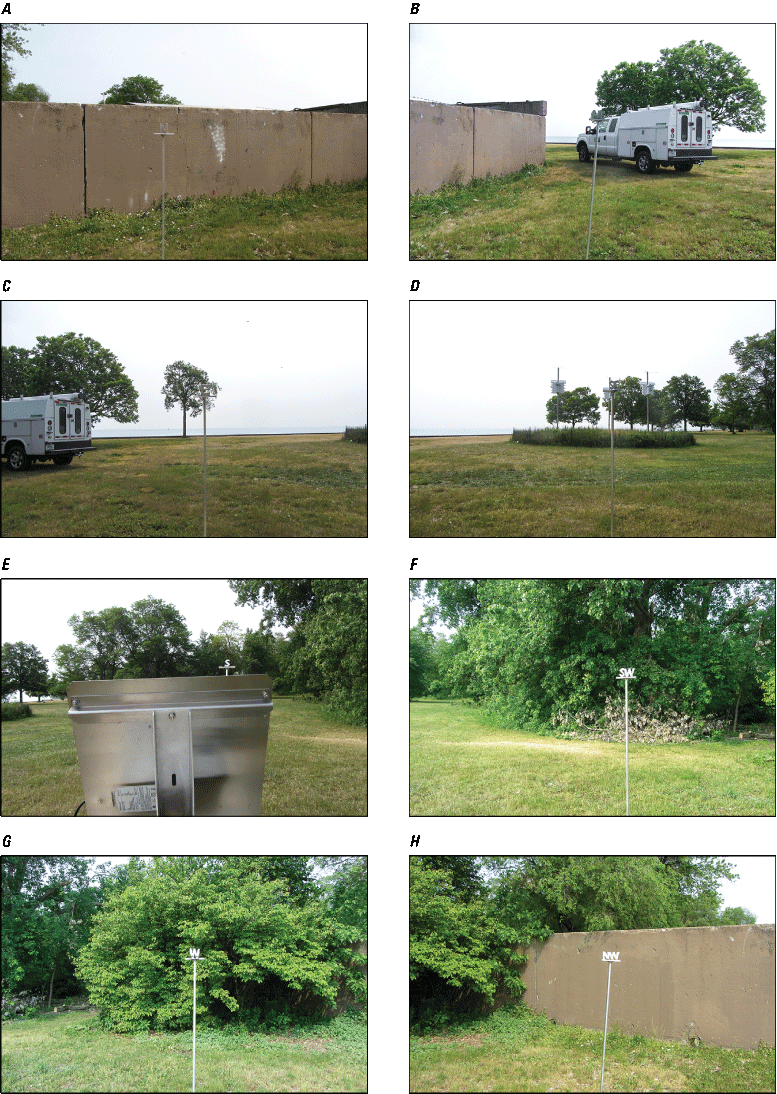
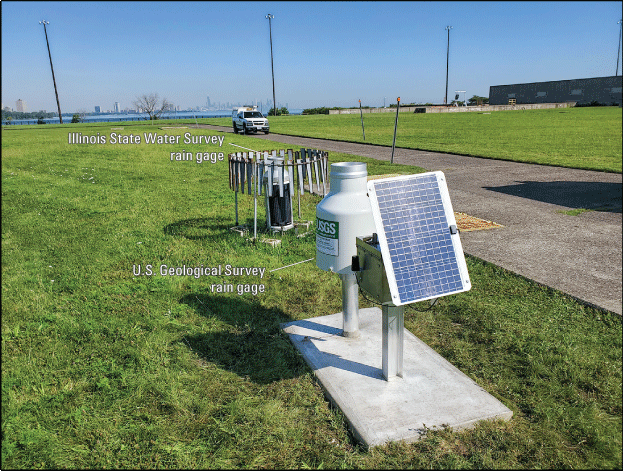
Rain Gage at South Shore, Illinois (414527087323801)
The rain gage is located at north latitude 41.7575056 and west longitude 87.54384722 degrees and is in the Sayer Water Treatment Facility on the grassy area that is the top of the reservoir. The gage was installed on August 7, 2019, and at the time of installation was 20 feet (6 meters) southeast of the rain gage operated by the ISWS. The gage setup consists of a 1-cubic-foot stainless steel instrument box that houses a Campbell Scientific CR310/Cell210 that is a combination datalogger and cell modem, a 12-volt deep cycle battery, and a solar regulator. A 30-watt solar panel supplements power to the gage and is mounted to the instrument box. An OTT Pluvio2 L weighing bucket type rain gage is mounted on top of a 4-inch (0.102-meter) aluminum pipe 3 feet (0.91 meter) north of the instrument box. The rim opening of the rain gage is set at 4.05 feet (1.23 meters) above the ground surface. For gage stability, the gage is mounted to a 3-foot by 5-foot concrete pad that is 6 inches thick. The installation setup is shown in figure 2.29.
Photograph of the northeast view of the Rain Gage at South Shore, Illinois (414527087323801). Photograph by Kevin K. Johnson, U.S. Geological Survey.
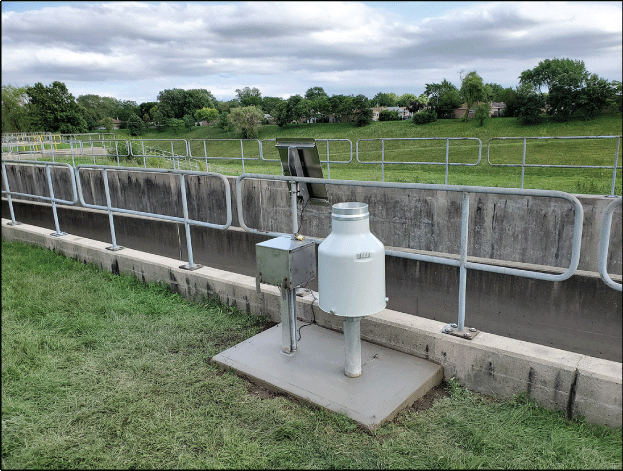
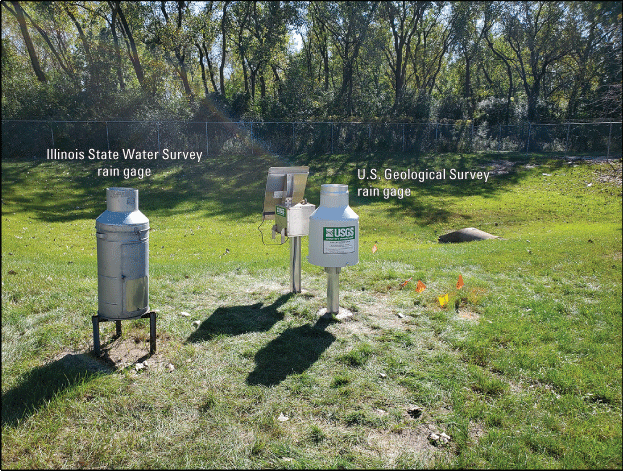
The gage is surrounded by well-maintained grass; thus, no potential obstructing objects are present near the gage. The Illinois State Water Survey Belfort weighing bucket rain gage had a wind shield installed around the gage to reduce the wind influence on the catching of the precipitation. Figure 2.29 shows the wind shield installed around the perimeter of the ISWS gage. The 30-degree horizontal view is clear; the photographs in figure 2.30 show that there are no obstructions near the gage.
Photographs of Rain Gage at South Shore, Illinois (414527087323801). A, North view. B, Northeast view. C, East view. D, Southeast view. E, South view. F, Southwest view. G, West view. H, Northwest view. Photographs by Kevin K. Johnson, U.S. Geological Survey.
Rain Gage at Chicago Sanitary and Ship Canal near Lemont, Illinois (414129087575201)
The rain gage is located at north latitude 41.6912389 and west longitude 87.96380278 degrees and is collocated with the Chicago Sanitary and Ship Canal near Lemont, Ill., streamgage (USGS station 05536890). The rain gage was installed on May 30, 2019, and at the time of installation was 4,600 feet (1,402 meters) due north of the rain gage operated by the ISWS. This is one of the two sites that was not within the 0.62-mile (1-kilometer) radius of the ISWS rain gages. The gage setup is different than the others in the network because of its colocation with the river monitoring station. The equipment is housed inside the gage structure. A Campbell Scientific CR-6 datalogger is connected to a Pepwave cellular modem, a 12-volt deep cycle battery powers the equipment, and power is available to charge the battery. An OTT Pluvio2 L weighing bucket type rain gage is mounted on top of a 4-inch (0.102-meter) aluminum pipe 16 feet (4.88 meters) northwest of the gage house. The rim opening of the rain gage is set at 3.85 feet (1.17 meters) above the ground surface. The installation setup is shown in figure 2.31.
Photograph of the northeast view of the Rain Gage at Chicago Sanitary and Ship Canal near Lemont, Illinois (414129087575201). Photograph by Kevin K. Johnson, U.S. Geological Survey.
Potential obstructions near the gage are visible in the photographs in figure 2.32. Horizontal obstructions include trees to the north at 34 feet (10.4 meters), the new gage house at 17 feet (5.2 meters) and trees at 32 feet (9.8 meters) to the east, only the canal to the south, and trees to the east at 34 feet (110.4 meters). The 30-degree view of obstructions includes the peak of the gage house to the east, but no other obstructions are within the 30-foot (9.1-meter) radius (fig. 2.32).
Photographs of the Rain Gage at Chicago Sanitary and Ship Canal near Lemont, Illinois (414129087575201). A, North view. B, Northeast view. C, East view. D, Southeast view. E, South view. F, Southwest view. G, West view. H, Northwest view. Photographs by Kevin K. Johnson, U.S. Geological Survey.
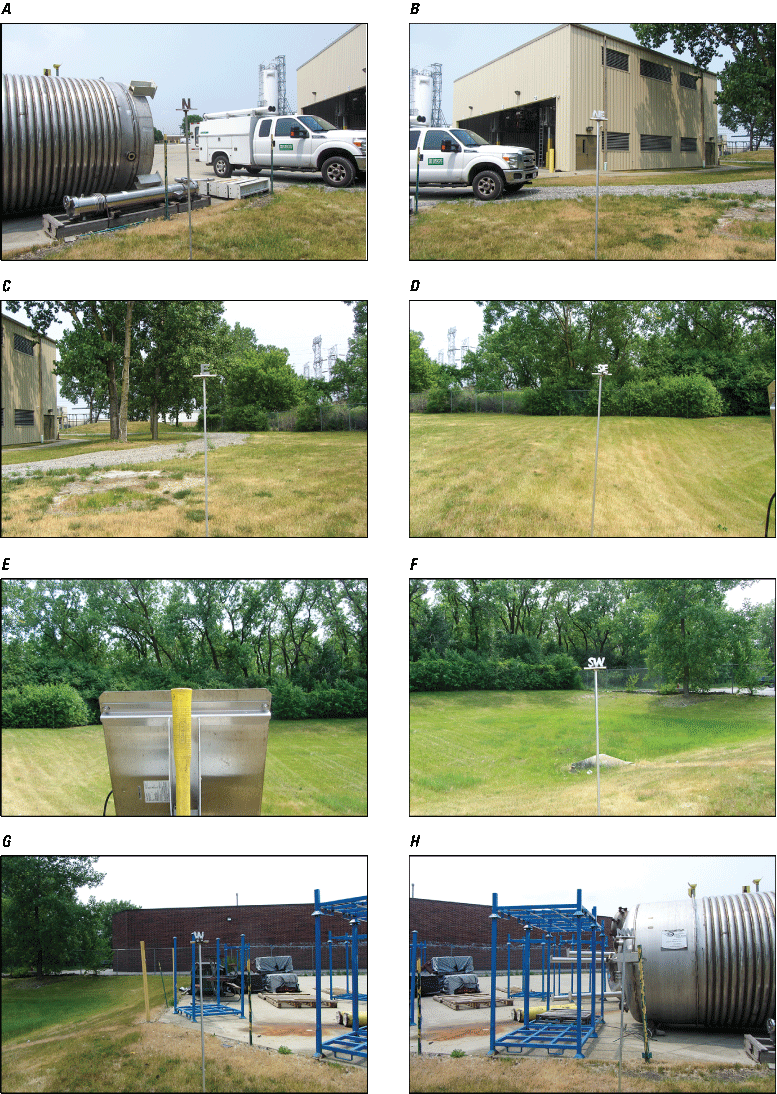
Rain Gage at Palos Park, Illinois (413912087522801)
The rain gage is located at north latitude 41.6532222 and west longitude 87.87453611 degrees, it is on the southwest side of the Palos Fire Protection District Station 2 in a grassy area adjacent to the parking lot. The gage was installed on August 6, 2019, and at the time of installation was 3,765 feet (1,147 meters) south-southwest of the rain gage operated by the ISWS. The gage setup consists of a 1-cubic-foot stainless steel instrument box that houses a Campbell Scientific CR310/Cell210 that is a combination datalogger and cell modem, a 12-volt deep cycle battery, and a solar regulator. A 30-watt solar panel supplements power to the gage and is mounted to the instrument box. An OTT Pluvio2 L weighing bucket type rain gage is mounted on top of a 4-inch (0.102-meter) aluminum pipe 3 feet (0.91 meter) north of the instrument box. The rim opening of the rain gage is set at 4.02 feet (1.23 meters) above the ground surface. The installation setup is shown in figure 2.33.
Photograph of the northeast view of the Rain Gage at Palos Park, Illinois (413912087522801). Photograph by Kevin K. Johnson, U.S. Geological Survey.
The only potential obstruction near the gage is the Palos Fire Protection District Station Number 2 building at 38 feet (11.6 meters) to the northeast of the gage. The gage is generally surrounded by well-maintained grass in all directions. The 30-degree horizontal view is clear except for the fire station building at 42 feet (12.8 meters) (fig. 2.34).
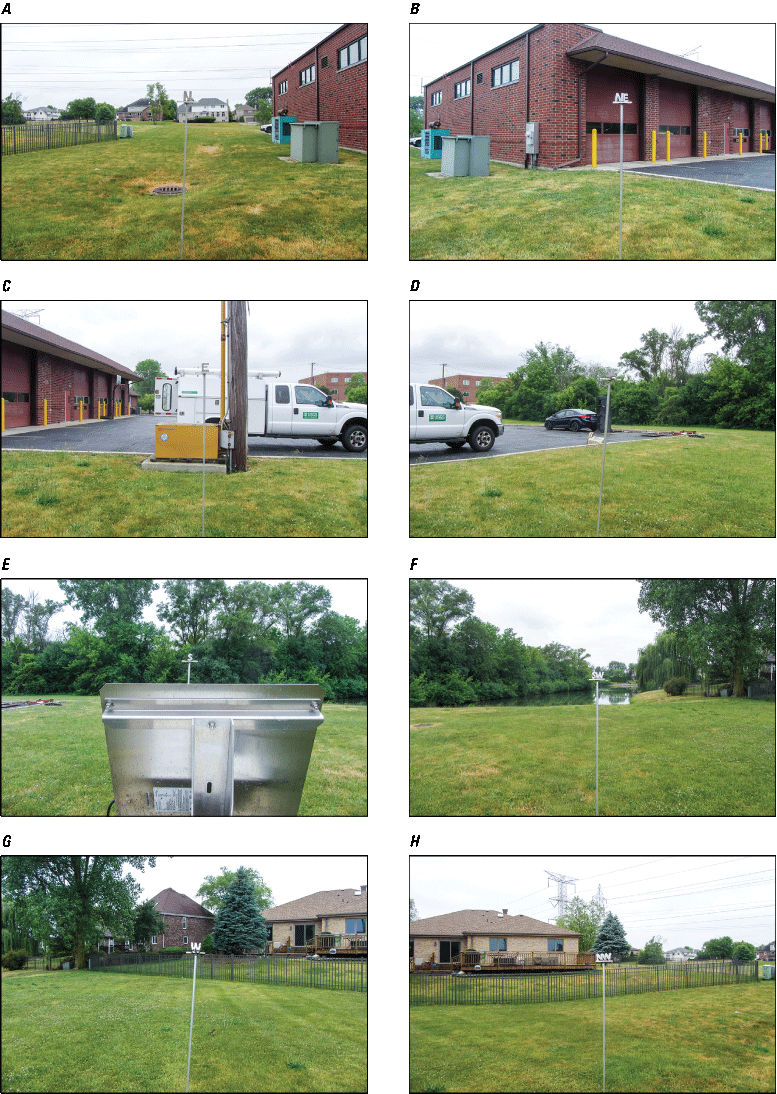
Photographs of the Rain Gage at Palos Park, Illinois (413912087522801). A, North view. B, Northeast view. C, East view. D, Southeast view. E, South view. F, Southwest view. G, West view. H, Northwest view. Photographs by Kevin K. Johnson, U.S. Geological Survey.
Rain Gage at Alsip, Illinois (414030087450001)
The rain gage is located at north latitude 41.6750000 and west longitude 87.75000278 degrees and is north of the grassy area at the Alsip Fire Department Station 2 between the building and the helipad. The gage was installed on June 27, 2019, and at the time of installation was 9 feet (2.9 meters) east of the rain gage operated by the ISWS (fig. 2.35). The gage setup consists of a 1-cubic-foot stainless steel instrument box that houses a Campbell Scientific CR310/Cell210 that is a combination datalogger and cell modem, a 12-volt deep cycle battery, and a solar regulator. A 30-watt solar panel supplements power to the gage and is mounted to the instrument box. An OTT Pluvio2 L weighing bucket type rain gage is mounted on top of a 4-inch (0.102-meter) aluminum pipe 3 feet (0.91 meter) north of the instrument box. The rim opening of the rain gage is set at 4.05 feet (1.23 meters) above the ground surface. The USGS rain gage installation setup and the final ISWS rain gage setup are shown in figure 2.35.
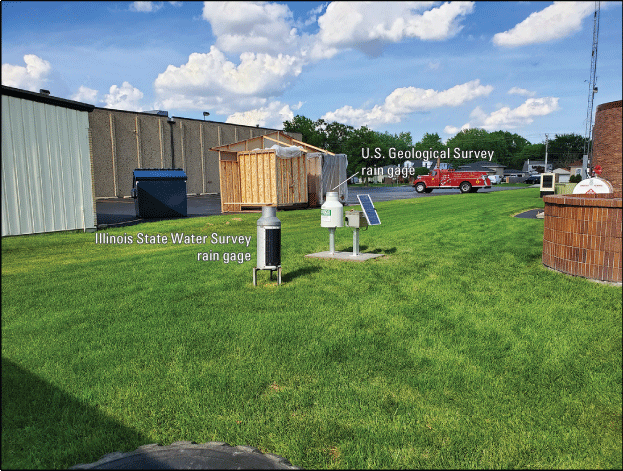
Photograph of the northeast view of the Rain Gage at Alsip, Illinois (414030087450001). Photograph by Kevin K. Johnson, U.S. Geological Survey.
Potential obstructions near the gage include a shed 32 feet (9.7 meters) to the north and a brick wall of a burn pit 12 feet (3.6 meters) to the south. The gage is generally surrounded by well-maintained grass at the fire station. The 30-degree horizontal view is clear in all directions (fig. 2.36) for at least 30 feet over the obstructions previously listed. In 2023, the neighboring property installed a 6-foot (1.83-meter) tall chain link fence with vinyl inserts. The corner of the fence is north and west of the gage, and there is a 16-foot (4.88-meter) space at the closest point to the gage. The 30-degree horizontal space remains clear of obstructions (fig. 2.36).
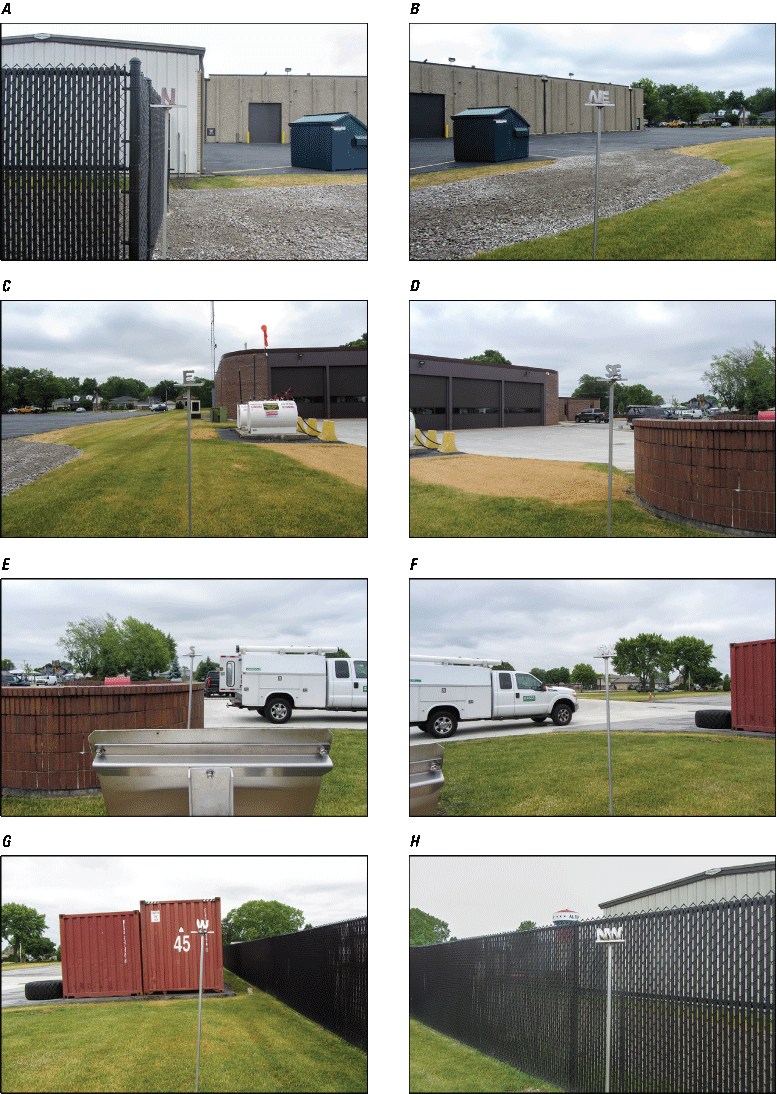
Photographs of the Rain Gage at Alsip, Illinois (414030087450001). A, North view. B, Northeast view. C, East view. D, Southeast view. E, South view. F, Southwest view. G, West view. H, Northwest view. Photographs by Kevin K. Johnson, U.S. Geological Survey.
Rain Gage at West Pullman at Chicago, Illinois (414028087383501)
The rain gage is located at north latitude 41.6744194 and west longitude 87.64298889 degrees and is in the southeast corner of the City of Chicago 34th Ward Streets and Sanitation Facility near the intersection of Halsted Street and 120th Street. The gage is in the grassy area away from trees and buildings. The gage was installed on August 11, 2020, and at the time of installation the rain gage operated by the ISWS had been discontinued and removed, and no concurrent data between the USGS and the ISWS were collected. The USGS location is 2,610 feet (795 meters) southeast of the last known location of the ISWS gage. The gage setup consists of a 1-cubic-foot stainless steel instrument box that houses a Campbell Scientific CR310/Cell210 that is a combination datalogger and cell modem, a 12-volt deep cycle battery, and a solar regulator. A 30-watt solar panel supplements power to the gage and is mounted to the instrument box. An OTT Pluvio2 L weighing bucket type rain gage is mounted on top of a 4-inch (0.102-meter) aluminum pipe 3 feet (0.91 meter) north of the instrument box. The rim opening of the rain gage is set at 3.71 feet (1.13 meters) above the ground surface. The installation setup is shown in figure 2.37.
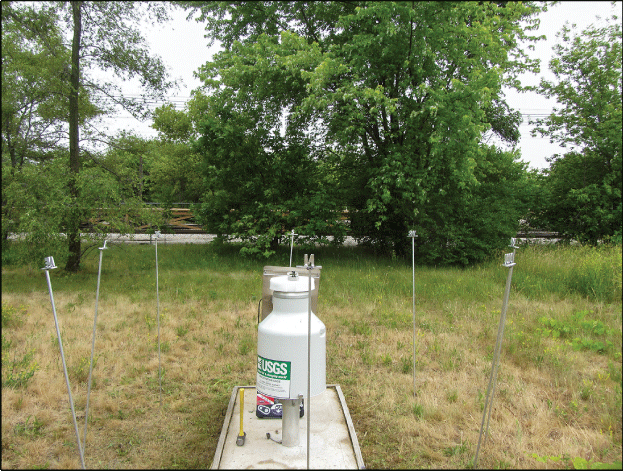
Photograph of the south view of the Rain Gage at West Pullman at Chicago, Illinois (414028087383501). Photograph by Kevin K. Johnson, U.S. Geological Survey.
Potential obstructions near the gage include open grass to the north and west, a group of trees to the east beginning at 27 feet (8.2 meters) from the gage, and a couple of trees to the south at 37 feet (11.3 meters). The surrounding grass is not well-maintained and is only cut once or twice each year (fig. 2.38). A radius of 10 feet (3.0 meters) around the gage is trimmed during each service and calibration visit. The 30-degree horizontal view from the gage is free of obstructions except for the trees that are outside of the 30-foot (9.1-meter) radius.
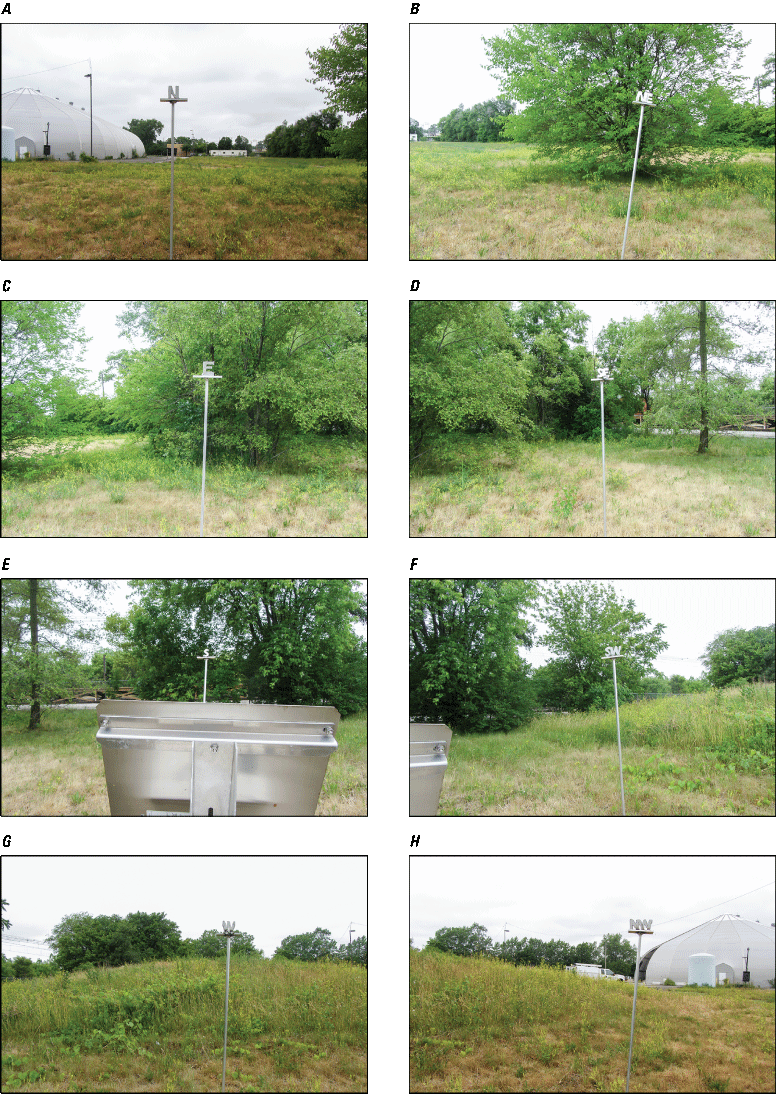
Photographs of the Rain Gage at West Pullman at Chicago, Illinois (414028087383501). A, North view. B, Northeast view. C, East view. D, Southeast view. E, South view. F, Southwest view. G, West view. H, Northwest view. Photographs by Kevin K. Johnson, U.S. Geological Survey.
Rain Gage at Hegewisch, Illinois (414045087322301)
The rain gage is located at north latitude 41.6791861 and west longitude 87.53982778 degrees and is on the southwest corner of the Gallo Equipment Company Facility at 11835 S Avenue O, in a grassy area adjacent to the equipment parking. The gage was installed on July 17, 2019, and at the time of installation was 75 feet (23 meters) north-northwest of the rain gage operated by the ISWS. The gage setup consists of a 1-cubic-foot stainless steel instrument box that houses a Campbell Scientific CR310/Cell210 that is a combination datalogger and cell modem, a 12-volt deep cycle battery, and a solar regulator. A 30-watt solar panel supplements power to the gage and is mounted to the instrument box. An OTT Pluvio2 L weighing bucket type rain gage is mounted on top of a 4-inch (0.102-meter) aluminum pipe 3 feet (0.91 meter) north of the instrument box. The rim opening of the rain gage is set at 3.97 feet (1.21 meters) above the ground surface. The installation setup is shown in figure 2.39.
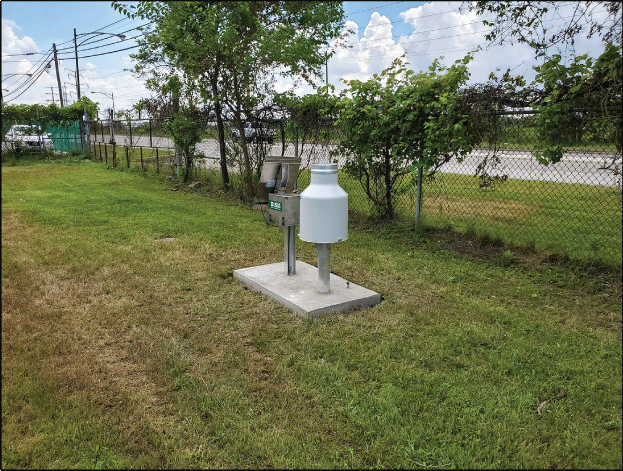
Photograph of the south view of the Rain Gage at Hegewisch, Illinois (414045087322301). Photograph by Kevin K. Johnson, U.S. Geological Survey.
Potential obstructions near the gage include an 8-foot (2.4-meter) chain link fence and a couple of trees 15 feet (4.6 meters) to the west of the gage, a pontoon boat parked 22 feet (6.7 meters) to the east, and maintained grass to the north and south. The gage is generally surrounded by well-maintained grass at the Gallo Equipment Company. The 30-degree horizontal view is clear in all but the west direction (fig. 2.40) for at least 30 feet (9.1 meters) over the obstructions previously listed. The fence on the west side obscures the 30-degree opening at 20 feet (6.1 meters).
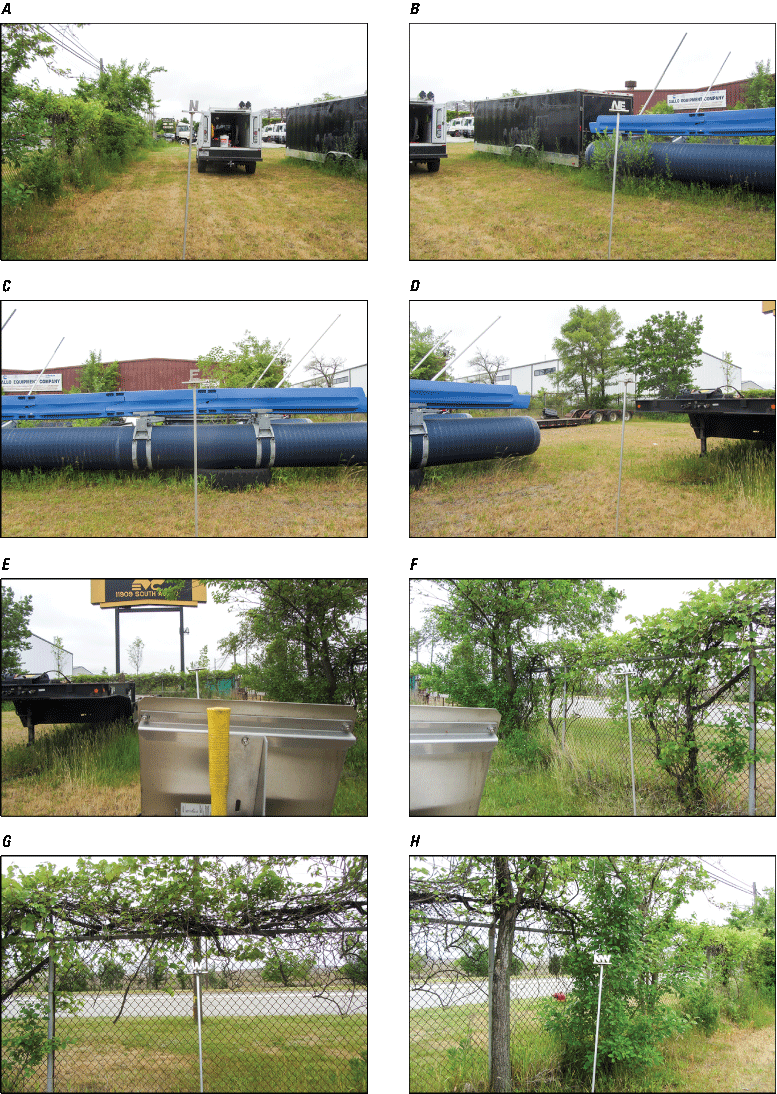
Photographs of the Rain Gage at Hegewisch, Illinois (414045087322301). A, North view. B, Northeast view. C, East view. D, Southeast view. E, South view. F, Southwest view. G, West view. H, Northwest view. Photographs by Kevin K. Johnson, U.S. Geological Survey.
Rain Gage at Orland Park, Illinois (413514087523501)
The rain gage is located at north latitude 41.5872972 and west longitude 87.87655278 degrees and is on the west side of the Panduit Corporation Facility at 10500 W 167th St. in a grassy area adjacent to the employee parking. The gage was installed on September 12, 2019, and at the time of installation was 11 feet (3.4 meters) south of the rain gage operated by the ISWS. The gage setup consists of a 1-cubic-foot stainless steel instrument box that houses a Campbell Scientific CR310/Cell210 that is a combination datalogger and cell modem, a 12-volt deep cycle battery, and a solar regulator. A 30-watt solar panel supplements power to the gage and is mounted to the instrument box. An OTT Pluvio2 L weighing bucket type rain gage is mounted on top of a 4-inch (0.102-meter) aluminum pipe 3 feet (0.91 meter) north of the instrument box. The rim opening of the rain gage is set at 3.95 feet (1.20 meters) above the ground surface. The installation setup and the location of the USGS gage relative to the ISWS gage are shown in figure 2.41.
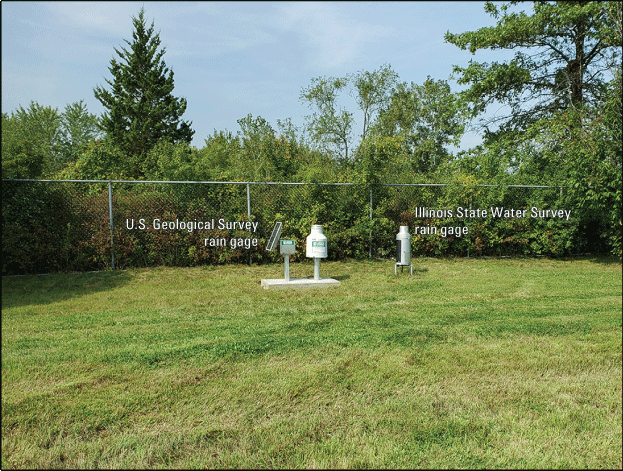
Photograph of the northwest view of the Rain Gage at Orland Park, Illinois (413514087523501). Photograph by Kevin K. Johnson, U.S. Geological Survey.
Potential obstructions near the gage include an 8-foot (2.4-meter) chain link fence, a couple of trees 9 feet (2.7 meters) to the west of the gage, and maintained grass to the east, north, and south. The gage is generally surrounded by well-maintained grass at the Panduit Corporation. The 30-degree horizontal view is clear in all but the west direction (fig. 2.42) for at least 30 feet (9.1 meters) over the obstructions previously listed. The fence on the west side obscures the 30-degree opening at 11.2 feet (3.4 meters).
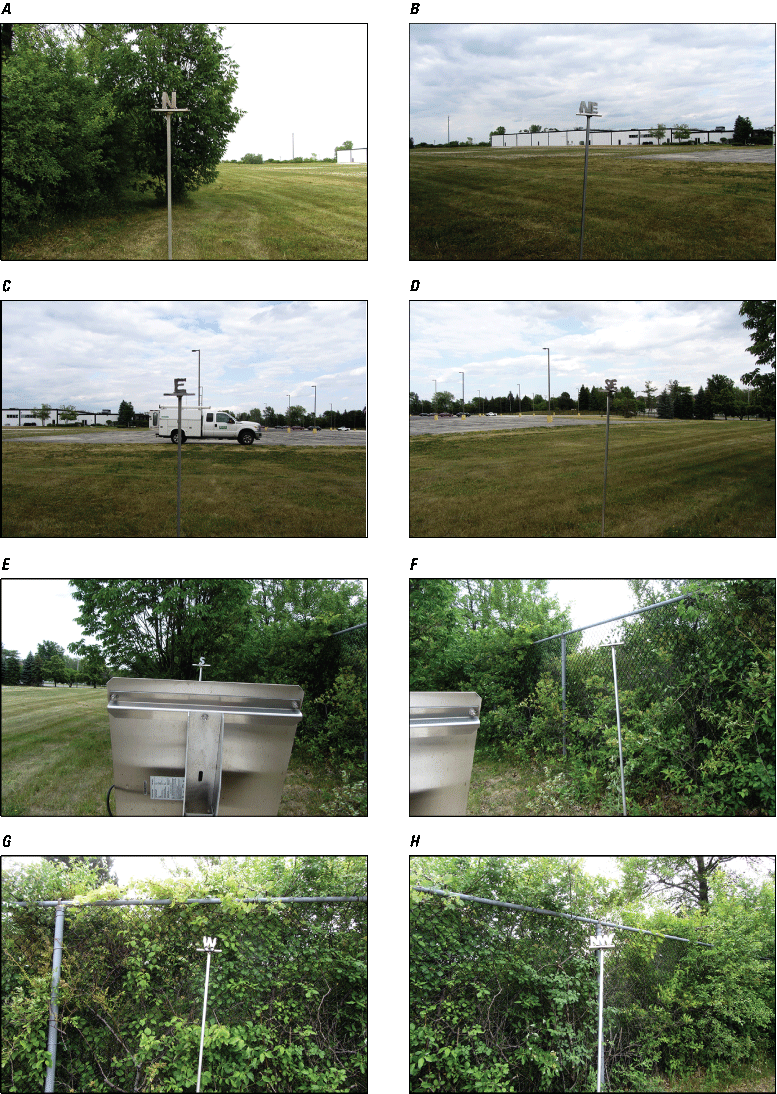
Photographs of the Rain Gage at Orland Park, Illinois (413514087523501). A, North view. B, Northeast view. C, East view. D, Southeast view. E, South view. F, Southwest view. G, West view. H, Northwest view. Photographs by Kevin K. Johnson, U.S. Geological Survey.
Rain Gage at Oak Forest, Illinois (413516087442101)
The rain gage is located at north latitude 41.5877361 and west longitude 87.73896667 degrees and is on the east side of the back grassy area of the Oak Forest Fire Department. The gage was installed on June 26, 2019, and at the time of installation was 2,625 feet (800 meters) east of the rain gage operated by the ISWS. The gage setup consists of a 1-cubic-foot stainless steel instrument box that houses a Campbell Scientific CR310/Cell210 that is a combination datalogger and cell modem, a 12-volt deep cycle battery, and a solar regulator. A 30-watt solar panel supplements power to the gage and is mounted to the instrument box. An OTT Pluvio2 L weighing bucket type rain gage is mounted on top of a 4-inch (0.102-meter) aluminum pipe 3 feet (0.91 meter) north of the instrument box. The rim opening of the rain gage is set at 3.96 feet (1.21 meters) above the ground surface. The installation setup of the USGS precipitation gage is shown in figure 2.43.
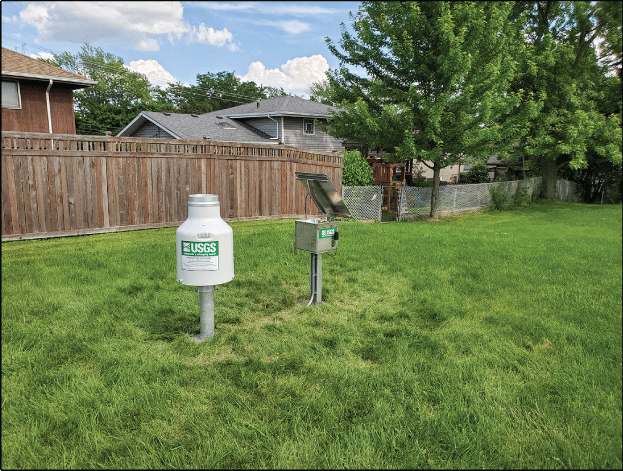
Photograph of the Rain Gage at Oak Forest, Illinois (413516087442101). Photograph by Kevin K. Johnson, U.S. Geological Survey.
Potential obstructions near the gage include a cedar fence 22 feet (13.4 meters) to the east, well-maintained grass in all other directions, and some parking to the north. The 30-degree horizontal view is clear in all directions (fig. 2.44) for at least 30 feet over the obstructions previously listed.
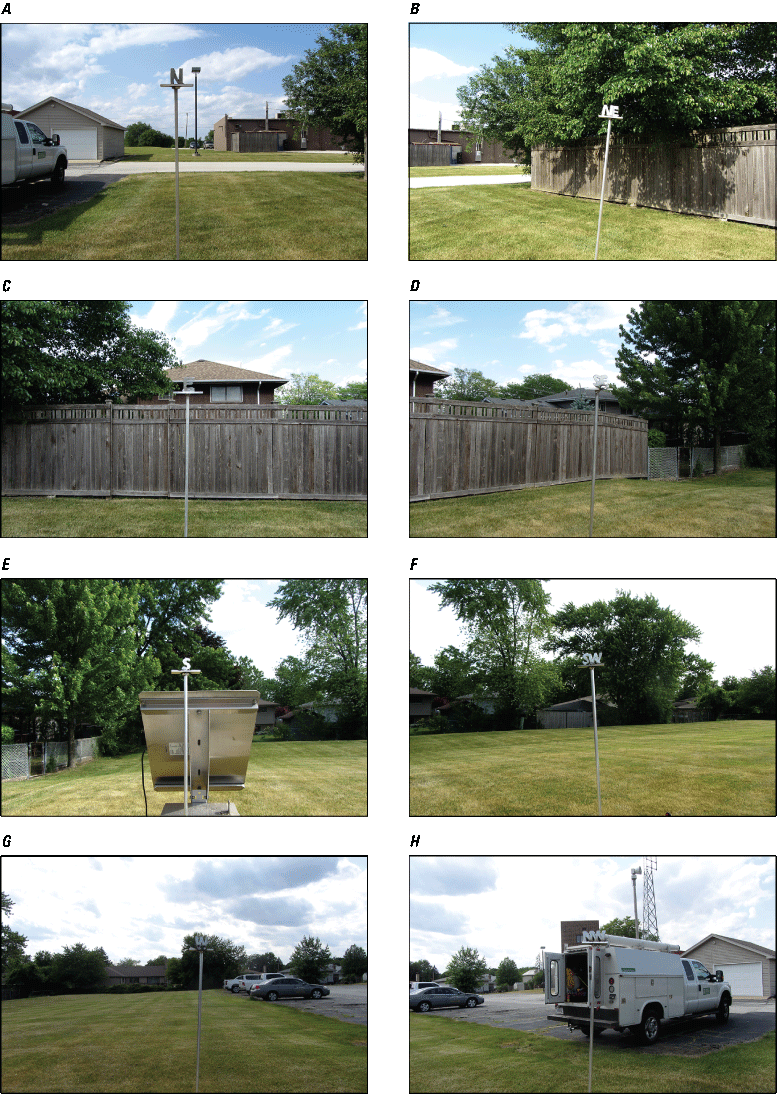
Photographs of the Rain Gage at Oak Forest, Illinois (413516087442101). A, North view. B, Northeast view. C, East view. D, Southeast view. E, South view. F, Southwest view. G, West view. H, Northwest view. Photographs by Kevin K. Johnson, U.S. Geological Survey.
Rain Gage at Harvey, Illinois (413510087380201)
The rain gage is located at north latitude 41.5861806 and west longitude 87.63387778 degrees and is in the northwest corner of the Whimsy Intermodal Facility at 400 E 167th St. in a grassy area adjacent to the visitor parking. The gage was installed on June 13, 2019, and at the time of installation was 34 feet (10 meters) north of the rain gage operated by the ISWS (fig. 2.45). The gage setup consists of a 1-cubic-foot stainless steel instrument box that houses a Campbell Scientific CR310/Cell210 that is a combination datalogger and cell modem, a 12-volt deep cycle battery, and a solar regulator. A 30-watt solar panel supplements power to the gage and is mounted to the instrument box. An OTT Pluvio2 L weighing bucket type rain gage is mounted on top of a 4-inch (0.102-meter) aluminum pipe 3 feet (0.91 meter) north of the instrument box. The rim opening of the rain gage is set at 4.10 feet (1.25 meters) above the ground surface.
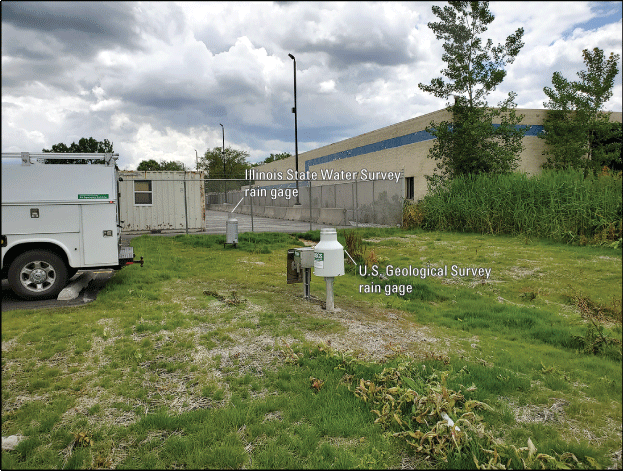
Photograph of the southwest view of the Rain Gage at Harvey, Illinois (413510087380201). Photograph by Kevin K. Johnson, U.S. Geological Survey.
Potential obstructions objects near the gage include a chain link fence 44 feet (13.4 meters) to the south, and weeds and tall grass begin at 33 feet (10.1 meters) to the west. On the north and east, it is maintained grass and some parking to the east. The 30-degree horizontal view is clear in all directions (fig. 2.46) for at least 30 feet over the obstructions previously listed.
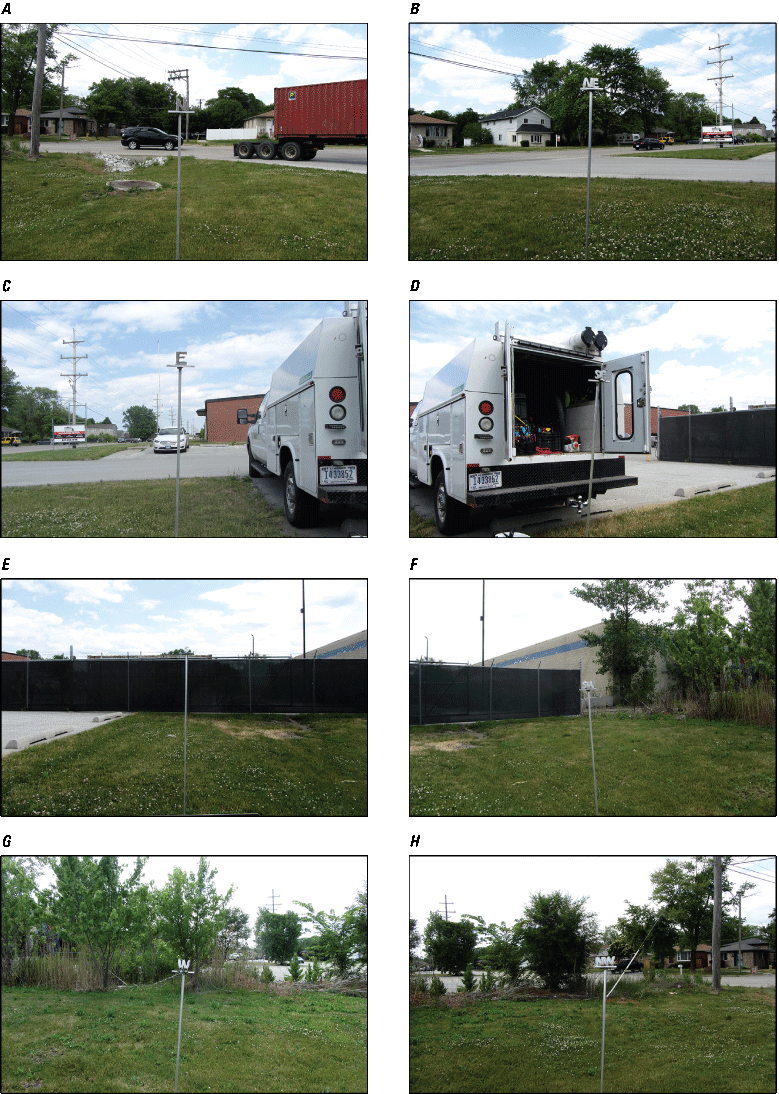
Photographs of the Rain Gage at Harvey, Illinois (413510087380201). A, North view. B, Northeast view. C, East view. D, Southeast view. E, South view. F, Southwest view. G, West view. H, Northwest view. Photographs by Kevin K. Johnson, U.S. Geological Survey.
Rain Gage at Lansing, Illinois (413518087324901)
The rain gage is located at north latitude 41.5883667 and west longitude 87.54700556 degrees and is in the northwest quarter of the Lansing Police Department Complex due west of the shooting range. The gage was installed on June 12, 2019, and at the time of installation was 234 feet (71 meters) north northeast of the rain gage operated by the ISWS. The gage setup consists of a 1-cubic-foot stainless steel instrument box that houses a Campbell Scientific CR310/Cell210 that is a combination datalogger and cell modem, a 12-volt deep cycle battery, and a solar regulator. A 30-watt solar panel supplements power to the gage and is mounted to the instrument box. An OTT Pluvio2 L weighing bucket type rain gage is mounted on top of a 4-inch (0.102-meter) aluminum pipe 3 feet (0.91 meter) north of the instrument box. The rim opening of the rain gage is set at 4.15 feet (1.26 meters) above the ground surface. The installation setup of the USGS precipitation gage is shown in figure 2.47.
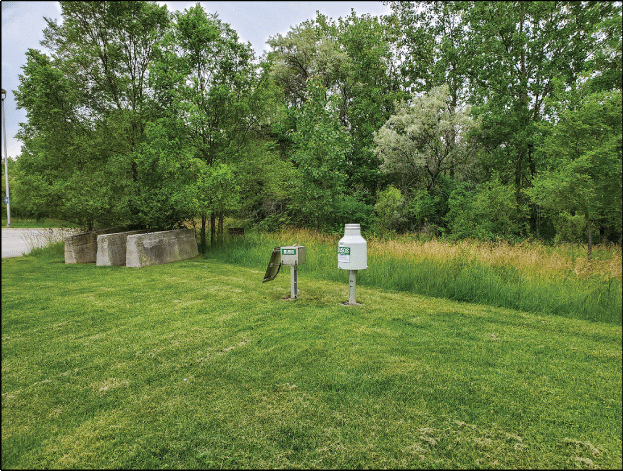
Photograph of the southwest view of the Rain Gage at Lansing, Illinois (413518087324901). Photograph by Kevin K. Johnson, U.S. Geological Survey.
Potential obstructions near the gage include the police indoor shooting range building at 35 feet (10.7 meters) to the east of the gage, a tree at 29 feet (8.8 meters) to the south, a small new growth tree line at 35 feet (10.7 meters) to the west, and open grass to the north. The 30-degree horizontal view is clear in all directions (fig. 2.48) for at least 30 feet over the obstructions previously listed.
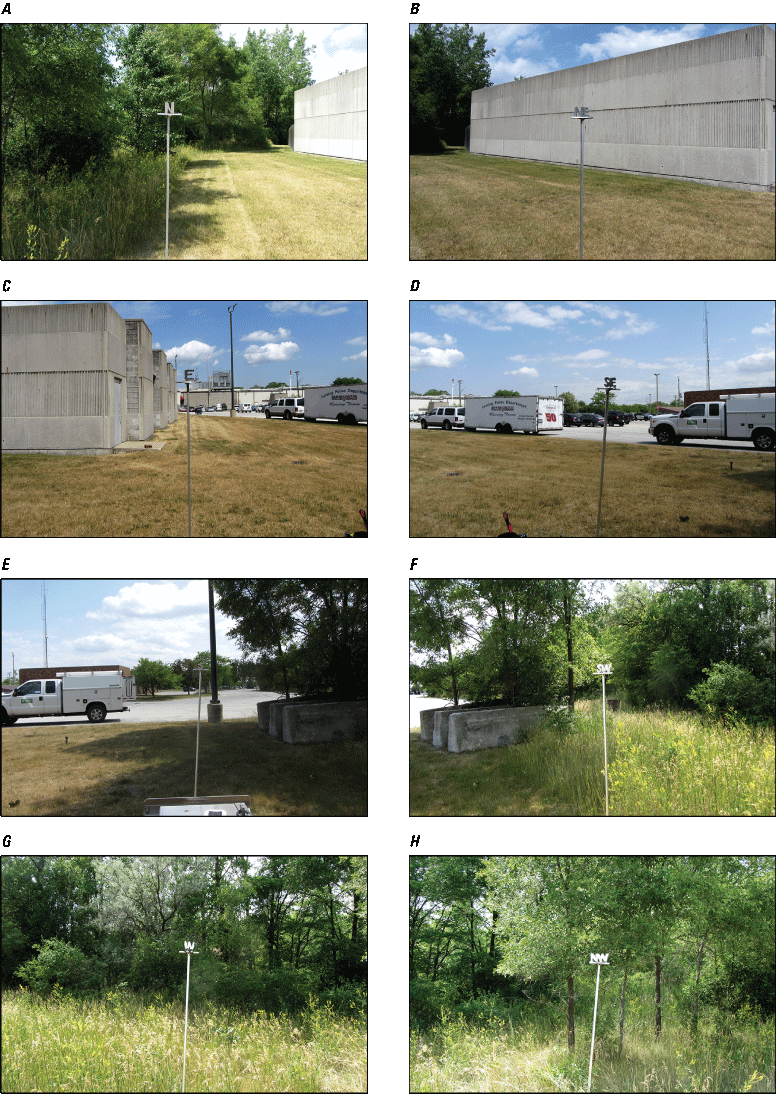
Photographs of the Rain Gage at Lansing, Illinois (413518087324901). A, North view. B, Northeast view. C, East view. D, Southeast view. E, South view. F, Southwest view. G, West view. H, Northwest view. Photographs by Kevin K. Johnson, U.S. Geological Survey.
Rain Gage at Matteson, Illinois (413104087440001)
The rain gage is located at north latitude 41.5179111 and west longitude 87.73340278 degrees and is on the north side of the Matteson Police Department in a grassy area adjacent to a vacant overgrown field. The gage was installed on August 10, 2019, and at the time of installation was 130 feet (39.7 meters) west of the rain gage operated by the ISWS. The gage setup consists of a 1-cubic-foot stainless steel instrument box that houses a Campbell Scientific CR310/Cell210 that is a combination datalogger and cell modem, a 12-volt deep cycle battery, and a solar regulator. A 30-watt solar panel supplements power to the gage and is mounted to the instrument box. An OTT Pluvio2 L weighing bucket type rain gage is mounted on top of a 4-inch (0.102-meter) aluminum pipe 3 feet (0.91 meter) north of the instrument box. The rim opening of the rain gage is set at 4.02 feet (1.23 meters) above the ground surface. The installation setup of the USGS precipitation gage is shown in figure 2.49.
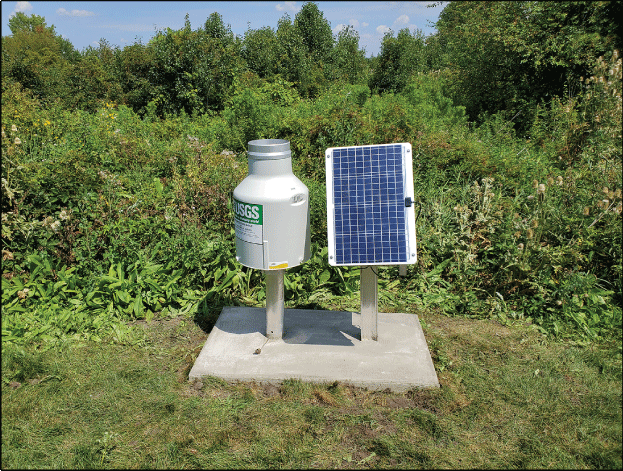
Photograph of the north view of the Rain Gage at Matteson, Illinois (413104087440001). Photograph by Kevin K. Johnson, U.S. Geological Survey.
The gage is mostly surrounded by well-maintained grass; the Matteson Police Station is 32 feet (9.8 meters) to the south from the gage, and weeds have the potential for growth up to 6 feet (1.8 meters) high as a potential obstructing object near the gage to the north. The weeds are generally maintained at each visit. The 30-degree horizontal view is clear except for the police station to the south (fig. 2.50).
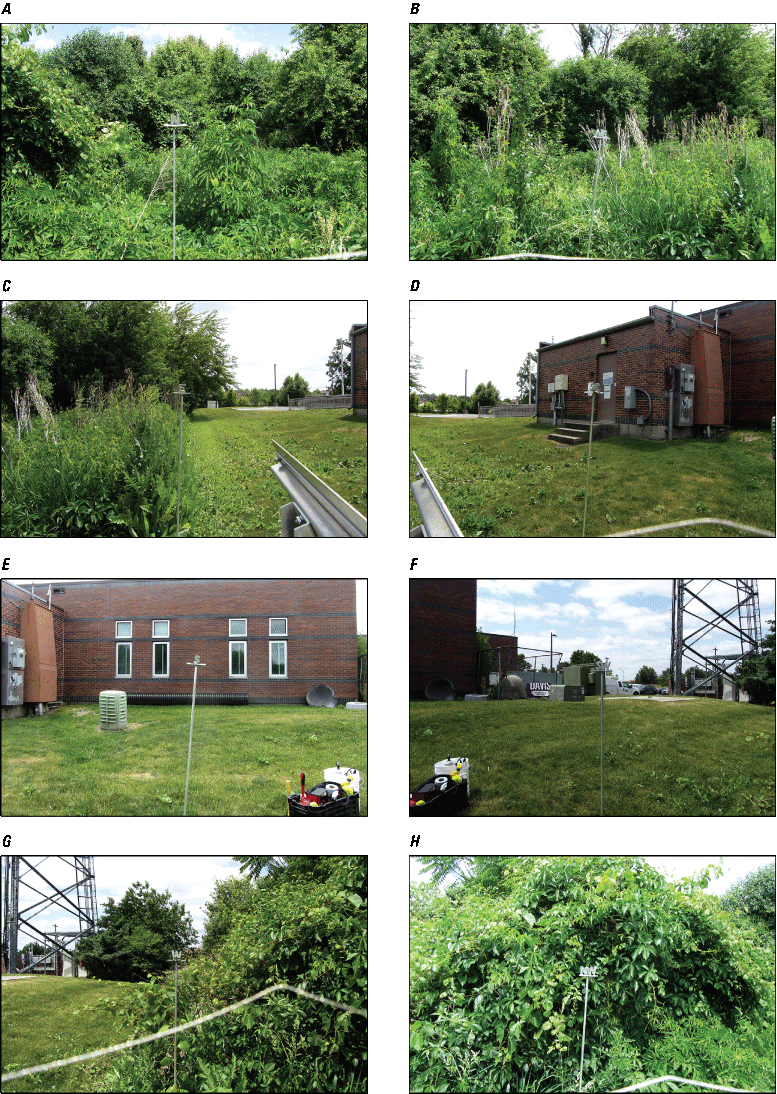
Photographs of the Rain Gage at Matteson, Illinois (413104087440001). A, North view. B, Northeast view. C, East view. D, Southeast view. E, South view. F, Southwest view. G, West view. H, Northwest view. Photographs by Kevin K. Johnson, U.S. Geological Survey.
Rain Gage at Deer Creek near Chicago Heights, Illinois (413115087352501)
The rain gage is located at north latitude 41.5209167 and west longitude 87.59026944 degrees and is collocated with the Deer Creek near Chicago Heights, Ill., streamgage (USGS station 05536235). The rain gage was installed on June 7, 2019, and at the time of installation was 0.80 mile (1.29 kilometers) due west of the rain gage operated by the ISWS. This the second of the two sites that were not within the 0.62-mile (1-kilometer) radius of the ISWS rain gages. The gage setup is different from the other gages in the network because of its colocation with the river monitoring station. The equipment is housed inside the river monitoring gage structure. The gage setup consists of a Campbell Scientific CR310/Cell210 that is a combination datalogger and cell modem, a 12-volt deep cycle battery, and a solar regulator. A 30-watt solar panel supplements power to the gage and is mounted to the instrument box. An OTT Pluvio2 L weighing bucket type rain gage is mounted on top of a 4-inch (0.102-meter) aluminum pipe 15 feet (4.57 meters) west of the gage structure. The rim opening of the rain gage is set at 3.95 feet (1.20 meters) above the ground surface. The installation setup of the USGS precipitation gage is shown in figure 2.51.
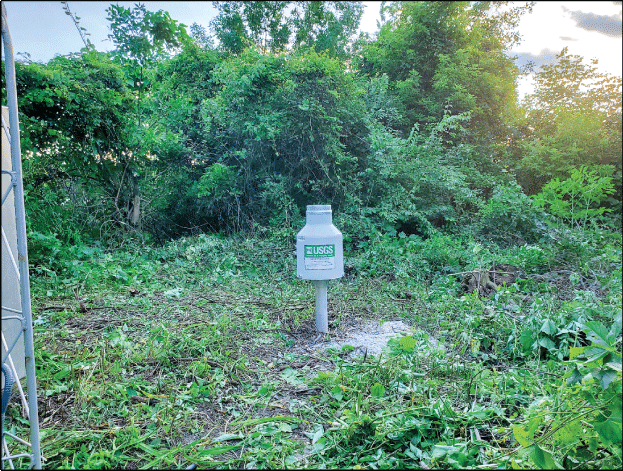
Photograph of the west view of the Rain Gage at Deer Creek near Chicago Heights, Illinois (413115087352501). Photograph by Kevin K. Johnson, U.S. Geological Survey.
Potential obstructions near the gage are riparian shrubs and grasses that are maintained for a radius of 15 to 20 feet (4.5 to 6.1 meters) around the gage. The gage structure is 15 feet (4.57 meters) to the east. The 30-degree horizontal view is clear in all directions (fig. 2.52) over the vegetation and gage structure.
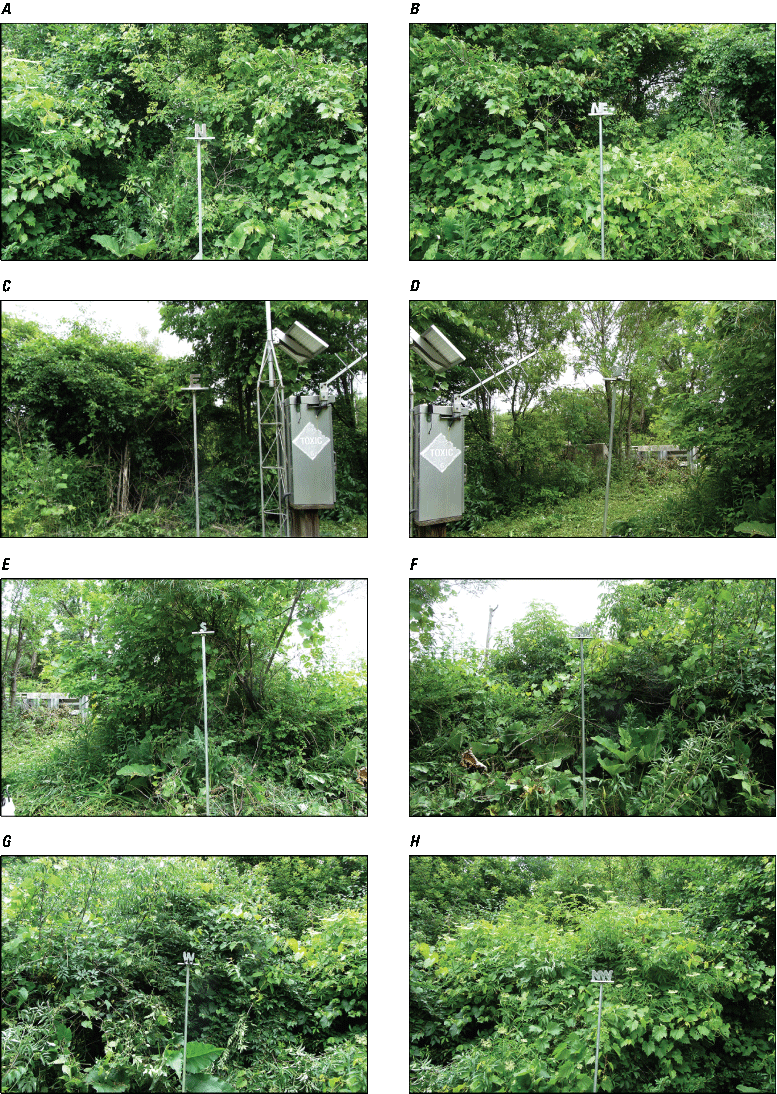
Photographs of the Rain Gage at Deer Creek near Chicago Heights, Illinois (413115087352501). A, North view. B, Northeast view. C, East view. D, Southeast view. E, South view. F, Southwest view. G, West view. H, Northwest view. Photographs by Kevin K. Johnson, U.S. Geological Survey.
Supplemental Information
A water year is a continuous 12-month period, from October 1 through September 30, and is designated by the year in which it ends.
For more information about this publication, contact:
Director, USGS Central Midwest Water Science Center
405 North Goodwin
Urbana, IL 61801
217–328–8747
For additional information, visit: https://www.usgs.gov/centers/cm-water
Publishing support provided by the
Rolla and Reston Publishing Service Centers
Disclaimers
Any use of trade, firm, or product names is for descriptive purposes only and does not imply endorsement by the U.S. Government.
Although this information product, for the most part, is in the public domain, it also may contain copyrighted materials as noted in the text. Permission to reproduce copyrighted items must be secured from the copyright owner.
Suggested Citation
Johnson, K.K., 2026, Comparison of two precipitation gage networks in Cook County, Illinois: U.S. Geological Survey Scientific Investigations Report 2025–5102, 73 p., https://doi.org/10.3133/sir20255102.
ISSN: 2328-0328 (online)
Study Area
| Publication type | Report |
|---|---|
| Publication Subtype | USGS Numbered Series |
| Title | Comparison of two precipitation gage networks in Cook County, Illinois |
| Series title | Scientific Investigations Report |
| Series number | 2025-5102 |
| DOI | 10.3133/sir20255102 |
| Publication Date | January 20, 2026 |
| Year Published | 2026 |
| Language | English |
| Publisher | U.S. Geological Survey |
| Publisher location | Reston, VA |
| Contributing office(s) | Central Midwest Water Science Center |
| Description | Report: iv, 73 p.; Linked Appendix Table; Dataset |
| Country | United States |
| State | Illinois |
| County | Cook county |
| Online Only (Y/N) | Y |
| Additional Online Files (Y/N) | Y |