

Flood-Inundation Maps for Río Grande De Loíza In and Near Caguas, Puerto Rico, 2026
Links
- Document: Report (3.16 MB pdf) , HTML , XML
- Data Release: USGS data release - Geospatial data sets and hydraulic model for Río Grande De Loíza in Caguas, Puerto Rico
- NGMDB Index Page: National Geologic Map Database Index Page (html)
- Download citation as: RIS | Dublin Core
Acknowledgments
The authors thank the Autoridad de Acueductos y Alcantarillados de Puerto Rico (Puerto Rico Aqueduct and Sewer Authority) for their financial support of the streamgage referred to in this report. The authors would also like to thank the U.S. Geological Survey Supplemental Oversight Team, which received funding for this effort through title VII of division N in the Consolidated Appropriations Act, 2023 (Public Law 117–328, 136 Stat. 5215; Hinck and Stachyra, 2023).
Abstract
Digital flood-inundation maps for a 2.7-mile reach of Río Grande De Loíza in Caguas, Puerto Rico, were created by the U.S. Geological Survey. Water-surface profiles were computed for the stream reach by using a one-dimensional, steady-state, step-backwater model. The model was calibrated to the current (2025) stage-streamflow relation (rating curve) for the U.S. Geological Survey streamgage 50055000, Río Grande De Loíza, Puerto Rico. The resulting hydraulic model was then used to compute 16 water-surface profiles for water levels (flood stages) ranging from 19.00 to 34.00 feet at the streamgage; these flood stages range from “moderate flood stage” to above “major flood stage” as defined by the National Weather Service. The 34.00-foot stage exceeds the historical maximum peak stage of 33.20 feet, recorded at the streamgage in 1945. The simulated water-surface profiles were used in combination with a digital elevation model derived from light detection and ranging (lidar) data to map the inundated areas associated with each flood profile.
The flood-inundation maps and the supporting hydraulic model produced by this study can be used by emergency managers and local officials to assess flood-mitigation strategies and to define flood-hazard areas to help protect life and property, to coordinate flood-response activities such as evacuations and road closures, and to aid post-flood recovery efforts.
Introduction
Caguas is a municipality in the central-eastern region of Puerto Rico. It forms part of the San Juan metropolitan area and is approximately 16 miles (mi) southeast of the capital city of San Juan. It is bordered by the municipalities of Aguas Buenas, Cayey, Cidra, Gurabo, San Juan, San Lorenzo, and Trujillo Alto (fig. 1). Caguas has 11 barrios (neighborhoods): Bairoa, Beatriz, Borinquen, Caguas Barrio-Pueblo, Cañabón, Cañaboncito, Río Cañas, San Antonio, San Salvador, Tomás de Castro, and Turabo (Municipality of Caguas, 2020). It is the 18th largest municipality in Puerto Rico by total area, with an estimated population of 124,628 (U.S. Census Bureau, 2024).
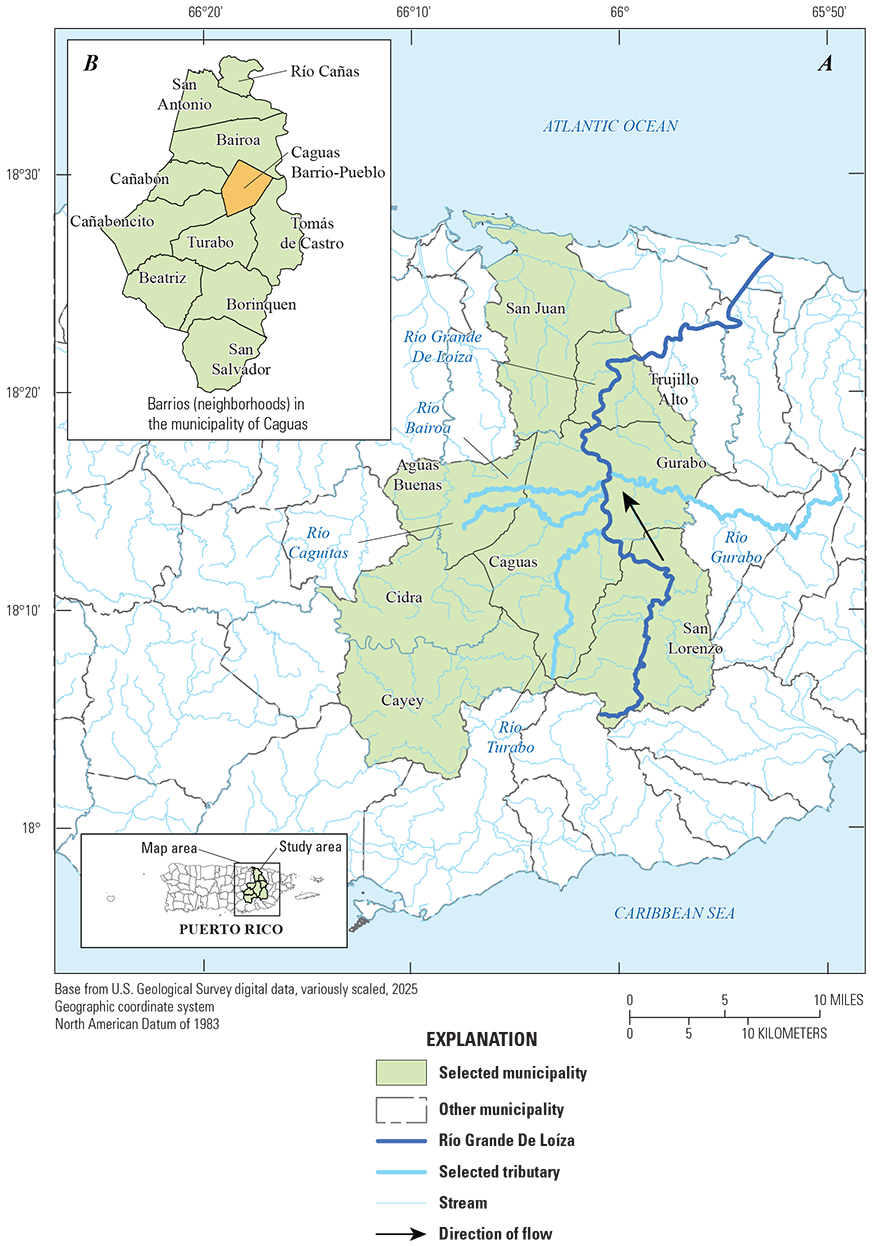
Map showing (A) the municipalities along Río Grande De Loíza and selected tributaries and (B) the barrios (neighborhoods) of the municipality of Caguas.
The municipality is traversed by several rivers, including the Río Grande De Loíza, the largest river in Puerto Rico by volume (mean annual flow of over 1.29 trillion cubic feet; Soler-López and Licha-Soler, 2012). This river and its tributaries—such as the Río Bairoa, Río Cagüitas, Río Gurabo, and Río Turabo—play a crucial role in the region’s hydrology. These waterways enrich the area’s fertile soils but also contribute to flood risk, particularly during periods of intense rainfall (Administración Municipal de Caguas, 2024). The municipality’s hazard mitigation plan (Municipality of Caguas, 2020) identifies landslides and flooding as the primary natural hazards and lists flooding as a high-priority concern. The plan proposes a range of mitigation strategies, emphasizing the benefits of floodplain management, early warning systems, and community preparedness.
To manage and reduce flood risk, authorities have implemented measures such as river stage monitoring and infrastructure improvements. The U.S. Geological Survey (USGS) operates streamgage 50055000, Río Grande De Loíza at Caguas, Puerto Rico (table 1), hereafter referred to as the “Caguas streamgage,” to support water resource management. Caguas has a well-documented history of severe flooding. One significant flood event occurred in May 1985, when up to 25 inches (in.) of rainfall caused widespread flooding in northern and north-central Puerto Rico, including Caguas (Quiñones and Johnson, 1987). During this event, the Caguas streamgage recorded a gage height of 21.40 feet (ft), exceeding the historical maximum of 33.20 ft, recorded in August 1945. More recently, in May 2025, after 2 weeks of continuous rainfall beginning on April 18, a state of emergency was declared in Caguas and several other municipalities. This event resulted in landslides and widespread flooding, and the Caguas streamgage recorded a peak stage height of 17.07 ft on May 2, 2025 (USGS, 2025d).
Table 1.
Summary of information for the U.S. Geological Survey streamgage at Caguas, Puerto Rico.[Streamgage data from U.S. Geological Survey (2025d). Horizontal coordinates are referenced to the North American Datum of 1927. Streamgage location is shown in figures 2 and 3. USGS, U.S. Geological Survey; P.R., Puerto Rico]
Several notable hurricanes have impacted Puerto Rico in recent decades, including Hurricane Georges (1998) and Hurricane María (2017). Even less intense storms, such as Hurricane Hortense (1996) and Hurricane Fiona (2022), have produced significant flooding in the region (Torres-Sierra, 1997, 2002; Pasch and others, 2023). As of 2024, the Federal Emergency Management Agency (FEMA) has allocated over $30 billion in post-María recovery funds, much of which is directed toward mitigation efforts aimed at increasing resilience to future storms (FEMA, 2024). Federal and State agencies have also undertaken initiatives to enhance hydrologic data collection and improve the capacity of water resource managers to respond to flood events. Examples of efforts by the USGS after Hurricane María include the development of hydraulic models to produce new rating curves for stations whose main channels were changed substantially and the use of indirect discharge measurement to estimate peak flows (Gómez-Fragoso and others, 2022).
To further help emergency managers and local officials to assess flood-mitigation strategies, define flood-hazard areas to help protect life and property, coordinate flood-response activities such as evacuations and road closures, and aid post-flood recovery efforts, the USGS created digital flood-inundation maps for a 2.7-mile reach of Río Grande De Loíza near Caguas, Puerto Rico. A total of 16 water-surface profiles were computed and mapped on a digital elevation model (DEM). Information about map limitations, associated uncertainties, viewing the maps online, and accessing associated data is included in this report.
Enhancing Flood-Risk Awareness
Information about the current stage at a USGS streamgage can be used by residents near the streamgage, but it is of limited use to residents upstream or downstream because the water-surface elevation is not constant along the stream reach. Knowing the stage at a streamgage does little to inform nearby residents and officials about the depth and area of flooding. One way to address these informational gaps is to produce a library of flood-inundation maps that are referenced to stages at the streamgages.
Uncertainty in the flood depth estimated from known stage increases with distance from the streamgage. To limit flood-depth uncertainty, flood-inundation mapping reaches are usually limited to where the change in drainage area, at the upstream and downstream reach limits compared to the streamgage location, is 10 percent or less. As a result, flood-inundation mapping may not be available upstream or downstream from a major tributary, even if the tributary enters the main channel near the streamgage.
By referring to the appropriate map, emergency responders can better understand the severity of flooding (depth of water and inundated area), identify roads that are or could soon be flooded, and make plans to notify or evacuate residents that could be in harm’s way. In addition, the ability to visualize the potential area of flooding on a map can motivate residents to take precautions and heed warnings that they previously may have disregarded (Kuser Olsen and others, 2018).
Study Area
The study area includes a 2.7-mile (mi) reach of Río Grande De Loíza that borders the community of Caguas, Puerto Rico (fig. 2). The limits of the hydraulic analyses of Río Grande De Loíza are from just upstream from the confluence of Río Caguitas (about 0.8 mi downstream from Puerto Rico Highway 30 [PR30]) at the downstream end, to just downstream from the confluence with Río Turabo (about 1.2 mi upstream from Puerto Rico Highway 189 [PR189]) at the upstream end. The contributing drainage area of the river at the Caguas streamgage is 89.8 square miles (mi2) (table 1). The Caguas streamgage began continuous records in November 1959 (table 2). From February 25, 1959, to November 17, 1959, only monthly measurements were made at the site. Prior to February 25, 1959, only low-flow and peak-flow measurements were made at the site. The area closest to the Caguas streamgage is primarily urban, but about 0.3 mi upstream from the streamgage the land is more forested and undeveloped, and about 1 mi downstream from the streamgage the land is a mix of suburban and undeveloped area.
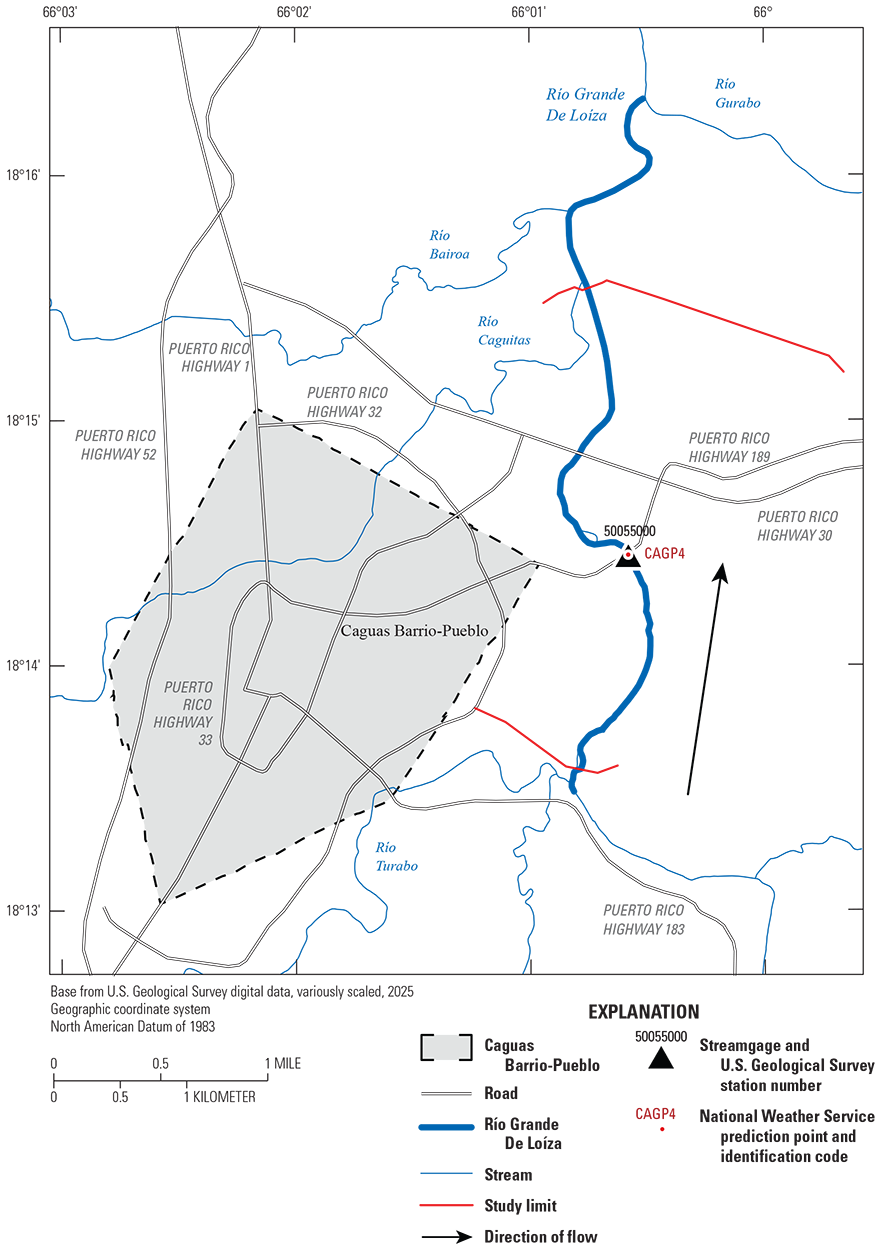
Map showing the study area along Río Grande De Loíza, selected roads and tributaries, and the location of the U.S. Geological Survey streamgage 50055000, Río Grande De Loíza at Caguas, Puerto Rico.
Table 2.
Maximum stage record for the U.S. Geological Survey streamgage at Caguas, Puerto Rico.[Streamgage data from U.S. Geological Survey (2025d). Streamgage location is shown in figures 2 and 3. USGS, U.S. Geological Survey; PRVD 02, Puerto Rico Vertical Datum of 2002; P.R., Puerto Rico]
Previous Studies
The flood insurance study for the Commonwealth of Puerto Rico and municipalities was published in November 2009 and was based on flood-insurance work that originated in 2007 (FEMA, 2009). For Río Grande De Loíza, the study re-delineated the areas prone to large floods corresponding to 10-, 2-, 1-, and 0.2-percent annual exceedance probability (AEP) floods. Selected AEPs (FEMA, 2009) for the Caguas streamgage location are shown in table 3.
Table 3.
Peak streamflows for selected annual exceedance probabilities for the U.S. Geological Survey streamgage 50055000, Río Grande De Loíza at Caguas, Puerto Rico.[Data from Federal Emergency Management Agency (2009). USGS, U.S. Geological Survey; mi2, square mile; ft3/s, cubic foot per second; P.R., Puerto Rico]
Streamflows were estimated by using regression equations in Ramos-Ginés (1999).
The detailed flooding analyses for Río Grande De Loíza in the 2009 flood insurance study include, and extend beyond, the upstream and downstream limits of the flood-inundation mapping study reach. Whereas the FEMA (2009) work provides flood-profile information for four flooding events (the 10-, 2-, 1-, and 0.2-percent AEP floods), the flood-inundation mapping work described in this report expands the available flood-profile information for the Caguas area by adding 16 water-surface profiles with current (as of February 2025) stream and hydraulic structure information.
Methods
The current (2025) stage-streamflow relation (rating number 30.1; USGS, 2025f) at the Caguas streamgage was used to input streamflows in the U.S. Army Corps of Engineers (USACE) Hydrologic Engineering Center’s River Analysis System (HEC–RAS) version 6.3.1 (USACE, 2025). The HEC–RAS software was used to develop 16 water-surface profiles, corresponding to stages from 19.00 to 34.00 ft in 1-ft increments (table 4).
Table 4.
Minimum and maximum target water-surface stages and National Weather Service designated stages for U.S. Geological Survey streamgage 50055000, Río Grande De Loíza at Caguas, Puerto Rico.[All data are in feet. P.R., Puerto Rico]
At the Caguas streamgage location, a stage of 9.00-ft corresponds approximately to bankfull conditions (NWS, 2025a; the National Weather Service refers to the Caguas streamgage location as CAGP4); “bankfull” is defined by the National Weather Service (NWS) as the “action stage” or “the stage which, when reached by a rising stream, represents the level where the NWS or a partner/user needs to take some type of mitigation action in preparation for possible significant hydrologic activity” (NWS, 2025b). The 19.00-ft stage is defined by the NWS as the “moderate flood stage” or “the inundation of secondary roads; transfer to higher elevation necessary to save property—some evacuation may be required” (NWS, 2025b). The 19.00-ft stage was chosen because it is the stage just before floodwater begins to directly affect homes and businesses.
The 34.00-ft stage was chosen because it exceeds the peak-of-record stage of 33.20 ft that was recorded in 1945 at the Caguas streamgage (table 2; USGS, 2025d) and the “major flood stage” (23.00 ft) as defined by the NWS. The NWS defines major flooding as “a general term including extensive inundation and property damage. (Usually characterized by the evacuation of people and livestock and the closure of both primary and secondary roads.)” (NWS, 2025b). In addition, the rated discharge associated with a stage of 34.00 ft is 93,300 cubic feet per second (ft3/s), which exceeds the peak-of-record discharge (from August 1945) of 85,000 ft3/s.
Standard Procedures for Creating a Flood Map
The USGS has standardized procedures for creating flood-inundation maps to ensure that the methods and products are consistent (USGS, 2025c). Tasks specific to development of the flood maps included (1) collecting topographic, bathymetric, and geometric data for selected cross sections and structures (such as bridges or culverts) along the study reach, (2) estimating energy-loss factors (roughness coefficients) in the stream channel and floodplain, (3) computing streamflows for each stage to be modeled, (4) computing and calibrating water-surface profiles using HEC–RAS (USACE, 2025), (5) producing estimated flood-inundation maps for selected stages using RAS Mapper (a feature within HEC–RAS; USACE, undated) and a geographic information system (GIS), and (6) preparing maps as shapefile polygons that depict the area of flood inundation and as depth grids that provide the depth of floodwaters, available through a USGS flood-inundation mapping application. These methods follow procedures described in Bales and others (2007) and Whitehead and Ostheimer (2009). Techniques that were modified from previously documented methods to accommodate local hydrologic conditions or availability of data as a part of this work are described in this report.
Topographic Data
The topographic data used in this study are referenced vertically to the Puerto Rico Vertical Datum of 2002 (PRVD 02) and horizontally to the North American Datum of 1983 (NAD 83). Cross-section elevation data were obtained from a digital elevation model (DEM) that was derived from light detection and ranging (lidar) data collected from July 2018 to August 2018 (USGS, 2020a–i) as a part of the USGS 3D Elevation Program (USGS, 2025a). The DEM is USGS quality level 2 (USGS, 2025a) with a cell size of 1.0 meter (m) (3.28 ft), a nominal pulse spacing of 0.71 m (2.33 ft), and a vertical root-mean-square error (RMSE) of 27 centimeters (0.89 ft). Lidar is a technology consisting of a Global Positioning System (GPS), an inertial navigation system, and a laser scanner (typically mounted in a small aircraft) that “transmits brief pulses of light to the ground surface. Those pulses are reflected, or scattered back, and their travel time is used to calculate the distance between the laser scanner and the ground” (USGS, 2025g).
The RAS Mapper feature within HEC–RAS was used to extract station and elevation data from the DEM at 89 cross sections (table 5) for use in HEC–RAS. The DEM-derived cross sections were co-located with the field-surveyed cross sections where possible (for details on field-surveyed cross sections, refer to the following section, “Bathymetric and Structure Data”). In those cases, DEM-based elevations were combined with the survey elevations to form composite cross sections. In-channel widths and elevations for DEM-derived cross sections that did not have field-surveyed elevations were estimated by interpolating between the closest field-surveyed cross sections as a function of distance along the hydraulic baseline.
Table 5.
Survey characteristics and hydraulic parameters used to create the Río Grande De Loíza hydraulic model.[Data are from Ostheimer (2026). ft/ft, foot per foot slope]
Normal depth is the depth when the streamflow is uniform, steady, one dimensional, and unaffected by downstream obstructions. Flow is considered uniform if the energy line, water surface, and channel bottom all are parallel (Chow, 1959). The slope used to compute the normal depth of flow for all stages was based on the minimum channel slope between two field-surveyed cross sections near the downstream end of the modeled reach.
Bathymetric and Structure Data
Channel cross sections were surveyed to collect data on elevations and dimensions below the water surface that are not provided by conventional lidar. Structures (such as bridges, culverts, dams, and weirs) that had the potential to affect water-surface elevations during floods along the streams were also surveyed. The USGS used a differential GPS and differential-leveling (hereafter referred to as “conventional”) surveys for this study. Differential GPS surveys were completed by use of Level III real-time network surveying techniques (Rydlund and Densmore, 2012) and were used to establish an elevation control network at selected locations along the study reach. Elevations determined by using the differential GPS at six benchmark locations (table 6) had a vertical RMSE of 0.12 ft when compared with National Geodetic Survey published elevations (National Oceanic and Atmospheric Administration, 2025).
Table 6.
Comparisons of published National Geodetic Survey benchmark coordinates and elevations to those surveyed by the U.S. Geological Survey.[Table is from Ostheimer and Torres-Garcia (2025). All data are in feet. State Plane Coordinate System (Puerto Rico Virgin Islands). NGS, National Geodetic Survey; NAD 83, North American Datum of 1983; PRVD 02, Puerto Rico Vertical Datum of 2002; USGS, U.S. Geological Survey; n/a, not applicable]
Permanent identifier refers to the designation given to the benchmark by the National Geodetic Survey (National Oceanic and Atmospheric Administration, 2025).
The USGS used the elevation control network to complete conventional surveys at each structure to measure its geometry. All conventional surveys were done to third-order accuracy criteria in horizontal and vertical directions (Federal Geodetic Control Committee, 1984). USGS field crews surveyed a total of three hydraulic structures (table 5) along Río Grande De Loíza during February of 2025. Conventional surveys of bathymetry data for 22 cross sections were also completed to limit the reach length between surveyed cross sections. The maximum distance between cross sections (both conventionally surveyed and DEM-derived) was 281 ft, and the average distance was 163 ft. The cross-sectional spacing resulted in an absolute average streambed elevation change of 0.54 ft between cross sections.
Energy-Loss Factors
Hydraulic analyses require the estimation of energy losses that result from frictional resistance between the streamflow and the channel. The amount of frictional resistance may be quantified by the Manning’s roughness coefficient (“n” value). Initial (precalibration) n values were selected on the basis of field observations and high-resolution aerial photographs (Esri, Maxar, Earthstar Geographics, and the GIS Community, 2009). As part of the calibration process, the initial n values were adjusted until the differences between computed and observed water-surface elevations at the Caguas streamgage for stage 19.00 ft were minimized for the lowest modeled discharges. Frictional resistance of obstructions such as rocks and vegetation is diminished as the depth of streamflow over them increases. The use of flow roughness factors allows the model to linearly vary (reduce) the stream roughness coefficients with increasing streamflow (USACE, undated). The (base) n values were then modified by using flow roughness factors (table 7).
Table 7.
Streamflow roughness factors used in the Río Grande De Loíza hydraulic model.[Data are from Ostheimer (2026)]
For Río Grande De Loíza, the base n values ranged from 0.047 to 0.067 for the main channel and from 0.085 to 0.100 for the overbank (floodplain) areas (table 5). Using the flow roughness factors (table 7), the base n values for stage 34.00 ft (with an associated streamflow of 93,300 ft3/s) were reduced to 0.031 to 0.044 for the main channel and from 0.055 to 0.065 for the overbank (floodplain) areas. As noted in the “Study Area” section, the floodplains near the Caguas streamgage are primarily urban changing to suburban, forested, and undeveloped areas in the lower and upper ends of the study reach. The stream channel throughout the study reach is mainly composed of exposed bedrock, large rocks, sand, and gravel; tall sawgrass, bamboo, and underbrush grow along the streambanks.
Hydrologic Data
For the modeled profiles, the streamflows used in the model simulations (table 8) were obtained from the current stage-streamflow relation (rating curve 30.1) for the Caguas streamgage. Stage data recorded at the Caguas streamgage is referenced to a local datum but can be converted to water-surface elevations referenced to PRVD 02 by adding 142.85 ft. Vertical datum surveys for the Caguas streamgage were completed in March 2019 by use of Level II real-time network surveying techniques (Rydlund and Densmore, 2012) and have a vertical accuracy of 0.01 ft. Continuous records of streamflow are computed from a stage-streamflow relation, which has been developed for the streamgages, and are also available through the USGS Water Data for the Nation website (USGS, 2025e).
Table 8.
Selected stages and associated streamflows for respective stage-streamflow relations for the U.S. Geological Survey streamgage 50055000, Río Grande De Loíza at Caguas, Puerto Rico.[Data are from Ostheimer (2026). ft, foot; PRVD 02, Puerto Rico Vertical Datum of 2002; ft3/s, cubic foot per second]
It should be noted that rating curve 30.1 has a maximum stage and discharge of 32.32 ft and 83,000 ft3/s, respectively. As part of this study, the rating was extended to 34.00 ft by using the HEC–RAS hydraulic model; therefore, the discharges associated with stages 33.00 ft and 34.00 ft are model-derived estimates. Because the differences in drainage area (table 9) between the Caguas streamgage location and the top and bottom ends of the reach are only 1.4 percent, the discharges for the modeled profiles were kept constant throughout the study reach.
Table 9.
Drainage areas and percentages for selected locations on Río Grande De Loíza in and near Caguas, Puerto Rico.[Data from Ostheimer (2026), U.S. Geological Survey (2025d), and U.S. Geological Survey (2019). mi2, square mile; %, percent; USGS, U.S. Geological Survey; P.R., Puerto Rico]
Hydraulic Model
The water-surface profiles used to produce the 16 flood-inundation maps in this study were computed by using HEC–RAS version 6.3.1 (USACE, 2025). HEC–RAS is a one- or two-dimensional step-backwater model used to simulate water-surface profiles with steady-state (gradually varied) or unsteady-state flow computation options. The HEC–RAS analysis for this study was completed with the one-dimensional, steady-state flow computation option. A subcritical (tranquil) flow regime was assumed for the simulations.
Inputs to HEC–RAS were the DEM, field-collected data, the flow regime, boundary conditions, and streamflow values. Starting water-surface elevations were set on the basis of a normal-depth slope of 0.00004 ft/ft (table 5). This estimate of normal-depth slope was based on the water-surface slope from the two surveyed sections at the downstream end of the study reach. Normal depth is defined as the depth when the streamflow is uniform, steady, one-dimensional, and unaffected by downstream obstructions. Streamflow is considered uniform if the energy line, water surface, and channel bottom all are parallel (Chow, 1959).
Development of Water-Surface Profiles
The hydraulic model was calibrated so that the simulated water-surface elevation at the Caguas streamgage matched the target water-surface elevations predicted by the stage-streamflow rating for a given streamflow. The calibrated hydraulic model was used to generate water-surface profiles for 16 stages at 1-ft intervals from 19.00 to 34.00 ft as referenced to the local datum of the Caguas streamgage. These stages correspond to elevations from 161.85 ft to 176.85 ft PRVD 02, respectively. The modeled and target water-surface elevations at the Caguas streamgage are listed in table 10. Because the rating was extended (as described in the “Hydrologic Data” section), no comparisons between the modeled water-surface elevation and the stage-streamflow rating are available above stage 32.00 ft. The RMSE of the differences between the modeled and target water-surface elevations for stages 19.00 ft to 32.00 ft is 0.07 ft; minimum and maximum differences were −0.19 ft and 0.07 ft, respectively.
Table 10.
Calibration of model to target water-surface elevations at the U.S. Geological Survey streamgage 50055000, Río Grande De Loíza at Caguas, Puerto Rico.[Data are from Ostheimer (2026). ft, foot; PRVD 02, Puerto Rico Vertical Datum of 2002; n/a, not available]
Rating 30.1 has a maximum stage and discharge of 32.32 ft and 83,000 cubic feet per second, respectively. The rating was extended to stage 34.00 ft as part of this study; therefore, no comparisons between the modeled water-surface elevation and the stage-streamflow rating are available above stage 32.00 ft.
Development of Flood-Inundation Maps
Flood-inundation maps for the 16 water-surface profiles were created by using GIS software to combine the water-surface profiles and DEM data. Estimated flood-inundation boundaries and depth grids were developed for each simulated water-surface profile with RAS Mapper—a feature within HEC–RAS (USACE, undated) that allows the preparation of geometric data for import into HEC–RAS and the processing of simulation results exported from HEC–RAS. Shapefile polygons and depth grids of the inundated areas for each water-surface profile were manually edited with GIS software to ensure a hydraulically reasonable transition of the flood boundaries among modeled cross sections.
Any inundated areas that were detached from the main channel were examined to identify subsurface connections with Río Grande De Loíza, such as culverts or similar engineering structures under roadways. Where such connections existed, the mapped inundated areas were retained in their respective flood maps; otherwise, the erroneously delineated parts of the flood area were deleted. The flood-inundation areas were overlain on high-resolution, georeferenced aerial photographs (Esri, Maxar, Earthstar Geographics, and the GIS Community, 2009) of the study area. One example of a profile (stage 34.00 ft) overlain on orthorectified imagery is illustrated in figure 3. Bridge surfaces are shown as not inundated up to the lowest flood stage that completely inundates one or both road approaches to the bridge. Estimates of water depths can be determined with the interactive mapping application (USGS, 2025b) described in the following section, “Data Dissemination.”
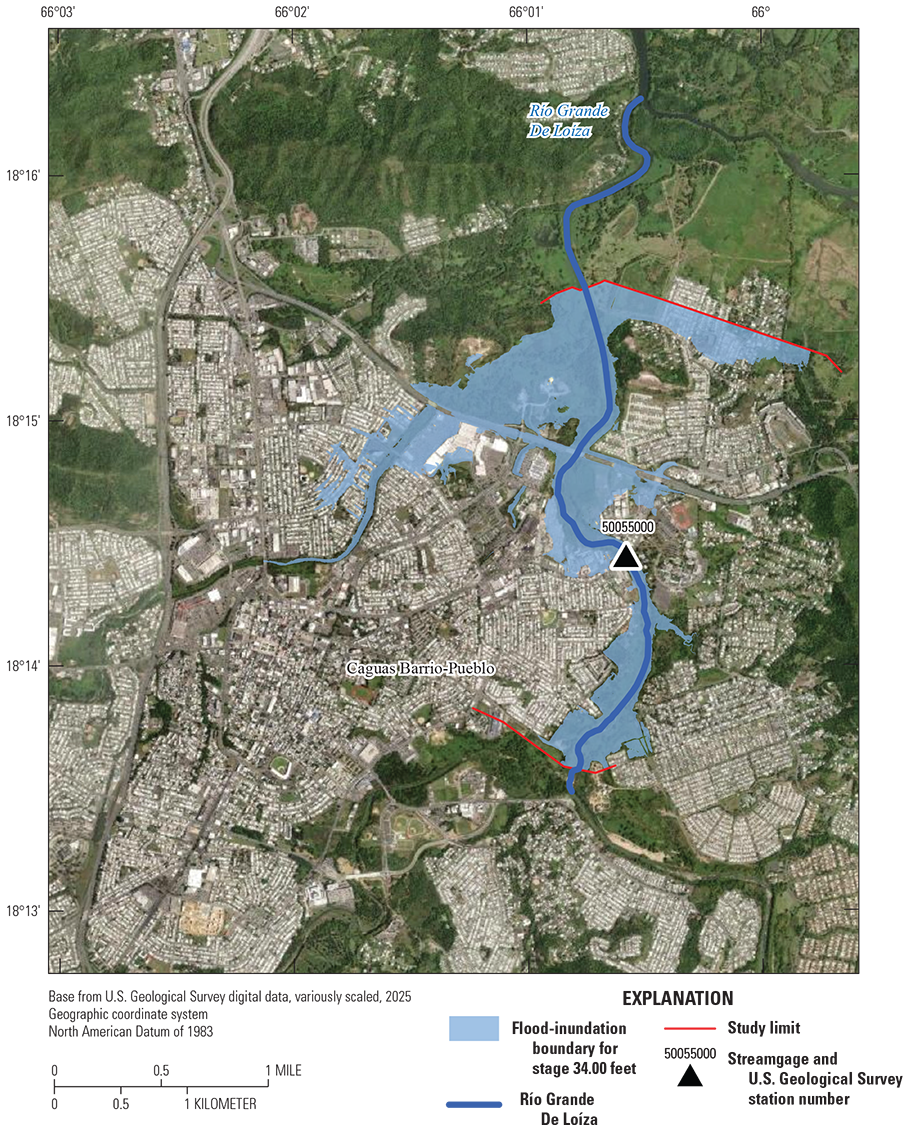
Map showing the floodplain boundary for stage 34.00 feet at the U.S. Geological Survey streamgage 50055000, Río Grande De Loíza at Caguas, Puerto Rico, overlain on orthorectified imagery.
Data Dissemination
All data used in the creation of the flood-inundation boundaries are available in a companion USGS data release (Ostheimer, 2026). The data release includes flood-inundation polygons and depth grids for each 1-ft increment of stage and the HEC–RAS model containing all input and output files involved with the hydraulic simulation.
The USGS Flood Inundation Mapper website (https://fim.wim.usgs.gov/fim/) (USGS, 2025b) was established to make USGS flood-inundation study information available to the public. The website is a mapping application that has collections of maps that provide detailed information on flood areas and depths for modeled sites. The website makes readily available to the public customized flood-inundation maps for the Caguas streamgage, along with the current stage and streamflow, as well as forecasted stage. A link is provided on the website to connect users to the USGS Water Data for the Nation (USGS, 2025e), the source of the current and historical water level and streamflow information. A second link connects to the NWS’s National Water Prediction Service site (NWS, 2025a), where users could obtain additional information on forecasted peak stages if the NWS adds forecasting at the Caguas streamgage site in the future. The estimated flood-inundation maps have sufficient detail to allow for accurate preparation and decision making by emergency response teams. Depending on the flood magnitude, roadways are shown as shaded (inundated and likely impassable) or not shaded (dry and passable) to facilitate emergency planning. Buildings are shaded where ground surfaces near the building are inundated (this should not be interpreted to mean that the structure is completely submerged). In these instances, the water depth (as indicated in the mapping application by clicking on an inundated area) near the building is an estimate of the water level inside the structure, if no flood-proofing measures have been implemented.
Uncertainties and Limitations of Flood-Inundation Maps
Although the flood-inundation maps represent the boundaries of floods with a distinct area, some uncertainty is associated with these maps. The flood boundaries shown were estimated on the basis of water stages and streamflows at selected the USGS streamgage. Water-surface elevations along the stream reach were estimated by steady-state hydraulic modeling, assuming unobstructed flow, and used streamflows and hydrologic conditions anticipated at the USGS streamgages. The hydraulic model reflects the land-cover and land-use characteristics and any bridge, dam, levee, or other hydraulic structures existing as of February 2025. Unique meteorological factors (such as timing and distribution of precipitation) may cause actual streamflows along the modeled reach to be different from those assumed during a flood, which may lead to deviations from the water-surface elevations and inundation boundaries shown here and in the datasets. Additional areas may be flooded because of unanticipated conditions such as changes in the streambed elevation or roughness, backwater into major tributaries along a main stem river, or backwater from localized debris or ice jams. The accuracy of the floodwater area portrayed on these maps will vary with the accuracy of the DEM used to simulate the land surface.
If this series of flood-inundation maps will be used in conjunction with NWS river forecasts, there may be additional uncertainties. The NWS uses forecast models to estimate the quantity and timing of water flowing through selected stream reaches in the United States. These forecast models (1) estimate the amount of runoff generated by precipitation and snowmelt, (2) simulate the movement of floodwater as it proceeds downstream, and (3) predict the flow and stage (and water-surface elevation) for the stream at a given location (National Water Prediction Service forecast point) throughout the forecast period (every 6 hours for the upcoming 3 to 5 days in many locations). For more information on National Water Prediction Service forecasts, please see https://water.noaa.gov.
For this study reach, the floodplain boundaries have additional uncertainty because no direct streamflow measurements have been made above 11,200 ft3/s (stage 14.22 ft) at the Caguas streamgage. The current rating curve (30.1) for the Caguas streamgage is limited to 83,000 ft3/s (stage 32.32 ft). The rating curve was extended to the highest modeled discharge of 93,300 ft3/s (stage 34.00 ft) as part of this work. Although the model is expected to produce reasonable results for the full range of study discharge estimates, results could not be verified with measured stage-discharge data available as of June 2025.
Inundated areas along Río Caguitas are due to backwater from Río Grande De Loíza and not due to flooding from Río Caguitas itself. It is unlikely, given the difference in drainage areas between Río Grande De Loíza just above Río Caguitas (91.1 mi2) and Río Caguitas at its mouth (18.8 mi2; USGS, 2019), that both streams would have concurrent flood peaks. It is expected that any flood peak on Río Caguitas will have passed before the flood peak for Río Grande De Loíza arrives.
Summary
The U.S. Geological Survey (USGS) developed a series of 16 digital flood-inundation maps for a 2.7-mile reach of Río Grande De Loíza in Caguas, Puerto Rico. The maps were calibrated to the USGS streamgage 50055000, Río Grande De Loíza at Caguas, Puerto Rico. The U.S. Army Corps of Engineers’ Hydrologic Engineering Center’s River Analysis System (HEC–RAS) and RAS Mapper programs were used to compute water-surface profiles and to delineate estimated flood-inundation areas and depths of flooding in 1-foot (ft) increments from stages 19.00 ft to 34.00 ft. The 34.00-ft stage exceeds the historical maximum stage of 33.20 ft recorded at the Caguas streamgage. The HEC–RAS hydraulic model was calibrated to the current stage-streamflow relation (rating curve 30.1) at the Caguas streamgage. The model was used to compute 16 water-surface profiles for flood stages that ranged from “moderate flood stage” to above “major flood stage,” as defined by the National Weather Service. The computed water-surface profiles were then used in combination with a digital elevation model, derived from light detection and ranging (lidar) data, to delineate estimated flood-inundation areas and flood-depth grids. The flood maps are available through a mapping application that can be accessed on the USGS Flood Inundation Mapper website (https://fim.wim.usgs.gov/fim/).
The maps on this interactive site allow users to obtain an indication of depth of water at any point in the study area by clicking within the shaded areas. These maps, in conjunction with the real-time stage data from the USGS streamgages and (potentially in the future) forecasted flood stage data from the National Weather Service’s National Water Prediction Service, can help emergency planners and the public make more informed decisions about flood risk.
References Cited
Administración Municipal de Caguas, 2024, La geografía y los sistemas de informacón geográfica: Caguas Informa a sus Gente, v. 2, no. 2, 7 p., accessed December 1, 2025, at https://caguas.gov.pr/wp-content/uploads/2019/08/La-Geografia-y-los-Sistemas-de-Informacion-Geografica.pdf.
Bales, J.D., Wagner, C.R., Tighe, K.C., and Terziotti, S., 2007, LiDAR-derived flood-inundation maps for real-time flood-mapping applications, Tar River Basin, North Carolina: U.S. Geological Survey Scientific Investigations Report 2007–5032, 42 p., accessed December 1, 2025, at https://doi.org/10.3133/sir20075032.
Esri, Maxar, Earthstar Geographics, and the GIS Community, 2009, World_Imagery (MapServer) (updated July 1, 2024): Esri web page, accessed December 1, 2025, at https://services.arcgisonline.com/ArcGIS/rest/services/World_Imagery/MapServer/.
Federal Emergency Management Agency [FEMA], 2009, Flood insurance study for Commonwealth of Puerto Rico and municipalities, volume 1 of 5 (rev. November 18, 2009): FEMA Flood Insurance Study Number 72000CV001B, 318 p., accessed December 1, 2025, at https://map1.msc.fema.gov/data/72/S/PDF/72000CV001B.pdf?LOC=c22969e1a4dc26be971aef430799ea67.
Federal Emergency Management Agency [FEMA], 2024, Seven year after María, FEMA remains focused on a recovery that mitigates future hazards: Federal Emergency Management Agency press release, September 18, 2024, accessed December 1, 2025, at https://www.fema.gov/press-release/20240918/seven-year-after-maria-fema-remains-focused-recovery-mitigates-future.
Federal Geodetic Control Committee, 1984, Standards and specifications for geodetic control networks: Rockville, Md., Federal Geodetic Control Committee, [variously paged], accessed December 1, 2025, at https://www.ngs.noaa.gov/FGCS/tech_pub/1984-stds-specs-geodetic-control-networks.pdf.
Gómez-Fragoso, J., Smith, M., and Santiago, M., 2022, U.S. Geological Survey response to Hurricane Maria flooding in Puerto Rico and characterization of peak streamflows observed September 20–22, 2017 (ver. 1.1, July 2022): U.S. Geological Survey Scientific Investigations Report 2022–5040, 105 p., 6 app., 1 pl., accessed December 1, 2025, at https://doi.org/10.3133/sir20225040.
Hinck, J.E., and Stachyra, J., 2023, Consolidated Appropriations Act, 2023—USGS disaster emergency recovery activities: U.S. Geological Survey Fact Sheet 2023–3025, 4 p., accessed December 1, 2025, at https://doi.org/10.3133/fs20233025.
Kuser Olsen, V.B., Momen, B., Langsdale, S.M., Galloway, G.E., Link, E., Brubaker, K.L., Ruth, M., and Hill, R.L., 2018, An approach for improving flood risk communication using realistic interactive visualization: Journal of Flood Risk Management, v. 11, no. S2, p. S783–S793, accessed December 1, 2025, at https://doi.org/10.1111/jfr3.12257.
Municipality of Caguas, 2020, Municipality of Caguas natural hazard mitigation plan—Executive summary: Municipality of Caguas, P.R., 7 p., accessed December 1, 2025, at https://jp.pr.gov/wp-content/uploads/2022/04/Cagu-HMP-ExeSummary-210211.pdf.
National Oceanic and Atmospheric Administration, 2025, National Geodetic Survey—Finding survey marks and datasheets: National Geodetic Survey website, accessed December 1, 2025, at https://geodesy.noaa.gov/datasheets/index.shtml.
National Weather Service [NWS], 2025a, National Water Prediction Service—Río Grande De Loíza at Caguas: National Oceanic and Atmospheric Administration website, accessed December 1, 2025, at https://water.noaa.gov/gauges/CAGP4.
National Weather Service [NWS], 2025b, National Weather Service glossary: National Weather Service website, accessed December 1, 2025, at https://forecast.weather.gov/glossary.php.
Ostheimer, C.J., 2012, Development of a flood-warning system and flood-inundation mapping in Licking County, Ohio: U.S. Geological Survey Scientific Investigations Report 2012–5137, 13 p., 39 pls., accessed December 1, 2025, at https://doi.org/10.3133/sir20125137.
Ostheimer, C.J., 2013, Development of flood profiles and flood-inundation maps for the Village of Killbuck, Ohio: U.S. Geological Survey Scientific Open File Report 2013–1032, 8 p., accessed December 1, 2025, at https://doi.org/10.3133/ofr20131032.
Ostheimer, C.J., 2026, Geospatial data sets and hydraulic model for flood-inundation maps for Río Grande De Loíza in and near Caguas, Puerto Rico: U.S. Geological Survey data release, https://doi.org/10.5066/P1IZ6D5V.
Ostheimer, C.J., and Huitger, C.A., 2019, Development of a flood-inundation map library and precipitation-runoff modeling for the Clear Fork Mohican River in and near Bellville, Ohio: U.S. Geological Survey Scientific Investigations Report 2019–5017, 34 p., accessed December 1, 2025, at https://doi.org/10.3133/sir20195017.
Ostheimer, C.J., and Torres-Garcia, L.M., 2025, Flood-inundation maps for Río de La Plata in and near Comerío, Puerto Rico, 2025: U.S. Geological Survey Scientific Investigations Report 2025–5094, 15 p., accessed December 1, 2025, at https://doi.org/10.3133/sir20255094.
Ostheimer, C.J., and Whitehead, M.T., 2024, Flood-inundation maps for the Cuyahoga River in and near Independence, Ohio, 2024: U.S. Geological Survey Scientific Investigations Report 2024–5122, 16 p., accessed December 1, 2025, at https://doi.org/10.3133/sir20245122.
Pasch, R.J., Reinhart, B.J., and Alaka, L., 2023, Hurricane Fiona (AL072022)—14–23 September 2022: National Oceanic and Atmospheric Administration National Hurricane Center Tropical Cyclone Report, 60 p., accessed December 1, 2025, at https://www.nhc.noaa.gov/data/tcr/AL072022_Fiona.pdf.
Quiñones, F., and Johnson, K.G., 1987, The floods of May 17–18, 1985 and October 6–7, 1985 in Puerto Rico: U.S. Geological Survey Open-File Report 87–123, accessed December 1, 2025, at https://doi.org/10.3133/ofr87123.
Ramos-Ginés, O., 1999, Estimation of magnitude and frequency of floods for streams in Puerto Rico—New empirical models: U.S. Geological Survey Water-Resources Investigations Report 99–4142, 41 p., accessed December 1, 2025, at https://doi.org/10.3133/wri994142.
Rydlund, P.H., Jr., and Densmore, B.K., 2012, Methods of practice and guidelines for using survey-grade global navigation satellite systems (GNSS) to establish vertical datum in the United States Geological Survey: U.S. Geological Survey Techniques and Methods, book 11, chap. D1, 102 p. with appendixes, accessed December 1, 2025, at https://doi.org/10.3133/tm11D1.
Soler-López, L.R., and Licha-Soler, N.A., 2012, Sedimentation survey of Lago Loíza, Puerto Rico, July 2009: U.S. Geological Survey Scientific Investigations Map 3219, 1 sheet, accessed December 1, 2025, at https://pubs.usgs.gov/sim/3219/.
Torres-Sierra, H., 1997, Hurricane Hortense—Impact on surface water in Puerto Rico: U.S. Geological Survey Fact Sheet 014–97, 4 p., accessed December 1, 2025, at https://doi.org/10.3133/fs01497.
Torres-Sierra, H., 2002, Flood of September 22, 1998, in Arecibo and Utuado, Puerto Rico: U.S. Geological Survey Water-Resources Investigations Report 01–4247, 23 p., 2 pls., accessed December 1, 2025, at https://doi.org/10.3133/wri20014247.
U.S. Army Corps of Engineers [USACE], undated, HEC–RAS mapper user’s manual: U.S. Army Corps of Engineers, Hydrologic Engineering Center website, accessed December 1, 2025, at https://www.hec.usace.army.mil/confluence/rasdocs/rmum/latest.
U.S. Army Corps of Engineers [USACE], 2025, HEC–RAS—River analysis system: U.S. Army Corps of Engineers, Hydrologic Engineering Center website, accessed December 1, 2025, at https://www.hec.usace.army.mil/software/hec-ras/.
U.S. Census Bureau, 2024, Quick Facts—Caguas Municipio, Puerto Rico: U.S. Census Bureau database, accessed December 1, 2025, at https://www.census.gov/quickfacts/fact/table/caguasmunicipiopuertorico/PST045224.
U.S. Geological Survey [USGS], 2019, The StreamStats program: U.S. Geological Survey web application, accessed December 1, 2025, at https://streamstats.usgs.gov/ss/.
U.S. Geological Survey [USGS], 2020a, USGS one meter x17y202 PR PRVI H 2018: U.S. Geological Survey data release, accessed December 1, 2025, at https://www.sciencebase.gov/catalog/item/5eb379f582ce25b5135878e4.
U.S. Geological Survey [USGS], 2020b, USGS one meter x17y203 PR PRVI D 2018: U.S. Geological Survey data release, accessed December 1, 2025, at https://www.sciencebase.gov/catalog/item/5eb228a082cefae35a29c4a9.
U.S. Geological Survey [USGS], 2020c, USGS one meter x17y203 PR PRVI H 2018: U.S. Geological Survey data release, accessed December 1, 2025, at https://www.sciencebase.gov/catalog/item/5eb379f682ce25b5135878e6.
U.S. Geological Survey [USGS], 2020d, USGS one meter x18y202 PR PRVI H 2018: U.S. Geological Survey data release, accessed December 1, 2025, at https://www.sciencebase.gov/catalog/item/5eb379f782ce25b5135878f2.
U.S. Geological Survey [USGS], 2020e, USGS one meter x18y203 PR PRVI D 2018: U.S. Geological Survey data release, accessed December 1, 2025, at https://www.sciencebase.gov/catalog/item/5eb228a182cefae35a29c4af.
U.S. Geological Survey [USGS], 2020f, USGS one meter x18y203 PR PRVI H 2018: U.S. Geological Survey data release, accessed December 1, 2025, at https://www.sciencebase.gov/catalog/item/5eb379f882ce25b5135878f4.
U.S. Geological Survey [USGS], 2020g, USGS one meter x81y202 PR PRVI H 2018: U.S. Geological Survey data release, accessed December 1, 2025, at https://www.sciencebase.gov/catalog/item/5eb37aa682ce25b513587966.
U.S. Geological Survey [USGS], 2020h, USGS one meter x81y203 PR PRVI D 2018: U.S. Geological Survey data release, accessed December 1, 2025, at https://www.sciencebase.gov/catalog/item/5eb2297182cefae35a29c5a3.
U.S. Geological Survey [USGS], 2020i, USGS one meter x81y203 PR PRVI H 2018: U.S. Geological Survey data release, accessed December 1, 2025, at https://www.sciencebase.gov/catalog/item/5eb37aa682ce25b513587968.
U.S. Geological Survey [USGS], 2025a, 3D Elevation Program: U.S. Geological Survey website, accessed December 1, 2025, at https://www.usgs.gov/3d-elevation-program.
U.S. Geological Survey [USGS], 2025b, Flood inundation mapper: U.S. Geological Survey database, accessed December 1, 2025, at https://fim.wim.usgs.gov/fim/.
U.S. Geological Survey [USGS], 2025c, Flood inundation mapping (FIM) program: U.S. Geological Survey website, accessed December 1, 2025, at https://water.usgs.gov/osw/flood_inundation.
U.S. Geological Survey [USGS], 2025d, USGS 50055000 Río Grande De Loíza at Caguas, PR, in USGS water data for the Nation: U.S. Geological Survey National Water Information System database, accessed December 1, 2025, at https://doi.org/10.5066/F7P55KJN. [Site information directly accessible at https://waterdata.usgs.gov/monitoring-location/50055000.]
U.S. Geological Survey [USGS], 2025e, USGS water data for the Nation: U.S. Geological Survey National Water Information System database, accessed December 1, 2025, at https://doi.org/10.5066/F7P55KJN.
U.S. Geological Survey [USGS], 2025f, U.S. Geological Survey National Water Information System rating for station 50055000, Río Grande De Loíza at Caguas, PR: U.S. Geological Survey National Water Information System web page, accessed December 1, 2025, at https://waterdata.usgs.gov/nwisweb/get_ratings?site_no=50055000&file_type=exsa.
U.S. Geological Survey [USGS], 2025g What is lidar data and where can I download it?: U.S. Geological Survey web page, accessed December 1, 2025, at https://www.usgs.gov/faqs/what-lidar-data-and-where-can-i-download-it.
Whitehead, M.T., 2011, Development of a flood-warning network and flood-inundation mapping for the Blanchard River in Ottawa, Ohio (rev. 2012): U.S. Geological Survey Scientific Investigations Report 2011–5189, 8 p., 12 pls., accessed December 1, 2025, at https://doi.org/10.3133/sir20115189.
Whitehead, M.T., 2015, Flood-inundation maps for the Scioto River at La Rue, Ohio: U.S. Geological Survey Scientific Investigations Report 2015–5100, 11 p., accessed December 1, 2025, at https://doi.org/10.3133/sir20155100.
Whitehead, M.T., 2019, Flood-inundation maps for Nimishillen Creek near North Industry, Ohio, 2019: U.S. Geological Survey Scientific Investigations Report 2019–5083, 11 p., accessed December 1, 2025, at https://doi.org/10.3133/sir20195083.
Whitehead, M.T., and Ostheimer, C.J., 2009, Development of a flood-warning system and flood-inundation mapping for the Blanchard River in Findlay, Ohio: U.S. Geological Survey Scientific Investigations Report 2008–5234, 9 p., 11 pls., accessed December 1, 2025, at https://doi.org/10.3133/sir20085234.
Whitehead, M.T., and Ostheimer, C.J., 2014, Flood-inundation maps and updated components for a flood-warning system or the City of Marietta, Ohio and selected communities along the Lower Muskingum River and Ohio River: U.S. Geological Survey Scientific Investigations Report 2014–5195, 16 p., accessed December 1, 2025, at https://doi.org/10.3133/sir20145195.
Whitehead, M.T., and Ostheimer, C.J., 2015, Flood-inundation maps for Grand River, Red Cedar River, and Sycamore Creek near Lansing, Michigan: U.S. Geological Survey Scientific Investigations Report 2015–5101, 23 p., accessed December 1, 2025, at https://doi.org/10.3133/sir20155101.
Whitehead, M.T., and Ostheimer, C.J., 2024, Flood-inundation maps for the Cuyahoga River at Jaite, Ohio, 2024: U.S. Geological Survey Scientific Investigations Report 2024–5115, 12 p., accessed December 1, 2025, at https://doi.org/10.3133/sir20245115.
Datums
Vertical coordinate information is referenced to (1) stage, the height above an arbitrary datum established at a streamgage, and (2) elevation, the height above the Puerto Rico Vertical Datum of 2002 (PRVD 02).
Horizontal coordinate information is referenced to the North American Datum of 1983 (NAD 83), except where otherwise indicated.
Abbreviations
AEP
annual exceedance probability
DEM
digital elevation model
FEMA
Federal Emergency Management Agency
GIS
geographic information system
GPS
Global Positioning System
HEC–RAS
Hydrologic Engineering Center’s River Analysis System
lidar
light detection and ranging
NWS
National Weather Service
RMSE
root-mean-square error
USACE
U.S. Army Corps of Engineers
USGS
U.S. Geological Survey
For more information about this report, contact:
Director, Ohio-Kentucky-Indiana Water Science Center
U.S. Geological Survey
6460 Busch Blvd, Suite 100
Columbus, OH 43229-1737
GS-W-OKI_Director@usgs.gov
or visit our website at
Disclaimers
Inundated areas shown should not be used for navigation, regulatory, permitting, or other legal purposes. The U.S. Geological Survey provides these maps “as-is” for a quick reference, emergency planning tool but assumes no legal liability or responsibility resulting from the use of this information.
The content of this report is originally modified from Whitehead and Ostheimer (2009). The data, discussion, and other sections are updated serially as different study areas are investigated with the techniques described in this report (Ostheimer, 2012, 2013; Ostheimer and Huitger, 2019; Ostheimer and Torres-Garcia, 2025; Ostheimer and Whitehead, 2024; Whitehead, 2011, 2015, 2019; Whitehead and Ostheimer, 2014, 2015, 2024).
Any use of trade, firm, or product names is for descriptive purposes only and does not imply endorsement by the U.S. Government.
Although this information product, for the most part, is in the public domain, it also may contain copyrighted materials as noted in the text. Permission to reproduce copyrighted items must be secured from the copyright owner.
Suggested Citation
Ostheimer, C.J., Torres-Garcia, L.M., and Gomez-Fragoso, J.M., 2026, Flood-inundation maps for Río Grande De Loíza in and near Caguas, Puerto Rico, 2026: U.S. Geological Survey Scientific Investigations Report 2025–5112, 16 p., https://doi.org/10.3133/sir20255112.
ISSN: 2328-0328 (online)
Study Area
| Publication type | Report |
|---|---|
| Publication Subtype | USGS Numbered Series |
| Title | Flood-inundation maps for Río Grande De Loíza in and near Caguas, Puerto Rico, 2026 |
| Series title | Scientific Investigations Report |
| Series number | 2025-5112 |
| DOI | 10.3133/sir20255112 |
| Publication Date | February 04, 2026 |
| Year Published | 2026 |
| Language | English |
| Publisher | U.S. Geological Survey |
| Publisher location | Reston, VA |
| Contributing office(s) | Ohio-Kentucky-Indiana Water Science Center |
| Description | Report: vii, 16 p.; Data Release |
| Country | United States |
| Other Geospatial | Puerto Rico |
| Online Only (Y/N) | Y |
| Additional Online Files (Y/N) | N |