

Analysis of Alternative Weir Designs for Improved Passage of Select Fish at the U.S. Geological Survey Streamgaging Weir at Blackwells Mills, New Jersey
Links
- Document: Report (56.5 MB pdf) , HTML , XML
- Data Release: USGS data release - HEC-RAS and FLOW 3-D HYDRO models used to evaluate alternative weir designs for the Millstone River at Blackwells Mills, New Jersey
- NGMDB Index Page: National Geologic Map Database Index Page (html)
- Download citation as: RIS | Dublin Core
Acknowledgments
The authors would like to express their appreciation to the New Jersey Department of Environmental Protection for their support coordinating communication between scientists in each agency, specifically, the staff in the Division of Water Supply and Geoscience; State Parks, Forests, and Historic Sites; and Fish and Wildlife. The authors would also like to thank Kevin Molongoski for providing technical support in the implementation of the modeled weir designs and Jason Shvanda, the hydrologists, and hydrologic technicians of the U.S. Geological Survey for providing water-level data collection at the study site, surveyed-elevation data, and analysis support.
Abstract
As the population of New Jersey continues to remain dense, the need for water supply will likely continue to be high, which can lead to water managers needing to make difficult decisions about managing drinking-water supply. Streamgaging weirs like the ones used by the U.S. Geological Survey (USGS) play a critical role in providing accurate and stable streamflow data, but their presence can affect the passage of diadromous fish species such as river herring (Alosa pseudoharengus [Wilson, 1811; alewife], Alosa aestivalis [Wilson, 1811; blueback herring], and Alosa sapidissima [Wilson, 1811; American shad]). In some situations, weirs existing in rivers and streams are no longer used because they were part of a farm irrigation system or some type of industrial operation. The weir at the USGS streamgage 01402000 Millstone River at Blackwells Mills, New Jersey, was purposefully built as a hydraulic-control structure that provides a precise and stable control for the measurement of stage and computation of continuous streamflow. To satisfy the dual need of maintaining accurate streamflow data and providing improved fish passage for select species of fish during migration season, the USGS proposed the development and evaluation of two alternative weir designs that would meet the criteria established for successful passage of American shad, alewife, and blueback herring during their yearly migration. The designs were also required to maintain adequate control of the upstream pool elevation necessary for the precise computation of streamflow used by State agencies for municipal water- supply purposes for surrounding communities.
Two alternative weir design modifications were incorporated at the center of the Blackwells Mills weir and modeled using two-dimensional hydraulic modeling software and three-dimensional computational fluid-dynamics software to simultaneously evaluate conditions for passage of the target fish species and effects to streamflow computations at the streamgage. The models were calibrated to existing conditions around the weir location using surveyed-elevation data and recorded stage, streamflow, and velocity in the Millstone River. The alternative weir designs lowered the weir crest by 1.02 feet (ft) and the resulting simulations showed an effective increase in depth of 0.98 ft at the median streamflow of 251 cubic feet per second (ft3) and 0.96 ft at the 95-percent exceedance streamflow of 98 ft3. The alternative weir designs were also found to increase streamflow depth across the shallowest portions of the weir structure at the downstream anti-scour skirt by lowering the skirt about 4 inches, allowing for two or more body depths of water for American shad, alewife, and blueback herring at the median migration streamflow of 251 ft3. The alternative weir designs also reduced the highest stream velocities across the downstream weir sill and anti-scour skirt from about 9 to 10 feet per second, and the depth- averaged velocity to about 7 to 8 feet per second. The sensitivity of the weir with respect to the computation of streamflow was increased from about 1.8 cubic feet per second per hundredth foot to 1.6 cubic feet per second per hundredth foot for streamflows of about 10–100 cubic feet per second.
Introduction
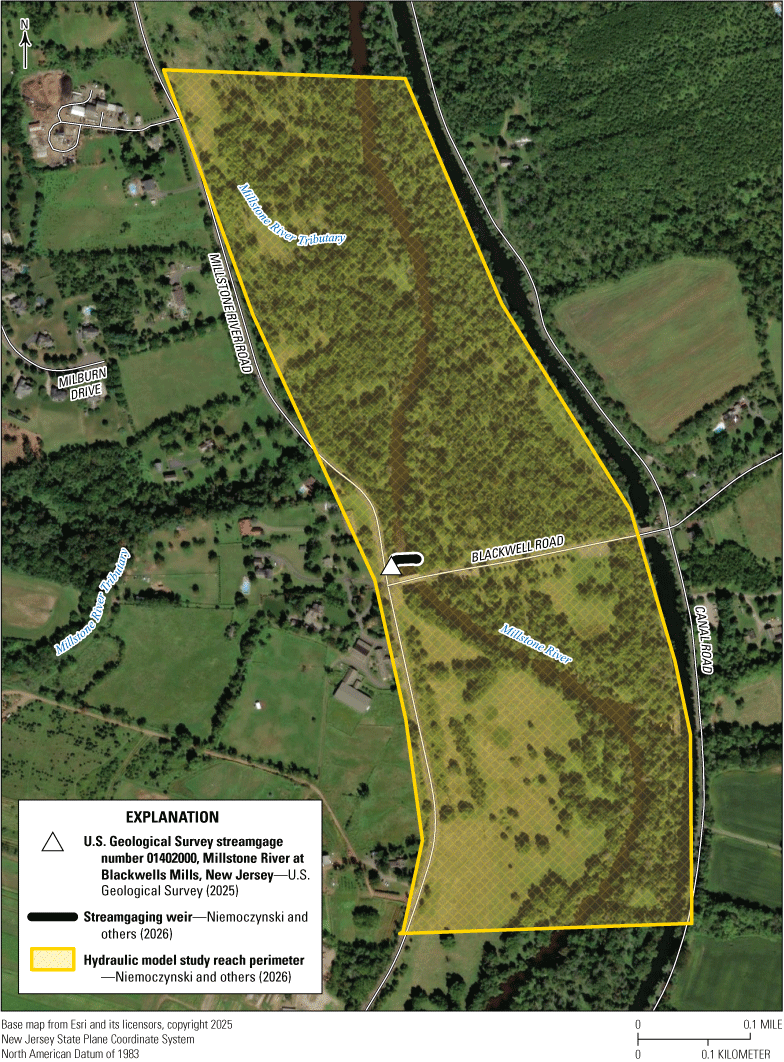
The U.S. Geological Survey (USGS) has operated the 01402000 Millstone River at Blackwells Mills streamgage since 1921. A low-head concrete streamgaging weir was installed in November 1933 to provide a stable hydraulic control for the measurement of stage and computation of streamflow. The weir is about 14 inches (in.) high above the lowest part of the anti-scour weir skirt, spans the full channel width, (fig. 1) and supports critical data collection for water-resource management and aquatic-ecosystem protection in the Millstone and Raritan River systems (Haro and others, 2017). There is also a lip that extends upward about 2 in. at the downstream end of the weir skirt that reduces the effective height of the weir to about 12 in. when evaluating flow conditions at the downstream end of the skirt. In 2017, the USGS conducted a study to evaluate the passability of selected migratory fish species at the Blackwells Mills weir. More information on this can be found in Haro and others (2017). Building on those findings, this study, conducted in cooperation with the New Jersey Department of Environmental Protection (NJDEP), evaluated whether two alternative weir crest designs could improve fish-passage conditions during low-to-medium streamflows while maintaining accuracy and precision in streamflow calculations at the streamgage. The ability to compute accurate streamflow at the USGS streamgage is important beyond the protection of the local aquatic ecosystem and general water resources because it provides information about water availability in the river to assist the New Jersey Water Supply Authority in managing releases from their water-supply reservoir system, which provides drinking water to residents of New Jersey (New Jersey Water Supply Authority, 2025b). This study adopted the species types, body depths, and migration-season streamflows defined in Haro and others (2017) as a basis for evaluating and designing the proposed weir modifications.
Purpose and Scope
This report describes a study that assessed whether two alternative weir crest designs could improve hydraulic conditions for fish passage at low-to-medium streamflows while maintaining, or minimally affecting, streamflow-data accuracy and sensitivity to changes in streamflow. The scope of this study, based on discussions with NJDEP, was limited to two conceptual weir modifications that were focused on the center of flow; side channel and abutment edge designs were not included. Each proposed modification, along with the existing weir, were evaluated at three statistical streamflows computed using data representative of the fish migration season. Two hydraulic models were used to simulate the proposed and existing weir designs: a two-dimensional U.S. Army Corps of Engineers Hydrologic Engineering Center River Analysis System (HEC-RAS) model to assess changes to the stage-discharge relationship (U.S. Army Corps of Engineers, 2025), and a three-dimensional FLOW-3D HYDRO (Flow Science, Inc., 2024, 20258) model to evaluate local depth and velocity conditions relevant to fish passage. This effort serves as a proof-of-concept and decision-support tool to support NJDEP in determining the best actions to maintain streamflow accuracy, maintain the hydraulic control structure’s sensitivity to changes in streamflow, and preserve long-term statistical data while improving migratory fish-passage conditions at lower streamflows during migration season.
Methods
The USGS performed a hydraulic and biological study of passability for select species of fish in 2017. The study used a desktop approach to evaluate passability for three anadromous fish species (Haro and others, 2017). This study advances the science and methods used in the 2017 study by utilizing hydraulic modeling computer software to evaluate alternative weir designs that target improved fish-passage conditions at lower streamflows during migration season while attempting to maintain hydraulic-control conditions in the river to provide continued streamflow accuracy and sensitivity to changes in streamflow volume. Two hydraulic models were calibrated and used in the evaluation of alternative weir designs. The two-dimensional (2D) hydraulics model was primarily used to evaluate the changes to the stage-discharge relationship at the Blackwells Mills streamgage and also provided depth and velocity information at the weir to evaluate how the alternative designs improved fish-passage conditions. The three-dimensional (3D) model was used to evaluate the streamflow conditions with a finer resolution grid configuration than the 2D model in an approximately 80-foot reach encompassing the area of the existing and alternative weir designs.
Biological Conditions
The targeted species and run times for this study are consistent with the 2017 study for the Blackwells Mills streamgage. The targeted species were previously identified as Alosa sapidissima (Wilson, 1811; American shad), Alosa pseudoharengus (Wilson, 1811; alewife), and Alosa aestivalis (Wilson, 1811; blueback herring) and will be referred to throughout this report as simply American shad, alewife, and blueback herring. The run-time data analysis was previously defined using data from daily-fishway counts at the Island Farms weir fishway on the main stem Raritan River, 6.2 river miles downstream from the Blackwells Mills weir (fig. 1). Dates of the 5- and 95-percent cumulative passage were determined for each year because these values more accurately represent run timing than dates of the first and last fish passings. Median dates of 5- and 95-percent passage between 1996 and 2005 were calculated as April 15 and May 28 for American shad and April 14 and May 24 for alewife and blueback herring. The distance between the Island Farm weir fishway and Blackwells Mills weir (6.2 river miles) is not considered large enough to make a notable delay in the run timing at the Blackwells Mills streamgage (Haro and others, 2017).
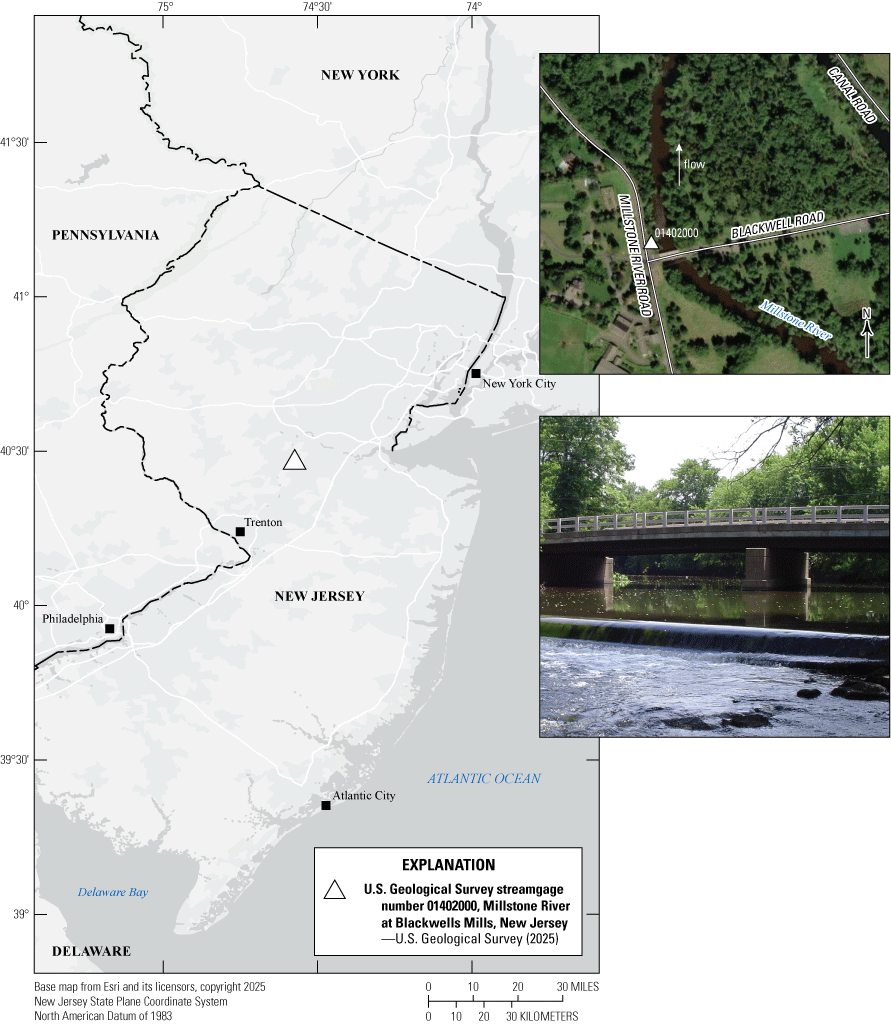
Map showing the location of the U.S. Geological Survey streamgage 01402000 Millstone River at Blackwells Mills, New Jersey, aerial view of the river reach near the streamgage, and a photograph depicting the existing streamgaging weir. Photograph courtesy of the U.S. Geological Survey.
Criteria for Improved Fish Passage
This study evaluated fish-passage conditions using two primary hydraulic criteria: water depth and water velocity over the weir crest and the downstream skirt or during streamflow conditions typical of the migration season. The annual and monthly streamflow-exceedance statistics were computed for the Blackwells Mills streamgage using daily streamflow data from August 4, 1921, to January 25, 2017, and for the yearly migration season of April 14 to May 28 using the USGS SWtoolbox software application (Kiang and others, 2018). For this study, the 95-, 50-, and 20-percent-exceedance streamflows were selected as target streamflows for designing and evaluating improved passage conditions.
Passage conditions at the existing streamgaging weir were analyzed in the Haro and others (2017) study and are reanalyzed in this study using updated computer simulations of alternative weir crest designs. Haro and others (2017) adopted depth criteria that were established by the U.S. Fish and Wildlife Service. The U.S. Fish and Wildlife Service fishway design criteria recommends a minimum water depth of 2 body depths (BDs) to safely allow fish to pass weirs with their body and median fins completely submerged (U.S. Fish and Wildlife Service, 2017). Water depths were compared to 2 BD (preferred) and 1 BD (absolute minimum) under the assumption that 1 BD represents the lowest depth at which passage may still be possible (Haro and others, 2017). This study used the same BD values established in the Haro and others (2017) study, based on the nominally largest-sized adult individuals for northeastern populations reported by Haro and others (2004):
-
• BD = 0.29 feet (ft) for alewife
-
• BD = 0.25 ft for blueback herring
-
• BD = 0.60 ft for American shad
Sprint swimming speeds of these species used in the Haro and others (2017) study and reported in Haro and others (2004) were also adopted for this study. These values represent the maximum short-duration swimming velocities achieved by more than 80 percent of individuals and were used to evaluate the species’ ability to traverse the weir:
This study defines improved passage conditions as achieving 2 BDs of water depth for all three species at the median streamflow during the migration season (251 cubic feet per second [ft3/s]) and 1 BD of depth for all three species at the 95-percent-exceedance streamflow during the same period (98 ft3/s). It was also assumed to avoid creating a potential velocity barrier, water velocities along the crest and skirt of the weir should remain at or below approximately 8 ft/s.
Hydrologic and Streamflow Conditions
The Millstone River at Blackwells Mills streamgage monitors streamflow that drains from a 258-square-mile watershed. The mean annual streamflow at the Blackwells Mills streamgage is about 392 ft3/s when calculated using data from 1922 through 2022 (U.S. Geological Survey, 2025). The streamgaging weir, which is part of the streamgage, has been in use at Blackwells Mills since 1933. Streamgaging weirs are generally installed in many rivers and streams to stabilize the stage-discharge relationship during lower-streamflow conditions (Rantz, 1982). These weirs can be referred to as artificial control structures when discussing streamflow hydraulics or engineering. This terminology is in reference to controlling the hydraulic relationship between stage (water depth) and discharge (streamflow) in the area of the weir. The weir designs can follow many forms but are typically built as modified broad-crested weirs or thin-plate sharp-crested weirs. The Blackwells Mills weir follows the general broad-crested design but has a nonstandard weir shape with similarities to ogee and broad-crested weirs (Haro and others, 2017). The elevation and plan views for the existing Blackwells Mills weir, were produced from field survey of the structure and are shown in figure 2.
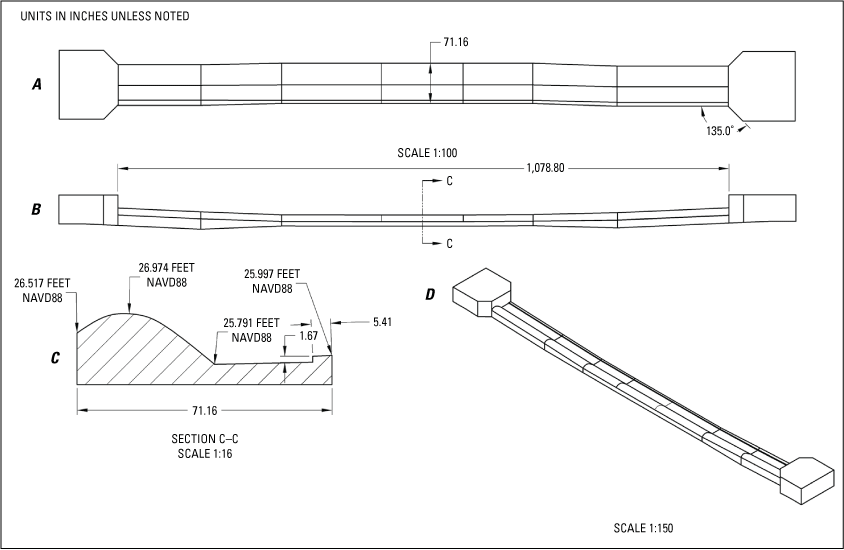
Sketches approximating the size and shape of the weir and abutments at the Millstone River at Blackwells Mills, New Jersey, streamgage were developed from a combination of field measurements, surveyed points, and interpolation. A, Plan view of the weir and abutments; B, elevation view of weir and abutments; C, cross-section view of weir crest and downstream skirt; and D, isometric view of weir and abutments. Dimensions are in inches; variable scales are listed for each sketch. [°, degrees; ft, feet; NAVD88, North American Vertical Datum of 1988]
The passability of the weir by fish is related to the depths of water and velocities of water at the weir during migration season. The amount of water flowing in the Millstone River passing over the weir is directly related to the depths and velocities encountered by the fish. Streamflow data from the Blackwells Mills streamgage record for the period of August 4, 1921, to January 25, 2017 (U.S. Geological Survey, 2025), were used to calculate exceedance statistics (Dingman, 1994) for the migration season. The migration season was defined in Haro and others (2017) as April 14 to May 28th. The 50-percent-exceedance streamflow was used in this study as the targeted streamflow for improved water depth for fish passage and to evaluate water velocity conditions at the weir. The 20- and 95-percent-exceedance streamflows were used to evaluate improved passage conditions at slightly higher migratory-season flows and during extremely low migratory-season streamflow conditions, respectively. The 50-percent exceedance streamflow was computed as 251 ft3/s, but for general comparison and to describe the streamflow conditions in more common terms, the average streamflow for the months of April and May was 544 and 361 ft3/s, respectively, for the same calculation period. The 20-percent streamflow was computed as 487 ft3/s. For comparison, at streamflows between about 700–1,000 ft3/s, the streamgaging weir has been observed becoming completely submerged and ineffective. At the extreme low-flow condition of the 95-percent exceedance, the streamflow was computed as 98 ft3/s. As a low-streamflow comparison, the months of September and October had the lowest long-term average streamflow of 225 and 218 ft3/s, respectively, and September had the lowest median streamflow of 92 ft3/s when computed using the same consistent dataset from 1921 to 2017 (Haro and others, 2017).
Accurate streamflow data at this streamgage have a high level of societal importance beyond simply providing general streamflow conditions and flood warning and documentation. The streamflow data from USGS streamgages in the Raritan Basin as well as the Blackwells Mills streamgage provide information to the New Jersey Water Supply Authority (NJWSA) for managing releases from reservoirs located upstream along the Raritan River to meet water-supply needs for central New Jersey (New Jersey Water Supply Authority, 2025b). Releases from the reservoirs are performed to provide sufficient water in the downstream reach for municipal water supply. Increased error in streamflow data from the Blackwells Mills streamgage could result in inefficient water releases, potentially wasting valuable water supply during drier, low-streamflow conditions. Specific water-supply-operations information is not provided in this summary for security reasons, but USGS streamflow data are used by the NJWSA to manage releases from their Raritan Basin Reservoir System that delivers raw water to water utilities that serve central New Jersey. The Stony Brook Regional Sewage Authority has a condition in their permit that links to the low-streamflow data at this streamgage requiring additional treatment when streamflow drops below a specified limit (Stony Brook Regional Sewage Authority, 2023). During the summer of 2022, a harmful algal bloom occurred in the Millstone River. This harmful algal bloom was connected to low-streamflow conditions and the presence of nutrients within the river. Subsequently, NJDEP and Stony Brook Regional Sewage Authority developed a plan for increased treatment of effluent discharged to the Millstone River in relation to the streamflow recorded at the Blackwells Mills streamgage (Stony Brook Regional Sewage Authority, 2023). Additionally, there is a related water-quality project collecting data at the Blackwells Mills streamgage that relies on accurate low streamflow data in their analysis (New Jersey Water Supply Authority, 2025a).
Alternative Streamgaging Weir Designs
The current weir at the Blackwells Mills streamgage was designed with a crest that gradually slopes toward the center and utilizes more than one slope (fig. 2). At the targeted streamflow of 251 ft3/s, the weir has about 1.2 ft of head (water depth) over the weir crest. At the downstream side of the weir along the concrete anti-scour skirt, the depth is typically about 0.8 to 0.9 ft if backwater from a downstream source is not present (Haro and others, 2017). Although the depth over the weir crest would satisfy the 2 BD requirement for the American shad, alewife, and blueback herring listed in the “Criteria for Improved Fish Passage” section of this report, the water depth on the downstream side of the weir would provide 2 BDs of depth for alewife and blueback herring, but it would only satisfy the 1 BD criteria for American shad. Modifications to the typical weir design were considered to improve fish-passage conditions while maintaining reasonably accurate, low-streamflow data with similar sensitivity to changing low flows. To meet this two-sided challenge, a few alternative weir designs were initially considered. After weighing the need for accurate flows and increased passage conditions with practical, cost-effective implementation methods and fish-behavior considerations, two designs were modeled to evaluate applicability.
The first alternative design is a widened V-type shape with a modified flat area at the midpoint of the two slopes, referred to as the “modified V-type” (fig. 3). The second alternative design modeled was a modified trapezoidal shape, referred to as the “trapezoidal” design (fig. 4). Both designs were modeled as modifications to the existing weir at Blackwells Mills streamgage but could potentially be applied to other similar types of streamgaging weirs. The streamgaging weir at the Blackwells Mills streamgage is about 90 ft wide between abutments and 14 in. high in the center section when measured from the top of the weir crest to the anti-scour skirt. To minimize effects that may reduce accuracy or increase variation in computed streamflow, the modification area was scaled to target an area that spanned less than 5 percent of the flowable width of the weir crest.
Modifying the elevation of the weir crest to follow a V shape, typically used in thin plate-type weirs (Bureau of Reclamation, 1997b), included a few challenges. The general broad-crested weir design has substantial width in the direction of flow, so reshaping a small section to a modified V-type required considerations regarding how to handle the intersection of the cut line with the weir crest, curvature with the upstream edge of the “V,” and the center midpoint of the V-type modification. To maintain smooth flow lines and minimize potential cavitation from any angles protruding from the existing weir crest, the modification was designed to follow the existing curvature of the weir crest. Minimal entrance rounding was modeled along the upstream edge of the V-type modification to avoid creating increased contraction on the opening. Finally, to soften the turbulence from flow entering the V-type modification from different angles at the midpoint, a flat spot was added. It was understood that creating a nonstandard V-type design would potentially add difficulty in the computation of modeled streamflow, but ultimately, if a similar design were implemented, the final calibration would likely be done empirically as part of the calibration process performed using USGS techniques for developing and verifying stage-discharge relationships (Rantz, 1982). If the modified V-type design provided improved conditions for fish passage and could still be calibrated empirically to provide reliable streamflow with equivalent or nearly equivalent sensitivity to small changes in low flows, then the modification would be an improvement to the existing weir.
The second alternative design uses a trapezoidal design modified from a more traditional Cipolletti design (Bureau of Reclamation, 1997a), which incorporates steeper walls. Flattening the slope of the sides of the trapezoidal design provided a smoother transition between flow over the crest of the weir and through the modified opening. To compensate for the wider opening at the bottom and steeper sides compared to the flatter-sloped, modified V-type opening, the width of the alternative trapezoidal design was slightly reduced. It was assumed that the wider flat bottom may provide less turbulent conditions in the area of the crest, but it may also convey more volume and potentially higher velocities from a greater contraction (figs. 3 and 4). It was assumed if this design was utilized, the final practical application of the modified trapezoidal design would be empirically calibrated as part of the standard USGS streamgage stage-discharge relationship calibration process (Rantz, 1982).
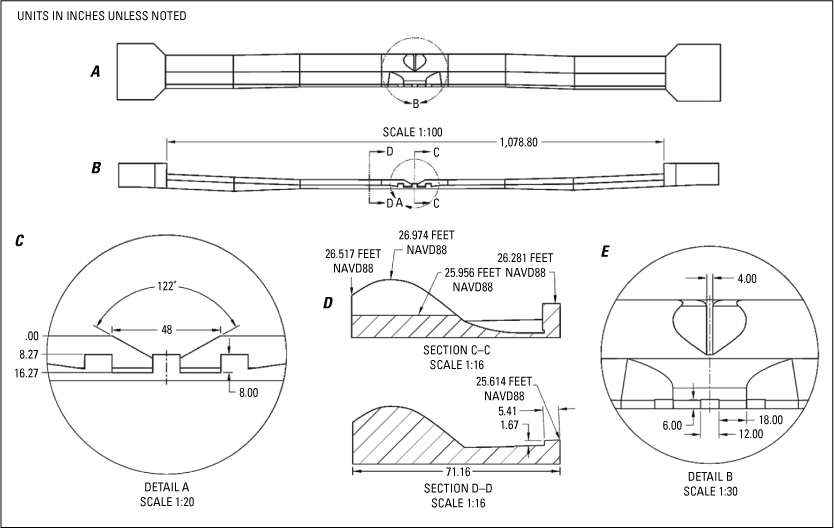
Sketches showing the alternative weir crest design for the V-type weir modification at the center of the Millstone River at Blackwells Mills, New Jersey, weir. A, plan view of the weir with V-type modification incorporated at center; B, elevation view of the weir with V-type modification incorporated at center; C, cross-section view of velocity-diffusing blocks at the downstream end of weir skirt for V-type weir modification; D, cross-section view of the lowered weir skirt and velocity-diffusing blocks design and direct comparison to original unaltered skirt elevation and velocity lip; and E, close-up plan view of V-type weir modification and design. Dimensions are in inches, variable scales listed for each.
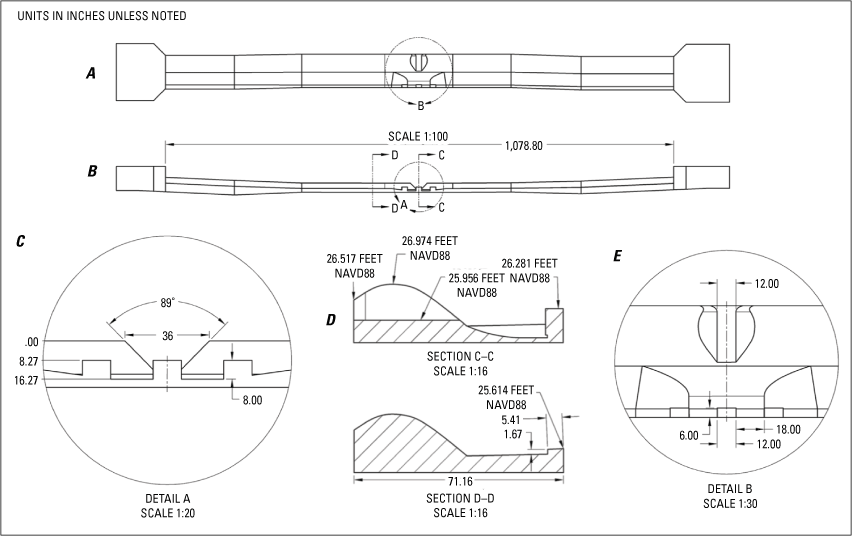
Sketches showing the alternative weir crest designs for the trapezoidal weir modification at the center of the Millstone River at Blackwells Mills, New Jersey, weir. A, plan view of the weir with trapezoidal modification incorporated at center; B, elevation view of the weir with trapezoidal modification incorporated at center; C, cross-section view of velocity-diffusing blocks at the downstream end of weir skirt for trapezoidal weir modification; D, cross-section view of the lowered weir skirt and velocity-diffusing blocks design and direct comparison to original unaltered skirt elevation and velocity lip; and E, close-up plan view of trapezoidal weir modification and design. Dimensions are in inches, variable scales listed for each.
In both alternative design modifications, it was clear that the downstream anti-scour skirt needed to be lowered to provide increased depth on the downstream side of the weir. The water-surface elevation on the downstream side of the weir is controlled by the reach characteristics of the natural channel downstream and the rate of streamflow. To provide increased depth during lower flow conditions across the anti-scour skirt on the downstream side of the weir, it was determined that lowering the skirt was the most practical option. In both alternative designs, the anti-scour skirt on the downstream side of the weir was lowered 4 in. at the area of the crest modifications and then gradually transitioned back to the original elevation as it extends laterally towards the banks. This modification is discussed again later in the report when evaluating the results of the computer-model simulations.
Analysis of Alternative Designs Through Hydraulic Modeling
This study used two computer models to evaluate changes to the existing stage-discharge relationship (rating) at the Blackwells Mills streamgage while simultaneously testing alternative weir designs (Niemoczynski and others, 2026). A HEC-RAS 2D hydraulic model was used to evaluate how the proposed alternative weir designs would affect the existing stage-discharge relationship (rating) and the effects potential changes would impose upon the computation of accurate streamflow data. Changes from existing conditions, including the average depth and velocity near the weir, were also evaluated using the 2D model. Subsequently, a 3D fluid-dynamics computer model was calibrated to the same conditions as the 2D model. To evaluate the modified designs and align the results of the two models, the water-surface elevations from the 2D model were copied to the 3D model and used to measure the degree of error in the 3D model during computation of the 95-, 50-, and 20-percent-exceedance streamflows. The following sections detail the construction of the 2D and 3D models and the subsequent evaluation of their results.
Development and Calibration of a Two-Dimensional Hydraulic Model for Existing Conditions
A HEC-RAS 2D hydraulic model was developed for the purposes of calibrating a model to the existing stream conditions and weir design and then using the model to evaluate the effects of the different dimensions and shapes of the two alternative weir designs and the effects on the stage-discharge relationship at the streamgage. The 2D-modeling approach accounts for variations in flow velocity and depth across a 2D area, allowing for a more detailed representation of complex hydraulic behaviors compared with more traditional node-based, one-dimensional modeling.
The HEC-RAS 2D hydraulic model allows hydraulic structures, such as weirs, culverts, and bridges to be entered into the 2D model domain and will approximate the effects of these structures on streamflow and stream elevation. Using a combination of field-surveyed data and geospatial data, a short 2D-model framework was developed and calibrated as described further in the report.
Model Geometry Data
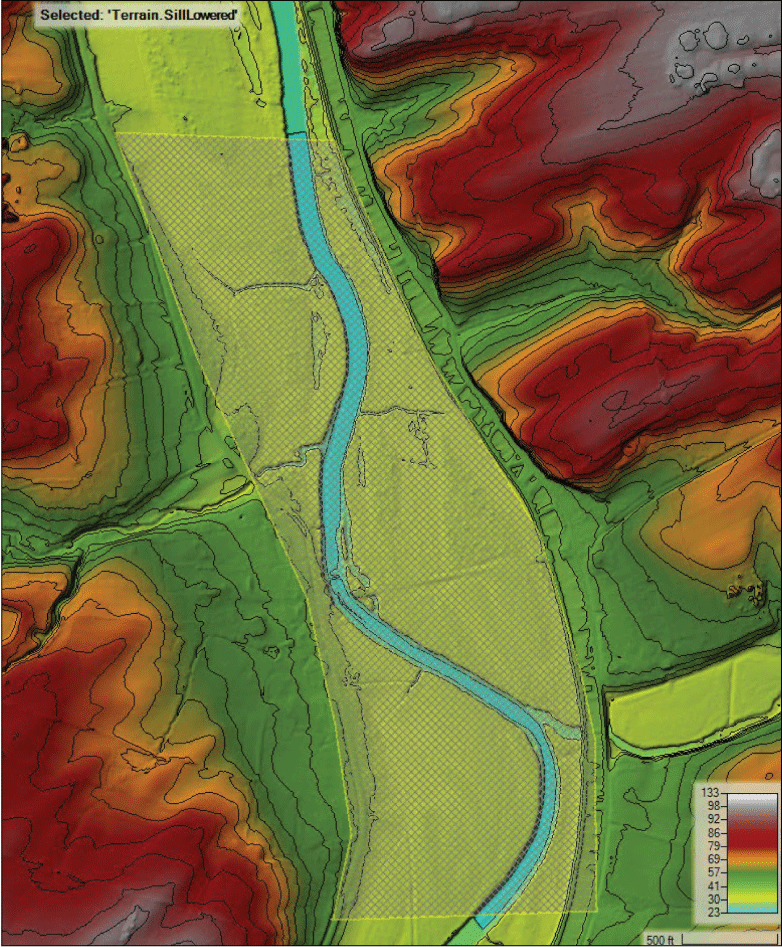
The first step in constructing the 2D hydraulic model was developing a model terrain. The USGS Coastal National Elevation Database (CoNED; Danielson and others, 2018) provides a 1-meter digital elevation model (DEM) for New Jersey and Delaware. An area surrounding the stream channel of the Millstone River approximately 0.8 miles from upstream to downstream at Blackwells Mills, encompassing the area of the weir, was extracted from the DEM and converted to units of survey ft (fig. 5). The cell size of the HEC-RAS terrain was set as 3 ft. This DEM is considered a topobathymetric (shows land above and below water) DEM; however, it incorporated an approximate channel bathymetry for the Millstone River in the study reach that did not reflect true channel depth and volume when verified against field-surveyed cross sections.
Map showing the modeled study reach, streamgage location, and location of the streamgaging weir for the Millstone River at Blackwells Mills, New Jersey.
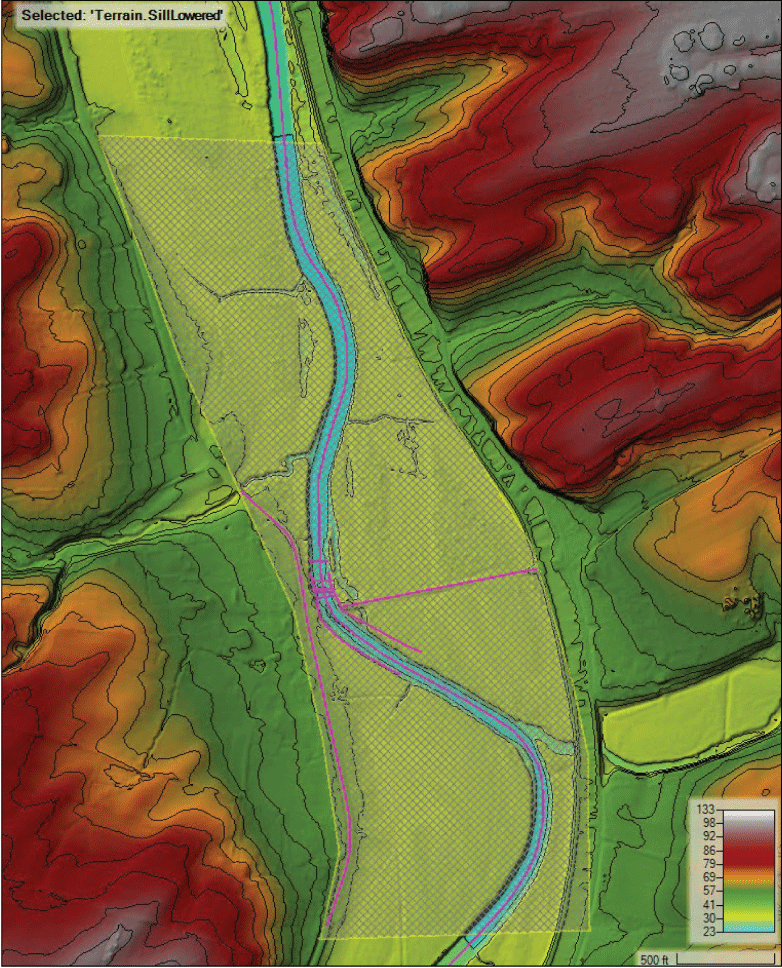
A channel was added to the terrain using functionality embedded within HEC-RAS that allows modifying an existing terrain using ground-truthed field data. Five field-surveyed cross-section profiles were obtained in October 2023 by USGS field staff in the area immediately around the Blackwells Mills weir and were used to define an additional terrain composed of just the stream channel bed in the area of the cross-sections. The HEC-RAS Mapper program within HEC-RAS allows a surface to be extracted from point cross-sectional data (interpolating linearly between cross sections) and synthesized into a DEM. This additional terrain was overlaid and merged with the main terrain to create a channel bed that was more representative of bed elevations and depth. It was outside of the scope of this report to update the channel bathymetry for the entire 0.8-mile reach, and the limited cross sections surveyed only provided updated bathymetry from about 400 ft upstream of the weir and about 300 ft downstream. Elsewhere throughout the model, the terrain was adjusted with an approximated channel using the “modify terrain” functionality within HEC-RAS. This tool allows the user to “excavate” a channel using a predefined longitudinal-profile line and selecting a channel depth and bank slope (U.S. Army Corps of Engineers, 2025b). Applied from the area downstream of the last-surveyed cross section to the downstream model extents, the tool lowered the channel bed to an elevation equal to or less than that of the surveyed elevations within the cross sections (fig. 6). The channel parameters, such as bank slope and channel width, were selected to match known geometries from the surveyed cross sections. Inclusion of a full-depth channel within the 2D model allows simulations to better represent streamflow conditions and for the model to correctly represent the tailwater (water downstream) condition. An additional terrain modification was necessary to correctly represent the weir sill and anti-scour skirt and is described in more detail further in the report.
HEC-RAS screen capture depicting updated channel bathymetry presented in feet, relative to NAVD88, in the 0.8-mile study reach around the Blackwells Mills streamgage area. [HEC-RAS, Hydrologic Engineering Center River Analysis System; NAVD88, North American Vertical Datum of 1988]
Following terrain development, a model mesh was implemented within a 2D flow area that began in Millstone Township, approximately 2,400 ft upstream of the Blackwells Mills weir and streamgage location. The downstream end of the 2D flow area terminates approximately 2,400 ft downstream of the Blackwells Mills weir. A base cell size of 12 by 14 ft was chosen for the mesh after initial simulations of the model. This base mesh size was used to optimize computation time, while still providing adequate model resolution. The general relief in the vicinity of Blackwells Mills streamgage tends to be modest, without excessively steep gradients, hills, and ridges. In situations such as this, larger mesh cell sizes can be used with little loss in accuracy, while reducing computational time, whereas for higher gradient and steeper areas, finer cell resolution can be necessary to allow HEC-RAS to compute the hydraulic parameters within the mesh cells.
Breaklines are vector lines inserted into the model mesh that “force” mesh cells to align a side along them during mesh generation. These breaklines were incorporated at all roads throughout the 2D flow area, along the stream channel, and other areas of high ground around the streamgage area (fig. 7). Typically, they are used around terrain features, such as steep banks, ridges, embankments, and roads where sudden interruptions in streamflow may occur and may assist in having the model more accurately represent streamflow in these conditions. Breakline cell size was reduced or adjusted from the standard mesh cell size, where model simulations showed excessive iteration resolving a water surface and associated higher levels of water-surface error. Around the breakline associated with the weir structure, the mesh cell size was reduced to a maximum of 3 ft to allow for additional detail in this area. This mesh definition proved to be stable over the course of a variety of model simulations using the software option for Shallow Water Equations, Eulerian-Lagrangian Method (SWE-ELM) for computation (U.S. Army Corps of Engineers, 2025a). Very few mesh cells had issues resolving water-surface elevations with this mesh definition. The few cells that did have issues across simulations could not resolve water-surface elevations with errors of less than 0.1 ft, but these cells were in areas further from the weir. Several profile lines were delineated within HEC-RAS Mapper around the weir location to allow for more detailed analysis of internal model behavior such as transverse and longitudinal water-surface elevations around the structure. Additionally, reference points that represent the locations of upstream and downstream stage sensors at the streamgage were added to the model geometry to compare with observed values during model calibration.
HEC-RAS screen capture depicting application of breaklines within the 0.8-mile study reach around the Blackwells Mills streamgage area. Bathymetry and elevation within the screen capture are presented in feet, relative to NAVD88. [HEC-RAS, Hydrologic Engineering Center River Analysis System; NAVD88, North American Vertical Datum of 1988]
The weir structure was entered into the 2D model using the 2D connection editor (U.S. Army Corps of Engineers, 2025a). Dimensions for the weir, including the weir transverse profile, longitudinal profile, and the widths and dimensions of abutments, were obtained from a survey conducted by the USGS field staff in October 2023. Field elevations were compared to an as-built survey drawing (Work Progress Administration New Jersey, 1937) to check for any anomalies between the historical record and field observations. The vertical datum for elevations transferred from the plans was adjusted from the National Geodetic Vertical Datum of 1929 (NGVD29) to North American Vertical Datum of 1988 (NAVD88) for comparison to the field-surveyed elevations. Actual surveyed dimensions were used to construct the weir in the 2D connection editor, with the weir crest shape within HEC-RAS being set as “broad-crested.” This was the best application of the binary options of “ogee” and “broad-crested” that HEC-RAS provides, despite the Blackwells Mills weir being a nonstandard weir shape (Haro and others, 2017). The 2D connection editor for weirs is restricted to a single transverse cross section that describes the weir along with a single fixed downstream width and a single fixed weir coefficient (for broad-crested weirs). Due to the limited representation available within HEC-RAS to describe the weir profile, a terrain modification was necessary to correctly model the weir sill and anti-scour skirt. A raised rectangular polygon modification was inserted into the terrain below the width of the weir with an elevation set to surveyed elevations (fig. 8).
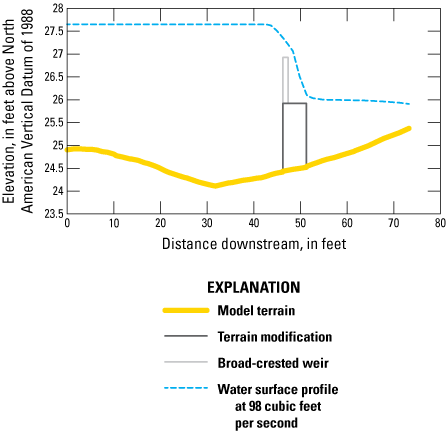
Profile plot showing the two-dimensional model-terrain elevations near the weir and the terrain modification used to represent the weir sill and skirt. The figure also shows the approximate modeled location of the weir and the water-surface elevation at a streamflow of 98 ft3/s. [ft3/s, cubic feet per second]
During model iteration, it was found that the fixed weir coefficient for the entire range of streamflows for the migration period was insufficient for matching observed water-surface elevations upstream of the weir. A weir coefficient for the 98 ft3/s streamflow regime was not efficient enough at the middle and high streamflow regimes of 251 and 487 ft3/s, respectively. This is likely because at the lower streamflow regime, the water surface at the weir has minimal interaction with the chamfered (angled) abutments. As the upstream water-surface elevation rises, the chamfered weir abutments tend to improve the efficiency of the weir, so the coefficient continues to increase until submergence takes effect. This necessitated having separate model geometries employing different weir coefficients that were used to simulate the 95-, 50-, and 20-percent-exceedance flows.
The alternative weirs for both the V-type modification and trapezoidal designs were implemented by modifying the weir profile within the 2D connection editor to match the design drawings. The transitional area between the original sill dimensions and the lowered sill area downstream of the notch was not modeled, with the sill and anti-scour skirt terrain modification being lowered by 4 in. across its entire width. This was due to difficulty defining the appropriate shape within the HEC-RAS framework. Similarly, the individual diffuser blocks, which are described in more detail in the report, are used within the 3D model and were not included within the 2D model for those same reasons. These modifications were more pertinent to observing the very complex flow depth and velocity-pattern changes from the 3D model, and the resolution of the 2D model would not have supported this level of detail. Iterations of the 3D model showed that inclusion of these blocks had negligible effects on the water-surface elevations on the upstream side of the weir where the 2D model was used for a detailed comparison against the existing stage-discharge relationship. Thus, their absence from the 2D model was considered acceptable.
Land Cover and Roughness Coefficients
Using HEC-RAS 2D hydraulic modeling necessitates defining a land-cover feature class to delineate Manning’s n-values for the entire study reach; more on this specific process can be found in U.S. Army Corps of Engineers (2025a). However, the primary difference is that n-values are spatially applied to the model reach and not by cross section, as they would be in a one-dimensional hydraulic model. Usually, a polygon feature class representing various land covers is defined within a geographic information system to provide n-values across the study reach. Each defined land use or land cover of the land cover feature class is assigned a Manning’s n-value approximating the values defined from field investigation or literature. In this case, a land use and land cover (LULC) feature class for the year 2020 was downloaded from the New Jersey Department of Environmental Protection (NJDEP) geographic information system portal (New Jersey Department of Environmental Protection Bureau of Geologic Information Systems, 2024). This feature class, clipped to the HEC-RAS 2D mesh extent, had 13 different LULC categories covering the entire model terrain. It was necessary to assign roughness coefficients (how much resistance a surface offers to flow of water) based on the standard classification of each of the LULC categories. Following guidance in the HEC-RAS 2D Modeling User’s Manual (U.S. Army Corps of Engineers, 2025a), each of the 13 categories was assigned a base Manning’s n-value (table 1). Once the base value is assigned to each individual land use or land cover, the value can be forced to a different value during calibration or can be overridden through application of a specific n-value calibration region, which can be drawn into the model using the HEC-RAS Mapper application (U.S. Army Corps of Engineers, 2025b). To better represent the channel downstream of the weir as observed during field surveys, the base n-value of 0.035 for streams and canals was altered downstream, by use of a calibration region, to a value of 0.040 (fig. 9). This additional roughness is representative of woody debris and vegetation at the channel edges. This value superseded any adjusted values shown in table 1 in the areas covered by the calibration region. The value of 0.035 for the “streams and canals” land use category was raised to a values of 0.045, as the calibration region polygon did not match exactly with the edges of the gridded land-use cover raster. This prevented an unrealistic drop in the roughness near the edges of the calibration region.
Table 1.
Land cover descriptions and their base and adjusted (if applicable) n-values used for the model simulation for the streamgage at Millstone River at Blackwells Mills, New Jersey.[n, number; >, greater than; %, percent; --, not applicable]
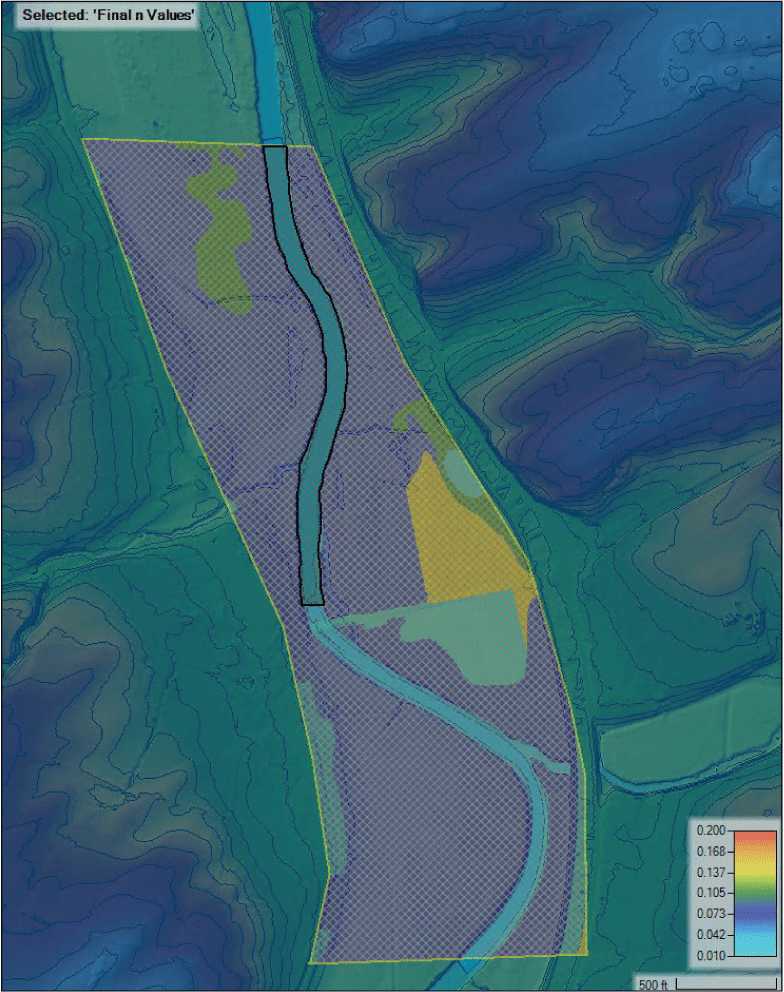
HEC-RAS screen capture displaying the land cover feature class and calibration region overlaid on the model terrain, demonstrating the variation in Manning’s n-values around the Blackwells Mills streamgaging weir. Calibration regions are outlined in black.
Boundary Conditions and Model Simulations
The downstream end of the model used normal depth as a boundary condition. Using normal depth as the downstream boundary condition assumes that the channel beyond the downstream model extent is flowing under comparable conditions to the downstream end of the model itself. An estimated or calculated slope of the channel is then entered within the normal depth field in the unsteady flow editor in HEC-RAS. In the case of this model, normal depth was approximated by plotting the furthest downstream cross sections longitudinally and computing the bed slope of the channel. The average slope using this method was computed to be 0.0041 and was input within the normal depth field. The upstream end of the hydraulic model begins approximately 2,400 ft upstream of the Blackwells Mills weir, and it was reasonable to use the computed streamflow hydrograph from the Blackwells Mills streamgage directly as the upstream boundary condition as there are no tributary inflows that would augment the flow computed at the streamgage between the streamgage and the upstream end of the model (U.S. Geological Survey, 2025).
For the initial simulations, the observed published-streamflow hydrograph from October 14 through October 17, 2014, was entered as the upstream boundary condition. This hydrograph was entered at a 15-minute interval from midnight on October 14, 2014, through 11:45am on October 17, 2014. The simulation was run at a 2-second computation interval, which was successful at suppressing iterative model errors and maintaining model stability. Maximum Courant numbers, which are used to evaluate time steps of the model, peaked between 2 and 3 for the mesh cells around the weir and immediately downstream of the weir. This was considered acceptable as the streamflow hydrograph is not highly dynamic and changes relatively slowly over time. HEC-RAS can tolerate high Courant numbers due to the implicit solution scheme (method used to calculate future streamflow) it uses, provided the flood wave (depth and velocity) being modeled is not changing rapidly (U.S. Army Corps of Engineers, 2025a).
As calibration efforts for the model continued and the previously described weir coefficient issue was revealed, a different approach to running the model was necessary. Because the weir coefficient did not change during the simulation, what the authors describe as “quasi-steady” flow simulations had to be iterated through the hydraulic model. This was accomplished within the unsteady flow data editor in HEC-RAS by implementing a 24-hour static hydrograph at a 15-minute interval at the 95-, 50-, and 20-percent-exceedance streamflow regimes of 98, 251, and 487 ft3/s (U.S. Army Corps of Engineers, 2025a). This method permitted the use of different weir coefficients at these streamflow rates.
Comparison of Simulation Results to Observed Data
The initial simulations from the HEC-RAS 2D hydraulic model were set to utilize the streamflow hydrograph that aligned with October 2014 when a temporary downstream water-level logger was installed at the Blackwells Mills weir. The logger provided the ability to use the approved streamflow hydrograph as a boundary condition, with the hydraulic model having the ability to freely compute upstream and downstream water-surface elevations that were able to be compared to observed values on both sides of the weir. Although this iteration of the model reproduced generally accurate upstream and downstream water-surface elevations when compared to observed values, the simulated upstream water surface tended to rise between approximately 0.1 and 0.3 ft higher than what was measured when the flow was above about 200 ft3/s (fig. 10). The rise noted at higher streamflows was assumed to be a result of the fixed-weir coefficient for the broad-crested weir setting in HEC-RAS. The model was unable to adjust the weir coefficient as the depth of flow above the weir increased. Also, the chamfered abutment walls increased the contraction efficiency of the section, which was assumed to be the primary cause of simulated water-surfaces not precisely matching observed elevations.
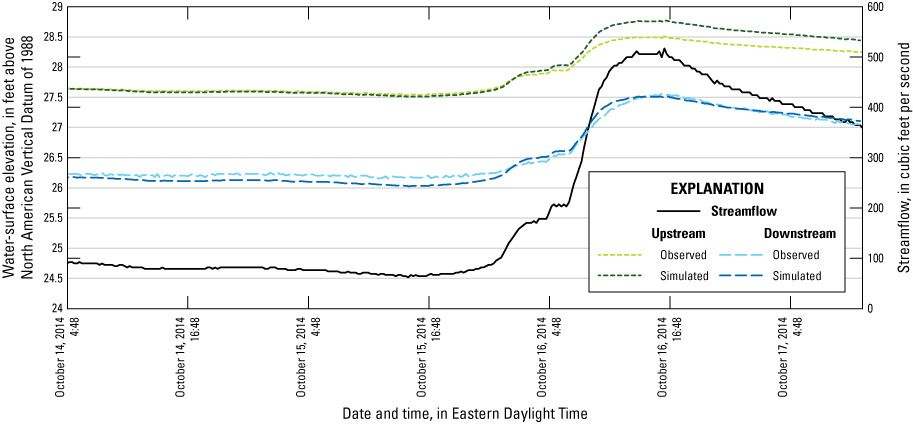
Observed and simulated hydrographs for the period of October 14–17, 2014, showing upstream and downstream water-surface elevations at the Blackwells Mills streamgaging weir. Dates are shown in MM/DD/YY format, and time is shown in military time.
To accurately calibrate the model simulation to the existing stage-discharge relationship at the Blackwells Mills streamgage, it was necessary to run the 95-, 50-, and 20-percent-exceedance streamflows as target streamflows in the previously described quasi-steady flow manner (refer to the “Boundary Conditions and Model Simulations” section of the report). This provided a mechanism where a specific weir coefficient for each target streamflow could be utilized to precisely relate the model to the existing conditions at the streamgage. This provided the most accurate starting point for employing and evaluating the alternative weir designs within the 2D hydraulic model framework. Applying the weir coefficients in the manner described in the “Boundary Conditions and Model Simulations” section of the report, the simulated upstream water-surface elevations matched the rating-derived water-surface elevations associated with the targeted streamflow regimes within 0.00 ft (table 2). To quantify how the addition of the alternative weir designs would affect streamflows lower than the 95-percent-exceedance streamflow of 98 ft3/s, two additional model simulations were performed at streamflows of 10 ft3/s and 50 ft3/s. These simulations used the same weir coefficient as the 98 ft3/s simulation and remained in agreement with the rating-derived values. Figure 11 displays the stage-discharge relationship generated from the 2D HEC-RAS simulation-overlaid values obtained from stage-discharge relationship (rating) number 31.0 at the Blackwells Mills streamgage, which was in use at the time of publication of this report. Figure 11 also demonstrates that the model calibration was excellent in the three target-streamflow regimes, with only minor differences of 0.03 ft in water-surface elevations at extreme low streamflows of 10 ft3/s. A simulated difference of 0.03 ft at an extremely low streamflow of 10 ft3/s was considered acceptable for the simulation. The difference at this low streamflow can be affected by minor construction imperfections in the weir crest shape or minor variations in surface-area roughness that are not explicitly represented in the computer-simulated weir design. Additional context for the rarity of extreme low flows is represented by the historic period-of-record low flow of 5.0 ft3/s being set more than 100 years ago in 1923 (U.S. Geological Survey, 2025).
Table 2.
Rating-derived streamflow values and associated water-surface elevations from stage-discharge relationship (rating) number 31.0, simulated water-surface elevation generated by the two-dimensional model, and their differences.[ft3/s, cubic feet per second; NAVD88, North American Vertical Datum of 1988]
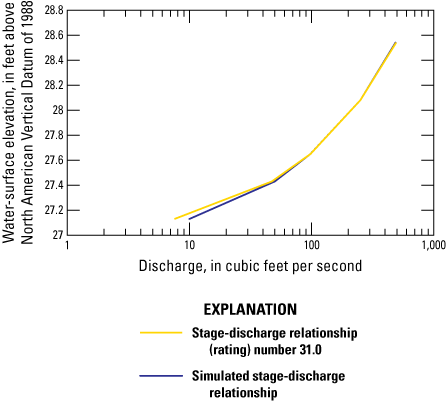
Approved stage-discharge relationship (rating) number 31.0 versus the HEC-RAS two-dimensional model generated stage-discharge relationship for the Blackwells Mills streamgage. [HEC-RAS, Hydrologic Engineering Center River Analysis System]
To supplement the 2D hydraulic model’s comparison against the observed surface-water-elevation values at the Blackwells Mills streamgage, a comparison of modeled velocities downstream of the weir versus velocities obtained from discrete streamflow measurements was performed as a further check on the model’s ability to correctly represent field conditions. During periods of low flows, streamflow measurements were performed by wading with an acoustic Doppler velocimeter (ADV) between 100 and 150 ft downstream of the Blackwells Mills weir. A tagline was strung perpendicular to streamflow across the stream and the profile was divided into 25–30 individual subsections, where point velocities were collected for 40 seconds. Within the measurement data, these individual subsection velocities can be viewed from where they were collected in the measurement profile. Additional information on the application of USGS procedures for making streamflow measurements can be found in Turnipseed and Sauer (2010).
Two measurements that noted clear channel conditions with the weir clear of debris that had flows near the streamflow rates for each of the 95- and 50-percent exceedance intervals were used to compare against model-simulated velocities. A comparison against the 20-percent exceedance interval could not be performed, as streamflow measurements were performed upstream of the weir for these moderate flows and thus could not be effectively compared against velocities downstream of the weir. The subsection-mean velocities from the streamflow measurements were plotted across the stream against simulated velocities from the 2D hydraulic model simulation run at corresponding streamflows (fig. 12). The simulated velocities generally plotted higher against the observed velocities, with some areas of the cross section in close agreement. Variation at the edges and within the profile likely exists due to irregularities between the underlying DEM and the actual channel, because the depths in this area of the model were interpolated between surveyed cross sections as opposed to directly measured depth observations within the streamflow measurements. The actual position of the profile line used to extract the velocity data from the simulation results was inserted into the model mesh 150 ft downstream of the modeled location of the Blackwells Mills weir. The measurement locations tend to be rough approximations of actual cross-section positions in relation to the streamgage versus an exact measurement, so the location of these data extracted from the model simulation may also serve to create variation in the comparison. Overall, the simulated velocity profiles show a reasonable match against field-obtained values, with the simulation marginally overpredicting stream velocities.
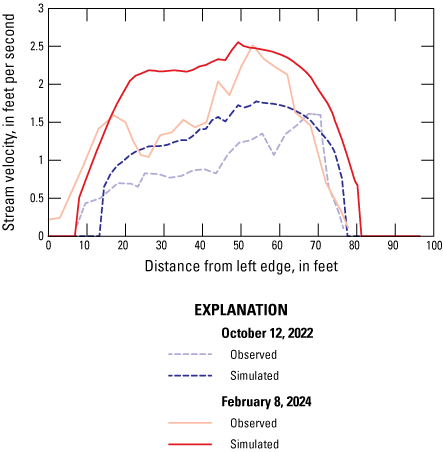
Simulated downstream channel velocity versus velocities obtained from discrete streamflow measurements at the Blackwells Mills streamgage on October 12, 2022, and February 8, 2024. [ft/s, feet per second]
Hydraulic Model Sensitivity Analysis
A sensitivity analysis for Manning’s n-values and the downstream boundary condition was completed to identify possible areas of concern with the model’s precision. Errors in the selection of Manning’s n-values for the land-cover feature class associated with the 2D-model geometry could result in the simulation incorrectly computing water-surface elevations for a given streamflow. In addition, errors in the selection of a normal depth value for the downstream boundary condition could result in variation in the simulated water-surface elevation, although the errors would typically become smaller further from the location of the downstream model boundary.
Adjustment of the downstream boundary condition was accomplished by raising and lowering the normal depth value incrementally by 10 percent within the unsteady flow data editor (U.S. Army Corps of Engineers, 2025a). Adjustment of these values yielded very little change in overall water-surface elevations within the area of the Blackwells Mills weir (fig. 13). This demonstrates that the downstream boundary condition was not sensitive to this parameter and any errors in the estimation of this boundary condition likely only present negligible effects on the final model results. Some differences would be expected to be viewed in the areas close to the downstream model boundary.
![Simulated water-surface elevations generated from the calibrated two-dimensional model
at a streamflow of 98 ft3/s and those generated from the model with an adjusted normal-depth boundary condition.
[ft3/s, cubic feet per second]](https://pubs.usgs.gov/sir/2026/5002/images/sir20265002_fig13.png)
Simulated water-surface elevations generated from the calibrated two-dimensional model at a streamflow of 98 ft3/s and those generated from the model with an adjusted normal-depth boundary condition. [ft3/s, cubic feet per second]
Adjustment of Manning’s n-values was accomplished by raising and lowering the values incrementally by 10 percent within the land-cover layer in HEC-RAS. Adjustment of these values yielded very little change in overall water-surface elevations (fig. 14). Differences of less than 0.1 ft in maximum-simulated water-surface elevations showed that the model was not particularly sensitive at the Blackwells Mills streamgage location to n-value selection and application. Larger differences would be expected in the areas downstream of the weir, as the weir dimensions and geometry have a much larger effect on water-surface elevations immediately upstream of the weir versus the channel-roughness coefficients.
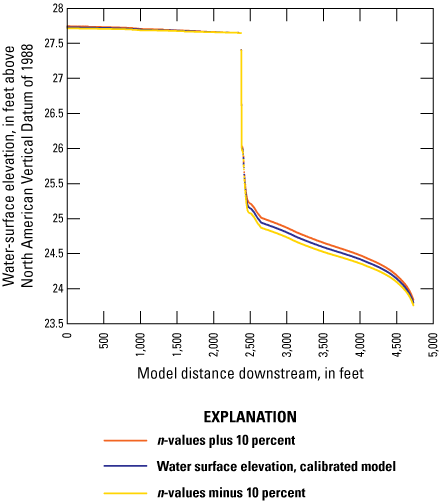
Simulated water-surface elevations generated from the calibrated two-dimensional model at a streamflow of 98 ft3/s and those generated from the model with adjusted Manning’s roughness coefficients. [ft3/s, cubic feet per second]
Development and Calibration of Three-Dimensional Model for Fine-Scale Analysis
To evaluate the hydraulics of the proposed weir modifications at the Blackwells Mills streamgage, a series of computational fluid-dynamics simulations were conducted using FLOW-3D HYDRO (Flow Science, Inc., 2024, 20258). These simulations modeled three weir configurations under a range of streamflow conditions representative of the previously defined migration season for the American shad, alewife, and blueback herring.
Model Development
A computational fluid-dynamics model of the weir was developed using FLOW-3D HYDRO to evaluate passage conditions across a range of weir configurations and streamflows. Simulations were conducted for three weir designs: the existing weir, the modified V-type weir, and the modified trapezoidal-type weir. Each configuration was simulated under three streamflow scenarios representing the 95-, 50-, and 20-percent-exceedance streamflows (98, 251, and 487 ft3/s, respectively) during the migration season, resulting in a total of nine simulations.
Model geometry was constructed from topographic and bathymetric data compiled from multiple sources. Bathymetric survey data collected by the USGS in October 2023 (Niemoczynski and others, 2026) included channel cross sections upstream, downstream, and across the weir structure. To supplement gaps along the floodplain and embankments, Quality level 2 light detection and ranging (lidar) data (U.S. Geological Survey, 2022) were incorporated. All elevation data were imported into CloudCompare version 2.13.1 (CloudCompare, 2024), aligned to the NAVD88 and North American Datum of 1983 datums, merged into a single point cloud (3D dataset), and interpolated into a 5 by 5-ft raster surface. This raster served as the terrain input for the FLOW-3D HYDRO model.
The weir structures were modeled in OnShape version 1.196 (OnShape, 2025) using 2023 field-survey data (fig. 15A, B, C). The files (stereolithography format [file extension .stl]) representing each of the three configurations were exported from OnShape and imported into FLOW-3D HYDRO. The computational domain extended approximately 30 ft upstream and 50 ft downstream of the weir. A subcritical inflow boundary condition was applied upstream, and a fixed water-surface elevation was defined at the downstream boundary using results from the 2D HEC-RAS model. All simulations used a uniform mesh with 0.125-ft grid spacing, the Re-Normalisation Group method turbulence model (Flow Science, Inc., 2026a), and a first-order momentum advection scheme (Flow Science, Inc., 2026b). Surface-roughness height was set to 0.1 ft for natural bathymetry and 0.02 ft for the weir structures.
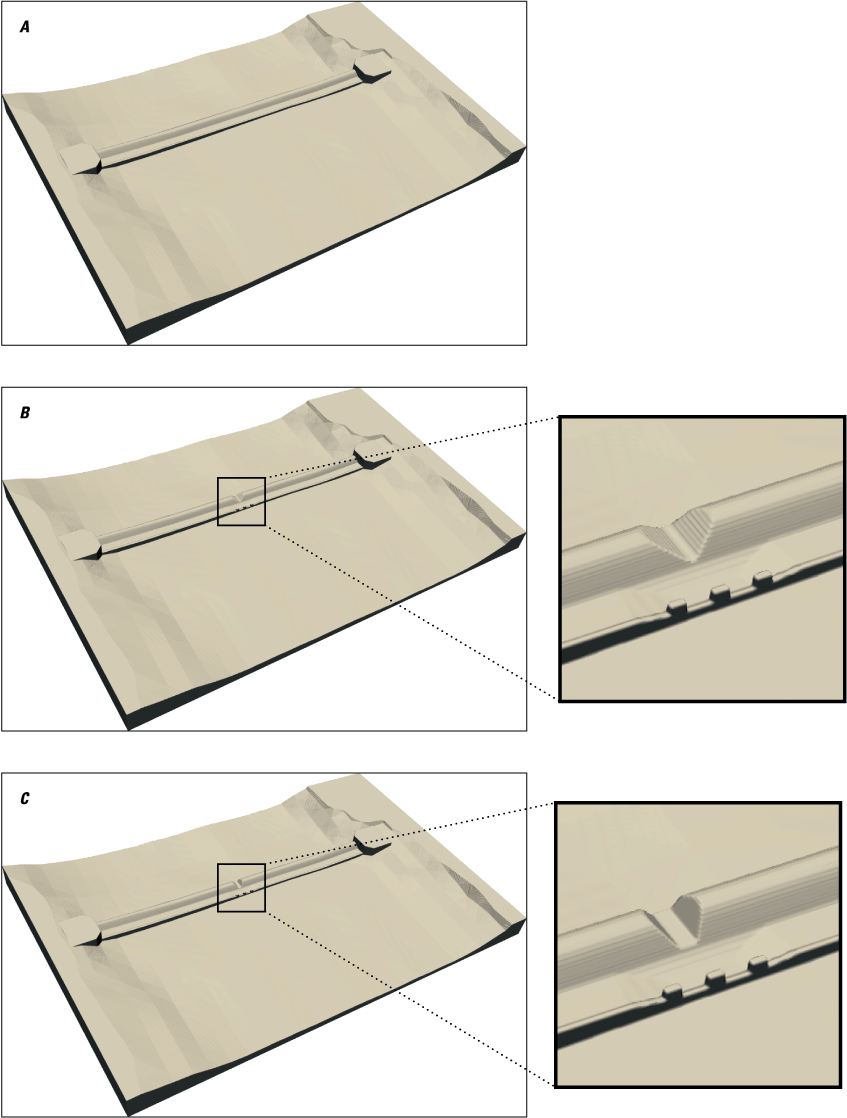
Full-domain weir geometry was used for each of the three different modeled weir designs. A, existing weir; B, modified V-type; and C, modified trapezoidal design.
Model Calibration
A calibration simulation was performed using the existing weir geometry to confirm that the FLOW-3D HYDRO model produced streamflow estimates consistent with measured data. This test run was configured with fixed headwater and tailwater elevations based on the 2D HEC-RAS model output at the upstream and downstream boundary locations. The model-calculated streamflow rate was 252.4 ft3/s, compared to a measured streamgage value of 251 ft3/s at the site. The simulated discharge was within 1 percent of the observed value, which was considered an acceptable level of agreement. Following this verification, the project team proceeded with the full set of nine design simulations.
Software Versions and Execution
Due to a numerical instability identified in FLOW-3D HYDRO version 2024R1 that affected model performance at low flows, the 95-percent-exceedance streamflow simulations were run using version 2025R1 (Flow Science, Inc., 2024, 20258). The remaining six simulations, representing the 50- and 20-percent-exceedance streamflow conditions, were completed using version 2024R1 prior to the discovery of the issue. Because each simulation required between 3 and 6 days to complete, the higher streamflow scenarios were not rerun in version 2025R1. All simulations were executed on a high-performance workstation using a 24-core FLOW-3D HYDRO license. Results were postprocessed in FLOW-3D POST version 2024R1 and 2025R1 (Flow Science, Inc., 2024, 20258). Model outputs included velocity fields, water-surface elevations, and flow depths for all nine simulations. These outputs were used to evaluate weir performance and to assess the potential for improving fish passage at the site and are available within the data release associated with this report (Niemoczynski and others, 2026).
Evaluation of Alternative Weir Designs Using Hydraulic Modeling Data
The two hydraulic models were calibrated to the existing weir and streamflow conditions; afterwards, the weir geometry was changed to represent the two alternative designs. This approach allowed for a comparison of simulated results to evaluate how depth, velocity, and flow patterns may change if the alternative designs were implemented. The scale of the modifications to the width and area of the weir crest were selected to minimize water-surface-elevation changes at the upstream side of the weir that resulted from the alternative weir design modification to the existing crest. Ideally, the alternative designs would result in gradual changes to the existing stage-discharge relationship and maintain or improve the sensitivity between changes in streamflow and the resulting changes in stage—all while improving depth and velocity conditions at the weir crest and in the approach to the weir from the downstream side.
Changes in Water-Surface Elevations Upstream of the Streamgaging Weir
After calibrating the computer models to the existing weir design, the weir design in both models was changed to match the modified V-type design and modified trapezoidal designs described earlier in this report. The weir designed with a modified V-type shape in the center of the span was input into the computer models, and simulations were run with flows of 98, 251, and 487 ft3/s corresponding to the 95-, 50-, and 20-percent exceedance flows. The V-type center weir crest design was limited to 4 ft wide but extended almost to the bottom of the existing weir in the center, stopping only 2 in. above the anti-scour pad skirt elevation. The weir design with the trapezoidal-shaped opening in the center of the weir crest span was limited to 3 ft wide and also extended almost to the bottom of the existing weir, stopping only 2 in. above the anti-scour pad skirt. For the 2D model, the weir design and modifications were an approximation of the more detailed design that was able to be employed in the 3D model due to constraints encountered within the HEC-RAS software. Both designs generated similar upstream water-surface-elevation results in comparison to the existing conditions. Table 3 shows the changes in upstream water-surface elevation for the 2D model. At the median streamflow of 251 ft3/s, the simulated upstream gage pool only dropped about 0.02 to 0.03 ft because of the changes to the opening. Simulations of the 95-percent-exceedance streamflow of 98 ft3/s simulated an upstream gage-pool elevation drop of about 0.03 to 0.04 ft using either the 2D or 3D models. At the higher flows of 487 ft3/s, both computer models simulated a 0.01 to 0.02 ft drop in the gage-pool elevation.
Table 3.
Changes in upstream water-surface elevation from alternative weir designs at the Blackwells Mills streamgage using the HEC-RAS two-dimensional model. [HEC-RAS, Hydrologic Engineering Center River Analysis System][ft3/s, cubic feet per second; NAVD88, North American Vertical Datum of 1988]
It should be noted that the changes in the gage pool were evaluated because the downstream water-surface elevation is not controlled by the weir and, therefore, would theoretically not change with minor modifications to the weir crest shape.
Changes to the Stage-Discharge Relationship
When considering alternative weir designs, one primary focus of the design selection was to minimize degradation of the existing stage-discharge relationship at the Blackwells Mills streamgage while also preserving the sensitivity of the streamgaging weir. Sensitivity of a hydraulic control can be described as the relative change in streamflow per minimum unit of an independent variable, in this case, stream elevation or stage. Similar to many USGS streamgages, the Blackwells Mills streamgage can accurately measure stream stage to 0.01 ft (Buchanan and Somers, 1982). The present shape and condition of the weir allows each unit of stage (0.01 ft) to compute an average streamflow change of 3.5 ft3/s from flows of 10 to 487 ft3/s. Looking specifically at the lower streamflow regime, the weir can compute an average streamflow change of about 1.6 ft3/s from flows of 10 to 98 ft3/s. After implementing the alternative weir designs within the HEC-RAS 2D model, the changes in hydraulic-control sensitivity were evaluated. Table 4 shows the existing weir sensitivity and the changes in sensitivity that would be expected with the modified V-type and trapezoidal weir modifications. From 10 to 487 ft3/s, the average change in streamflow per unit of stage decreased, showing that the weir modifications marginally improved sensitivity over this range. Moving into the low streamflow regime from 10 to 98 ft3/s, the weir modifications show a greater improvement to control sensitivity with about a 10-percent reduction in average change in streamflow per unit of stage. This demonstrates that the alternative weir designs would be just as effective at computing streamflow as the existing weir, with potential improvement in the range of typical migration season streamflows.
Table 4.
Sensitivity for measuring streamflow at the existing weir at the Blackwells Mills streamgage versus sensitivity for proposed alternative weir designs.[ft3/s, cubic feet per second]
In addition to evaluating control sensitivity, the 2D model was used to evaluate the overall change to the stage-discharge relationship, particularly where the weir modifications would no longer affect the existing relationship (fig. 16). As previously stated, the difference in stream stage between the existing weir and both alternative designs at a streamflow of 487 ft3/s was about 0.01 to 0.02 ft. Transposing this difference in stage to predicted streamflow, at 487 ft3/s, the alternative designs would be underpredicting streamflow by between 1.2 and 2.5 percent using the currently existing stage-discharge relationship. As streamflow increases beyond 487 ft3/s, the differences will continue to diminish as the weir quickly becomes submerged at these streamflows. This demonstrates that the weir modifications would negligibly affect areas of the established stage-discharge relationship above the 20-percent-exceedance interval migration flow.
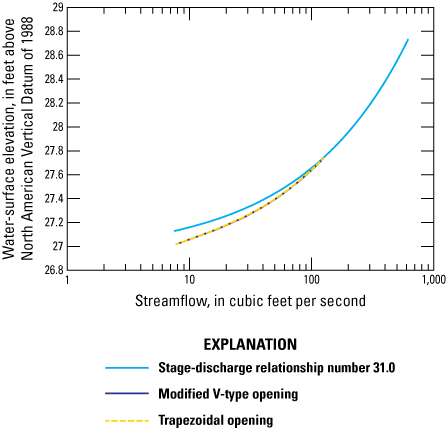
Differences between current stage-discharge relationship number 31.0 used at the Blackwells Mills streamgage, and model-simulated stage-discharge relationships for both weir design modifications from about 10–600 ft3/s. [ft3/s, cubic feet per second]
Simulated Improvements to Fish-Passage Conditions at the Weir and Tailwater With Modified Weir Designs
Along some stream reaches, medium-to-higher streamflows can generate higher velocities and potentially cause a velocity barrier for fish passage at a dam or weir. As streamflow increases into the range of 600 to 800 ft3/s or higher along the Millstone River, the USGS streamgaging weir becomes submerged, and any depth or velocity barrier to fish passage is eliminated. Haro and others (2017) analyzed the hydraulic and biological passability of select fish during migration season and described that as flows during migration season approach extreme low conditions, the depth over the weir and along the downstream skirt do not meet the requirements for all three of the selected species. At the 95-percent-exceedance streamflow, the earlier study pointed out that a depth barrier may exist for alewife and blueback herring only about 5 percent of the time using a 1 BD criterion, and at 200 ft3/s (between 60- and 70-percent-exceedance streamflows), a barrier may exist 35 percent of the time using a 2 BD criterion. Haro and others (2017) also suggested for deeper-bodied fish like American shad, a depth barrier may even exist at 1 BD with flows in the range of 200 ft3/s, but also emphasized it was a desktop exercise, and they did not actually study fish behavior at the Blackwells Mills weir. The alternative modified weir designs developed and tested in this study attempted to improve these passage conditions and provided water depths that meet the 1 BD requirement during conditions down to the 95-percent exceedance and 2 BDs at the 50-percent exceedance streamflow.
The first weir crest design modification analyzed was the V-type opening near the center of the span. The modification to the weir crest dropped the low point by about 1.02 ft, which translates to the minimum crest elevation dropping from 28.00 ft to 26.98 ft NGVD29 (26.98 ft to 25.96 ft NAVD88). Theoretically, this would be directly converted to an increased depth over the crest, but because the weir acts as the hydraulic-control feature for the headwater (gage) pool, any notable alteration to the crest shape would result in a change to the headwater pool elevation for the same given streamflow. The hydraulic computer models were used to estimate the change in headwater elevation for the three targeted streamflow conditions studied. Figure 17 shows the water depth over the crest of the existing weir and the depth increases that would be expected with the two alternative weir designs. The current depth of water over the crest at the median migration season streamflow of 251 ft3/s before any modifications is about 1.11 ft. The V-type opening modification dropped the gage-pool elevation by about 0.03 ft (fig. 18), reducing the effective increase in depth over the weir from 1.02 to 0.99 ft. If adding the net increase of 0.98 ft, the resulting depth at the weir crest in the area of the modified V-type opening is about 2.10 ft. If the flows are increased to 487 ft3/s, the depth at the weir crest without modification exceeds the 2 BD requirement for all three species. After modification, the computer model simulation indicated a headwater drop of about 0.01 ft. Providing improvement at the extremely low 95-percent-exceedance flow of 98 ft3/s for fish migration was the biggest challenge. At a streamflow of 98 ft3/s, the depth at the weir crest is about 0.68 ft without any modifications. Applying the same logic described previously, the V-type modification would reduce the weir crest elevation by 1.02 ft, but at this lower streamflow, the simulated drop in headwater elevation as a result of the V-type modification was about 0.06 ft. As stated previously, adding the original depth of 0.68 ft with the net increase of 0.96 ft (the original headwater elevation was reduced as a result of the change in crest shape, so the depth gain was reduced by 0.06 ft from 1.02 to 0.96 ft) results in a total depth of about 1.64 ft. The trapezoidal-type modification was designed with similar targeted flow capacity and utilized the same reduction in crest elevation but with different widths and angles. The resulting simulation produced the same decreases in headwater elevations for the trapezoidal modification at 98, 251, and 487 ft3/s flows as it did for the V-type modification. Therefore, both the V-type and trapezoidal-type modifications successfully accomplished the goal of producing depths greater than the targeted 2 BDs at the weir crest.
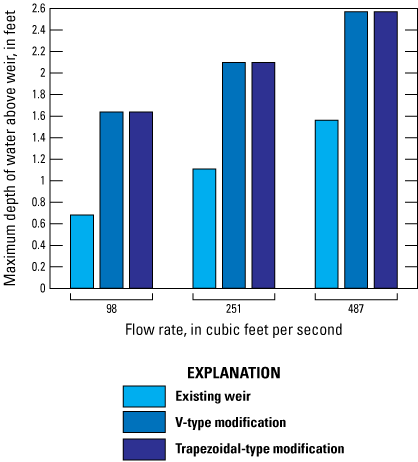
Chart showing the depth of water over the crest of the Blackwells Mills weir for the existing, modified V-type, and modified trapezoidal-type weirs at the 95-, 50-, and 20-percent migration-season exceedance streamflows.
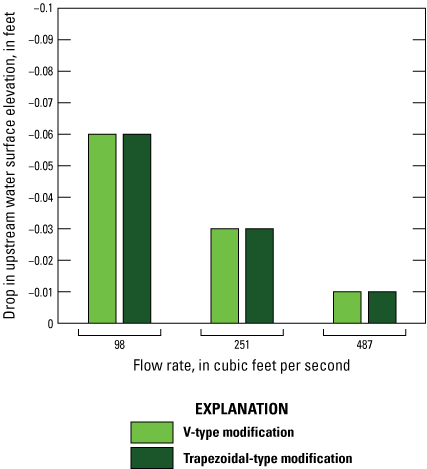
Chart showing the change in simulated upstream water-surface elevation at the Blackwells Mills weir for the modified V-type and modified trapezoidal-type weirs at the 95-, 50-, and 20-percent migration-season exceedance streamflows.
Although the modified V-type opening accomplished the goal of increasing depth at the weir crest, the bigger challenge was increasing the depth conditions on the tailwater side of the weir. The downstream water surface is controlled by natural channel conditions in the reach located downstream of the weir. Adding to the complication is that, often, the downstream side of a weir is protected from scour by using a concrete pad or “skirt” with a small lip at the downstream edge to defuse the velocity and force the flow to slow down as it transitions to the natural stream bottom. The Blackwells Mills weir design fits this description and has an anti-scour skirt along the downstream side. Although the weir is not controlling the downstream water-surface (tailwater) elevation, the boundary conditions for the reach downstream of the weir were used in the computer models to help them simulate the flow depths on the downstream side of the weir. Prior to modifications, the computer models simulated an approximate minimum depth of about 0.45 ft on the downstream side of the weir at the median streamflow of 251 ft3/s (fig. 19). To overcome this obstacle, the skirt on the downstream side of the weir was lowered in the area downstream of the modified V-type opening to allow for a deeper pool on the downstream side of the weir. The skirt was lowered by 4 in. as part of the modified V-type opening design and was gradually tapered back to the original elevation as it extends out laterally to create a smooth transition. In the initial design, the lowered weir skirt on the downstream side provided the additional depth targeted for improved passage conditions, but the computer model simulations continued to show relatively high velocities across the skirt even in the lowered position. Several interim model outputs showed a depressed water surface and sustained higher velocities downstream, showing the model was sensitive to the energy and momentum of the downstream flow and simulated velocities that were higher than expected further downstream of the weir. After several more attempts to make additional modifications to reduce the velocity, the use of three individual blocks along the lowered weir skirt was implemented in the design. The use of individual blocks rather than a solid diffuser was deliberately included in the design. It was decided the blocks provided improved flow conditions by:
-
• reducing velocities across the downstream weir skirt while providing some additional tailwater depth,
-
• creating straight-line flow paths between the blocks, and
-
• generating an attraction flow extending downstream even at lower flows for migrating fish.
These blocks successfully reduced the velocities across the downstream weir skirt and provided some additional tailwater depth. The block elevations were kept relatively low with a slight extension above the original skirt elevation.
The model simulation results at and immediately downstream of the modified weir crest designs show deeper passage conditions, but they also illustrate more complex flow lines similar to what may be experienced in a more natural environment as water passes between and over large and (or) irregular rocks in a stream. The more typical shallow and fast, straight-line flows that were present on the downstream side of the weir during lower flows were transitioned to deeper, slower, and less straight-line flows in the area of the modifications.
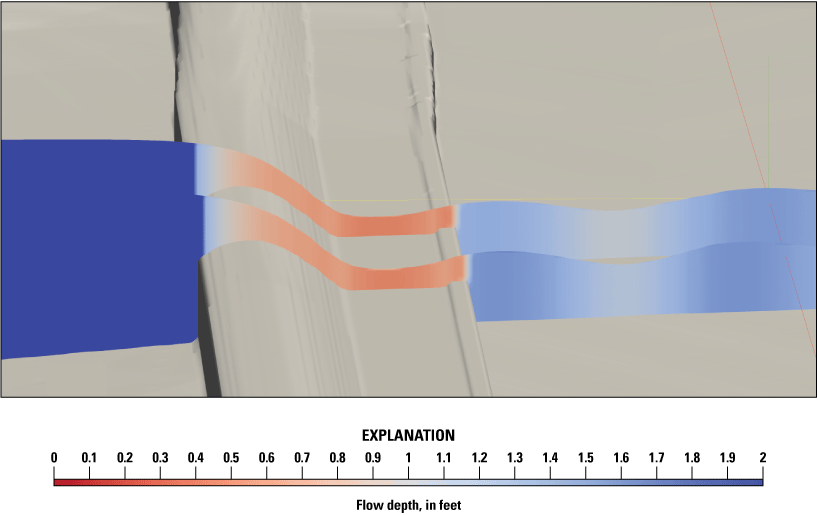
Simulated water depth at the existing Blackwells Mills streamgaging weir with an input streamflow of 251 ft3/s (50-percent exceedance streamflow during migration season). [ft3/s, cubic feet per second]
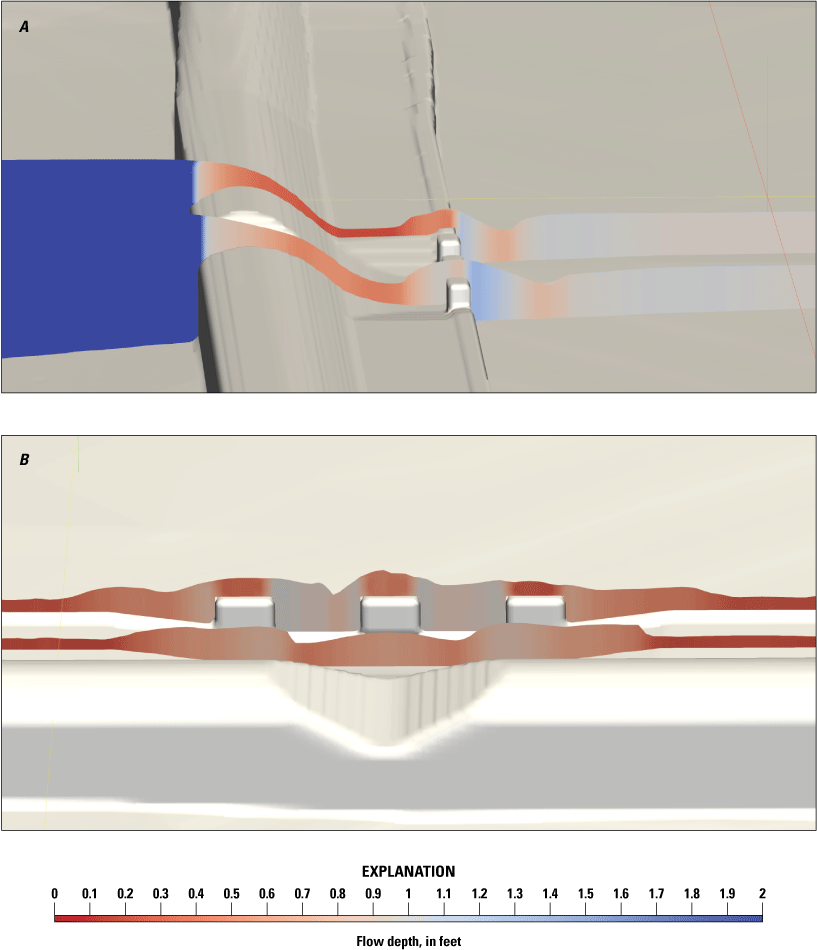
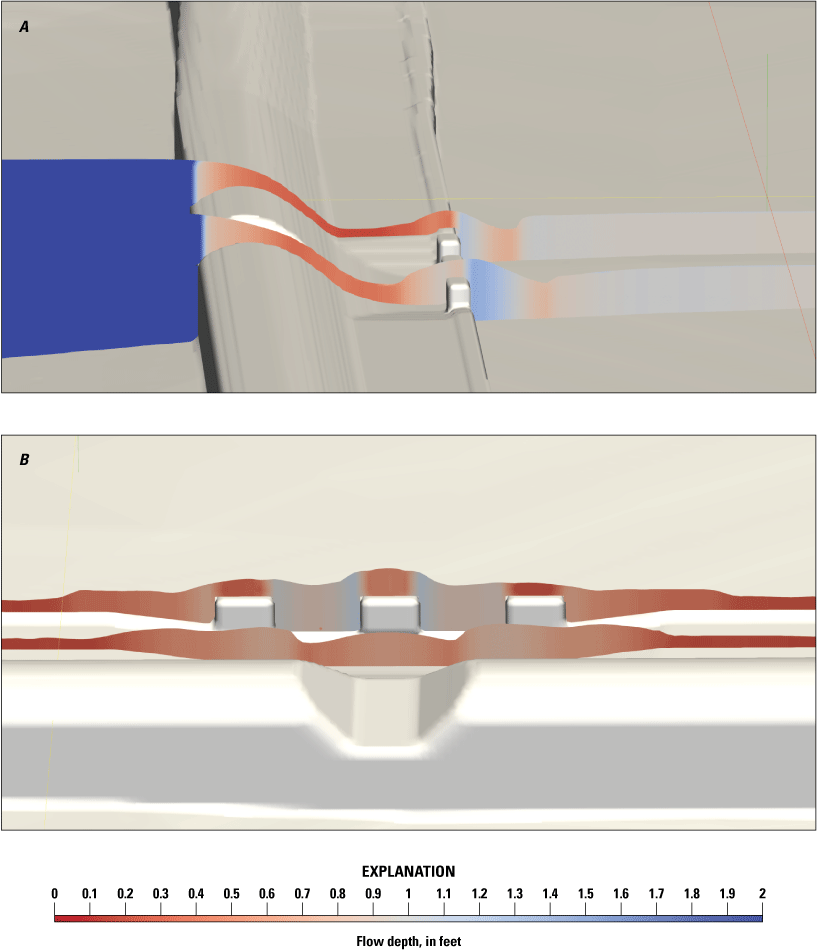
Two views of the simulated median streamflow sliced longitudinally and transversely (with respect to flow direction) in the area of the V-type and trapezoidal modifications are presented in figures 20 and 21. In this “slice” view of the simulation results, the water depth in the modified area stays equal to or greater than about 1 foot deep over the crest and through the transition over the weir skirt and downstream. In the area of the downstream lip (which was indicated as one of the shallower locations in the Haro and others [2017] study), the depths seem to remain greater than 1 ft for both modification designs.
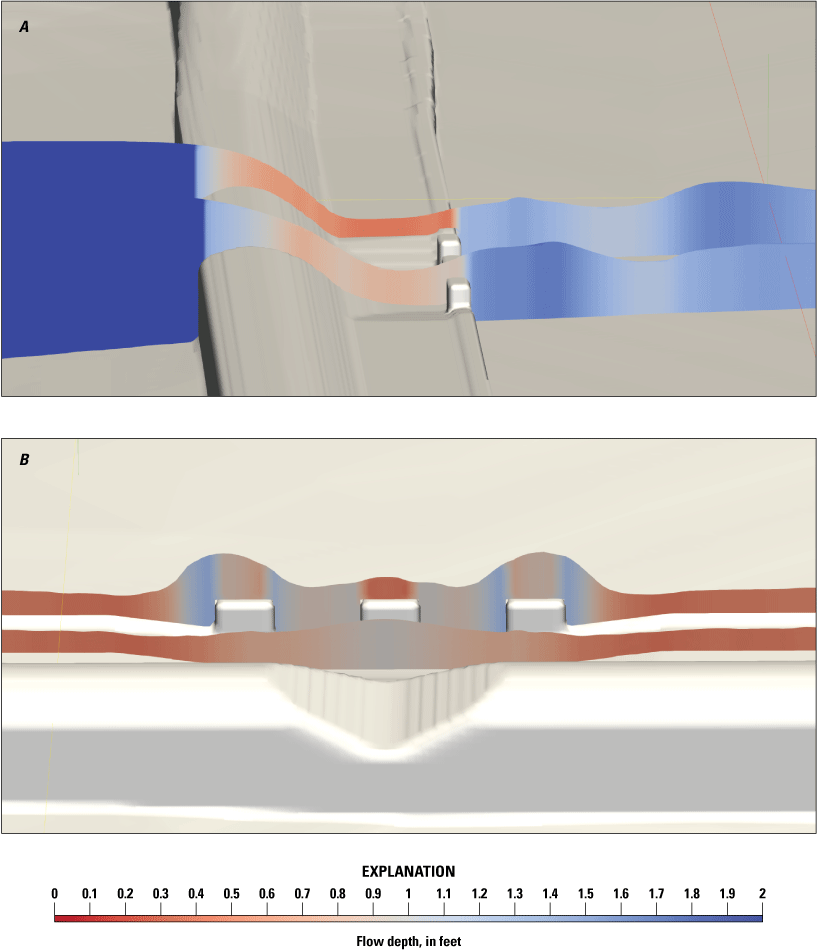
Simulated water depth at the Blackwells Mills weir with an input streamflow of 251 ft3/s for A, the profile view of the modified V-type design and adjacent unaltered weir skirt; and B, cross-section view of the V-type design with water depth only shown on downstream side of weir. [ft3/s, cubic feet per second]
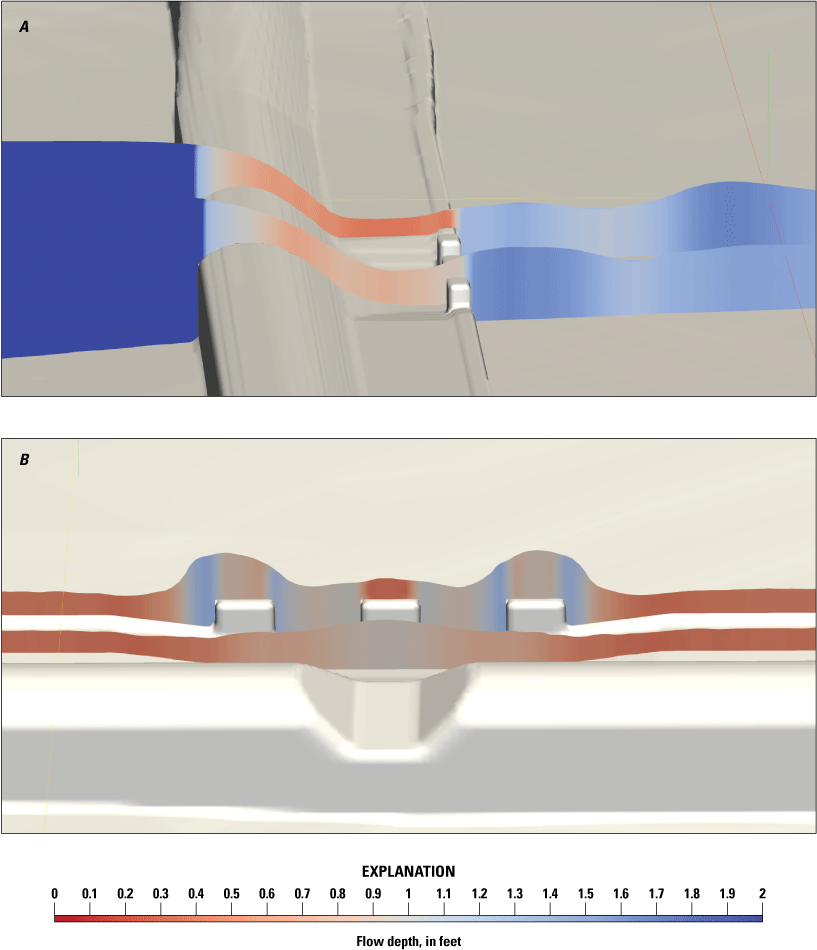
Simulated water depth at the Blackwells Mills weir with an input streamflow of 251 ft3/s for A, the profile view of the modified trapezoidal-type design and adjacent unaltered weir skirt; and B, the cross-section view of the trapezoidal-type weir design with water depth only shown on the downstream side of the weir. [ft3/s, cubic feet per second]
The conditions simulated at the 95-percent-exceedance streamflow of 98 ft3/s showed results that were slightly lower, but consistent with the median streamflow results for both alternative weir designs. Flow is sliced longitudinally and transversely (with respect to the direction of flow) in the area of the V-type, and trapezoidal modifications are presented in figures 22 and 23. Depth in the area of the modified weir crest and skirt drops marginally at the very low 95-percent-exceedance streamflows; however, a depth of approximately 0.6 to 0.7 ft is maintained in the modified area of the weir, which meets the 1 BD requirement for all target species. This contrasts substantially with the existing weir simulation, which produced depths of about 0.2 to 0.3 ft across the sill on the downstream side of the weir.
Simulated water depth at the Blackwells Mills weir with an input streamflow of 98 ft3/s for A, the profile view of the modified V-type design and adjacent unaltered weir skirt; and B, the cross-section view of the modified V-type design with water depth only shown on the downstream side of the weir. [ft3/s, cubic feet per second]
Simulated water depth at the Blackwells Mills weir with an input streamflow of 98 ft3/s for A, the profile view of the modified trapezoidal-type design and adjacent unaltered weir skirt; and B, the cross-section view of the trapezoidal-type weir design with water depth only shown on the downstream side of the weir. [ft3/s, cubic feet per second]
Changes in Mean Channel Velocity Near the Weir
The model simulation results also provided information about reduced velocity conditions along the crest of the weir and the downstream side. For the existing weir, the model-simulated velocities along the crest generally ranged from about 5 to 7–8 ft/s, but on the downstream side along the top of the weir skirt, the simulated velocity was in the range of about 10 ft/s for median and lower streamflow conditions—similar to what was estimated in the Haro and others (2017) study. American shad can overcome velocities of 10 ft/s over short distances, with alewife and blueback herring being capable of sprint speeds of 8 ft/s (Haro and others, 2017). One of the goals for the weir modifications was to reduce the water velocity across the skirt along with providing increased depth. The V-type and trapezoidal modifications with a lowered downstream skirt and individual diffuser blocks increased the depth at the skirt and reduced the average velocity across the skirt and sill downstream of the modified areas to about 7 to 8 ft/s. The maximum-simulated velocities in the model outputs in the area of the modification were about 8.5 ft/s in the area of the sill, versus maximum-simulated velocities exceeding 10 ft/s without the weir modifications. Another potential benefit of the weir modifications realized from the modeling was the disturbance of the more unnatural shallow straight-line flows (figs. 24 and 25) that typically exist without the modifications. These flow disturbances, shown in figure 26, could act as attraction flows for the fish species noted within this study. Many dams evaluated for fish passage are typically much higher and may require more complex fish ladders or ramped designs than the Blackwells Mills weir, which is only about 14 in. high in the center section from the crest to the lowest part of the skirt. Several discussions with NJDEP focused on design ideas to balance streamflow accuracy and sensitivity along with improved passage conditions near the current center of flow led to the approach of utilizing a modified opening design in the center of the weir as the most balanced approach.
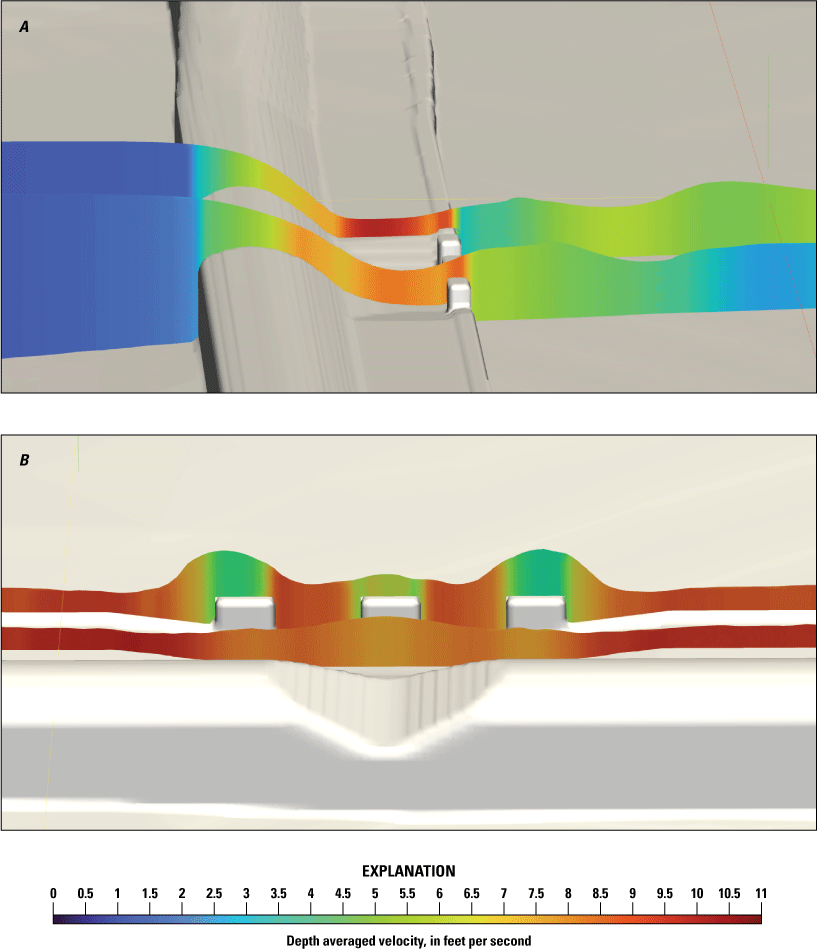
Profile view of simulated water velocity at the Blackwells Mills weir with an input streamflow of 251 ft3/s for A, the profile view of the modified V-type design and adjacent unaltered weir skirt; and B, the cross-section view of the V-type weir design with water velocity only shown on the downstream side of the weir. [ft3/s, cubic feet per second]
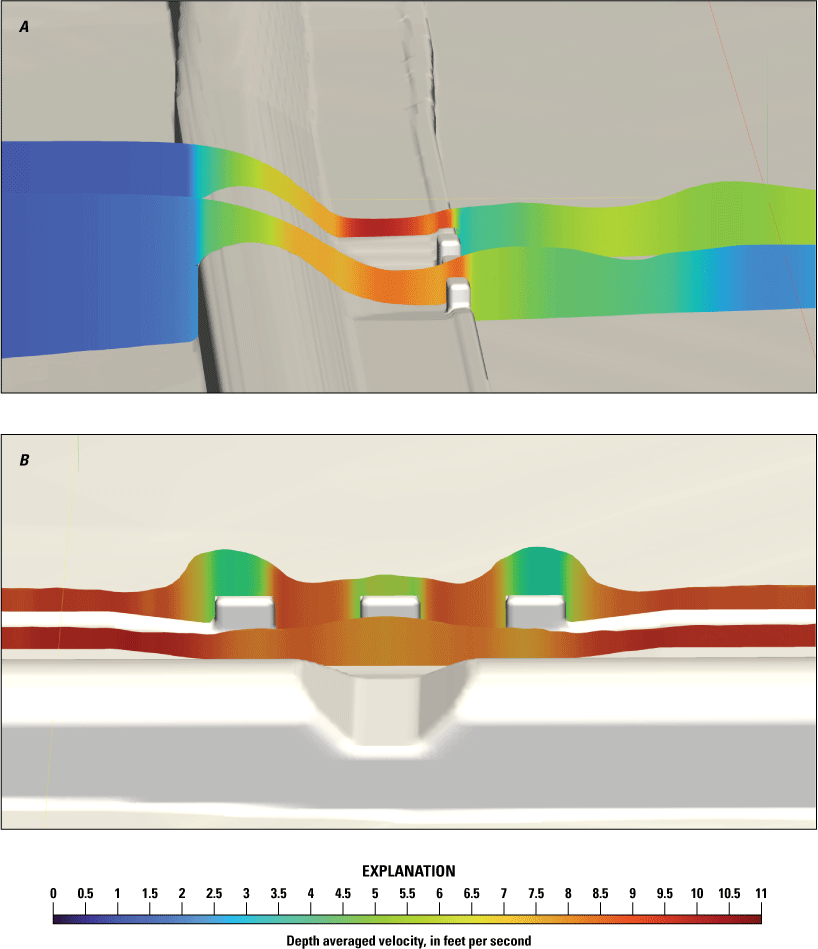
Profile view of simulated water velocity at the Blackwells Mills weir with an input streamflow of 251 ft3/s for A, the profile view of the modified trapezoidal-type design and adjacent unaltered weir skirt; and B, the cross-section view of the trapezoidal-type weir design with water depth only shown on the downstream side of the weir. [ft3/s, cubic feet per second]
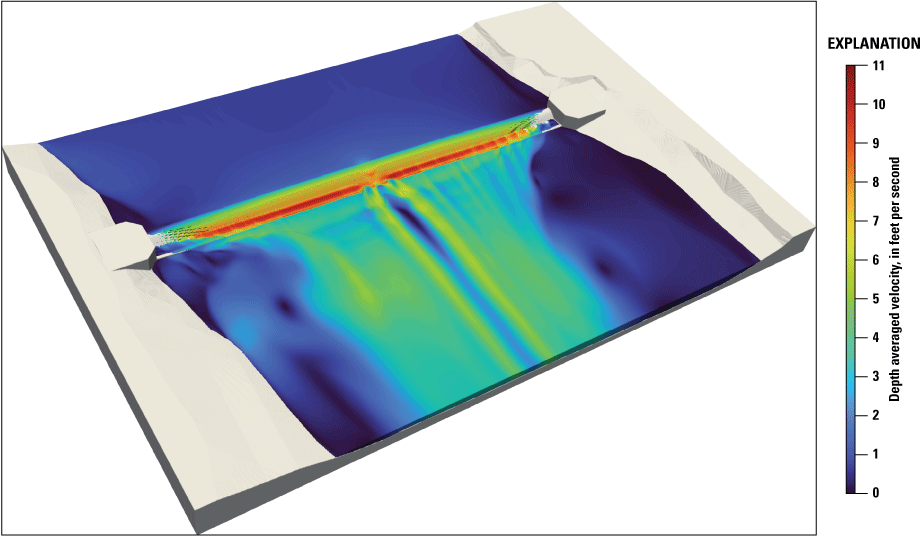
Bird’s-eye view of simulated water velocity through the alternative weir design showing reduced velocity in the area of alteration and attraction jets propagating downstream.
Summary
This study documents the design and modeling results of two alternative weir crest designs developed to help improve fish passage during medium-to-lower streamflow conditions while still maintaining a stable stage-discharge relationship during lower streamflow conditions, which results in more accurate computation of streamflow. The U.S. Geological Survey has operated the streamgage 01402000 Millstone River at Blackwells Mills, New Jersey, since 1921 and utilized a low-head streamgaging weir since 1933 as a hydraulic control to provide an accurate and stable relation between stage and discharge. The continuous record real-time streamflow computed for the Blackwells Mills streamgage is utilized by State and local officials for the management of New Jersey’s water resources and the protection of the aquatic ecosystem of both the Millstone and Raritan River systems. The alternative weir designs were developed to build on the earlier work of Haro and others in 2017. Assumptions and computed data for American shad, alewife, and blueback herring body-depth characteristics, migration season, and associated flows, among other parameters, were accepted in this study from a previous study to maintain consistency between research projects focused on a similar goal. A previous study described that a depth barrier may exist 5 percent of the time for alewife and blueback herring using the 1-body depth (BD) requirement, and about 35 percent of the time if using the more conservative 2 BD requirement, and, for deeper bodied fish like American shad, a 1 BD barrier may exist at flows less than 200 cubic feet per second at the existing weir. The alternative weir designs attempted to meet the conservative 2 BD requirement for alewife and blueback herring at the 95-percent (very low) exceedance streamflow, and the 2 BD requirement at the 50-percent-exceedance streamflow and a 1 BD requirement at the 95-percent-exceedance streamflow condition for deeper-bodied American shad.
The alternative weir designs were developed to minimize major changes to the existing stage-discharge relationship and maintain accuracy and sensitivity to changing streamflow conditions. The hydraulic-control requirements for streamflow accuracy and sensitivity were balanced with providing increased depth at the crest and tailwater and not increasing the water velocity at the weir. The alternative weir designs focused on improved passage at or near the center of flow during typical migration flows. The timing of migration season (April 14 to May 28) and the targeted statistical design flows (95-, 50-, and 20-percent exceedance) were kept consistent with a previous study. The height of the weir at the center of the span is about 14 inches high, so increasing the depth at the weir without creating sharp contraction in streamflow, increased water velocities, or large drops in the headwater elevation was a challenge. The Blackwells Mills weir crest was altered from a smooth, semi-flat, and gradually sloping shape between abutments into two designs. These designs are generally described as a modified “V” shape and a more trapezoidal-shaped modification to the weir crest. The size and shape of both designs were selected to scale the theoretical streamflow in the area of the alternative design to about 5 percent of the total flow across the span. To adjust the tailwater conditions, the weir skirt on the downstream side of the weir was also modified. The final designs include a lowered skirt on the downstream side of the weir in the area of the weir modifications and also included three intermittent, low-level, velocity-diffusing blocks to reduce velocity on the downstream side along the skirt. The lowered skirt was gradually tapered back to the original elevation to avoid any sharp changes in the streambed elevation. The alternative weir designs lowered the crest elevation about 1.02 ft in the center and created a change in headwater elevation of –0.01 to –0.06 ft, which provided the necessary depth to achieve the 2 BD requirement at the crest for all 3 targeted fish species. At the downstream side, the water-surface elevation of the tailwater is controlled by the natural riffles and channel reach downstream of the weir. The weir skirt on the downstream side was lowered by about 4 inches to achieve the 2 BD targeted requirement for alewife and Blueback herring at the 95-percent-exceedance streamflow, and, for the larger-bodied American shad, the lowered skirt achieved the targeted 2 BD condition at the 50-percent-exceedance streamflow and the 1 BD target at the 95-percent-exceedance streamflow. The modeled conditions simulated how flow depth and velocity conditions would change with the alternative designs. Another simulated success was the improved velocity conditions on the downstream side of the weir. The use of the lowered weir skirt on the downstream side with velocity-diffusing blocks generated a deeper tailwater condition with slower velocities when compared to the existing conditions across the downstream weir skirt during similar flows. The simulated-streamflow conditions also displayed good attraction flow patterns that extended downstream of the alternative weir design, even at the lower targeted streamflow that could attract migrating fish. This study utilizes results from computer model simulations of the streamflow conditions and did not actually observe or study the targeted fish species (alewife, blueback herring, and American shad) attempting to migrate upstream at the Blackwells Mills weir with the current or alternative weir designs.
References Cited
Buchanan, T.J., and Somers, W.P., 1982, Stage measurement at gaging stations: U.S. Geological Survey Techniques and Methods book 3, chap. A7, 28 p., accessed January 2, 2026, at https://pubs.usgs.gov/twri/twri3a7/pdf/TWRI_3-A7.pdf.
Bureau of Reclamation, 1997a, Water measurement manual, chapter 7—Weirs, Section 12 Cipoletti weir: Bureau of Reclamation Water Measurement Manual web page, accessed January 24, 2025, at https://www.usbr.gov/tsc/techreferences/mands/wmm/chap07_12.html.
Bureau of Reclamation, 1997b, Water measurement manual, chapter 7—Weirs—Section 3 weir nomenclature and classification: Bureau of Reclamation Water Measurement Manual web page, accessed March 3, 2026, at https://www.usbr.gov/tsc/techreferences/mands/wmm/chap07_03.html.
CloudCompare, 2024, CloudCompare version 2.13.1, accessed November 4, 2024, at https://www.cloudcompare.org/.
Flow Science, Inc., 2024 FLOW-3D HYDRO version 2024R1: Santa Fe, N. Mex., Flow Science, Inc., software release, accessed July 2, 2025, at https://www.flow3d.com.
Flow Science, Inc., 2025, FLOW-3D HYDRO version 2025R1: Santa Fe, N. Mex., Flow Science, Inc., software release, accessed July 2, 2025, at https://www.flow3d.com.
Flow Science, Inc., 2026a, FLOW-3D modeling capabilities—Turbulence: Flow-3D web page, accessed January 5, 2026, at https://www.flow3d.com/modeling-capabilities/turbulence/.
Flow Science, Inc., 2026b, FLOW-3D modeling capabilities—Detailed cutcell representation: Flow-3D web page, accessed January 5, 2026, at https://www.flow3d.com/modeling-capabilities/detailed-cutcell-representation/.
Haro, A., Castro-Santos, T., Noreika, J., and Odeh, M., 2004, Swimming performance of upstream migrant fishes in open-channel flow—A new approach to predicting passage through velocity barriers: Canadian Journal of Fisheries and Aquatic Science, v. 61, no. 9, p. 1590–1601. [Also available at https://cdnsciencepub.com/doi/10.1139/f04-093.]
Haro, A.J., Mulligan, K., Suro, T.P., Noreika, J., and McHugh, A.R., 2017, Hydraulic and biological analysis of the passability of select fish species at the U.S. Geological Survey streamgaging weir at Blackwells Mills, New Jersey: U.S. Geological Survey Scientific Investigations Report 2017–5103, 15 p., accessed July 2, 2025, at https://doi.org/10.3133/sir20175103.
Kiang, J.E., Flynn, K., Zhai, T., Hummel, P., and Granato, G.E., 2018, SWToolbox—A surface-water tool-box for statistical analysis of streamflow time series: U.S. Geological Survey Techniques and Methods, book 4, chap. A11, 33 p., accessed December 1, 2025, at https://doi.org/10.3133/tm4A11.
New Jersey Department of Environmental Protection Bureau of Geologic Information Systems, 2024, Land use/land cover of New Jersey 2020 update: New Jersey Department of Environmental Protection Bureau of Geographic Information Systems database, accessed March 17, 2025, at https://gisdata-njdep.opendata.arcgis.com/datasets/njdep::land-use-land-cover-of-new-jersey-2020-1/about.
New Jersey Water Supply Authority, 2025a, The Raritan Basin system: New Jersey Water Supply Authority web page, accessed April 21, 2025, at https://www.njwsa.org/raritan-basin.html.
New Jersey Water Supply Authority, 2025b, New Jersey Water Supply Authority 2024 annual report and the annual comprehensive financial report for the fiscal years ended June 30, 2024 and 2023: New jersey Water Supply Authority annual report, 115 p., accessed April 21, 2025, at https://www.njwsa.org/uploads/1/0/8/0/108064771/annual_report_2024_11-20-24_revised.pdf.
Niemoczynski, M.J., Suro, T.P., Mulligan, K.B., and Molongoski, K.M., 2026, HEC-RAS and FLOW 3-D HYDRO models used to evaluate alternative weir designs for the Millstone River at Blackwells Mills, New Jersey: U.S. Geological Survey data release, https://doi.org/10.5066/P14T93HI.
Onshape, 2025, Onshape, version 1.196: Boston, Mass., PTC Inc., software release, accessed November 4, 2024, at https://www.onshape.com/.
Rantz, S.E., 1982, Measurement and computation of streamflow: U.S. Geological Survey Water Supply Paper 2175, v. 2, p. 285–631, accessed July 2, 2025, at https://doi.org/10.3133/wsp2175.
Stony Brook Regional Sewage Authority, 2023, Meeting Minutes No. 627, December 18, 2023: Stony Brook Sewage Authority, accessed April 21, 2025, at https://www.sbrsa.org/wp-content/data/meeting627.pdf
Turnipseed, D.P., and Sauer, V.B., 2010, Discharge measurements at gaging stations: U.S. Geological Survey Techniques and Methods book 3, chap. A8, 87 p., accessed July 2, 2025, at https://pubs.usgs.gov/tm/tm3-a8/.
U.S. Army Corps of Engineers, 2025a, HEC-RAS river analysis system: HEC-RAS 2D User’s Manual, version 6.6, 291 p., accessed December 31, 2025, at https://www.hec.usace.army.mil/confluence/rasdocs/r2dum/latest.
U.S. Army Corps of Engineers, 2025b, HEC-RAS river analysis system: HEC-RAS Mapper User’s Manual, version 6.6, accessed December 31, 2025, at https://www.hec.usace.army.mil/confluence/rasdocs/rmum/latest.
U.S. Geological Survey, 2022, USGS original product resolution: U.S. Geological Survey data release, accessed November 4, 2024, at https://www.sciencebase.gov/catalog/item/635cbfc5d34ebe442504cc82.
U.S. Geological Survey, 2025, USGS water data for the Nation: U.S. Geological Survey National Water Information System database, accessed January 24, 2025, at https://doi.org/10.5066/F7P55KJN.
Conversion Factors
U.S. customary units to International System of Units
Datums
Vertical coordinate information is referenced to the North American Vertical Datum of 1988 (NAVD88).
Horizontal coordinate information is referenced to the North American Datum of 1983 (NAD83).
Abbreviations
2D
two-dimensional
3D
three-dimensional
BD
body depth
ft
feet
in.
inches
HEC-RAS
Hydrologic Engineering Center River Analysis System
LULC
land use/land cover
NAD83
North American Datum of 1983
NAVD88
North American Vertical Datum of 1988
NGVD29
National Geodetic Vertical Datum of 1929
NJDEP
New Jersey Department of Environmental Protection
NJWSA
New Jersey Water Supply Authority
USFWS
U.S. Fish and Wildlife Service
USGS
U.S. Geological Survey
Disclaimers
Any use of trade, firm, or product names is for descriptive purposes only and does not imply endorsement by the U.S. Government.
Although this information product, for the most part, is in the public domain, it also may contain copyrighted materials as noted in the text. Permission to reproduce copyrighted items must be secured from the copyright owner.
Suggested Citation
Suro, T.P., Niemoczynski, M.J., and Mulligan, K.B., 2026, Analysis of alternative weir designs for improved passage of select fish at the U.S. Geological Survey streamgaging weir at Blackwells Mills, New Jersey: U.S. Geological Survey Scientific Investigations Report 2026–5002, 31 p., https://doi.org/10.3133/sir20265002.
ISSN: 2328-0328 (online)
Study Area
| Publication type | Report |
|---|---|
| Publication Subtype | USGS Numbered Series |
| Title | Analysis of alternative weir designs for improved passage of select fish at the U.S. Geological Survey streamgaging weir at Blackwells Mills, New Jersey |
| Series title | Scientific Investigations Report |
| Series number | 2026-5002 |
| DOI | 10.3133/sir20265002 |
| Publication Date | May 04, 2026 |
| Year Published | 2026 |
| Language | English |
| Publisher | U.S. Geological Survey |
| Publisher location | Reston, VA |
| Contributing office(s) | New Jersey Water Science Center, Eastern Ecological Science Center |
| Description | Report: ix, 31 p.; Data Release |
| Country | United States |
| State | New Jersey |
| Other Geospatial | Blackwells Mills |
| Online Only (Y/N) | Y |
| Additional Online Files (Y/N) | N |