

Estimation, Distribution, and Development of a Surrogate Model for Escherichia Coli in the New River, New River Gorge National Park and Preserve, West Virginia, 2021–23
Links
- Document: Report (5.09 MB pdf) , HTML , XML
- Download citation as: RIS | Dublin Core
Acknowledgments
This study and the resulting report were funded by the U.S. Geological Survey—National Park Service Water-Quality Partnership. This study would not have been possible without the support of National Park Service staff, including Jennifer Flippin, Kathy Zerkle, Kip Conklin, Matt McQueen, and Bill Parker. U.S. Geological Survey technicians Jeffrey Constantineau, Garrett Rakes, Olli Sweeney, James Scott, Carson Wright, and Jeremy White’s collection of data was vital to this study. We thank Corinne Bowers, Samuel Miller, Chris Custer, Brent Aulenbach, and Amie Brady of the U.S. Geological Survey for their assistance with the statistical methods and models used in this study and review of the manuscript.
Abstract
The New River Gorge National Park and Preserve in West Virginia receives more than 1 million visitors each year, many of whom come to enjoy the New River, which is known for its whitewater recreation. However, most of the tributaries within the New River Gorge are impaired by fecal-coliform bacteria, which are at concentrations that may exceed recreational-contact standards, posing a potential health risk to the public and, therefore, creating a need to better understand the spatial and temporal distribution of fecal-coliform bacteria and to communicate this information to park visitors.
Concentrations of Escherichia coli, a species of fecal-coliform bacteria, were monitored in the New River and selected tributaries from October 2021 through September 2023, with emphasis placed on the primary recreational-contact season from May through October. Composite and cross-sectional water samples were taken from three U.S. Geological Survey (USGS) monitoring locations: the New River at Highway 41 at Prince, West Virginia (USGS 03184905), New River at Thurmond, West Virginia (USGS 03185400; hereafter, Thurmond), and New River at Fayette, West Virginia (USGS 03186000). Periodic longitudinal transects included water samples collected below seven major tributaries of the New River within the gorge. Water-quality parameters, including water temperature, pH, specific conductance, dissolved oxygen, and turbidity, were recorded with each E. coli water sample.
During the 2 years of sampling, E. coli concentrations in samples collected from the New River ranged from less than 1 to 1,100 most probable number (MPN) per 100 milliliters (MPN/100 mL). The recreational-contact standard, which is based on the U.S. Environmental Protection Agency 90th-percentile statistical threshold value for E. coli concentrations (320 MPN/100 mL), was exceeded in 11 of the 110 samples collected from the New River during this study. Water-quality parameter measurements and E. coli concentrations in collected samples were generally consistent among USGS monitoring locations throughout the New River Gorge; however, storm events created notable exceptions because they increased tributary streamflow and E. coli concentrations in samples, particularly at the New River below Piney Creek at McCreery, West Virginia (USGS 03185208), and New River Below Arbuckle Creek at Thurmond, West Virginia (USGS 03185440), monitoring locations. Escherichia coli concentrations of cross-sectional samples tended to be consistent across the New River, except for a few nearshore samples.
Sample E. coli concentrations and corresponding measurements of continuous water-quality parameters, streamflow, and precipitation data from Thurmond and the Piney Creek at Raleigh, West Virginia (USGS 03185000; tributary to the New River) monitoring locations were evaluated for use in a near-real-time E. coli surrogate model. The antecedent mean 24-hour turbidity at Thurmond was selected as the best variable for a simple linear regression surrogate model for the log10 E. coli concentration in the New River and had an adjusted coefficient of determination of 0.556 and a p-value of less than 0.001. The regression equation surrogate model suggests that the recreational-contact standard is exceeded when the antecedent mean 24-hour turbidity at Thurmond is 23.6 formazin nephelometric units or higher (with a 95-percent confidence interval of 19.4–30.7 formazin nephelometric units). Evaluated against a turbidity duration curve, this standard is exceeded 7.5 percent of the time at Thurmond. This surrogate model could help New River Gorge National Park and Preserve staff provide near-real-time information about E. coli concentrations and related recreational-contact risks to the public.
Introduction
The New River Gorge National Park and Preserve (NERI) protects the natural and cultural heritage of the New River where it cuts through the central Appalachian Mountains in West Virginia, creating one of the deepest and longest gorges in the Eastern United States. One of the primary management objectives of NERI is to continue to protect the New River’s whitewater resources for recreational use (Good and Stasick, 2008). In 2023, NERI received more than 1.7 million visitors (Tate, 2024), many of whom participated in water-based recreation. Upwards of 60,000 people per year raft the New River with commercial whitewater guiding services (Rose, 2019), along with countless unguided boaters, anglers, and swimmers. With so many visitors using New River’s water resources, understanding how its water quality may affect public health and recreation is important.
Fecal-coliform bacteria live in the gut of warm-blooded animals (including humans) and can indicate that water resources have been contaminated by human waste, agricultural runoff, and wildlife (U.S. Environmental Protection Agency, 2021). Investigations by Federal and State agencies led the West Virginia Department of Environmental Protection to designate the New River and 15 tributaries within NERI as waters impaired by elevated fecal-coliform bacteria concentrations (Mahan and Young, 2018; Tetra Tech, Inc., 2008). Other investigations suggest that patterns of fecal-coliform bacteria concentration in the New River and its tributaries are complex and dynamic. A U.S. Geological Survey (USGS) study found highly variable fecal-coliform concentrations in the New River and its tributaries, exceeding the recreational-contact guidelines in effect at the time of the study in about one-third of samples, with bacteria concentrations affected by streamflow, topography, and season (Paybins and others, 2000). The National Park Service has previously indicated that several tributaries and nearshore access points of the New River often exceed recreational-contact guidelines in effect at the time of the study for fecal-coliform concentrations (Wilson and Purvis, 2000, 2003). However, fecal-coliform concentrations in the main channel of the New River may differ from those in tributary streams and nearshore areas.
Fecal-coliform bacteria samples are not collected with enough frequency to provide near-real-time information to park visitors. Therefore, this study aims to increase understanding of the spatial and temporal variability of fecal-coliform bacteria in the New River, specifically Escherichia coli, a species of fecal-coliform bacteria with a strong correlation to the occurrence of gastrointestinal illness in humans (U.S. Environmental Protection Agency, 2021). Analyzing E. coli concentrations alongside continuously monitored water-quality parameters in the New River may facilitate development of E. coli surrogate water-quality models that could provide park managers and visitors with better information about the safety of recreational contact in the New River. Similar surrogate models have been used for E. coli monitoring tools for the Chattahoochee River in Georgia (Chattahoochee River National Recreation Area; Aulenbach and McKee, 2020) and the Cuyahoga River in Ohio (Cuyahoga Valley National Park; Brady and Plona, 2015) in previous USGS and National Park Service water-quality partnerships and may inform future efforts in NERI.
Purpose and Scope
The purpose of this report is to document the collection and analysis of water-quality parameters and E. coli concentrations in NERI and to develop a near-real-time surrogate model to estimate E. coli concentrations and provide timely information to National Park staff and visitors about the risks associated with using the New River recreationally. An assessment of the cross-sectional and longitudinal variability of water-quality parameters and E. coli concentrations will help determine how well the near-real-time surrogate model estimates E. coli concentrations throughout the New River Gorge.
Description of Study Area
The New River originates in North Carolina and flows northward through Virginia and West Virginia to its confluence with the Gauley River where the two rivers form the Kanawha River, which continues northwest to the Ohio River (fig. 1). The New River Gorge in south-central West Virginia was formed by the New River downcutting though the Appalachian Plateau; the gorge extends for about 60 miles between the City of Hinton and Town of Gauley Bridge, West Virginia. Much of the flow of the New River entering the New River Gorge is regulated by Bluestone Dam, a 165-foot-tall dam operated by the U.S. Army Corps of Engineers just upstream from the confluence of the New River with the Greenbrier River (U.S. Army Corps of Engineers, 2024).
The New River Gorge watershed is mostly forested (Tetra Tech, Inc., 2008) but has several developed areas, including the Cities of Beckley (with a population of 17,270), Mount Hope (1,333), and Oak Hill (8,167) and the Town of Fayetteville (2,898) in the western half of the watershed (U.S. Census Bureau, 2025). Coal mining and the transport of coal by railroad were the dominant economic forces in the New River Gorge from the late 1800s to the 1960s. While coal mining has largely ceased in the gorge, abandoned mines and the many small communities that formerly supported the industry attest to the region’s mining past (Mahan and Young, 2018). Other economic activities in the region include timber harvesting, light manufacturing, agriculture, and animal husbandry, with livestock noted as a minor source of fecal-coliform bacteria (Mathes and others, 2007; Tetra Tech, Inc., 2008).
Tributaries flowing into the New River within the New River Gorge include smaller streams. Piney Creek, the largest tributary within the gorge, has a total drainage area of 136 square miles (U.S. Geological Survey, 2025b). Many of these tributaries are listed as “impaired” by the West Virginia Department of Environmental Protection owing to fecal-coliform bacteria, iron, aluminum, and biological community impairment, among other causes (Tetra Tech, Inc., 2008). Fecal bacteria impairments are largely attributed to inadequate domestic wastewater disposal and treatment because many smaller communities in the area lack sufficient sewerage (Paybins and others, 2000; Mathes and others, 2007; Tetra Tech, Inc., 2008). As a result of inadequate wastewater disposal infrastructure, combined sewer outfalls, failing septic systems, and “straight pipes” that discharge wastewater directly into nearby surface waters are substantial sources of fecal-coliform bacteria (Tetra Tech, Inc., 2008). A part of the New River Gorge watershed was designated as a national river to be managed by the National Park Service by the National Parks and Recreation Act of 1978 (16 U.S.C. 460m-15; Good and Stasick, 2008). In 2020, this New River Gorge National River was redesignated as NERI (National Park Service, 2021). The formal NERI boundary encompasses roughly 72,000 acres of the New River Gorge from the City of Hinton in the south to Hawks Nest in the north. NERI generally includes the New River, the New River Gorge, the immediately surrounding plateau, and the lower reaches of the larger tributaries of the New River. Within the designated NERI boundary, about 74 percent of the land is owned by the Federal Government, and the remaining 26 percent is owned by the State of West Virginia and private landowners (West Virginia GIS Technical Center, 2017).
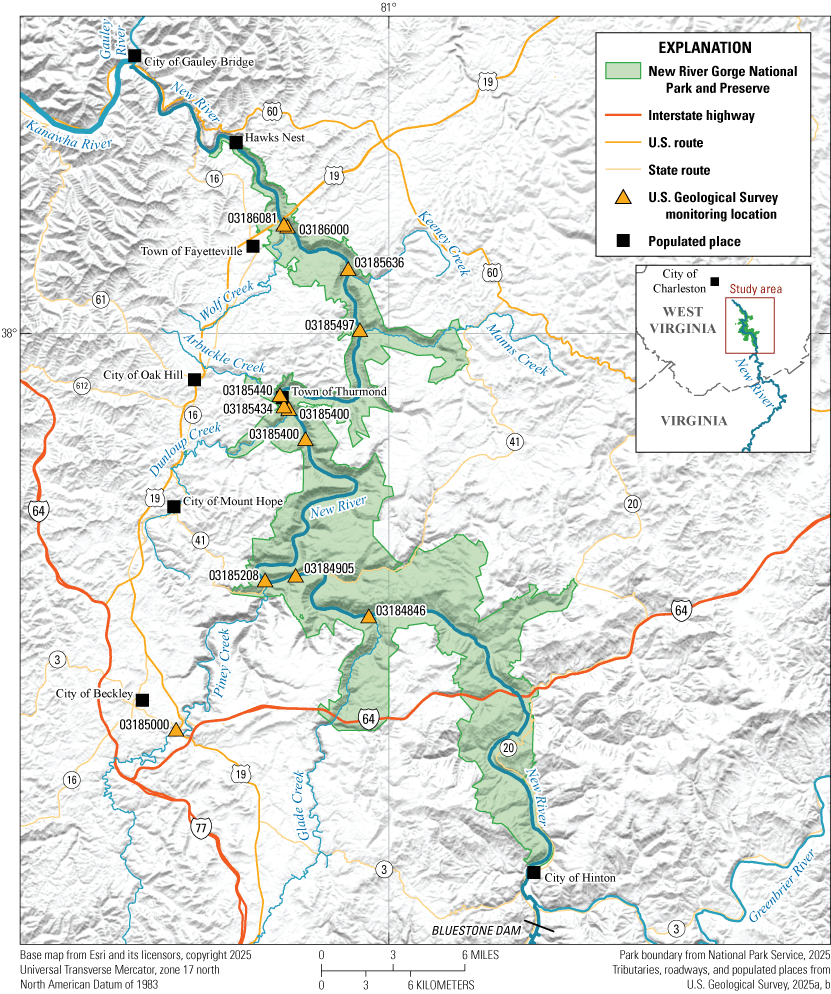
Map showing the New River Gorge National Park and Preserve in south-central West Virginia, including major tributaries, geographical features, and U.S. Geological Survey monitoring locations. Additional location information is available from U.S. Geological Survey (2025c).
Study Design
A multifaceted approach was used to discern patterns in water quality and the occurrence and distribution of E. coli in the New River Gorge. An overview of the study design is provided herein to provide additional context for the reader, with additional detail in the “Methods of Data Collection and Analysis” section of the report.
The monitoring location at the New River at Thurmond, West Virginia (USGS 03185400; hereafter, Thurmond; U.S. Geological Survey, 2025c) was fundamental to this study. Centrally located in the New River Gorge, Thurmond is a streamgage paired with a continuous water-quality monitor, which made the location ideal to gather data for an E. coli surrogate model. Thurmond began operation as a streamgage in February 1981. Continuous measurements of water temperature, pH, dissolved oxygen, specific conductance, and turbidity started at this monitoring location in June 2019. Discrete measurement of water-quality parameters and the sampling for and quantification of E. coli concentrations near Thurmond were done to develop a relation between E. coli concentrations and the continuously measured water-quality parameters.
To supplement the continuous and discrete sampling at Thurmond, two additional monitoring locations were established at bridges near the upper and lower ends of the gorge: the New River at Highway 41 at Prince, West Virginia (USGS 03184905; hereafter, Prince) and the New River at Fayette, West Virginia (USGS 03186000; hereafter, Fayette). These locations encompass the part of the New River where most recreational use happens. Water-quality parameters taken from discrete measurements and water samples taken from Prince and Fayette provided a basis for determining how E. coli concentrations varied throughout the gorge and for being able to assess how well a model developed from monitoring data at Thurmond might represent conditions at other locations within the gorge.
To assess the variability of E. coli concentrations across the width of the New River, cross-sectional water samples, consisting of five single vertical water samples across the width of the New River, were collected at Prince, Thurmond, and Fayette. These cross-sectional samples can also be used to understand any bias or discrepancies in composite sampling techniques or when comparing single (non-composited) samples.
The final component of the study included periodic longitudinal transect sampling of the New River Gorge study area, which included sampling below the mouth of large tributaries, to provide further understanding of the variability in water-quality parameters and E. coli concentrations along this reach of the river.
Collectively, these study-design elements supported the development of a near-real-time surrogate model of estimated E. coli concentrations at Thurmond and an assessment of how well the surrogate model represents E. coli conditions throughout the New River Gorge.
Methods of Data Collection and Analysis
A variety of field, microbiological, and quality-control methods were used to collect and analyze data for this project. Sampling sites are listed in table 1 and shown in figure 1. All water-quality data are publicly available in the USGS Water Data for the Nation database in accordance with USGS policy (U.S. Geological Survey, 2025c).
Table 1.
U.S. Geological Survey monitoring locations in the New River Gorge National Park and Preserve used to develop a surrogate mode for Escherichia coli in the New River, New River Gorge National Park and Preserve, West Virginia, 2021-23.[Data are from U.S. Geological Survey (2025c). USGS, U.S. Geological Survey; NAVD 88, North American Vertical Datum of 1988; km, kilometer; BL, below; WV, West Virginia; Hwy, highway; NR, near; NA, not applicable]
Continuous-Monitoring Streamflow and Water-Quality Parameters
During this study, gage height at Thurmond was measured at 15-minute intervals using a submersible pressure transducer. Streamflow at this location was derived from gage-height data based on a stage-discharge rating model using methods described by Sauer and Turnipseed (2010) and Turnipseed and Sauer (2010).
Turbidity, specific conductance, pH, water temperature, and dissolved oxygen (hereafter collectively called water-quality parameters) have been measured at the Thurmond monitoring location beginning in June 2019. During this study, these water-quality parameters were measured every 15 minutes using a YSI EXO3 sonde (Yellow Springs Instruments, Inc.; Yellow Springs, Ohio), and sensors were operated in accordance with guidelines described in Wagner and others (2006). All continuous-monitoring streamflow and water-quality parameters data were reviewed, approved, and stored in the USGS Water Data for the Nation database (U.S. Geological Survey, 2025c).
Discretely Measured Water-Quality Parameters and Water Sampling Methods
Field methods used to collect discrete samples measuring water-quality parameters and water samples, which were subsequently analyzed for E. coli, generally followed standard USGS protocols and methods (Wilde, 2002, 2004; Anderson, 2005; Wagner and others, 2006; U.S. Geological Survey, 2006, 2023; Myers and others, 2014). However, some slight modifications to standard practices were made in specific instances to adapt to the challenges of sampling in the New River Gorge and are detailed in the following sections.
Composite Water Samples
Discrete, depth-and-width integrated water samples, hereafter referred to as composite water samples, were collected from three monitoring locations within the New River Gorge. Water samples for Thurmond were collected from the Fayette County Road 25 bridge at Stone Cliff, approximately 2.4 kilometers (km) upstream from the monitoring location (fig. 1). Because no substantial hydrological features enter the New River between Stone Cliff bridge and the Thurmond monitoring location, discrete sampling and streamflow measurements made from the Stone Cliff bridge are assumed to represent the conditions at Thurmond. Two additional monitoring locations were established at the upper and lower ends of the New River Gorge to assess the spatial variability of E. coli and whether a surrogate model could cover the primary area of water-based recreation. Samples were taken approximately 23 km upstream from Thurmond at Prince via the West Virginia Highway 41 bridge, and approximately 22 km downstream from Thurmond at Fayette via the Fayette County Road 82 bridge.
The composite water samples from Prince, Thurmond, and Fayette were collected twice per month during the peak recreational-contact season (May through October) and once per month during the off-peak recreational-contact season (November through April). Composite water samples were collected with isokinetic samplers, either a DH–95 or a DH–2 (depending on stream depth), lowered through the water column from surface to stream bottom using a bridge crane (fig. 2; U.S. Geological Survey, 2006; Wilde and others, 2014). The composite water samples consisted of subsamples collected from 10 equally spaced points across the stream width. Each subsample was transferred to a churn splitter, resulting in a depth- and width-integrated composite water sample. Immediately after all 10 subsamples were collected, the churn was taken to the mobile laboratory for processing, during which the composite water sample was mixed using the churn’s agitator. Once the water sample was sufficiently mixed (a minimum of 10 strokes of the agitator), an aliquot of water was decanted so that the E. coli concentration in the water sample could be determined.
Water-quality parameters were measured and recorded with each subsample taken from across the stream width. Water-quality parameter measurements were taken at approximately mid-depth of each of the 10 subsampling points. The median value of the 10 subsample field measurements was associated with the composite sample. All water-quality parameter measurements were made using a YSI EXO multiparameter water-quality sonde (Yellow Springs Instruments, Inc.; Yellow Springs, Ohio) following established USGS techniques and methods (U.S. Geological Survey, 2023).
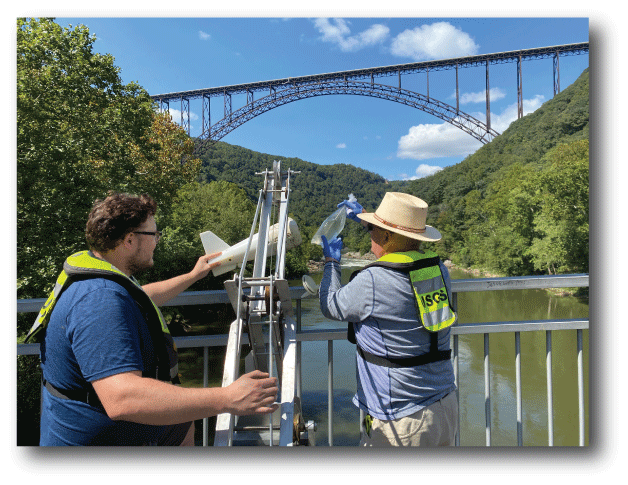
Photograph showing U.S. Geological Survey (USGS) personnel collecting a water sample at the Fayette monitoring location on the New River, West Virginia, in September 2022 using a DH–2 sampler and bridge crane. Photograph by Matthew R. Kearns, USGS. Additional location information is in table 1.
Cross-Sectional Water Samples
Discrete, cross-sectional water samples were collected quarterly, coinciding with the collection of depth- and width-integrated composite samples at Prince, Thurmond, and Fayette. Cross-sectional water samples were collected with isokinetic samplers, either a DH–95 or a DH–2 (depending on stream depth), lowered through the water column using a bridge crane (U.S. Geological Survey, 2006; Wilde and others, 2014). Cross-sectional water samples consisted of depth-integrated vertical samples collected at five points: 15, 35, 50, 65, and 85 percent of the stream’s width at each monitoring location. The five cross-sectional water samples were not composited; instead, after gently shaking the sampler to resuspend any particulate matter, an aliquot of water was immediately decanted to determine the E. coli concentration.
Water-quality parameters were measured and recorded with each of the five cross-sectional water samples. These measurements were made at approximately mid-depth at each cross-section sampling point. All field measurements were made using a YSI EXO multiparameter water-quality sonde following established USGS techniques and methods (U.S. Geological Survey, 2023).
Longitudinal-Transect Water Samples
Four longitudinal transects were done to evaluate the potential effect that large tributaries within the New River Gorge had on New River E. coli concentrations. Each longitudinal transect was intended to be approximately 53 km of the New River to collect water samples downstream from the mouths of seven tributaries (Glade Creek, Piney Creek, Dunloup Creek, Arbuckle Creek, Manns Creek, Keeney Creek, and Wolf Creek) while also collecting water samples from Prince, Thurmond, and Fayette (fig. 1).
Collecting water samples in the New River Gorge is challenging because of the steep gradient, hazardous rapids (class III-V), and the lack of access points or bridges near key tributaries. These challenges dictated that water samples be collected from inflatable watercraft: a motorized catamaran was used in the upper gorge (from Glade Creek to Manns Creek) and human-powered rafts were used in the lower gorge (Manns Creek to Wolf Creek). However, width-integrated water samples still could not be collected at all monitoring locations. Therefore, to eliminate potential bias related to sampling technique, all longitudinal-transect water samples were collected from a single depth-integrated vertical sample.
To ensure the single-vertical water sample represented mixed New River and tributary waters, water-quality parameters were measured at cross sections using a YSI EXO multiparameter water-quality sonde. In the upper gorge, three-point cross sections of field measurements were recorded at 25, 50, and 75 percent of stream width. A series of cross sections was sampled; the first cross section was just below the tributary mouth, and subsequent downstream cross sections were sampled until field measurements were in good agreement, indicating well-mixed tributary and New River waters. After this was done, a single depth-integrated vertical water sample was collected from the mid-channel of the New River by lowering a DH–95 sampler through the water column (fig. 3).
In the lower New River Gorge, the monitoring locations below tributaries were in reaches with hazardous (class III–V) rapids. The steep gradients, high velocities, and strong turbulence in these reaches made holding position at three points for cross-section measurements exceedingly difficult in human-powered watercraft. Because the river was assumed to be well-mixed with natural turbulence at these monitoring locations, a single, mid-channel set of water-quality parameters was measured, and a single depth-integrated vertical water sample was collected with a DH–95 sampler at the closest downstream location where position could be safely maintained. All longitudinal-transect water samples were kept on ice until prepared for microbiological analyses. After gently shaking the water sample to resuspend any particulate matter, an aliquot of water was decanted to determine E. coli concentration.
Longitudinal transects of the New River Gorge were done twice during the peak recreational-contact season in 2022 and 2023. The two transects done during 2022 were completed in one day (July 19 and September 1). However, because of logistical constraints, the August 25, 2023, transect covered only the section from Glade Creek to Arbuckle Creek, and the October 2023 transect was done over 3 days from October 11 to 13.

Photograph of U.S. Geological Survey (USGS) personnel collecting a water sample at the Fayette monitoring location on the New River, West Virginia, from a raft during the October 2023 longitudinal transect using a DH–95 sampler. Photograph by Carson Wright, USGS. Additional location information is in table 1.
Determining E. coli Concentration in Water Samples
The concentration of E. coli in water samples was determined using the Colilert Quanti-Tray/2000 defined-substrate method (IDEXX Laboratories, Inc., Westbrook, Maine) using a most probable number (MPN) estimate, which is a U.S. Environmental Protection Agency (EPA) approved standard method (Lipps and others, 2018). Aliquots of 100 milliliters of each water sample were decanted and transferred to a sterile mixing vessel to be analyzed using the Colilert Quanti-Tray/2000 system. The contents of a Colilert reagent packet were added to the water sample, which was gently agitated until the reagent completely dissolved. The water sample-reagent solution was poured into a Colilert Quanti-Tray/2000 and incubated for 22–24 hours at 35 degrees Celsius prior to analysis.
Determining E. coli by the Colilert method is a two-step process that relies on taxon-specific enzymes to metabolize provided substrates, ortho-Nitrophenyl β-D-galactopyranoside (ONPG) and 4-methylumbelliferyl β-D-glucuronide (MUG), to produce readily observable changes. First, coliform bacteria use β-D-galactosidase enzyme to metabolize ONPG, which results in a yellow color. Escherichia coli use β-glucuronidase enzyme to metabolize MUG, yielding 4-methylumbelliferone, which fluoresces under ultraviolet light (Lipps and others, 2018). Therefore, Colilert Quanti-Tray/2000 wells that appear yellow in visible light are positive for total coliform bacteria, and those that are yellow and fluoresce under ultraviolet light are positive for E. coli (fig. 4).
The number of small and large wells positive for total coliform bacteria and E. coli were compared with the Colilert Quanti-Tray/2000 MPN table to provide the estimated concentration of E. coli in MPN per 100 milliliters of sample water. The specific methods of this microbiological analysis (without dilution) result in a minimum concentration of less than 1 MPN per 100 milliliters (MPN/100 mL) and a maximum concentration of greater than 2,400 MPN/100 mL. For numerical and statistical analysis, any samples with a censored concentration of less than 1 MPN/100 mL were adjusted to 1 MPN/100 mL.
In this report, E. coli concentration results are compared with recommended recreational water-quality criteria from the EPA. Due to the sampling frequency of this project, and in consultation with the National Park Service and relevant references (National Park Service, 2019), the EPA E. coli 90th-percentile statistical threshold value (STV) was selected as the relevant comparison value. For an estimated illness rate of 32 per 1,000 primary contact recreators, the STV for E. coli concentration is 320 MPN/100 mL (U.S. Environmental Protection Agency, 2015); this value will be referred to as the recreational-contact standard hereafter. In this report, bacteria are reported by the whole number for values less than 10 and with 2 significant figures for values greater than 10.
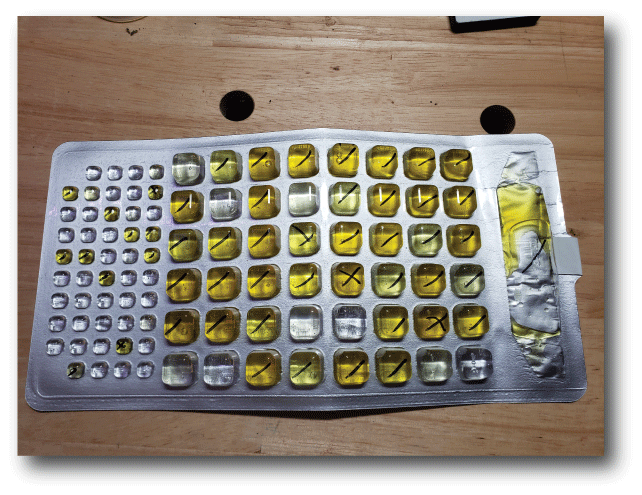
Photograph showing a Colilert Quanti-Tray/2000 (IDEXX Laboratories, Inc., Westbrook, Maine) after incubation and Escherichia coli determination. A two-step substate turns yellow to indicate coliform bacteria are present (marked with “/”), and ultraviolet florescence indicates E. coli bacteria (marked with “\” to make an “X”). This tray has three large wells and two small wells positive for E. coli, resulting in an E. coli concentration of five most probable number (MPN) per 100 milliliters (MPN/100 mL) of sample water, with a 95-percent confidence interval of 1.7–10.6 MPN/100 mL. Photograph by Matthew R. Kearns, U.S. Geological Survey.
Quality Control and Quality Assurance
All field equipment that contacted the water sample, including the sample bottle, sampler nozzle cap, nozzle, and churn, was sterilized before use. The sample bottle, nozzle cap, and nozzle were sterilized in an autoclave at 121 degrees Celsius at 15 pounds per square inch for 15 minutes. The churn splitter was too large to fit in the available autoclave and was sterilized by chemical means using a sodium hypochlorite solution (Myers and others, 2014). The churn splitter was filled with a 0.005 percent sodium hypochlorite solution, and pH was adjusted to between 6 and 7 for maximum bactericidal potency, for a minimum of 30 minutes, after which the churn was drained. After the sodium hypochlorite soak, the churn splitter was rinsed with a dilute sodium thiosulfate solution to neutralize any remaining chlorine. After 5 minutes of contact with the sodium thiosulfate solution, the churn splitter was rinsed with sterile deionized water, bagged, and stored until use in the field.
Cleaning and handling methods were confirmed with a series of field blanks during the course of the study. Blank water was created by autoclaving a phosphate-buffered saline solution. During the course of the study, nine field blanks were processed and analyzed in the same manner as field samples. All blanks returned an E. coli concentration of less than 1 MPN/100 mL, the minimum E. coli MPN of the concentration determination method used.
Replicate samples were also used to verify field methods and help quantify variability in the microbiological analysis. Eight replicate samples were obtained during the study: five split replicates were obtained from the churn splitter during the composite depth- and width-integrated sampling, and three sequential replicates were obtained with the single vertical samples during the longitudinal transect. All regular and replicate sample pairs had E. coli concentrations that had overlapping 95-percent confidence intervals of the most probable number and were thus considered not significantly different.
As a final quality-control note, the mid-point sample during the January 10, 2023, cross-sectional sampling event at Prince was lost during processing. Escherichia coli concentration results were unavailable for this water sample.
Statistical Methods and Analysis
In addition to the MPN, IDEXX provides upper and lower 95-percent confidence limits for E. coli concentrations based upon the number of positive wells in the sampling method (North Carolina Department of Environmental Quality, 2025). Because upper and lower 95-percent confidence limits for the E. coli MPN are provided, this report uses non-overlapping intervals between samples to indicate statistical significance instead of computing separate statistical tests. Comparing the 95-percent confidence intervals to determine statistical significance will result in an alpha value of approximately 0.0006 (Knoll and others, 2011). This value is more conservative than the alpha value of 0.05, which is more commonly used and will therefore create a higher threshold for statistically significant differences (Goldstein and Healy, 1995).
The linear regression model and associated statistical tests and metrics within this report were computed using the statistical programming software R (ver. 4.4.0; R Core Team, 2023) by modifying the suggested code from Helsel and others (2020). R packages, including tidyverse (Wickham, 2023), dataRetrieval (DeCicco and others, 2025), ggplot2 (Wickham and others, 2025), leaps (Lumley, 2024), car (Fox and others, 2024), olsrr (Hebbali, 2024), ppcc (Pohlert, 2020), and asbio (Aho, 2025), supplemented the capabilities of base R. More specifically, the linear regression used for the surrogate model was computed with the “lm()” function, and confidence intervals were computed using the “predict()” function.
Results and Discussion
This study’s design permits an assessment of water-quality parameters and E. coli concentrations in the New River at a variety of spatial and temporal scales. A single monitoring location can be evaluated for seasonal variability in the New River, cross-sectional samples can support evaluation across the width of the river, and multiple monitoring locations upstream and downstream can be used to evaluate longitudinal variability in the river. Understanding the variability of water-quality parameters and E. coli concentrations throughout the New River can assist with the development and application of an E. coli surrogate model, discussed in the following sections of this report.
Water-Quality Parameters and E. coli Concentrations of Composite Samples
Collecting depth- and width-integrated composite water samples and water-quality parameters provides a detailed spatial and temporal record of E. coli concentrations and water quality in the New River Gorge. A total of 34, 36, and 33 composite water samples were collected at Prince, Thurmond, and Fayette, respectively. Water-quality parameters were recorded with each routine sample. Collectively, these composite water samples and water-quality parameter measurements spanned a range of hydrologic and weather conditions over a 40-km reach of the New River. Kruskal-Wallis and pairwise Wilcoxon rank sum tests (with a Bonferroni correction) were used to compare results among monitoring locations and indicated differences among monitoring locations were not significant (p>0.05) for E. coli concentrations, turbidity, pH, or specific conductance (fig. 5). This finding may be the result of a lack of independence owing to the connectivity of sites within the same river. The consistency of E. coli concentrations and water-quality parameters may also indicate the typical chemostatic behavior of larger rivers. Although the contributions of tributaries in the New River Gorge can affect water quality, these tributary streamflows typically comprise a small fraction of total streamflow in the gorge, and their effects are often diluted by the greater volume of streamflow in the New River.
Concentrations of E. coli did not vary significantly (p>0.05) among Prince, Thurmond, and Fayette (fig. 5). Escherichia coli concentrations ranged from less than 1 MPN/100 mL, the minimum level of quantification, to 770 MPN/100 mL at Prince, 730 MPN/100 mL at Thurmond, and 1,100 MPN/100 mL at Fayette. Exceedances of the recreational-contact standard for E. coli (320 MPN/100 mL) were measured in 11 of the 110 depth- and width-integrated composite samples during the 2-year study period. Of the 11 exceedances of the recreational-contact standard, 5, 3, and 3 exceedances were measured at Fayette, Thurmond, and Prince, respectively. Eight of the 11 exceedances of the recreational-contact standard happened during three sampling efforts associated with storm runoff and elevated streamflow (streamflow greater than 18,000 cubic feet per second [ft3/s] at Thurmond; U.S. Geological Survey, 2025c). The other three recreational-contact standard exceedances were associated with antecedent periods of lower flow in the New River (less than 9,000 ft3/s at Thurmond). These instances suggest that storms can increase tributary contributions of E. coli during periods of low flow in the New River when the river’s capacity to dilute tributary input is diminished.
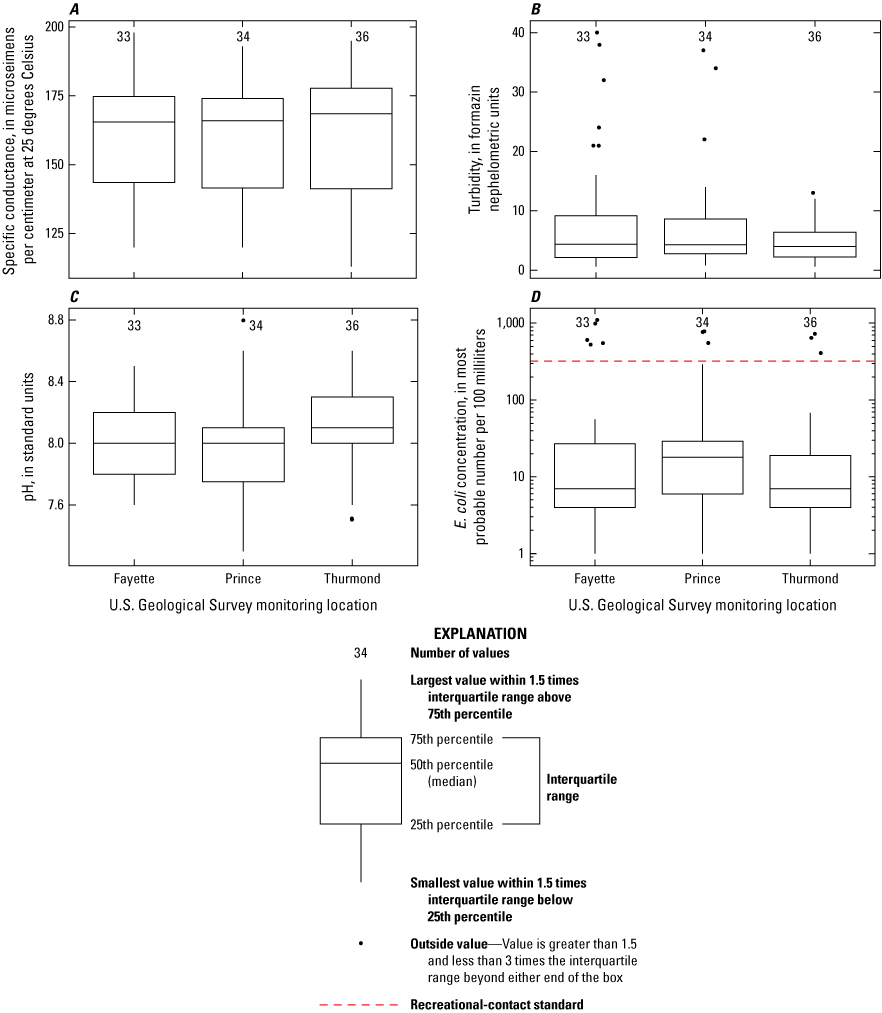
Boxplots comparing (A) specific conductance, (B) turbidity, (C) pH, and (D) Escherichia coli concentrations measured at three monitoring locations on the New River, West Virginia: Fayette, Prince, and Thurmond. The recreational-contact standard is based on the U.S. Environmental Protection Agency 90th-percentile statistical threshold value for E. coli concentrations (320 most probable number per 100 milliliters; U.S. Environmental Protection Agency, 2015). Additional location information is in table 1.
Escherichia coli Concentrations in Cross-Sectional Samples
Cross-sectional point samples were collected during routine sampling events to assess how well the depth- and width-integrated composite samples represented the cross section’s inherent variability. A total of 21 sets of point samples were collected from the 3 primary monitoring stations: 6 sets at Prince, 8 sets at Thurmond, and 7 sets at Fayette. Escherichia coli concentration results from each cross-sectional point sample, with uncertainty represented with 95-percent confidence intervals, were compared with the E. coli concentrations and 95-percent confidence intervals of the composite sample. As previously discussed in the “Methods of Data Collection and Analysis” section, samples were considered not to differ significantly if their 95-percent confidence intervals overlapped. Except for a few nearshore water samples, individual cross-sectional point samples and their corresponding composite sample were not significantly different.
During the 6 cross-sectional sampling events at Prince, a total of 29 point samples were collected (fig. 6). As mentioned previously, the mid-point sample during the January 10, 2023, cross-sectional sampling event was lost during processing, and E. coli analysis results were unavailable. The cross-sectional samples were taken during a range of conditions, with E. coli concentrations in corresponding composite samples ranging from 7 to 290 MPN/100 mL. Of the 29 point samples collected during 6 sampling events, 27 had an overlapping 95-percent confidence interval with the composite sample, indicating no statistically significant differences. The two point samples with no overlap were taken on July 27, 2022: these were the cross-sectional point samples closest to either riverbank and had an E. coli concentration of 140 MPN/100 mL, against a composite sample concentration of 290 MPN/100 mL. This sampling event took place when New River streamflow was at its highest (as indicated by Thurmond) among all cross-sectional sampling events. Although only one sample set indicated differences, these differences may indicate greater cross-sectional variability during high flows.
During the 8 sampling events at Thurmond, a total of 40 cross-sectional point samples were collected (fig. 7). These samples were collected during flows ranging from 3,490 to 22,700 ft3/s. The 95-percent confidence intervals of the cross-sectional point samples overlapped those of the associated composite sample for all but one point sample. The E. coli concentrations of the composite sample and the sample from the 15-percent cross-sectional point on May 24, 2022, were less than 1 MPN/100 mL and 10 MPN/100 mL, respectively.
During the 7 sampling events at New River at Fayette, a total of 35 cross-sectional point samples were collected (fig. 8). In all but one instance, September 29, 2022, the 95-percent confidence intervals of the point samples and the associated composite samples overlapped. The E. coli concentrations of the composite sample and the sample from the 15-percent cross-sectional point were 28 MPN/100 mL and 9 MPN/100 mL, respectively.
Most 95-percent confidence intervals of E. coli concentrations from cross-sectional point samples overlapped with the 95-percent confidence intervals of E. coli concentrations from corresponding composite samples, indicating that the New River had relatively little overall variability in concentrations within its cross sections and that E. coli concentrations at all three monitoring locations are well represented by the depth- and width-integrated composite sampling techniques used in this study. The average concentration of the five cross-sectional point samples was within the 95-percent confidence interval of the composite samples, with the exception of two instances at Prince, which includes the July 27, 2022, sampling event described previously.
However, of the few instances where cross-sectional samples did not agree with composite samples, all happened at cross-sectional points at either end of the stream width, closest to the riverbank. This might suggest that the highest variability is in nearshore samples, but the data do not indicate a consistent high- or low-bias in nearshore samples.
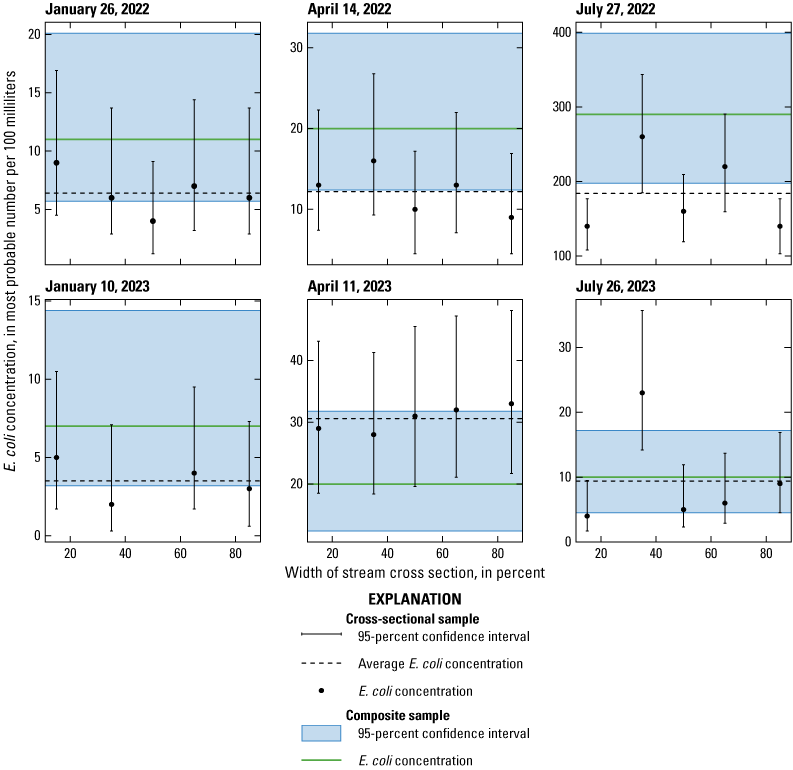
Graphs comparing Escherichia coli concentrations from cross-sectional point samples and depth- and width-integrated composite samples collected during the same sampling events at the Prince monitoring location on the New River, West Virginia, 2022–23. Additional location information is in table 1.
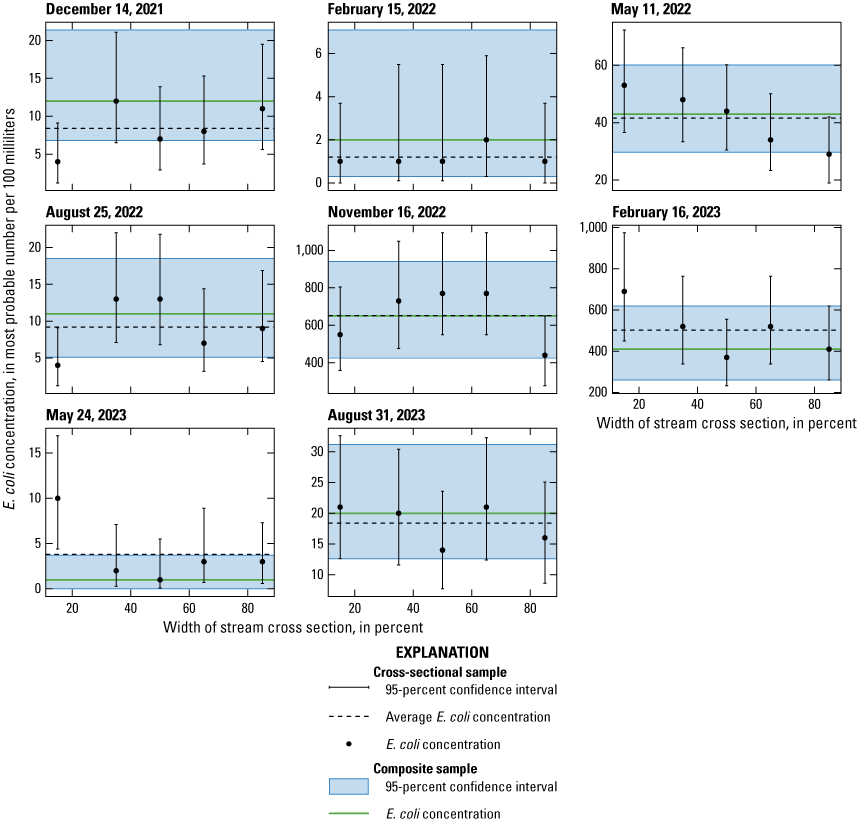
Graphs comparing Escherichia coli concentrations from cross-sectional point samples and depth- and width-integrated composite samples collected during the same sampling events at the Thurmond monitoring location on the New River, West Virginia, 2021–23. Additional location information is in table 1.
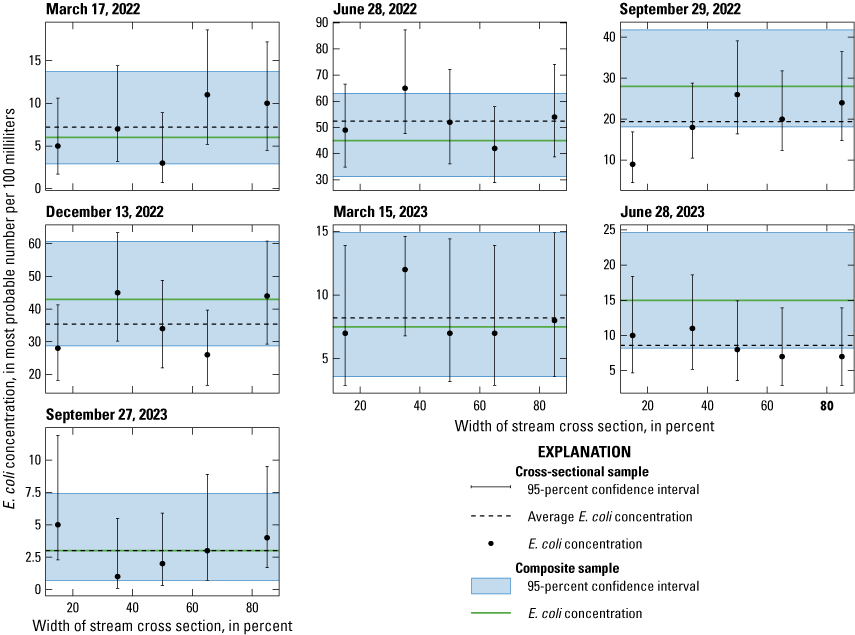
Graphs comparing Escherichia coli concentrations in cross-sectional point samples and depth- and width-integrated composite samples collected during the same sampling events at the Fayette monitoring location on the New River, West Virginia, 2022–23. Additional location information is in table 1.
Escherichia coli Concentration of Longitudinal Transects
Four longitudinal transects were done, two each during the 2022 and 2023 peak recreational-contact seasons from May through October. The July 2022, September 2022, and October 2023 transects were done under relatively stable, seasonally typical low-flow conditions. During these three transects, water samples collected along the longitudinal transect of the New River Gorge had little variability in E. coli concentrations as indicated by the broad overlap of the 95-percent confidence intervals among individual water samples (fig. 9). Furthermore, the overlap of the 95-percent confidence intervals indicates E. coli concentrations at any monitoring location did not have a statistically significant difference from any monitoring location immediately up- or downstream.
The longitudinal transect collected on August 25, 2023, offered insight into conditions during storm events. Although it was only a partial transect of the upper New River, water samples were collected after an intense thunderstorm, with 0.56 inches of rainfall recorded in an hour by Thurmond’s precipitation gage (USGS 03185400; U.S. Geological Survey, 2025c). Although the exact timing, magnitude, and spatial distribution of this storm are difficult to ascertain—particularly as they pertain to streamflow response and sampling timing—the precipitation runoff did produce an increase of New River tributary streamflow. For example, streamflow at Piney Creek at Raleigh, West Virginia (USGS 03185000; hereafter, Piney Creek), the only gaged tributary in the New River Gorge, increased 68 percent (from 4.2 to 7.07 ft3/s) by the end of the day’s longitudinal transect sampling.
The results of the August 2023 longitudinal transect show that E. coli concentrations were 82-percent higher at the New River below Piney Creek at McCreery, West Virginia (USGS 03185208; 52 MPN/100 mL) monitoring location than at Prince (28 MPN/100 mL), which is immediately upstream of the confluence of Piney Creek and the New River; however, the 95-percent confidence interval associated with these two samples narrowly overlaps (fig. 9). The largest difference in the E. coli concentrations of the August 2023 longitudinal transect was observed when comparing the New River below Dunloup Creek at Thurmond, West Virginia (USGS 03185434; 19 MPN/100 mL) and the New River below Arbuckle Creek at Thurmond, West Virginia (USGS 03185440; 390 MPN/100 mL) monitoring locations. This statistically significant difference (no overlap of the 95-percent confidence intervals) in E. coli concentrations indicates the potential effect that tributaries have on the New River during storm events, especially during low-flow conditions when the river has reduced capacity to dilute tributary loads. New River streamflow at Thurmond was less than 2,000 ft3/s during this transect.
Despite the small number of longitudinal transects, E. coli concentrations had less variability during stable conditions but more variability during storm events that increased tributary streamflow. The August 2023 storm-event transect demonstrated the significance of tributary inputs on main stem New River E. coli concentrations. The E. coli input from Arbuckle Creek was sufficient to cause a twentyfold increase in E. coli concentration in the New River, resulting in an exceedance of the recreational-contact standard at the monitoring location below Arbuckle Creek. The August 2023 transect also highlights the challenges of monitoring during storm events or other periods of increased tributary flow that can lead to high variability of tributary E. coli inputs.
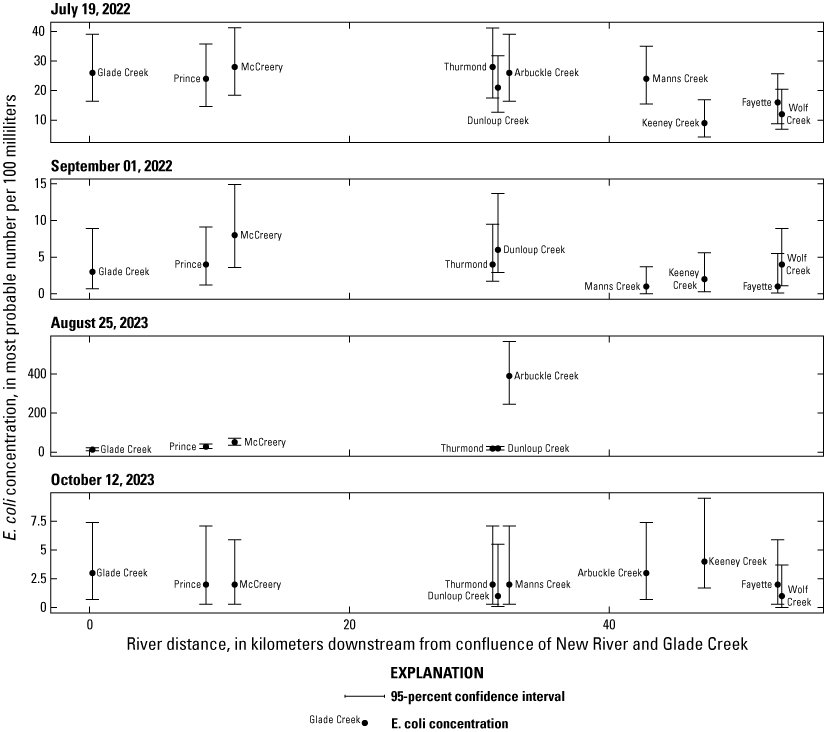
Graphs comparing Escherichia coli concentrations in samples collected during longitudinal transects at U.S. Geological Survey monitoring locations downstream of the New River and Glade Creek confluence in West Virginia in 2022 and 2023. Additional location information is in table 1.
Surrogate Water-Quality Model Used to Estimate E. coli Concentration
Concentrations of E. coli vary in response to a broad range of environmental factors, including, but not limited to, land-use and land-cover characteristics, weather, and hydrology (Paybins and others, 2000). Developing a surrogate model to estimate E. coli concentrations in near real-time required examining the relations between E. coli concentrations of discrete samples and environmental data collected from USGS streamflow, water-quality parameters, and precipitation monitoring equipment.
Model Variables and Correlation Matrix
A log10 transformation of measured E. coli concentration was used to improve the distribution and linearity of the E. coli data (Helsel and others, 2020). Data for surrogate model regression analysis were compiled for samples collected October 2021 through October 2023. Variables included E. coli samples collected at Thurmond (36 composite and 4 longitudinal transects); streamflow, water-quality parameters (specific conductance, turbidity, pH, dissolved oxygen, water temperature), and precipitation measured at Thurmond; and streamflow at Piney Creek. In addition to the instantaneous measured values, the maximum, mean, and log10-transformed values for streamflow and turbidity were calculated for the antecedent 48 hours in 12-hour intervals. Precipitation included the antecedent 12-, 24-, 36-, and 48-hour sum totals.
All potential variables were analyzed against log10 E. coli concentration in a linear correlation matrix using Pearson’s method in the statistical programming software R (R Core Team, 2023) and are shown in table 2. Coefficients closer to zero indicate a weaker linear relation; coefficients closer to 1 or −1 indicate a stronger positive or negative linear relation, respectively. However, combining variables that are independently uncorrelated with the response variable with other explanatory variables can sometimes increase prediction accuracies for response variables.
Escherichia coli concentrations were most correlated with antecedent 24-hour mean turbidity at Thurmond and antecedent 12-hour mean streamflow at Piney Creek. Both variables represent changes in streamflow conditions and particulate-matter transport and were positively correlated with E. coli concentrations. These time-averaged explanatory variables likely help to account for hysteresis and (or) lag between turbidity or streamflow, the measured variable, and E. coli concentrations, the estimated characteristic. The lag is likely caused by the many small tributaries in the gorge, which vary in land use, E. coli concentrations, and the travel time of storm-induced streamflow.
Table 2.
Pearson’s correlation coefficients and associated p-values computed from log10 Escherichia coli concentrations at the Thurmond monitoring location, and environmental variables as measured at the Thurmond and Piney Creek monitoring locations on the New River, West Virginia.[Additional location information is in table 1. ft3/s, cubic foot per second; FNU, formazin nephelometric unit; mg/L, milligrams per liter; μS/cm, microsiemen per centimeter; °C, degrees Celsius]
Linear Regression for the E. coli Surrogate Model
Variables shown in table 2 were further examined for suitability in simple linear regression (single explanatory variable) and multiple linear regression models using the leaps package (Lumley, 2024) and statistical tests in the program R, which included adjusted coefficient of determination (R2), residual standard error, predicted residual error sum of squares (PRESS), Cook’s distance, Akaike information criterion, difference in fits, the Shaprio-Wilks test, and outlier tests. Methods and analysis of linear regression model development, refinement, and selection, as described in Helsel and others (2020), were used to evaluate multiple models and statistical metrics. A selection of the linear regression models that explained the most variability in E. coli concentrations is in table 3.
Table 3.
Summary statistics comparing simple and multiple linear regression surrogate models used to predict the log10 Escherichia coli concentration at the Thurmond monitoring location on the New River, West Virginia.[Data are from U.S. Geological Survey (2025c). Additional location information is in table 1. adjusted R2, adjusted coefficient of determination; RSE, residual standard error; BCF, bias correction factor; PRESS, predicted residual error sum of squares; AIC, Akaike information criterion; Max., maximum; DFFIT, difference in fit]
The two best-performing univariate, simple linear regression models for log10 E. coli concentration used the antecedent 24-hour mean turbidity at Thurmond and the antecedent 12-hour mean streamflow at Piney Creek. Combining these two explanatory variables into a multiple linear regression model resulted in a modest improvement in the adjusted R2 and other statistical metrics and allowed for an analysis of variance statistic to be calculated with a p-value of 0.02, indicating an improvement over the results of simple linear regression. Two other multiple linear regressions that included 1) the log10 of maximum 24-hour turbidity at Thurmond plus water temperature at Thurmond and 2) the log10 maximum 36-hour streamflow at Thurmond plus the square root of total 48-hour precipitation at Thurmond had summary statistics and residuals slightly better than the simple linear regressions.
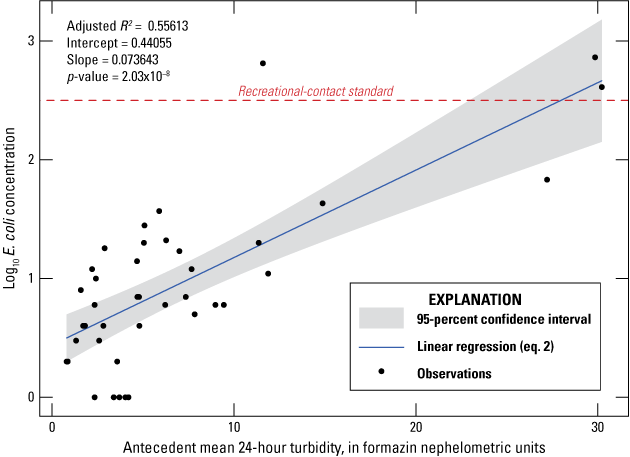
Ultimately, however, the statistical improvements of these multiple linear regression models are relatively small when compared with the simple linear regression model. Any additional variables increase the complexity of the E. coli surrogate model, make predictions more computationally demanding, and introduce a greater possibility for real-world variability to affect surrogate model performance. Therefore, for reasons fully explained in the following “Assumptions and Limitations” section, we recommend that the simple linear regression model produced using antecedent mean 24-hour turbidity at Thurmond (fig. 10) be used.
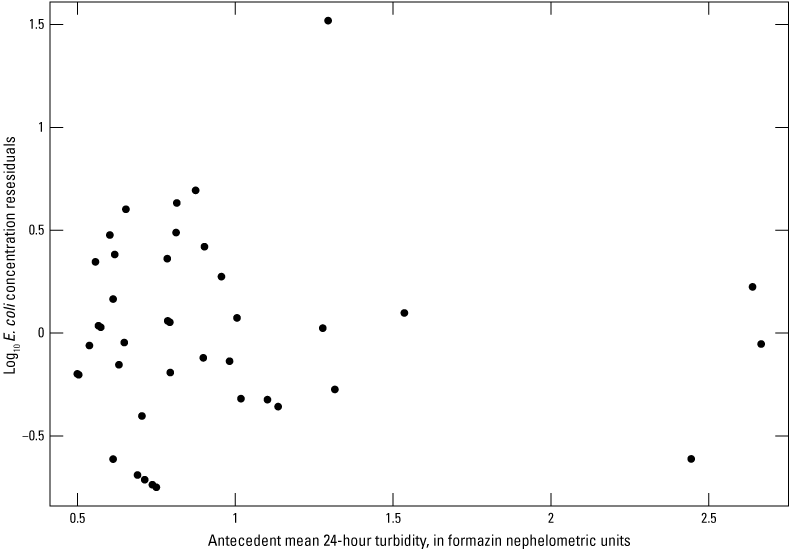
Residuals from linear regression of the log10 of Escherichia coli concentration and the antecedent mean 24-hour turbidity developed from 40 observations and samples of water quality data collected at the Thurmond monitoring location on the New River, West Virginia, October 2021–23. The recreational-contact standard is based on the U.S. Environmental Protection Agency 90th-percentile statistical threshold value for E. coli concentrations (320 most probable number per 100 milliliters; U.S. Environmental Protection Agency, 2015). Additional location information is in table 1.
The linear regression model used to predict E. coli concentrations at Thurmond, developed from antecedent mean 24-hour turbidity measured by a streamgage at the location, is expressed as
wherey
is log10 E. coli concentration in MPN/100 mL;
b
is the linear regression y-intercept (0.44055);
m
is the slope of the linear regression (0.073643); and
x
is the antecedent mean 24-hour turbidity, in formazin nephelometric units (FNU), measured at Thurmond.
This linear regression model has an adjusted R2 value of 0.556 and a p-value of less than 0.001. A plot of the linear regression model is shown in figure 10. Residuals (fig. 11) had a standard error of 0.469 and were skewed toward lower values but still passed the Shapiro-Wilk’s test for normality with a p-value of 0.0998 (normality p-value greater than 0.05 for this test). The observation made on November 16, 2022, was flagged as a statistical outlier; the observed E. coli concentration was 650 MPN/100 mL during relatively low turbidity. However, this sample had a low effect on model parameters and, without a known reason to exclude it, the point was kept in the dataset (Helsel and others, 2020).
Linear regression of the log10 of Escherichia coli concentration and the antecedent mean 24-hour turbidity developed from 40 observations and samples of water quality data collected at the Thurmond monitoring location on the New River, West Virginia, October 2021–23. Additional location information is in table 1. [R2, coefficient of determination]
Because E. coli concentration values were log10-transformed, the regression equation (eq. 1) will estimate the median rather than the mean response. To correct for the skew of the mean in a log-normal distribution, a bias correction is needed when back-transforming E. coli concentrations from log10 space to real space (Helsel and others, 2020). Duan smearing (Duan, 1983) was used to calculate a bias correction factor of 2.12 for equation 1 and is also provided for the other equations in table 3. The log-transformation bias correction factor was applied and results in a revised equation used to estimate the mean E. coli concentration as expressed as
wherey
is E. coli concentration in MPN/100 mL, and
x
is the antecedent mean 24-hour turbidity in FNU measured at Thurmond.
Equation 2 can be used as a surrogate model to estimate the E. coli concentrations at Thurmond from antecedent mean 24-hour turbidity. Conversely, given a known E. coli concentration, the antecedent mean 24-hour turbidity at Thurmond can be estimated using equation 2. For the E. coli recreational-contact standard of 320 MPN/100 mL, the antecedent mean 24-hour turbidity at Thurmond would be estimated by the surrogate model at 23.6 FNU, with a 95-percent confidence interval estimate of 19.4–30.7 FNU.
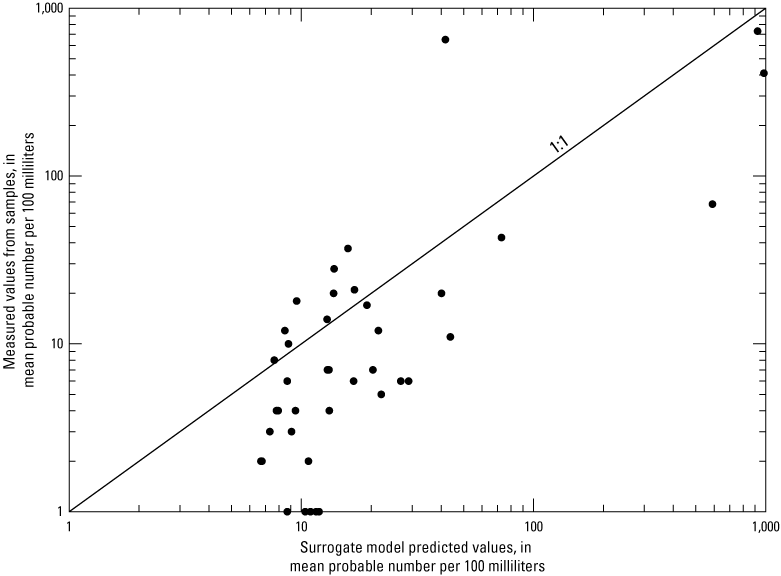
A 1:1 plot of the Escherichia coli concentration measured from water samples collected at the Thurmond monitoring location on the New River, West Virginia, and the predicted E. coli concentration from the surrogate model developed with a simple linear regression of antecedent-mean-24-hour turbidity. Note log-scale on x- and y-axes. Additional location information is in table 1.
Escherichia coli Surrogate Model Analysis, Assumptions, and Limitations
The development and application of a New River E. coli surrogate model includes several assumptions and limitations. The use of linear regression assumes normally distributed data, and the recommended surrogate model that used the antecedent mean 24-hour turbidity passed the Shapiro-Wilk normality test but has a skew toward smaller values. Linear regression should only be used for estimates within the range of the sampled conditions (antecedent mean 24-hour turbidity of 0–30 FNU) used to develop the model. Note that with a y-intercept of 0.44055 in the linear regression equation and a bias correction factor of 2.12, the model’s lowest estimated E. coli concentration will be 6 MPN/100 mL. Furthermore, any near-real-time use of this surrogate model would use provisional USGS data before any additional review, approval, and archival.
The performance of the surrogate model becomes more important as E. coli concentrations near or exceed the recreational-contact standard because model uncertainty could lead to false positives or false negatives. Few water samples collected during this study contained such high concentrations. More samples and associated data at higher E. coli concentrations could help improve the surrogate model. However, figures 11 and 12 indicate that the uncertainty in turbidity is similar over the full range of antecedent mean 24-hour turbidity because the logarithmic fit of the regression equation indicates that the errors are similar on a percentage basis instead of on a set value (arithmetic fit). Figure 12 shows the surrogate model has a slight bias in predicting high values, suggesting that the model may be conservative when used for recreational-contact guidance.
With an adjusted R2 value of 0.556, the linear regression model explains about half of the overall variability of E. coli concentrations at Thurmond. The surrogate model used to predict E. coli concentrations at Thurmond performs well when plotted against measured E. coli concentrations as a time-series during the study from October 2021 to October 2023 (fig. 13). This time-series plot of the surrogate model also indicates that exceedances of the recreational-contact standard were infrequent, with antecedent mean 24-hour turbidity exceeding the 23.6 FNU threshold about 18 times during this 2-year period. Plotting mean 24-hour turbidity at Thurmond for 5 years (July 2019–June 2024) as a rank-ordered duration curve indicates that the 23.6 FNU threshold is surpassed approximately 7.5 percent of the time, and the 19.4 FNU lower confidence limit is surpassed 10 percent of the time (fig. 14).
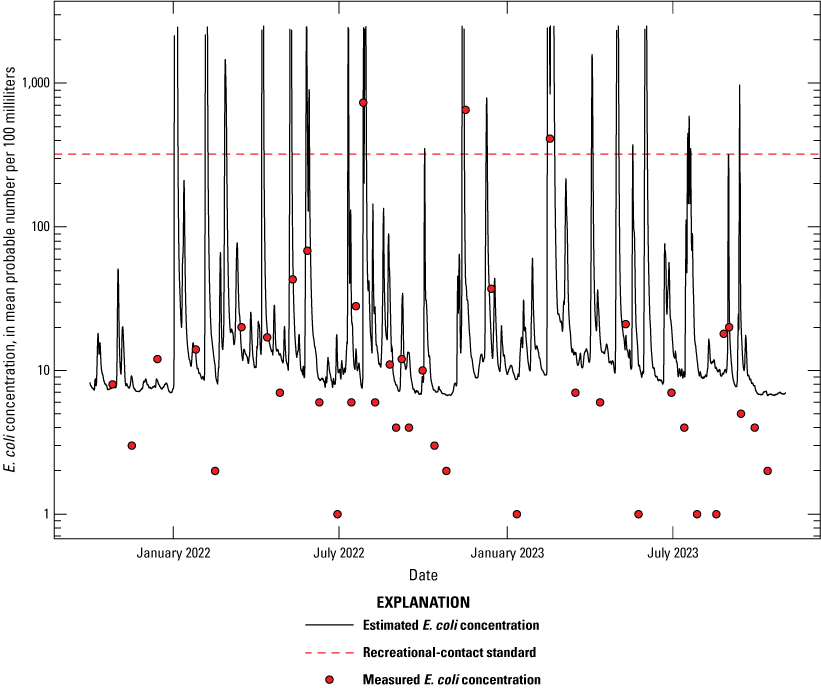
Estimated and observed Escherichia coli concentrations at the Thurmond monitoring location on the New River, West Virginia, October 2021–23. The recreational-contact standard is based on the U.S. Environmental Protection Agency 90th-percentile statistical threshold value for E. coli concentrations (320 most probable number per 100 milliliters; U.S. Environmental Protection Agency, 2015). Note the log10 scale on the y-axis for E. coli concentration. Additional location information is in table 1.
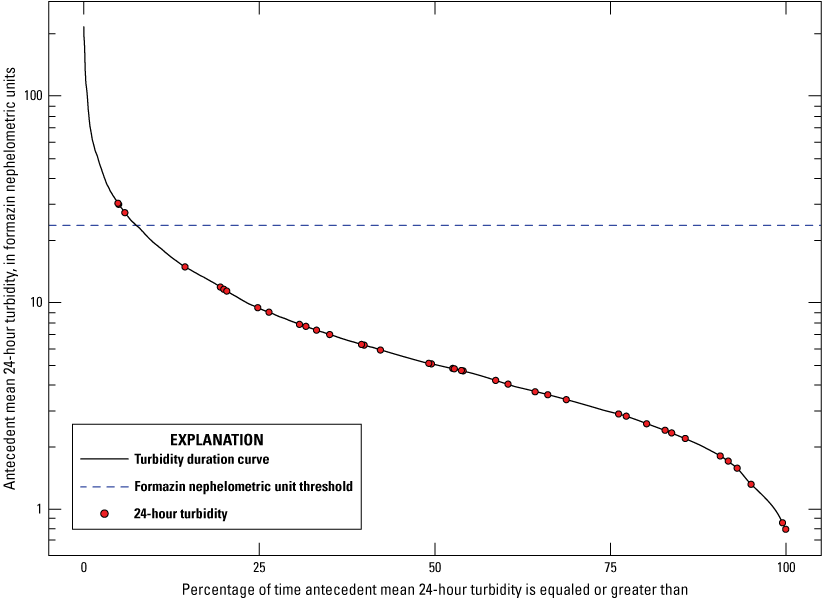
A rank-ordered duration curve of antecedent mean 24-hour turbidity at the Thurmond monitoring location from July 2019 to June 2024. The 23.6 formazin nephelometric unit threshold was identified by the linear regression surrogate model to exceed the recreational-contact standard, which is based on the U.S. Environmental Protection Agency 90th-percentile statistical threshold value for E. coli concentrations (320 most probable number per 100 milliliters; U.S. Environmental Protection Agency, 2015). Note the log10 scale on the y-axis for turbidity. Additional location information is in table 1.
Although the longitudinal monitoring from this study suggests the New River has fairly consistent water quality throughout NERI during stable-flow conditions, the influx of water from tributaries during storms produces heterogeneous changes in water quality. Most of the sampled tributaries of the New River are downstream from Thurmond, including Dunloup Creek, Arbuckle Creek, Manns Creek, Keeney Creek, and Wolf Creek. As such, any turbidity or E. coli contributions from these tributaries will not be represented in the continuous water-quality monitor at Thurmond or the E. coli surrogate model. The August 2023 longitudinal transect highlighted the variability of tributary E. coli inputs during storm events and increased tributary flow and challenged the assumption that a single monitoring location could fully characterize water-quality parameters and E. coli concentrations throughout the entirety of the New River Gorge under all conditions.
Another key consideration is to evaluate how well the sampled conditions used to develop the surrogate model represent longer-term conditions in the New River. The streamflow during sampled conditions was plotted against the flow-duration curve for Thurmond from October 1994 to September 2024. Sample values are generally well distributed along the flow-duration curve, from 8.2 percent at 22,700 ft3/s to 96.5 percent at 1,590 ft3/s (fig. 15). Some sample clustering happens at between 50 and 60 percent of the flow-duration curve (roughly 5,000 to 6,000 ft3/s), and small sampling gaps are present at higher flows. However, data gaps at higher streamflows may also coincide with flows where recreational contact is less likely to happen. The commercial rafting industry has a cutoff of 12 feet at the informal Fayette boaters’ gage, which is associated with a streamflow of 32,000 ft3/s at Thurmond (James Scott, commercial guide, oral commun., 2025). Although more advanced recreational boaters target flows below 20,000 ft3/s, most private recreational boating happens below 9,000 ft3/s (James Scott, commercial guide, oral commun., 2025). Thus, recreational flows were well represented by the sampled conditions.
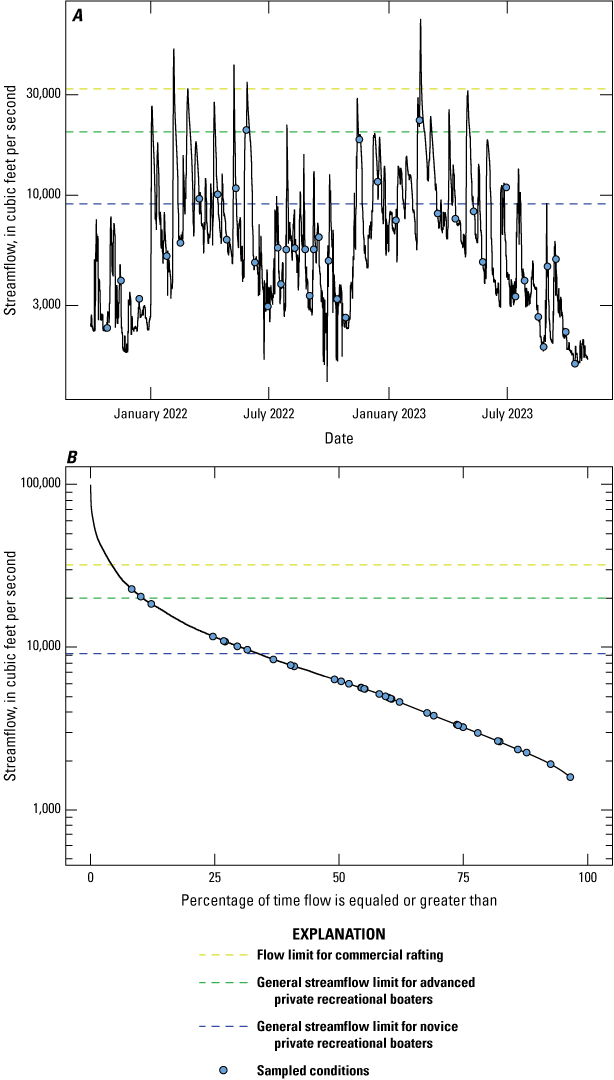
Plots showing streamflow at the Thurmond monitoring location on the New River, West Virginia: (A) streamflow measured from October 2021 to October 2023 and (B) a flow-duration curve covering the 30 years from October 1994 to September 2024. Note the log10 scale on the y-axis. Additional location information is in table 1. Flow limits are from James Scott (commercial guide, oral commun., 2025).
As previously mentioned, the use of antecedent mean 24-hour turbidity at Thurmond to develop the simple linear regression surrogate model instead of using antecedent mean 12-hour streamflow at Piney Creek or other multivariate linear regressions that produce modestly higher model performance warrants further discussion. Conceptually, an ideal surrogate model would estimate the desired variable with highly correlated input(s) that also fully explain the underlying, causal physical processes with a minimum of variables, assumptions, caveats, and exceptions. An E. coli surrogate model developed using streamflow presents challenges because total streamflow in the New River is a flexible combination of dam release flow at Bluestone Dam, tributary base flow, and tributary stormflow. Additionally, streamflow and water-quality relations often show hysteresis, in that the same streamflow level on the rising and falling limbs of a hydrograph peak can have different water quality because the watershed is “flushed” on the rising limb. Although we acknowledge the significance of tributary streamflow on E. coli concentrations in the New River, using streamflow data from a monitoring location on a single tributary only indicates conditions in a small part of the New River watershed, perhaps missing the effect of a localized storm event elsewhere in the New River Gorge.
We hypothesize that a water-quality parameter measured in the New River is the best surrogate to estimate another water-quality variable in the New River. Turbidity and E. coli relations have been used in this way in many other studies, including Lawrence (2012), Brady and others (2009), and Brady and Plona (2012). A surrogate model based on Thurmond integrates streamflow and water-quality inputs from more sources throughout the New River watershed: the New River upstream from the gorge, the Greenbrier River, and some of the larger tributaries within the gorge.
Other variables that showed promise in predicting E. coli concentration as part of a multivariate linear regression included water temperature and precipitation. Water temperature was negatively correlated to E. coli concentration: as temperatures decrease, E. coli concentration increases. This correlation may help explain the outlier data point: we theorize that lower temperatures in the New River prolong the persistence of E. coli, preventing die-off that may happen at higher temperatures and maintaining elevated concentrations for longer (Korajkic and others, 2019), conceptually mirroring field methods that kept water samples on ice to maintain E. coli concentrations if laboratory processing was delayed. When precipitation data were being analyzed, the three highest E. coli concentrations at Thurmond, all above the recreational-contact standard (320 MPN/100 mL), were measured in samples collected when there was at least 0.25 inches of total precipitation at Thurmond in the antecedent 48 hours. However, precipitation at Thurmond does not fully explain conditions throughout most of the watershed, particularly with isolated storm events. Three different storm events that had more than 0.25 inches of total precipitation at Thurmond in the antecedent 48 hours were associated with E. coli concentrations below 10 MPN/100 mL, indicating that E. coli’s response to precipitation is highly variable, likely because of the complexities of the watershed’s response to the timing of storms, their intensity, and their spatial distribution.
Adding more explanatory variables to a linear regression model increases its complexity. Additional variables can add assumptions and limitations, particularly given the variability of tributary and precipitation effects. For example, isolated storms may hit or miss the limited tributary and precipitation monitoring network in the New River Gorge. Missing or incomplete data are also more likely to happen with additional explanatory variables and would prevent the use of the surrogate model in those instances. Calculating and communicating predictions, thresholds, or guidance criteria is more straightforward with a simple linear regression surrogate model.
Considering the modest improvements in the linear regression E. coli surrogate model performance yielded by the additional variables, we ultimately decided to use a more conservative simple linear regression based on turbidity at Thurmond—one that contains the fewest caveats, conditions, and assumptions—to reduce model complexity and the influence of spatial heterogeneity. However, analyzing additional variables helped clarify the processes that may affect E. coli concentrations in the New River Gorge. Further sampling and monitoring, particularly in other locations throughout the New River watershed, and possibly to include additional precipitation gages, may uncover additional insights to help meaningfully improve the E. coli surrogate model.
The Bluestone Dam on the New River attenuates streamflow through the gorge. Slower streamflow through the dam pool allows some upstream sediment and suspended matter—and any E. coli associated with these suspended sediments—to settle out rather than being transported further downstream to the gorge (Paybins and others, 2000). We theorize that the attenuation of the Bluestone Dam may uncouple some water-quality patterns in the New River Gorge, particularly the influence of streamflow on suspended matter and turbidity, and increase the effect that more proximal sources, such as the Greenbrier River and the smaller tributaries discharging to the New River Gorge, have on E. coli concentrations in the New River. As noted in this study and others, Piney Creek and the other New River tributaries in the New River Gorge are sources of E. coli (Wilson and Purvis, 2000, 2003). Additional tributary streamgages or water-quality monitoring could provide data that could further increase understanding of E. coli concentrations, loads, and trends throughout the gorge and improve the amount of variability in E. coli concentrations explained by the New River E. coli surrogate model.
This report demonstrates the utility of the continuous streamflow and water-quality monitor at Thurmond to NERI park staff and visitors. Similar water-quality monitoring efforts and surrogate modeling relations have supported E. coli recreational advisory tools in partnership with the National Park Service in Georgia’s Chattahoochee River National Recreation Area (Aulenbach and McKee, 2020; U.S. Geological Survey, 2020) and Ohio’s Cuyahoga Valley National Park (Brady and Plona, 2015).
Summary
The New River Gorge National Park and Preserve (NERI) in West Virginia receives over 1 million visitors each year, many of whom come to enjoy the New River, known for its whitewater rapids. Many of the small tributaries discharging to the New River within the gorge are impaired by fecal-indicator bacteria in concentrations exceeding regulatory standards. The human health risks associated with recreating in waters with elevated concentrations of fecal-indicator bacteria have created a need within the National Park Service to better understand the distribution of fecal-indicator bacteria, specifically Escherichia coli, within NERI.
An E. coli sampling project was established to evaluate E. coli concentrations over time longitudinally along the length of NERI and across the width of the New River. Composite and cross-sectional water samples were taken from three U.S. Geological Survey (USGS) monitoring locations: the New River at Highway 41 at Prince, West Virginia (USGS 03184905), New River at Thurmond, West Virginia (USGS 03185400; hereafter, Thurmond), and New River at Fayette, West Virginia (USGS 03186000). During periodic longitudinal transects, water samples were taken from below the mouths of seven major tributaries of the New River within the gorge. Water samples were collected from October 2021 through October 2023 at varying frequencies: twice per month during the peak recreational-contact season (May through October) and once per month during the off-peak season (November through April).
During the 2 years of sampling, E. coli concentrations in the New River ranged from less than 1 to 1,100 most probable number (MPN) per 100 milliliters (MPN/100 mL). The recreational-contact standard, which is based on the U.S. Environmental Protection Agency 90th-percentile statistical threshold value for E. coli (320 MPN/100 mL), was exceeded in 11 of the 110 samples collected from the New River during this study. Water-quality parameters and E. coli concentrations were generally consistent throughout the New River; however, storm events increased tributary streamflow and E. coli inputs, particularly from Piney Creek and Arbuckle Creek. Escherichia coli concentrations rarely varied in cross sections except for a few nearshore samples.
Data collected during this study included E. coli sample concentrations and corresponding water-quality parameters, streamflow, and precipitation data from Thurmond and the Piney Creek at Raleigh, West Virginia (USGS 03185000; hereafter, Piney Creek) monitoring location, and were used to develop a near-real-time E. coli surrogate model. The antecedent mean 24-hour turbidity at Thurmond was selected as the best variable in a linear regression surrogate model to determine the log10 E. coli concentration in the New River (adjusted coefficient of determination of 0.556 and p-value of less than 0.001). Analysis of the E. coli surrogate model linear regression equation suggests that the recreational-contact standard of 320 MPN/100 mL is exceeded when the antecedent mean 24-hour turbidity at Thurmond is 23.6 formazin nephelometric units (with 95-percent confidence interval of 19.4–30.7 formazin nephelometric units).
Other high-performing linear regression surrogate model variables included the antecedent mean 12-hour streamflow at Piney Creek and water temperature and antecedent 48-hour precipitation at Thurmond. Although simple and multiple linear regression models using these variables explained slightly more variability in E. coli concentrations than the linear regression developed with turbidity data from Thurmond, these additional variables added complexity, limitations, and more assumptions that may affect surrogate model accuracy and were therefore dismissed in favor of the simpler model. However, these additional variables highlight that further sampling and monitoring, including additional information from tributary streamgages, precipitation gages, or water-quality monitoring, could increase understanding of E. coli concentrations, loads, and trends throughout the gorge and increase the amount of variability explained by the New River E. coli surrogate model. This surrogate model could help NERI staff provide near-real-time information about E. coli concentrations and related recreational-contact risks to the public. The USGS supports similar E. coli surrogate modeling programs in partnership with the National Park Service at Georgia’s Chattahoochee River National Recreation Area and Ohio’s Cuyahoga Valley National Park.
References Cited
Aho, K., 2025, asbio—A collection of statistical tools for biologists (ver. 1.11): Comprehensive R Archive Network release, accessed June 12, 2025, at https://doi.org/10.32614/CRAN.package.asbio.
Anderson, C., 2005, Turbidity (ver. 2.1, revised September 2005): U.S. Geological Survey Techniques of Water-Resources Investigations 09-A6.7, 55 p., accessed September 2021 at https://doi.org/10.3133/twri09A6.7.
Aulenbach, B.T., and McKee, A.M., 2020, Monitoring and real-time modeling of Escherichia coli bacteria for the Chattahoochee River, Chattahoochee River National Recreation Area, Georgia, 2000–2019: U.S. Geological Survey Open-File Report 2020–1048, 43 p., accessed August 12, 2025, at https://doi.org/10.3133/ofr20201048.
Brady, A.M.G., and Plona, M., 2012, Development and implementation of a regression model for predicting recreational water quality in the Cuyahoga River, Cuyahoga Valley National Park, Ohio 2009–11: U.S. Geological Survey Scientific Investigations Report 2012–5074, 14 p. [Also available at https://doi.org/10.3133/sir20125074.]
Brady, A.M.G., Bushon, R.N., and Plona, M.B., 2009, Predicting recreational water quality using turbidity in the Cuyahoga River, Cuyahoga Valley National Park, Ohio, 2004–7: U.S. Geological Survey Scientific Investigations Report 2009–5192, 16 p. [Also available at https://doi.org/10.3133/sir20095192.]
DeCicco, L., Hirsch, R., Lorenz, D., Watkins, D., Blodgett, D., Johnson, M., Zemmels, J., and Hinman, E., 2025, dataRetrieval—Retrieval functions for USGS and EPA hydrology and water quality data (ver. 2.7.18): Comprehensive R Archive Network release, accessed May 1, 2025, at https://doi.org/10.32614/CRAN.package.dataRetrieval.
Duan, N., 1983, Smearing estimate—A nonparametric retransformation method: Journal of the American Statistical Association, v. 78, no. 383, p. 605–610, accessed April 20, 2020, at https://doi.org/10.1080/01621459.1983.10478017.
Fox, J., Weisberg, S., and Price, B., 2024, car—Companion to applied regression (ver. 3.1.3): Comprehensive R Archive Network release, accessed June 12, 2025, at https://doi.org/10.32614/CRAN.package.car.
Good, G.A., and Stasick, L., 2008, New River Gorge National River—Administrative history: National Park Service, prepared by West Virginia University, 349 p., accessed April 8, 2026, at https://www.npshistory.com/publications/neri/adhi.pdf.
Goldstein, H., and Healy, M.J.R., 1995, The graphical presentation of a collection of means: Journal of the Royal Statistical Society, Series A (Statistics in Society), v. 158, no. 1, p. 175–177, accessed December 18, 2025, at https://doi.org/10.2307/2983411.
Hebbali, A., 2024, olsrr—Tools for building OLS regression models (ver. 0.6.1): Comprehensive R Archive Network release accessed June 12, 2025, at https://doi.org/10.32614/CRAN.package.olsrr.
Helsel, D.R., Hirsch, R.M., Ryberg, K.R., Archfield, S.A., and Gilroy, E.J., 2020, Statistical methods in water resources: U.S. Geological Survey Techniques and Methods, book 4, chap. A3, 458 p., https://doi.org/10.3133/tm4A3.
Knoll, M.J., Pestman, W.R., and Grobbee, D.E., 2011, The (mis)use of overlap of confidence intervals to assess effect modification: European Journal of Epidemiology, v. 26, no. 4, p. 253–254, accessed December 18, 2025, at https://doi.org/10.1007/s10654-011-9563-8.
Korajkic, A., Wanjugi, P., Brooks, L., Cao, Y., and Harwood, V.J., 2019, Persistence and Decay of Fecal Microbiota in Aquatic Habitats: Microbiology and Molecular Biology Reviews, 83, no. 4, accessed August 5, 2025, at https://doi.org/10.1128/MMBR.00005-19.
Lawrence, S.J., 2012, Escherichia coli bacteria density in relation to turbidity, streamflow characteristics, and season in the Chattahoochee River near Atlanta, Georgia, October 2000 through September 2008—Description, statistical analysis, and predictive modeling: U.S. Geological Survey Scientific Investigations Report 2012–5037, 81 p. [Also available at https://doi.org/10.3133/sir20125037.]
Lipps, W.C., Baxter, T.E., and Braun-Howland, E., eds., 2018, 9223 enzyme substrate coliform test, in Standard methods for the examination of water and wastewater (24th ed.): Washington, D.C., APHA Press, accessed April 13, 2026, at http://doi.org/10.2105/SMWW.2882.194.
Lumley, T., 2024, leaps—Regression subset selection (ver. 3.2): Comprehensive R Archive Network release accessed June 12, 2025, at https://doi.org/10.32614/CRAN.package.leaps.
Mahan, C.G., and Young, J.A., 2018, Natural resource condition assessment: New River Gorge National River. Natural Resource Report NPS/NERI/NRR—2018/1622. National Park Service, Fort Collins, Colorado, accessed April 14, 2026, at https://npshistory.com/publications/neri/nrr-2018-1622.pdf.
Mathes, M.V., O’Brien, T.L., Strickler, K.M., Hardy, J.J., Schill, W.B., Lukasik, J., Scott, T.M., Bailey, D.E., and Fenger, T.L., 2007, Presumptive Sources of Fecal Contamination in Four Tributaries to the New River Gorge National River, West Virginia, 2004: U.S. Geological Survey Open-File Report 2007-1107, v, 28 p. [Also available at https://doi.org/10.3133/ofr20071107.]
Myers, D.N., Stoeckel, D.M., Bushon, R.N., Francy, D.S., and Brady, A.M.G., 2014, Fecal indicator bacteria (ver. 2.1, revised May 2014): U.S. Geological Survey Techniques of Water-Resources Investigations 09–A7.1, 72 p., accessed September 2021 at https://doi.org/10.3133/twri09A7.1.
National Park Service, 2019, Public health—Protection and prevention: National Park Service Reference Manual 83A, [variously paged, 135 p.]. [Also available at https://www.nps.gov/subjects/policy/upload/RM-83A_6-20-2019.pdf.]
National Park Service, 2021, New River Gorge is now a National Park and Preserve: National Park Service news release, accessed May 23, 2025, at https://www.nps.gov/neri/learn/news/new-river-gorge-is-now-a-national-park-and-preserve.htm.
North Carolina Department of Environmental Quality, 2025, IDEXX Quanti-Tray 2000 MPN table with 95% confidence limits: North Carolina Department of Environmental Quality dataset. [Also available at https://www.deq.nc.gov/water-quality/chemistry-lab/certification/technical-assistance-documents/quanti-tray-2000-mpn-table/download.]
Paybins, K.S., Messinger, T., Eychaner, J.H., Chambers, D.B., and Kozar, M.D., 2000, Water quality in the Kanawha-New River Basin—West Virginia, Virginia, and North Carolina, 1996–98, U.S. Geological Survey Circular 1204, 32 p. [Also available at https://doi.org/10.3133/cir1204.]
Pohlert, T., 2020, ppcc—Probability plot correlation coefficient test (ver. 1.2): Comprehensive R Archive Network release accessed June 12, 2025, at https://doi.org/10.32614/CRAN.package.ppcc.
R Core Team, 2023, R—A language and environment for statistical computing, version 4.4.0: R Foundation for Statistical Computing, accessed April 24, 2024, at https://www.R-project.org.
Rose, J., 2019, Big water—New River Gorge spring rafting: Highland Outdoors Magazine, accessed May 23, 2025, at https://highland-outdoors.com/new-river-gorge-spring-rafting.
Sauer, V.B., and Turnipseed, D.P., 2010, Stage measurement at gaging stations: U.S. Geological Survey Techniques and Methods, book 3, chap. A7, 45 p., accessed May 24, 2022, at https://doi.org/10.3133/tm3A7.
Tate, C., 2024, New River Gorge drew a record 1.7 million visitors last year: West Virginia Public Broadcasting, accessed May 23, 2025, at https://wvpublic.org/story/energy-environment/new-river-gorge-drew-a-record-1-7-million-visitors-last-year/.
Tetra Tech, Inc., 2008, Total maximum daily loads for streams in the New River watershed, West Virginia: West Virginia Department of Environmental Protection, prepared by Tetra Tech, Inc., 61 p. [Also available at https://apps.dep.wv.gov/Documents/DWWM/TMDL/GroupD/New/_Final_EPA_APPROVED_New_River_TMDL_Report_11_24_08.pdf.]
Turnipseed, D.P., and Sauer, V.B., 2010, Discharge measurements at gaging stations: U.S. Geological Survey Techniques and Methods, book 3, chap. A8, 87 p., accessed May 24, 2022, at https://doi.org/10.3133/tm3A8.
U.S. Army Corps of Engineers, 2024, Bluestone Dam, Huntington District: U.S. Army Corps of Engineers webpage, accessed May 23, 2025, at https://www.lrd.usace.army.mil/Missions/Projects/Article/3641192/bluestone-dam.
U.S. Census Bureau, 2025, West Virginia city and town population totals 2020-2024: U.S. Census Bureau data release, accessed April 9, 2026, at https://www2.census.gov/programs-surveys/popest/tables/2020-2024/cities/totals/SUB-IP-EST2024-POP-54.xlsx.
U.S. Environmental Protection Agency, 2015, Recreational water quality criteria: U.S. Environmental Protection Agency Office of Water 820-F-12-058. [Also available at https://www.epa.gov/sites/default/files/2015-10/documents/rwqc2012.pdf.]
U.S. Environmental Protection Agency, 2021, Factsheet on water quality parameters—Escherichia Coli: U.S. Environmental Protection Agency 841F21007F, 3 p. [Also available at https://www.epa.gov/system/files/documents/2021-07/parameter-factsheet_e.-coli.pdf.]
U.S. Geological Survey, 2006, Collection of water samples (ver. 2.0, September 2006): U.S. Geological Survey Techniques of Water-Resources Investigations 09–A4, accessed July 16, 2024, at https://doi.org/10.3133/twri09A4.
U.S. Geological Survey, 2020, BacteriALERT realtime monitoring: U.S. Geological Survey webpage, accessed March 10, 2025, at https://ga.water.usgs.gov/bacteria/.
U.S. Geological Survey, 2023, Use of multiparameter instruments for routine field measurements: U.S. Geological Survey Techniques and Methods, book 9, chap. A6.8, 13 p., accessed September 2021 at https://doi.org/10.3133/tm9A6.8. [Supersedes USGS Techniques of Water-Resources Investigations 09–A6.8, version 1.1; and USGS Techniques and Methods, book 9, chap. A6.8, version 1.0.]
U.S. Geological Survey, 2025a, Geographic names information system: U.S. Geological Survey database, accessed May 6, 2025, at https://edits.nationalmap.gov/apps/gaz-domestic/public/search/names.
U.S. Geological Survey, 2025b, National hydrography dataset: U.S. Geological Survey dataset, accessed May 6, 2025, at https://www.usgs.gov/national-hydrography/national-hydrography-dataset.
U.S. Geological Survey, 2025c, USGS Water Data for the Nation: U.S. Geological Survey National Water Information System database, accessed February 26, 2025, at https://doi.org/10.5066/F7P55KJN.
Wagner, R.J., Boulger, R.W., Jr., Oblinger, C.J., and Smith, B.A., 2006, Guidelines and standard procedures for continuous water-quality monitors—Station operation, record computation, and data reporting: U.S. Geological Survey Techniques and Methods, book 1, chap. D3, 51 p., 8 attachments, accessed July 11, 2020, at https://doi.org/10.3133/tm1D3.
West Virginia GIS Technical Center, 2017, Public lands—National Park boundaries: West Virginia GIS Technical Center dataset, https://wvgis.wvu.edu/data/dataset.php?ID=57.
Wickham, H., 2023, tidyverse—Easily install and load the 'tidyverse' (ver. 2.0): Comprehensive R Archive Network release accessed May 1, 2025, at https://doi.org/10.32614/CRAN.package.tidyverse.
Wickham H., Chang, W., Henry, L., Pedersen, T.L., Takahashi, K., Wilke, C., Woo, K., Yutani, H., Dunnington, D., and van den Brand, T., 2025, ggplot2—Create elegant data visualizations using the grammar of graphics (ver. 3.5.2): Comprehensive R Archive Network release, accessed May 1, 2025, at https://doi.org/10.32614/CRAN.package.ggplot2.
Wilde, F.D., 2004, Cleaning of equipment for water sampling (ver. 3.1): U.S. Geological Survey Techniques of Water-Resources Investigations 09–A3, 83 p., accessed September 2021 at https://pubs.usgs.gov/twri/twri9a3/final508Chap3book.pdf.
Wilde, F.D., ed, 2002, Processing of water samples (ver. 2, April 2002): U.S. Geological Survey Techniques of Water-Resources Investigations 09–A5, accessed September 2021 at https://doi.org/10.3133/twri09A5.
Wilde, F.D., Sandstrom, M.W., and Skrobialowski, S.C., 2014, Selection of equipment for water sampling (ver. 3.1): U.S. Geological Survey Techniques of Water-Resources Investigations 09–A2, 78 p., accessed September 2021 at http://water.usgs.gov/owq/FieldManual/Chapter2/Ch2_contents.html.
Wilson, L., and Purvis, J.M., 2003, Water quality monitoring program 1998–2000—New River Gorge National River, Bluestone National Scenic River, Gauley River National Recreation Area: Glen Jean, W. Va., National Park Service, 39 p. [Also available at https://archive.org/details/waterqualitymoni00wils/page/n1/mode/2up.]
Conversion Factors
U.S. customary units to International System of Units
International System of Units to U.S. customary units
Temperature in degrees Celsius (°C) may be converted to degrees Fahrenheit (°F) as follows:
°F = (1.8 × °C) + 32.
Datums
Vertical coordinate information is referenced to the North American Vertical Datum of 1988 (NAVD 88).
Horizontal coordinate information is referenced to the North American Datum of 1983 (NAD 83).
Elevation, as used in this report, refers to distance above the vertical datum.
Supplemental Information
Specific conductance is given in microsiemens per centimeter at 25 degrees Celsius (µS/cm at 25 °C).
Concentrations of chemical constituents in water are given in milligrams per liter (mg/L).
Concentrations of bacteria in water samples are given in most probable number (MPN) per 100 milliliters (MPN/100 mL).
For additional information contact
Director, Virginia and West Virginia Water Science Center
U.S. Geological Survey
1730 East Parham Road
Richmond, Virginia 23228
or visit our website at
https://www.usgs.gov/centers/virginia-and-west-virginia-water-science-center
Publishing support provided by the U.S. Geological Survey, Science Publishing Network, Baltimore Publishing Service Center.
Disclaimers
Any use of trade, firm, or product names is for descriptive purposes only and does not imply endorsement by the U.S. Government.
Although this information product, for the most part, is in the public domain, it also may contain copyrighted materials as noted in the text. Permission to reproduce copyrighted items must be secured from the copyright owner.
Suggested Citation
Kearns, M.R., and Chambers, D.B., 2026, Estimation, distribution, and development of a surrogate model for Escherichia Coli in the New River, New River Gorge National Park and Preserve, West Virginia, 2021–23: U.S. Geological Survey Scientific Investigations Report 2026–5025, 32 p., https://doi.org/10.3133/sir20265025.
ISSN: 2328-0328 (online)
| Publication type | Report |
|---|---|
| Publication Subtype | USGS Numbered Series |
| Title | Estimation, distribution, and development of a surrogate model for Escherichia Coli in the New River, New River Gorge National Park and Preserve, West Virginia, 2021–23 |
| Series title | Scientific Investigations Report |
| Series number | 2026-5025 |
| DOI | 10.3133/sir20265025 |
| Publication Date | June 12, 2026 |
| Year Published | 2026 |
| Language | English |
| Publisher | U.S. Geological Survey |
| Publisher location | Reston VA |
| Contributing office(s) | Virginia and West Virginia Water Science Center |
| Description | Report: viii, 32 p. |
| Online Only (Y/N) | Y |
| Additional Online Files (Y/N) | N |