

Bathymetric and Velocimetric Surveys at Highway Bridges Crossing the Missouri River near Kansas City, Missouri, August 8–9, 2023
Links
- Document: Report (31 MB pdf) , HTML , XML
- Figure: Oversize figures (pdf)
- Dataset: USGS National Water Information System database - USGS water data for the Nation
- Data Release: USGS data release - Bathymetry and velocity data from surveys at highway bridges crossing the Missouri River in Kansas City, Missouri, August 8–9, 2023
- NGMDB Index Page: National Geologic Map Database Index Page (html)
- Download citation as: RIS | Dublin Core
Acknowledgments
The authors would like to acknowledge Bryan Hartnagel, Travis Stump, and Jennifer Harper of the Missouri Department of Transportation for their role in funding and supporting the work detailed in this report. Additionally, the authors would like to thank Taylor Dudunake and Ryder Myer of the USGS for their peer reviews of this report.
Abstract
Bathymetric and velocimetric data were collected by the U.S. Geological Survey, in cooperation with the Missouri Department of Transportation, near 8 bridge crossings of the Missouri River near Kansas City, Missouri, on August 8–9, 2023. A multibeam echosounder mapping system was used to obtain channel-bed elevations for river reaches that extended about 1,550 to 1,640 feet longitudinally and generally extended laterally across the active channel from bank to bank during low floodflow to nonflood conditions. These surveys provided the channel geometry and hydraulic conditions of the river at the time of the surveys and provided characteristics of scour holes, which may be useful in developing or verifying predictive guidelines or equations for computing potential scour depth. The data collected from the surveys may also be useful to the Missouri Department of Transportation as a record of low floodflow conditions in regards to the stability and integrity of the bridges with respect to bridge scour. Bathymetric data were collected around every in-channel pier. Scour holes were at most piers where bathymetry could be obtained, except for those piers on banks or surrounded by riprap. All the bridge sites in this study were surveyed and documented in previous studies.
The average difference between the bathymetric surfaces ranged from 0.07 to 4.16 feet higher in 2023 than 2019, which indicates overall deposition between the survey dates, as might be expected based purely on streamflow at the time of the survey. However, the average difference between the bathymetric surfaces ranged from 1.44 feet higher to 1.88 feet lower in 2023 than 2015, which indicates a dynamic equilibrium of scour and deposition overall between those surveys, despite the lower flow conditions in 2023. Similarly, the average difference between the bathymetric surfaces ranged from 3.18 feet higher to 5.19 feet lower in 2023 than 2011, which indicates a relative equilibrium between scour and deposition overall, albeit the trend was toward scour as might be expected because of the substantial flood event in 2011.
Riprap blankets and alignment to flow had a substantial effect on the size of the scour hole for a given pier. Piers that were partially or fully surrounded by riprap blankets had scour holes that were substantially smaller (to nonexistent) compared to piers with no rock or riprap and effectively mitigated the scour holes historically observed at these piers. Several of the structures had piers that were skewed to primary approach flow. At most of the structures, the scour hole was deeper and longer on the side of the pier with impinging flow than the leeward side, with some amount of deposition on the leeward side, as typically observed at piers skewed to approach flow.
Introduction
Scour in alluvial channels is the removal of channel-bed and bank material by flowing water and is the leading cause of bridge failures in the United States (Arneson and others, 2012). Scour at a bridge site is caused by short- and long-term geomorphic processes and the local effects from elements of the structure in or next to the waterway (Huizinga and Rydlund, 2004; Arneson and others, 2012). Because the effects of scour can be severe and dangerous, bridges and other structures over waterways are routinely assessed and inspected. Higher flow velocities and depths from increased streamflow can exacerbate scour processes.
The Missouri Department of Transportation (MoDOT) manages most of the transportation infrastructure within Missouri. A part of their responsibility is fulfilled through periodic inspections of highway structures, including bridges that span waterways. At most of these structures, all or most of the structure can be inspected from land or from personnel lift trucks deployed from the roadway of the structure; however, for structures over primary waterways, such as the Missouri and Mississippi Rivers, inspecting submerged parts of the structure requires a different approach.
The U.S. Geological Survey (USGS), in cooperation with MoDOT, began assessing scour at selected waterway crossings in Missouri in 1988 (Becker, 1994) and at waterway crossings throughout the State in 1991 (Huizinga and Rydlund, 2004). In 2007, the USGS, in cooperation with MoDOT, began monitoring scour at bridges using single-beam echosounders (Rydlund, 2009) and surveying channel bathymetry using a multibeam mapping system (MBMS; Huizinga and others, 2010; Huizinga, 2012, 2013; also refer to report references listed in table 1). An MBMS is a useful tool not only for surveying channel bathymetry but also for providing a medium- to high-resolution representation of submerged bridge structural elements. In 2010, the first round of periodic surveys at waterway crossings across the Missouri and Mississippi Rivers throughout Missouri began, beginning with bridges in the Kansas City, Missouri (Mo.), area then followed by bridges in the St. Louis, Mo., area, bridges on the Missouri River between Kansas City and St. Louis, and those on the periphery of Missouri (table 1). During high-flow conditions in June–August 2011, many of the highway bridges and several of the railroad bridges along the length of the Missouri River downstream from Montana were assessed (Densmore and others, 2013; Dietsch and others, 2014), including the 37 highway bridges (at 28 crossings) over the Missouri River in Missouri (Huizinga, 2012). These assessments help MoDOT fulfill their need to inspect bridges over the Missouri and Mississippi Rivers while also providing a valuable assessment of the channel-bed elevations and velocities in the area near the bridge crossings. These data can be used to develop or modify tools to predict bridge scour and other geomorphologic processes.
Table 1.
Routine periodic surveys of bridges that cross the Missouri and Mississippi Rivers throughout Missouri (modified from Huizinga, 2024a).[Mo., Missouri]
| Dates of routine surveys | Report references | Data references | Special notes |
|---|---|---|---|
| March 2010 | Huizinga (2010) | Huizinga (2020b) | Excluded L0734; A7650 not yet built. |
| June 2015 | Huizinga (2016) | Huizinga (2020b) | Excluded K0456/A0450. |
| August 2019 | Huizinga (2022a) | Huizinga (2021) | None. |
| October 2010 | Huizinga (2011) | Huizinga (2017b) | A6500 not yet built. |
| May 2016 | Huizinga (2017a) | Huizinga (2017b) | None. |
| August 2020 | Huizinga (2023) | Huizinga (2022b) | Included new bridges A8141 at Washington, Mo., and A8504 at Louisiana, Mo. |
| April–May 2013 | Huizinga (2014) | Huizinga (2020c) | None. |
| May 2017 | Huizinga (2020a) | Huizinga (2020c) | Excluded K0969; included A8340 in Kansas City, Mo. |
| May 2021 | Huizinga (2024a) | Huizinga and Rivers (2023a) | Excluded K0969/A8141 at Washington, Mo. |
| June 2014 | Huizinga (2015) | Huizinga (2020d) | None. |
| July–August 2018 | Huizinga (2020e) | Huizinga (2020d) | Excluded K0932 at Louisiana, Mo. |
| June 2022 | Huizinga (2024b) | Huizinga and Rivers (2023b) | Excluded A8504 at Louisiana, Mo. |
This study covers the surveys of the highway bridges across the Missouri River in the Kansas City, Mo., area (fig. 1), except for structure A4649 on U.S. Highway 169, which was being replaced in 2023 at the time of the surveys (table 1; table 2). Therefore, this study details surveys at 8 bridges at 7 crossings (table 2).
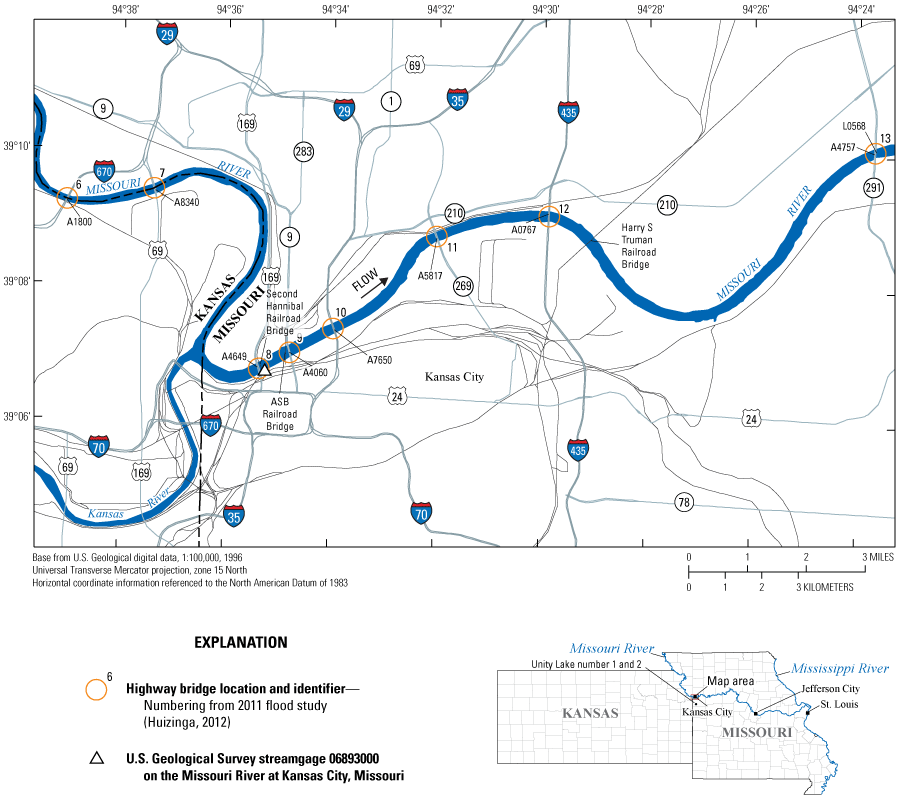
Map showing location of highway bridges crossing the Missouri River in the Kansas City, Missouri, area.
Table 2.
Highway bridges crossing the Missouri River near Kansas City, Missouri.[Bridges are listed in downstream order. KDOT, Kansas Department of Transportation; Mo., Missouri; Kans., Kansas; IS, Interstate highway; S, southbound; N, northbound; MoDOT, Missouri Department of Transportation; --, not applicable; US, U.S. highway; MO, Missouri State highway]
| Bridge site number (fig. 1) | Primary agency | Structure number | Local name | County, State | Route | River milea | Surveyed as part of this study | Remarks | Figures, in this report |
|---|---|---|---|---|---|---|---|---|---|
| b5 | KDOT | 435–105–11.97 (235) | Parkville | Platte, Mo. | IS 435 S | 383.4 | No | Dual bridge crossing with 435–105–11.98 (240) | -- |
| 435–105–11.98 (240) | Parkville | Wyandotte, Kans. | IS 435 N | No | Dual bridge crossing with 435–105–11.97 (235) | -- | |||
| 6 | MoDOT | A1800 | Riverside | Platte, Mo. | IS 635 | 374.1 | Yes | -- | 1, 6–13, 62, 63, 1.1 |
| 7 | MoDOT | A8340 | Fairfax | Platte, Mo. | US 69 | 372.6 | Yes | Replaced K0456/A0450 in 2016 | 1, 4, 14–21, 62, 63, 1.2 |
| 8 | MoDOT | A4649 | Buck O’Neil | Clay, Mo. | US 169 | 366.2 | No | Being replaced in 2023 | 1 |
| 9 | MoDOT | A4060 | Heart of America | Clay, Mo. | MO 9 | 365.5 | Yes | -- | 1, 22–29, 62, 63, 1.3 |
| 10 | MoDOT | A7650 | Christopher Bond | Clay, Mo. | IS 35 | 364.7 | Yes | -- | 1, 30–36, 62, 63, 1.4 |
| 11 | MoDOT | A5817 | Chouteau | Clay, Mo. | MO 269 | 362.3 | Yes | -- | 1, 37–44, 62, 63, 1.5 |
| 12 | MoDOT | A0767 | Randolph | Clay, Mo. | IS 435 | 360.3 | Yes | -- | 1, 45–52, 62, 63, 1.6 |
| 13 | MoDOT | A4757 | Courtney | Jackson, Mo. | MO 291 S | 352.7 | Yes | Dual bridge crossing with L0568 | 1, 53–55, 57–63, 1.7 |
| L0568 | Courtney | Jackson, Mo. | MO 291 N | Yes | Dual bridge crossing with A4757 | 1, 53, 54, 56–63, 1.7 |
River mile refers to the distance upstream from the confluence of the Missouri River with the Mississippi River at St. Louis, Mo. (fig. 1).
Shown for consistency with 2011 survey (Huizinga, 2012); not included in this study.
Purpose and Scope
The purpose of this report is to describe the equipment and methods used to do the surveys and to document the results of the bathymetric and velocimetric surveys of the Missouri River channel near 8 highway bridges at 7 crossings near Kansas City, Mo., completed on August 8–9, 2023 (fig. 1; table 2). The results obtained from the bathymetric and velocimetric surveys of the channel document the channel-bed geometry and velocity distribution at the time of the surveys and provide the characteristics of scour holes that may be useful in developing or modifying predictive guidelines or equations for computing potential scour depth. These data may also be used by MoDOT as a low to moderate floodflow conditions comparison to help assess the bridges for stability and integrity issues with respect to bridge scour. Results are also compared with results from previous surveys at the sites (Huizinga, 2010, 2012, 2016, 2022a).
Description of Study Area
The study area for this report encompasses the Missouri River in and near Kansas City, Mo. (fig. 1). The Missouri River flows through the Kansas City area from west to east, meandering across the floodplain. The river is highly channelized in the Kansas City area; rock revetment and spur dikes placed along the banks maintain the channel alignment, and levees and floodwalls are on the upper banks to limit flooding in the industrial, commercial, and agricultural areas on the floodplains. The site numbering sequence used in Huizinga (2012) is also used in this report for consistency and comparability.
Description of Streamflow Conditions
Data from the streamflow-gaging station (hereinafter referred to as “streamgage”) on the Missouri River at Kansas City, Mo. (station 06893000; U.S. Geological Survey, 2024a; fig. 1), indicate that the Missouri River was in a period of low flow for much of the summer of 2023, with streamflow at or below the 10-percent mean daily value for much of the period from April 15 to July 1, 2023, and near the 25-percent mean daily value for much of the rest of the year (fig. 2A). However, there was a minor rise just after these sites were surveyed on August 8–9, 2023 (fig. 2B). Streamflow as measured at the Kansas City streamgage on the Missouri River ranged from about 44,800 to 47,200 cubic feet per second (ft3/s) during the surveys (fig. 2B). This streamflow has a daily exceedance probability of about 51 to 56 percent (the probability that the indicated streamflow value would be equaled or exceeded on any given day at that streamgage; U.S. Geological Survey, 2024b) and is about half the 90-percent annual exceedance probability (the probability that the indicated streamflow value would be equaled or exceeded within a period of 1 year; also known as the 1-year recurrence interval) flood streamflow of 82,000 ft3/s (U.S. Army Corps of Engineers, 2023, table ES–2). Daily exceedance probabilities were computed using daily streamflow from 1957 to 2024 (U.S. Geological Survey, 2024b).
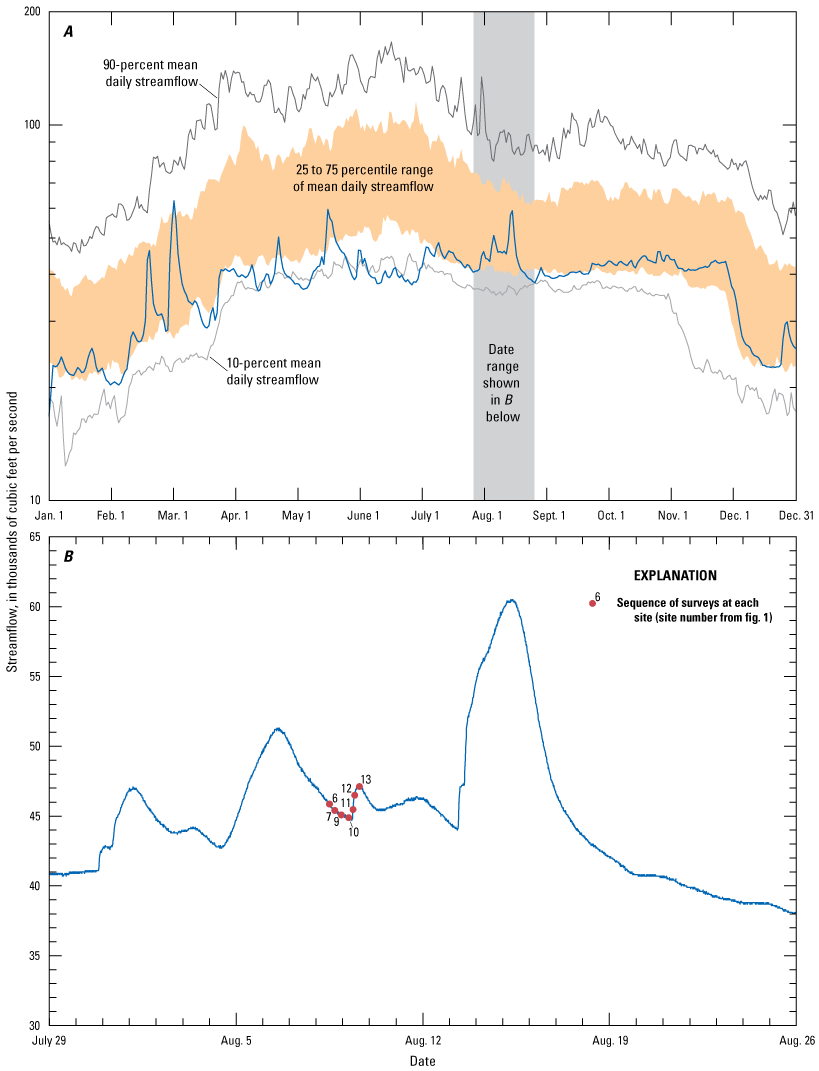
Graphs showing streamflow values and daily statistics from the streamgage on the Missouri River at Kansas City, Missouri (station 06893000; U.S. Geological Survey 2024a). A, daily values for January 1 through December 31, 2023; B, unit values (15-minute interval) for July 29 to August 26, 2023.
Streamflow conditions in these daily and annual exceedance ranges are in the low floodflow to nonflood regime. In an analysis of real time scour monitoring data from Jefferson City, Mo., Huizinga (2014) noted that substantial pier scour generally began soon after the onset of hydrograph rise (substantial rise of 8 feet [ft] or more), although the scour often did not reach maximum depth until the peak stage was reached or sometime thereafter (see fig. 35 in Huizinga, 2014). Peak streamflow conditions for the year did not happen during this study, and streamflow was probably near base flow based on the daily exceedance values when the survey was completed. Although scour conditions captured at sites during this study likely do not represent the maximum scour potential at the sites, the cumulative information gathered from multiple surveys from 2010 to 2023 at these sites remains useful for determining scour for a variety of flow conditions, particularly when combined with, or compared to, a scour scenario captured at higher, floodflow conditions.
Description of Equipment and Basic Processing of Data
The bathymetry of the Missouri River at each of the bridges was determined using a high-resolution MBMS. The various components of the MBMS used for this study are described in previous studies of the Missouri and Mississippi Rivers in Missouri (see report references listed in table 1) and of the Missouri and Yellowstone Rivers in North Dakota (Densmore and others, 2013). MBMS survey methods and data-quality checks were similar to those described in these studies. A brief description of the specific equipment used is given in the following paragraphs; a more complete description of the various system components and methods used in this study are available in previous reports by Huizinga (2010), Huizinga and others (2010), and Densmore and others (2013).
An MBMS is an integration of several individual components: the multibeam echosounder (MBES), a sound-velocity probe, an inertial navigation system (INS), and a data-collection and data-processing computer. The MBES used in this study was the Norbit iWBMSh (fig. 3), operated at a frequency of 400 kilohertz (kHz) with a curved piezoceramic receiver array which enables bathymetric data to be collected throughout a swath range of 210 degrees. Optimum data are usually collected in a swath of less than 160 degrees (80 degrees on each side of the nadir or straight down below the MBES); nevertheless, the swath can be electronically rotated to either side of the nadir, enabling data to be collected along sloping banks up to a depth just below the water surface. The MBES is the same system used in the previous surveys in 2019 (Huizinga, 2022a). The sound-velocity probe provides real time measurements of the speed of sound at the MBES to accurately determine the depth readings of the MBES (Hughes-Clarke and others, 1996). The river environment tends to be well mixed, so that the sound velocity at the MBES is sufficiently representative of the sound-velocity profile of the full water column. The Norbit iWBMSh uses the Applanix Position Orientation Solution for Marine Vessels (POS MV) OceanMaster INS system, consisting of an inertial measurement unit (IMU) attached directly to the MBES mount in what is referred to as a “tightly coupled” configuration (fig. 3A) and two Global Navigation Satellite System (GNSS) receivers (fig. 3B). The INS provides position in three-dimensional space and measures the attitude of the vessel (pitch, roll, yaw, and heading) to accurately position the data received by the MBES. Realtime kinematic (RTK) differential corrections for the INS came from cellular communication with the MoDOT GNSS real time network for the navigation and tide solution during the 2023 surveys.
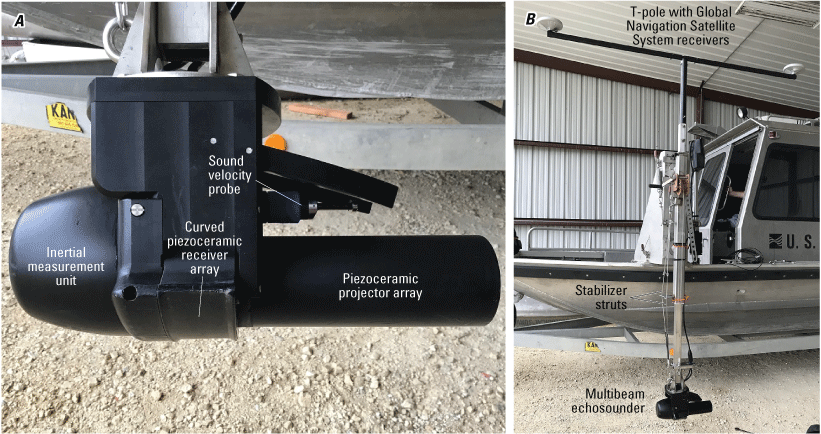
Photographs showing the multibeam echosounder (photographs by Richard J. Huizinga, U.S. Geological Survey). A, viewed from the side; B, viewed as mounted on the port side of the U.S. Geological Survey boat.
Like all surveys after 2010 (see report references listed in table 1), the navigation information from the 2023 surveys was postprocessed using the POSPac Mobile Mapping Suite (MMS) software (version 8.7; Applanix Corporation, 2021) to mitigate the effects of degraded positional accuracy caused by GNNS outages when the vessel was near or under a bridge. The POSPac MMS software provides tools to identify and compensate for sensor and environmental errors to compute an optimally blended navigation solution from the GNSS and raw IMU data. The blended navigation solution (called a “smoothed best estimate of trajectory” or “SBET” file) generated by postprocessing the navigation data was applied to the survey at a given bridge to minimize the effects of the GNSS outages.
Data from the MBES and INS components were processed and integrated into a cohesive dataset for cleanup and visualization. A computer onboard the survey vessel ran the HYPACK/HYSWEEP data acquisition software (version 2022; HYPACK, Inc., 2022) that was used to prepare for and do bathymetric surveys. After completing the surveys, the acquired depth data were further processed to remove data spikes and other spurious points in the multibeam swath trace, georeferenced using the navigation and position solution data from the SBET file, and visualized in HYPACK/HYSWEEP as a gridded bathymetric surface or a point cloud.
Information about the velocity of the water at various points throughout each study reach were collected using an acoustic Doppler current profiler (ADCP), like previous studies since 2011 (for example, see Huizinga, 2012, 2022a). A Teledyne RD Instruments RiverPro ADCP operating at 1,200 kHz was used to obtain velocities at depth-dependent variable-height increments or “bins” throughout the water column. The RiverPro ADCP operates at depths from about 0.5 to 100 ft to determine the velocity of water by measuring the Doppler shift of an acoustic signal reflected from various particles suspended in the water (Mueller and others, 2013). By measuring the Doppler shift in four different beam directions, the velocity of the water in each bin can be determined in three dimensions. Water velocities were measured along sections spanning the width of the channel. The depth-averaged velocities from the two traverses of a given section line were computed using averaging algorithms from the Velocity Mapping Toolbox (version 4.09; Parsons and others, 2013).
Basic Description of Methods
The methods used to acquire and ensure that quality data were collected were the same as those used in previous studies using the MBES (methods are detailed in Huizinga, 2010, 2012; Huizinga and others, 2010). A brief summary of—and any differences from—these methods are highlighted below.
Surveying Methods
Generally, the surveyed area extended across the active channel from bank to bank, just like the previous studies on the Missouri River in the Kansas City area (Huizinga, 2010, 2012, 2016, 2022a). The surveyed reaches were about 1,550 to 1,660 ft long in the longitudinal (streamwise) direction, positioned so that the surveyed highway bridges were about one-third to one-half of the total length of the study reach from the upstream boundary, generally about the same upstream and downstream boundaries as were used in the 2011 flood study on the Missouri River (Huizinga, 2012). The area encompassed by the upstream and downstream boundaries of the surveyed areas were assumed to capture all the substantial hydraulic effects (wake vortices and shear flow) of the bridge structures, based on visual estimation.
Like in previous studies, bathymetric data were obtained along longitudinal survey lines, and each survey was designed so that the adjacent survey swaths overlapped in an attempt to ensure complete coverage of the channel bed and minimize sonic “shadows” (Huizinga and others, 2010). Many surveyed swaths had substantial (30 to 60 percent) overlap, except in shallow areas near the channel banks or spur dikes and near inflow structures or debris rafts. Areas near bridge piers and along the banks were also surveyed in an upstream direction with the MBES swath electronically tilted to port or starboard to increase the acquisition of bathymetric data higher on the banks and sides of the piers. The electronically tilted swath was generally 120 to 160 degrees wide, extending from 10 degrees above horizontal on the bank-ward or pier-ward side of the survey vessel, and 20 to 60 degrees past nadir below the vessel.
After completing the bathymetric survey at a given site, velocity data were obtained with the ADCP at seven sections spanning the channel within the study area. The ADCP was mounted on the boat, and the position and speed of the boat was determined using a differential GNSS receiver mounted on a pole directly above the ADCP. The bottom-track reference method for determining boat speed was anticipated to be unusable because of moving channel-bed material, so the boat speed was determined using the GNSS essential fix data from the differential GNSS receiver (the NMEA–0183 GGA string [shorthand for the $GPGGA standard output format for GNSS essential fix data defined by the National Marine Electronics Association 0183 standard that includes information on the three-dimensional location and accuracy of the GNSS receiver; National Marine Electronics Association, 2002]). The distance between the velocity section lines was generally about 260 ft. Three sections were upstream, and four sections were downstream from the bridge being surveyed. Each section line was traversed in each direction across the river, and the reported velocity values were the average from the two traverses of a given section line. Streamflow for a site was approximated using the average of the streamflow from reciprocal pairs (two transects per section line) at the various sections in the reach.
Survey Quality-Assurance/Quality-Control Measures
The principal quality-assurance measures were assessed in real time during the survey for the MBMS. The MBMS operator did this by making visual observations of cross-track swath shape (such as convex, concave, or skewed bed returns in flat, smooth bottoms), noting data-quality flags and alarms from the MBES and the INS and noting comparisons between adjacent overlapping swaths.
In addition to the real time quality-assurance assessments, beam angle checks and a suite of patch tests were completed to ensure quality data were acquired from the MBMS during the 2023 surveys. The beam angle check was completed on May 17, 2023, at Unity Lake Number 2 at Unity Village, Mo. (fig. 1), and surveyed depths were similar to or greater than those expected for the Missouri River. The results of the beam angle check (table 3) were within the recommended performance standards used by the U.S. Army Corps of Engineers for hydrographic surveys for all the representative angles below 75 degrees (U.S. Army Corps of Engineers, 2013). Points acquired outside of the central 100–110 degrees of the swath generally had overlap with adjacent swaths, which increases the quality of the survey in the overlapped areas because of duplication.
Table 3.
Results of a beam angle check from two check lines over a reference surface at Unity Lake Number 2 near Unity Village, Missouri, on May 17, 2023.[<, less than; --, no data]
Performance standard threshold values are from U.S. Army Corps of Engineers (2013, table 3–1) for soft sand/silt bottoms as generally found in these surveys.
Patch tests are a series of dynamic calibration tests that are used to check for subtle variations in the orientation and timing of the MBES with respect to the INS and real-world coordinates (Huizinga, 2024b) and are primarily used to determine angular offsets to roll, pitch, and yaw caused by the alignment of the transducer head relative to the INS (see fig. 4 in Huizinga [2022a]). These offsets have been observed to be constant for a given equipment configuration and survey season, barring an event that causes the mount to change such as striking a floating or submerged object (see report references listed in table 1; Rivers and others, 2024). A patch test was completed on May 17, 2023, at Unity Lake Number 1 at Unity Village, Mo. (fig. 1). The tightly coupled configuration of the Norbit iWBMSh resulted in no measured timing offset and no measured angular offset for pitch. The yaw is a measure of the alignment of the GNSS receivers relative to the IMU of the INS on the echosounder head, and there was no measured offset for yaw in the patch test. The measured angular offset for roll was −0.10, which is consistent with results for this equipment configuration in other recent (2022–23) surveys (Huizinga, 2024b; Rivers and others, 2024). The earliest work with the MBMS in Missouri recorded (Huizinga, 2010) that a sensitivity analysis of the four offsets implied that the ultimate position of surveyed points in three-dimensional space was least sensitive to the angular offset for yaw, whereas the position was most sensitive to the angular offset for roll. Processing all the data from the bridge surveys detailed in this report with an angular offset of roll of –0.10 degree and no angular offset for pitch or yaw generally yielded good results with no noticeable artifacts caused by incorrect offsets.
Angular offsets were applied to the bathymetric data before removing data spikes caused by fish and other spurious points in the multibeam swaths using automatic filters and manual editing. The bathymetric data were then projected onto a three-dimensional grid at a resolution of 1.64 ft using the Combined Uncertainty and Bathymetry Estimator (CUBE) method (Calder and Mayer, 2003) as implemented in the MBMax processing package of the HYPACK/HYSWEEP software (HYPACK, Inc., 2022) and used to generate a gridded raster surface of the channel bed (and associated uncertainty) near each bridge (hereinafter referred to as a “bathymetric surface”) at the same spatial resolution as the CUBE data grid using ArcGIS Pro (version 3.4.0; Esri, 2024).
A quality-assurance plan has been established for streamflow and velocity measurements taken with ADCPs that includes several instrument diagnostic checks and calibrations. This quality assurance plan was followed when acquiring the velocity profile data for these surveys. For a detailed discussion of these procedures, see Mueller and others (2013).
Uncertainty Estimation
Like recent bathymetry studies in Missouri (see report references listed in table 1; Rivers and others, 2024), uncertainty in each survey was estimated by computing the uncertainty for each survey-grid cell in the bathymetric surface of the survey area using the CUBE method (Calder and Mayer, 2003). The resulting gridded uncertainty is a measure of the variability of the individual points in the cell and is used to determine the CUBE-derived elevation for the cell. Statistics for gridded uncertainty of each of the survey areas are shown in table 4. An example of the spatial distribution of gridded uncertainty typically observed in the survey data at structure A8340 on U.S. Highway 69 is shown in figure 4. The uncertainty data were output and combined with the three-dimensional bathymetry data and are included with metadata in the USGS data release associated with this study (Huizinga and Rivers, 2025).
Table 4.
Total gridded uncertainty results for bathymetric data at a 1.64-foot grid spacing from surveys on the Missouri River near Kansas City, Missouri, August 8–9, 2023.[Data are summarized from Huizinga and Rivers (2025).]
| Bridge site number (fig. 1) | Structure number | Uncertainty, in feet | Percentage of bathymetry points with uncertainty value less than a given threshold | ||||||
|---|---|---|---|---|---|---|---|---|---|
| Maximum | Mean | Median | Standard deviation | 1.00 foot | 0.50 foot | 0.25 foot | 0.10 foot | ||
| 6 | A1800 | 6.56 | 0.06 | 0.03 | 0.10 | 99.8 | 99.4 | 98.2 | 94.7 |
| 7 | A8340 | 6.36 | 0.06 | 0.03 | 0.10 | 99.8 | 99.2 | 97.4 | 92.1 |
| 9 | A4060 | 6.40 | 0.05 | 0.03 | 0.06 | 100.0 | 99.8 | 99.0 | 96.0 |
| 10 | A7650 | 6.14 | 0.06 | 0.03 | 0.07 | 99.9 | 99.6 | 98.3 | 94.6 |
| 11 | A5817 | 6.33 | 0.06 | 0.03 | 0.07 | 99.9 | 99.6 | 98.0 | 92.3 |
| 12 | A0767 | 6.50 | 0.05 | 0.03 | 0.07 | 99.9 | 99.7 | 98.6 | 94.4 |
| 13 | A4757/L0568 | 6.33 | 0.05 | 0.03 | 0.06 | 99.9 | 99.7 | 99.0 | 96.9 |
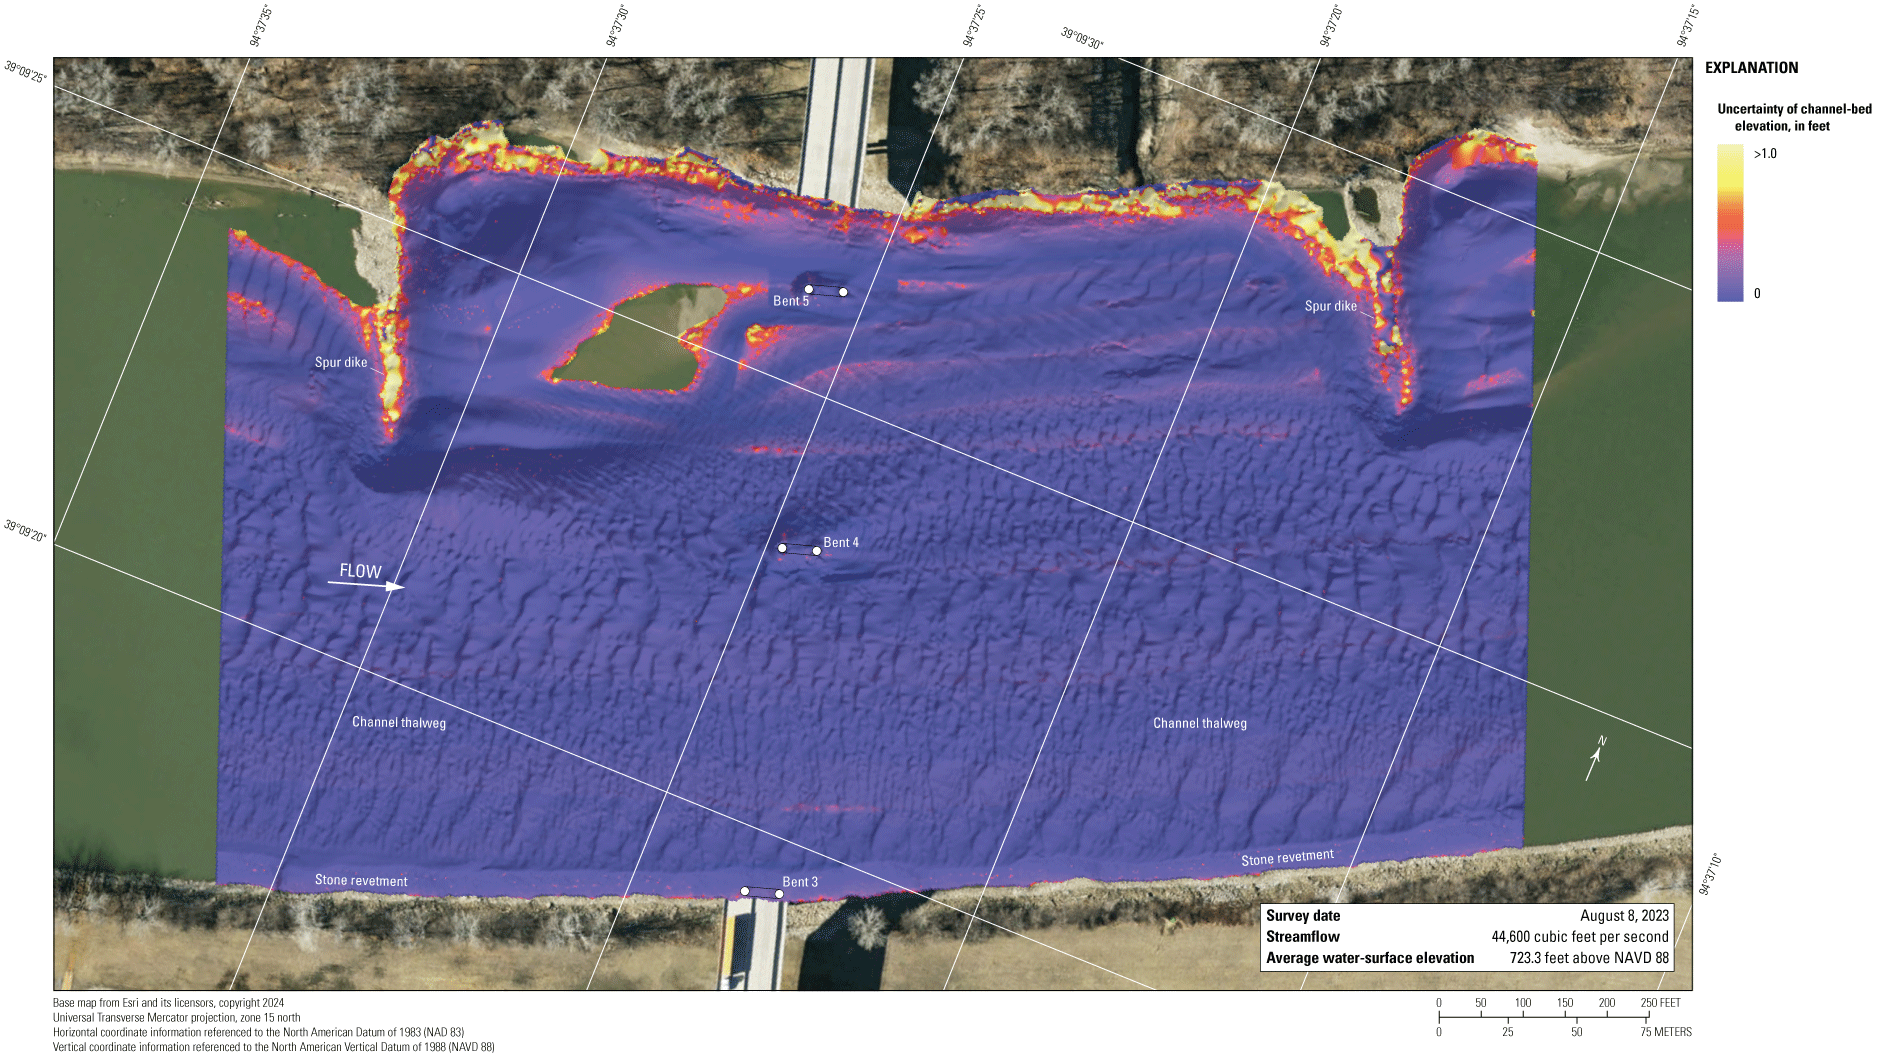
Map showing uncertainty of channel-bed elevation from the Missouri River channel near structure A8340 on U.S. Highway 69 in Kansas City, Missouri. [>, greater than; NAVD 88, North American Vertical Datum of 1988]
More than 99 percent of the uncertainty values at all the sites were less than 0.50 ft (table 4), which is within the specifications for a “Special Order” survey, the second-most-stringent survey standard of the International Hydrographic Organization (IHO; International Hydrographic Organization, 2022). Furthermore, more than 92 percent of the uncertainty values were less than 0.10 ft (table 4). The tops of bridge substructural elements (pier footings and seal courses) typically had uncertainty values of less than 0.10 ft. Like noted in previous surveys using this type of equipment (see, for example, Huizinga, 2012, 2016), the uncertainty values were larger near moderate-relief features (banks, spur dikes, rock riprap and outcrops, and scour holes near piers) but largest near high-relief features, such as the front or side of a pier footing (fig. 4). The largest uncertainty value in this group of surveys was 6.56 ft (table 4). Occasionally, the uncertainty values were also larger (1.00 ft or greater) in the outermost beams of the multibeam swath where there was overlap with an adjacent swath, particularly when the MBES head was electronically tilted for the survey lines along the banks or near the piers. Overlapping adjacent swaths in the channel thalweg (the line of maximum depth in the channel) can also display larger uncertainty values because substantial bed movement can happen between swaths (fig. 4).
The uncertainty of the gridded data computed using the CUBE method (hereinafter referred to as “gridded uncertainty”) has been decreasing with time compared with data from previous surveys (see table 4 in previous studies of the Kansas City area; Huizinga, 2012, 2016, 2022a). The decrease in gridded uncertainty is primarily because of improvements in data-collection equipment and methods. The tightly coupled configuration of the Norbit iWBMSh used in these surveys decreases some gridded uncertainty by substantially reducing the lever arm length (and therefore the potential movement) between the MBES and IMU. The ability to electronically tilt the swath substantially reduces the time between when unrotated, down-looking data and rotated, side-looking data are collected, which reduces the gridded uncertainty of the data in the swath overlap zone that might otherwise experience more substantial bed movement.
The survey at structure A8340 on U.S. Highway 69 had the lowest percentage of bathymetry points with a gridded uncertainty of less than the various thresholds, and one of the higher maximum values (6.36 ft) of gridded uncertainty (table 4). The survey at this site was done with smooth longitudinal swaths, which was also done at nearly all the sites surveyed in this study. The primary anomalies at this site were observed near the outermost beams of adjacent swaths and along the banks where the MBES was used in an electronically tilted configuration to extend the potential coverage in these areas, resulting in higher uncertainty values (fig. 4). Generally, the magnitude and distribution of uncertainty values observed at this site are representative of those observed at all the sites.
Results of Bathymetric and Velocimetric Surveys
The site-specific bathymetric and velocimetric survey results for each bridge are discussed in the following sections, starting with the upstream-most bridge site and progressing downstream. The range of bed elevations described as “the channel-bed elevations” for each survey was based on statistical analyses of the bathymetric surface of the bed at each site and covers the 5th to 95th percentile range of the data. Because the surveys were generally limited to the active channel from bank-to-bank the range generally included the channel bed but excluded the banks and localized high or low spots, such as spur dikes or scour holes near piers or spur dikes. All elevation data were referenced to the North American Vertical Datum of 1988 (NAVD 88) using the geoid model GEOID18 (National Geodetic Survey, 2020).
For consistency with earlier studies, dune sizes are described in general terms for each of the bridge sites using the categories set by Huizinga (2012) in his discussion of bathymetry during the 2011 flood. In this report, small dunes and ripples are those that are less than 5 ft high from crest to trough, medium dunes are those that are 5 to 10 ft high, large dunes are those that are 10 to 15 ft high, and very large dunes are those that are 15 ft or more in height.
All the bridge sites in this study were previously surveyed (Huizinga, 2010, 2012, 2016, 2022a), and bathymetry data from earlier surveys at all seven crossings are included with the metadata in Huizinga (2020b) and Huizinga (2021). A map showing the difference in channel-bed elevation for the area common to the comparison surveys is included for each site, and data from previous surveys are included in the cross-section plot for that bridge. The difference maps were created using the Geomorphic Change Detection (GCD; version 7.5) standalone tool that was available through the Riverscapes Consortium (2024). GCD computes the elevation difference and volumetric change in storage between two gridded raster surfaces (each as a digital elevation model or “DEM” of the surface) derived from repeat topographic or bathymetric surveys. The GCD program provides a suite of tools to associate the uncertainties of points in the various surveys (using the uncertainty values associated with each point or an average uncertainty of the survey when point-specific uncertainty data were not available [survey data from 2011 or before]) and propagates those uncertainties through the DEM of difference (DoD) map. The GCD program also provides a way to segregate the best estimates of change using threshold masks. A threshold mask of 95-percent confidence was used for comparisons in this study, and summary statistics (maximum, minimum, and average) of the DoD maps were determined. Sediment volumes for cut (scour) and fill (deposition) between the 2023 survey and any previous surveys were determined, and the average difference between the bathymetric surfaces (the statistical mean value of the gridded raster surface created from the thresholded difference between the 2023 and any previous gridded raster bathymetric surfaces) was computed. To allow for comparison of sites, the average difference is qualitatively described as minor (less than 1.0 ft of average change), moderate (between 1.0 and 2.0 ft of average change), or substantial (more than 2.0 ft of average change). Other descriptions of “minor,” “moderate,” or “substantial” change with respect to the difference maps (not specific to the average difference) and are intended to provide comparisons in a relative sense. The surveys are broadly compared based on their timing and the streamflow at the time of the survey.
In the DoD maps presented and discussed in the site-specific discussion sections that follow, only the area common to the two surveys being compared was analyzed. A polygon that generally covers the area of the 2023 survey was used as a white backdrop to enhance the visibility of the color scale used in the DoD map. As a result, areas with differences less than the propagated uncertainties of the compared surveys show up as white areas between scour and deposition, in the range of –1 to +1 ft difference. In the site-specific discussions that follow, these areas are equivocal and within the 95-percent confidence bounds of uncertainty of detectable change (hereinafter referred to as “within the bounds of uncertainty”). As mentioned in the “Uncertainty Estimation” section, gridded uncertainty has been decreasing over time through improvements in data-collection equipment and methods; therefore, the equivocal areas are generally narrower in comparisons with more recent surveys and wider in comparisons with older surveys. Small areas not surveyed in one or the other of the surveys being compared are also displayed as white areas; however, these areas are often “embedded” in an area of scour or deposition and not generally on the boundary between scour and deposition. Furthermore, occasionally larger areas (usually around the perimeter of the surveyed area) were not covered in the earlier survey and are also displayed as white areas. These unsurveyed areas usually result in a distinct break from an area of scour or deposition to an area of no data. Equivocal areas that coincide with revetment or a rock outcrop are highlighted in the site-specific discussions that follow.
When calculating differences between two surveys near sloped or vertical features, small horizontal positional variations can result in substantial calculated elevation differences. This phenomenon was discussed in the most recent report on bathymetric surveys at bridges on the periphery of Missouri (Huizinga, 2024b), and a schematic of this phenomenon is shown on figure 5, where a position offset of one grid spacing (0.5-meter) results in apparent deposition or scour on the opposing faces of a spur dike or the opposing sides of a pier. When deposition and scour are apparent on opposing faces of a feature, as will be discussed in the following site-specific discussions and maps, the likely cause is a minor horizontal positional variance between the surveys. The horizontal positional variances from the 2023 survey are the largest when compared with the 2010 surveys, because the 2010 surveys had the largest overall uncertainty (see “Uncertainty Estimation” section).
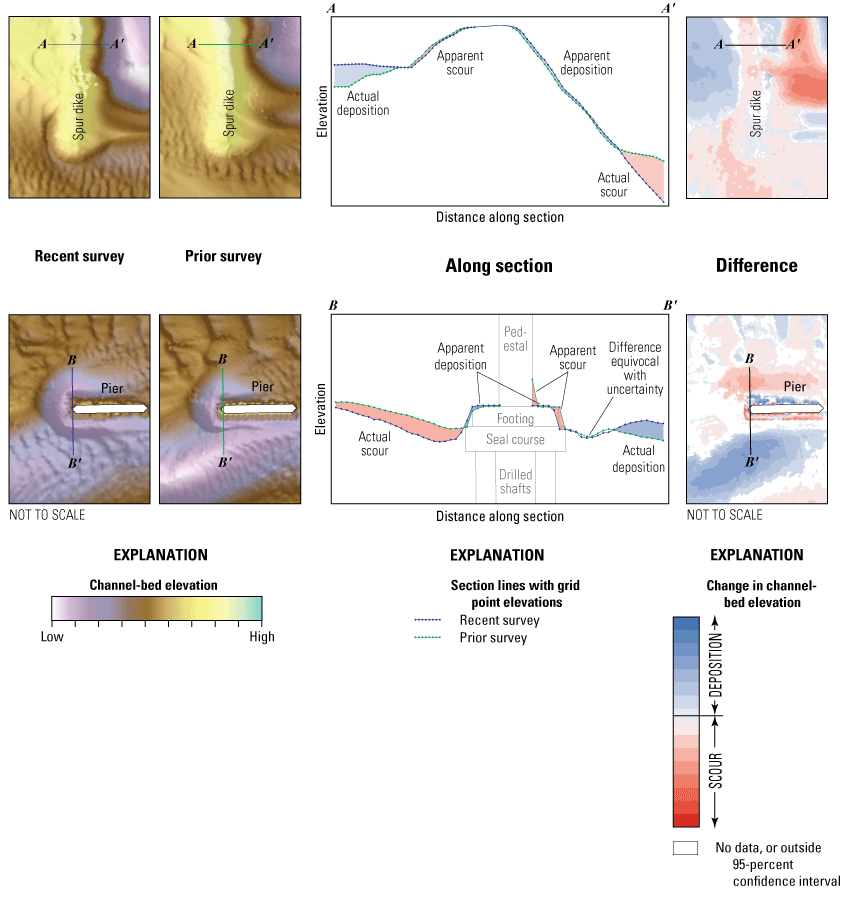
Schematics showing effects of minor positional variations of the data points between surveys on sloped and vertical surfaces such as piers and spur dikes (from Huizinga [2024b]).
Although the configuration of the channel bed and the underlying sediment transport conditions at a site are associated with an instantaneous streamflow in the discussions that follow, a given bathymetric surface actually reflects more than those instantaneous transport conditions. A wide variety of factors affect the channel-bed configuration of a reach for a specific streamflow, including magnitude of flow velocities and velocity distribution; the number, size, and timing of previous flood rises; whether the stage is rising or falling; and other local hydraulic conditions (Gilbert and Murphy, 1914; Simons and Richardson, 1966). Furthermore, the channel-bed configuration at a site is affected by upstream and local sediment conditions (size and spatial distribution) and contributions, as well as water temperature and other seasonal variations (Simon and Associates, 1985). Because of the great number of factors affecting sediment transport conditions and the interactions between them and the resulting bed conditions, the configuration and size of bed forms observed during the current (2023) surveys in the Kansas City area were assumed to have depended on more than the instantaneous streamflow at a given site. Although the current study (2023) does not examine all the antecedent conditions that created the observed channel-bed configuration, this survey, when compared with previous surveys under different streamflow conditions, nevertheless contributes to understanding the many complexities of sediment transport and resulting channel-bed conditions.
As in recent previous studies (table 1), when discussing the vertically averaged velocity values obtained during the surveys detailed in the sections that follow, neighboring vectors that had random variations in direction and magnitude were taken as an indication of nonuniform flow in the section resulting from shear and wake vortices. Conversely, neighboring vectors having gradual and systematic variations were taken as an indication of uniform flow in the section. The Missouri River is highly turbulent even in the absence of structures that generate strong shear or wakes, but in the interest of conciseness, nonuniform flow is loosely described as “turbulent” in the following sections.
Shaded triangulated irregular network (TIN) images of the channel and side of pier were prepared for each surveyed pier. These visualizations are shown in appendix 1, figures 1.1 to 1.7. These images can be used by MoDOT as a quasi-visual representation of each pier in situ.
Structure A1800 on Interstate 635
Structure A1800 (site 6; table 2) on Interstate 635 crosses the Missouri River at river mile (RM) 374.1, on the northwestern side of Kansas City (fig. 1). The site was surveyed on August 8, 2023, and the average water-surface elevation of the river in the survey area, determined by the RTK GNSS tide solution (from the MBMS during the survey), was 724.9 ft (table 5; fig. 6). Streamflow of the Missouri River was about 44,600 ft3/s during the survey (table 5).
Table 5.
Bridge and survey information and selected channel-bed elevations from surveys on the Missouri River near Kansas City, Missouri, August 8–9, 2023.[Data are summarized from Huizinga and Rivers (2025). Sites are shown on figure 1. Dates are given in month/day/year. All elevations are in feet above the North American Vertical Datum of 1988. ADCP, acoustic Doppler current profiler; IS, Interstate highway; US, U.S. highway; MO, State highway]
| Bridge site number (fig. 1) | Structure number | Survey date | Route | River milea | Streamflow from ADCP measurementsb, in cubic feet per second | Average water-surface elevation near the bridge, in feet | Average channel-bed elevationc, in feet | Approximate elevation of the indicated percentile of the bathymetric data, in feet | Approximate local minimum channel elevationd, in feet | |
|---|---|---|---|---|---|---|---|---|---|---|
| 5th percentile | 95th percentile | |||||||||
| 6 | A1800 | 08/08/23 | IS 635 | 374.1 | 44,600 | 724.9 | 709.3 | 705.8 | 716.1 | e695 |
| 7 | A8340 | 08/08/23 | US 69 | 372.6 | 44,600 | 723.3 | 708.2 | 701.3 | 716.8 | 685 |
| 9 | A4060 | 08/08/23 | MO 9 | 365.5 | 46,400 | 716.2 | 700.2 | 694.9 | 707.5 | 679 |
| 10 | A7650 | 08/08/23 | IS 35 | 364.7 | 46,200 | 715.4 | 699.8 | 694.4 | 706.9 | e679 |
| 11 | A5817 | 08/09/23 | MO 269 | 362.3 | 46,700 | 713.3 | 699.0 | 689.9 | 706.4 | 684 |
| 12 | A0767 | 08/09/23 | IS 435 | 360.3 | 46,500 | 711.4 | 696.1 | 689.0 | 704.4 | 677 |
| 13 | A4757/L0568 | 08/09/23 | MO 291 | 352.7 | 46,600 | 705.6 | 689.4 | 685.2 | 696.7 | e671 |
River mile is the distance upstream on the Lower Missouri River, with river mile 0 being at the confluence of the Missouri River with the Mississippi River at St. Louis, Mo. (fig. 1), at river mile 195.2 of the Upper Mississippi River.
The average streamflow obtained while making the various velocity transects. The reported value is the streamflow computed using the Global Navigation Satellite System (GNSS) essential fix data string as the reference, as described in the “Surveying Methods” section of the text.
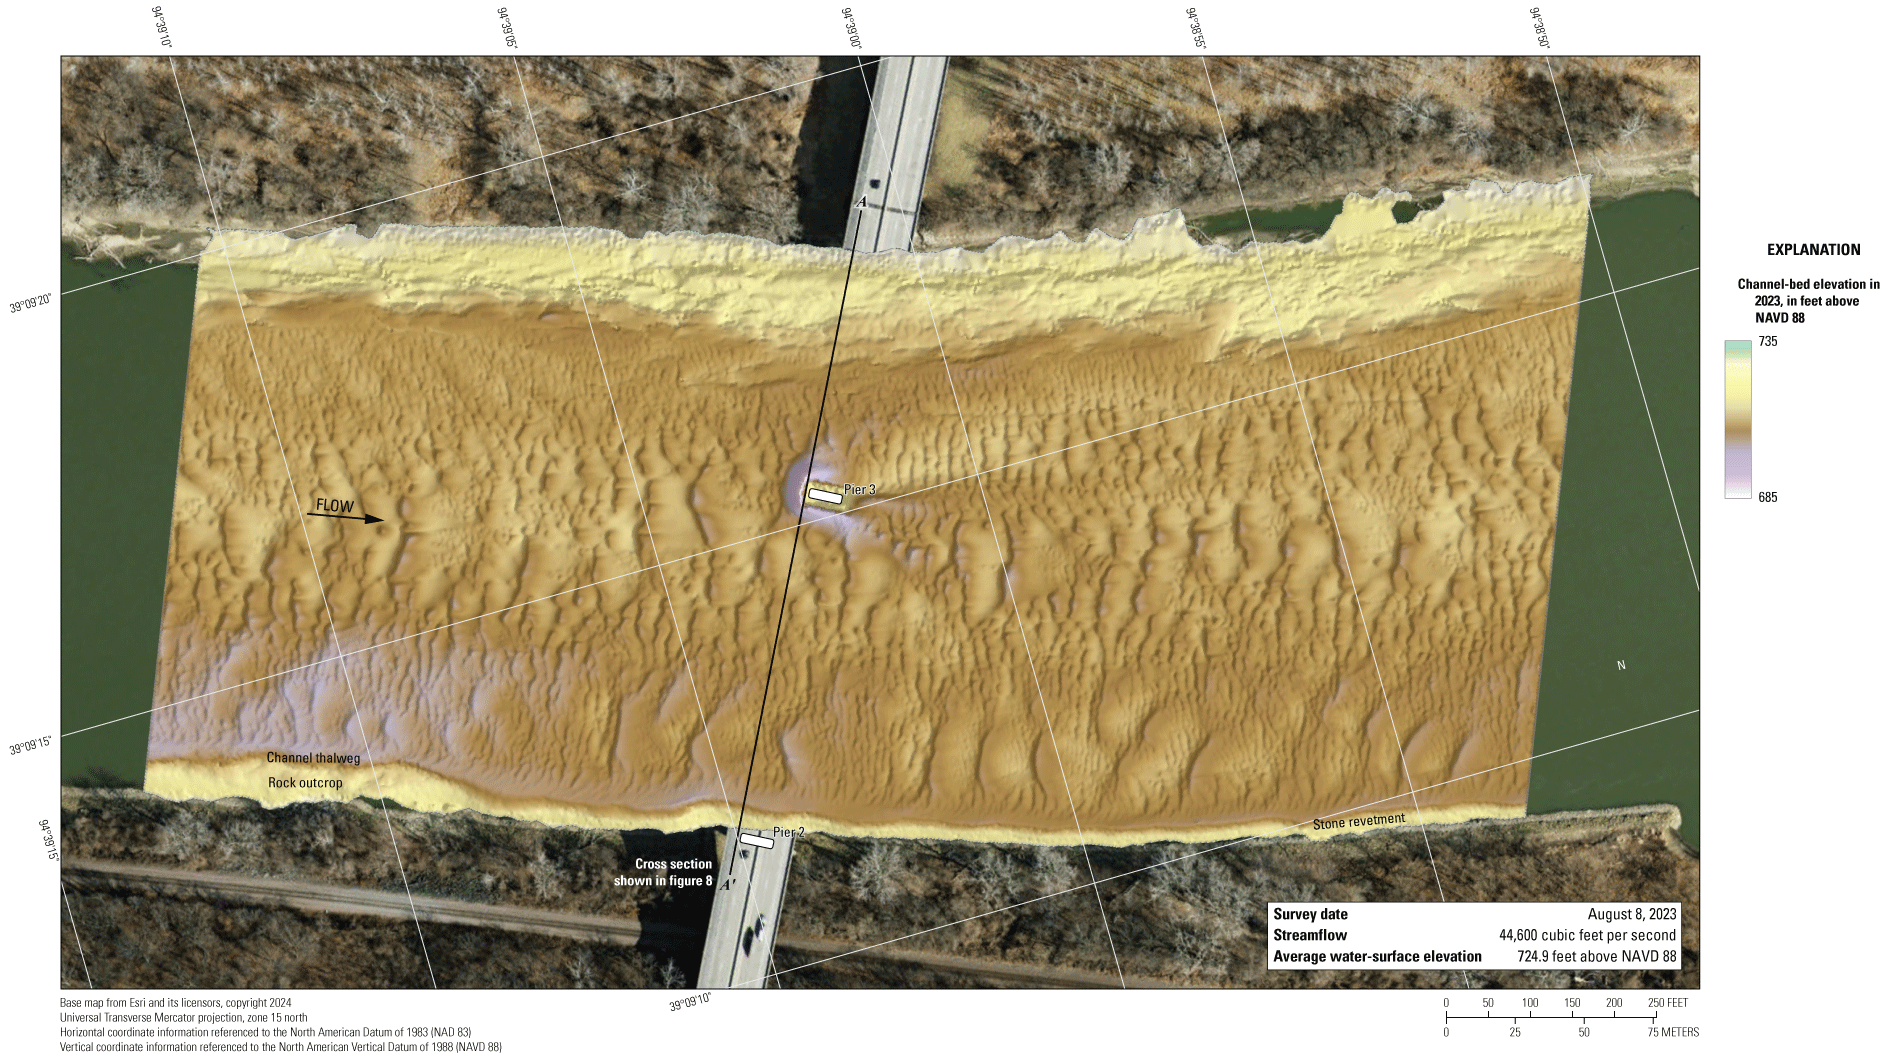
Map showing bathymetric survey of the Missouri River channel near structure A1800 on Interstate 635 in Kansas City, Missouri, on August 8, 2023. [NAVD 88, North American Vertical Datum of 1988]
The survey area was about 1,640 ft long and about 755 ft wide, extending across the active channel from bank to bank (fig. 6). The survey area extended about 770 ft upstream from the centerline of structure A1800. The channel-bed elevations in 2023 ranged from about 706 to 716 ft for most of the surveyed area (5 to 95 percentile range of the bathymetric data; fig. 7; table 5). A minor thalweg along the outside of the channel bend on the right (south) bank was about 7 ft deeper than the channel bed on the inside of the bend on the left (north) bank (fig. 6). The channel bed was covered with many small to medium dunes and ripples (fig. 6). As in previous surveys (Huizinga, 2010, 2012, 2016, 2022a), a rock outcrop and stone revetment were on the right (south) bank throughout the reach (fig. 6).
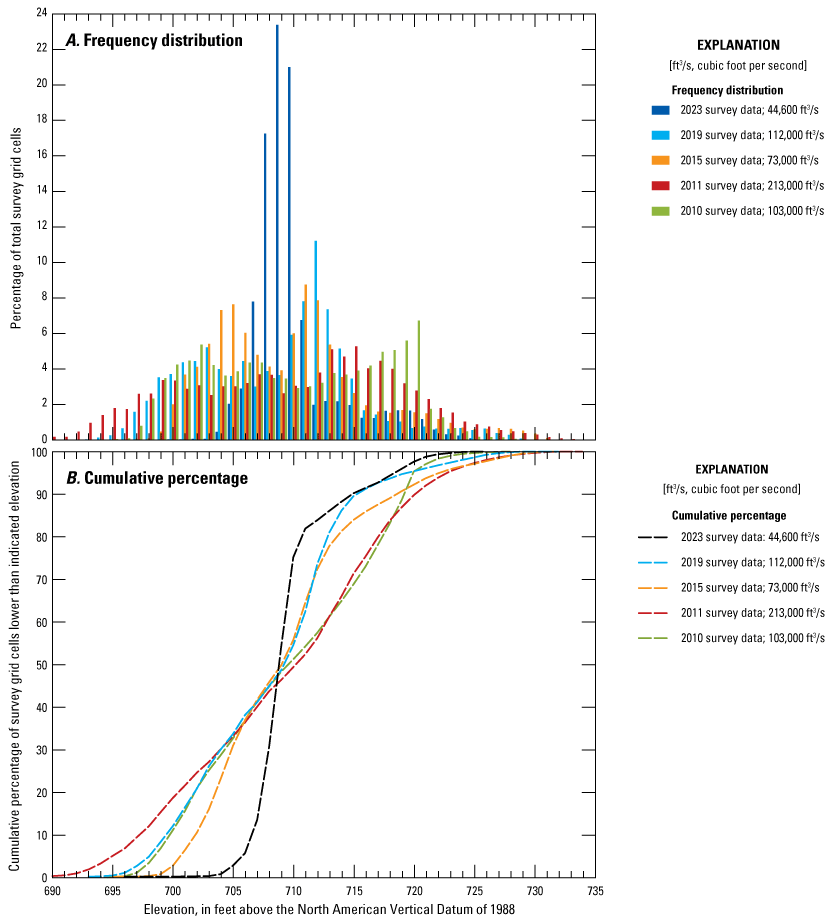
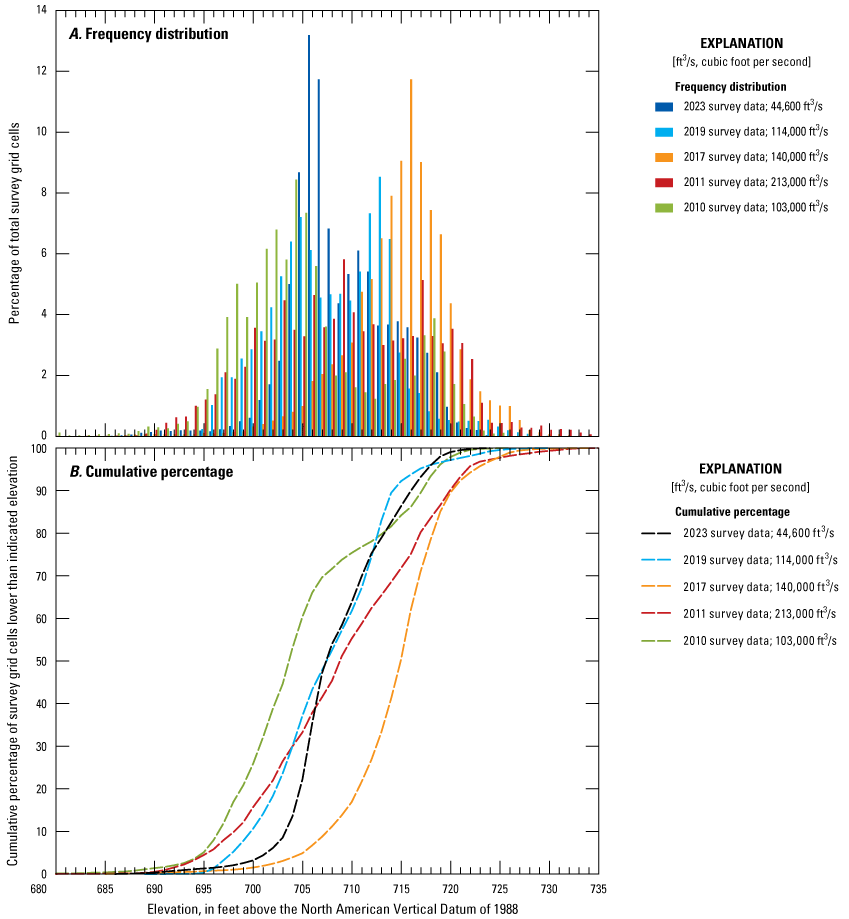
Graphs showing (A) frequency distribution and (B) cumulative percent of bed elevations for bathymetric survey-grid cells in 1-foot elevation bins from a survey on the Missouri River near structure A1800 on Interstate 635 in Kansas City, Missouri, on August 8, 2023, compared with previous surveys in 2010, 2011, 2015, and 2019 (Huizinga, 2010, 2012, 2016, and 2022a, respectively). [ft3/s, cubic foot per second]
The scour hole immediately upstream from main channel pier 3 had a minimum channel-bed elevation of about 695 ft (table 6; fig. 1.1), about 13 ft below the average channel-bed elevation (the value of the “depth of scour hole from upstream channel bed” in table 6; fig. 6) and about 7 ft below the elevation of the bottom of the pier seal course of 702.28 ft (fig. 8; table 6). Pier 3 is skewed about 15 degrees to approach flow (table 6), and impinging flow is on the right (south) side, resulting in a scour hole that is deeper and longer on that side. Information from bridge plans indicates that pier 3 is founded on shafts drilled 20 ft into bedrock, and about 43 ft of bed material are between the bottom of the scour hole and bedrock at the upstream face of pier 3 (fig. 8; table 6). The cross-section from the 2023 survey on the left side of the upstream bridge face was similar to but below most of the previous cross-sections; however, on the right side of the channel, the current (2023) cross-section was at higher elevation than most of the cross-sections from previous surveys (fig. 8).
Table 6.
Results from surveys near piers in the Missouri River near Kansas City, Missouri, August 8–9, 2023.[Data are summarized from Huizinga and Rivers (2025). Sites are shown on figure 1. All elevations are in feet above the North American Vertical Datum of 1988. MoDOT, Missouri Department of Transportation; --, not applicable]
| Bridge site number (fig. 1) | Structure number | MoDOT pier/bent number | Foundation information | Approximate flow angle of attack near pier/bent, in degrees | Approximate minimum elevation in scour hole near pier/benta, in feet | Approximate elevation of scour hole at upstream pier/bent face, in feet | Approximate elevation of bedrock near pier/bent, in feet | Approximate distance between bottom of scour hole and bedrock, in feet | Depth of scour hole from average upstream channel bed, in feet | |||
|---|---|---|---|---|---|---|---|---|---|---|---|---|
| Type | Width, in feet | Penetration into bedrock, in feet | Bottom of seal course elevation, in feet | |||||||||
| 6 | A1800 | 3 | Drilled shaft | 28 | 20 | 702.28 | 15 | 695.0 | 695 | 652 | 43 | 13 |
| 7 | A8340 | 5 | Drilled shaft | 10.5 | 23 | -- | 0 | 707.5 | 708 | 638 | 70 | 10 |
| 4 | Drilled shaft | 10.5 | 27.5 | -- | 5 | 696.2 | 696 | 638 | 58 | 10 | ||
| 3 | Drilled shaft | 10.5 | 23 | -- | 10 | 711.4 | 711 | 628 | 83 | 0 | ||
| 9 | A4060 | 4 | Drilled shaft | 28 | 20 | 696.26 | 0 | 697.2 | 697 | 665 | 32 | 11 |
| 5 | Drilled shaft | 28 | 20 | 696.26 | 5 | 692.8 | 693 | 667 | 26 | 11 | ||
| 6 | Drilled shaft | 34 | 20 | 696.26 | 0 | 689.8 | b690 | 670 | 20 | b9 | ||
| 10 | A7650 | Pylon | Drilled shaft | 46 | 32 | 699.50 | 15 | 678.6 | 685 | 647 | 32 | 14 |
| 11 | A5817 | 2 | Drilled shaft | 24 | 20 | 687.26 | 5 | 686.4 | c698 | 677 | 9 | c1 |
| 3 | Drilled shaft | 24 | 20 | 689.26 | 0 | 698.7 | 699 | 657 | 42 | 4 | ||
| 12 | A0767 | 7 | Drilled shaft | 32 | 20 | 689.26 | 0 | 681.8 | c682 | 660 | 22 | c15 |
| 8 | Drilled shaft | 28 | 20 | 689.26 | -- | 696.7 | (d) | 648 | 49 | (d) | ||
| 13 | A4757 | 2C | Drilled shaft | 35 | 20 | 666.26 | 25 | 671.3 | 671 | 619 | 52 | 16 |
| L0568 | 5 | Caisson | 20 | 2 | -- | 25 | 673.7 | b682 | 618 | 56 | b7 | |
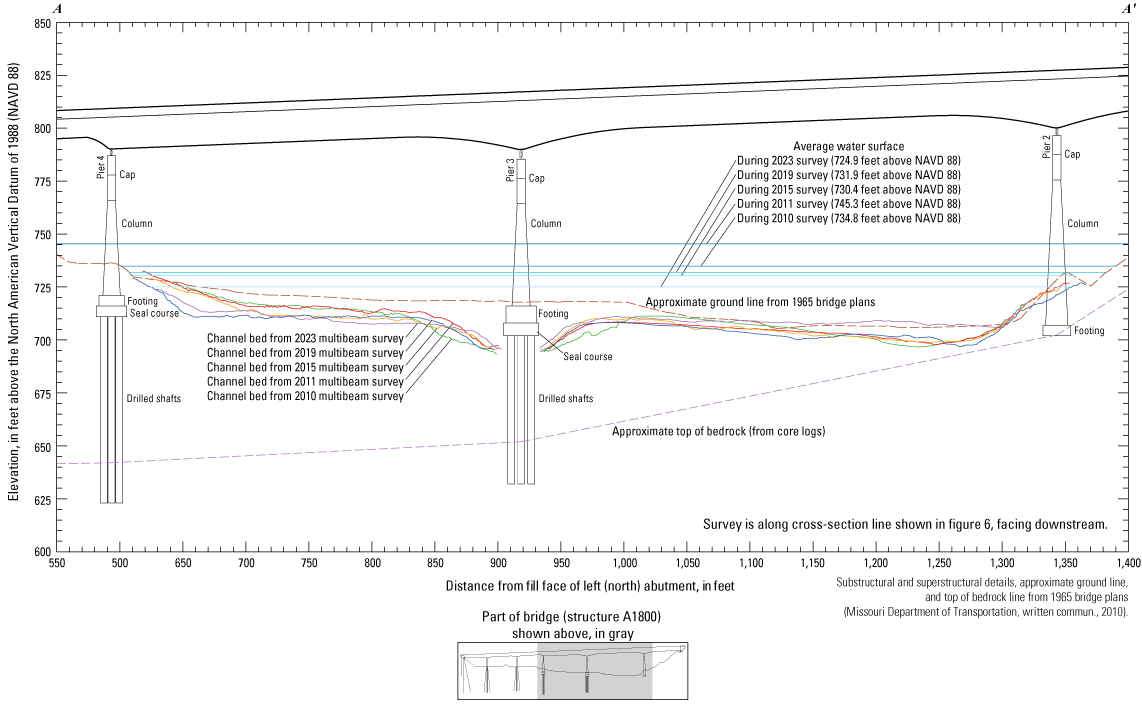
Diagram showing key features, substructural and superstructural details, and surveyed channel bed of structure A1800 on Interstate 635 crossing the Missouri River in Kansas City, Missouri.
The computed difference between the DEM from the survey on August 8, 2023, and the DEM from the previous survey on August 13, 2019, both with a probabilistic threshold mask of 95-percent confidence based on uncertainty (hereinafter, referred to simply as “the difference between the surveys”) (fig. 9), indicates that about 95 percent of the joint area of interest had change greater than the 95-percent confidence interval of uncertainty (hereinafter referred to as “detectable change”), which means only about 5 percent of the differences in the joint area of interest are equivocal and within the 95-percent confidence bounds of uncertainty of detectable change (hereinafter referred to as “within the bounds of uncertainty”; table 7). Deposition is dominant in the thalweg along the right (south) side of the channel and on the left (north) bank from 2019 to 2023 in the DoD (fig. 9); however, the left (north) side of the channel has some erosion between the left bank and pier 3 throughout the reach (fig. 9). The average difference between the bathymetric surfaces from the 2019 and 2023 surveys (the statistical mean value of the gridded raster difference surface [fig. 9]) was +2.36 ft (table 7), indicating substantial channel aggradation. The net volume of cut in the reach from 2019 to 2023 was about 31,700 cubic yards (yd3), and the net volume of fill was about 128,600 yd3, resulting in a net gain of about 96,900 yd3 of sediment between 2019 and 2023 (table 7). As indicated in the previous paragraph, the cross section from the 2023 survey done along the upstream bridge face is below the cross section from the 2019 survey on the left side of the channel, but is substantially higher than the cross section from the 2019 survey on the right side of the channel (fig. 8). The scour hole near pier 3 in 2023 was narrower and shallower than the scour hole from the 2019 survey, as indicated by the deposition near the pier. The frequency distribution of bed elevations in 2023 was narrower than other surveys, with a higher percentage of cells at a narrower range of channel-bed elevations than other surveys (fig. 7). The stone revetement on the right (south) bank showed consistent minor deposition, and the footing and seal course of pier 3 showed minor erosion on the left bank and deposition on the right bank (fig. 9); however, deposition or scour apparent on opposing faces of pier 3 and on the right bank are likely caused by minor horizontal positional variances in data points between the surveys (see “Uncertainty Estimation” section; fig. 5). The previous study (Huizinga, 2022a) had noted that the rock outcrop on the upstream right bank showed signs of nearly uniform minor scour between the 2019 survey and the previous survey in 2015, which may be a factor in the apparent deposition noted here. The erosion apparent on the upstream face of the pier is likely also the result of a minor positional variation in the 2023 survey.
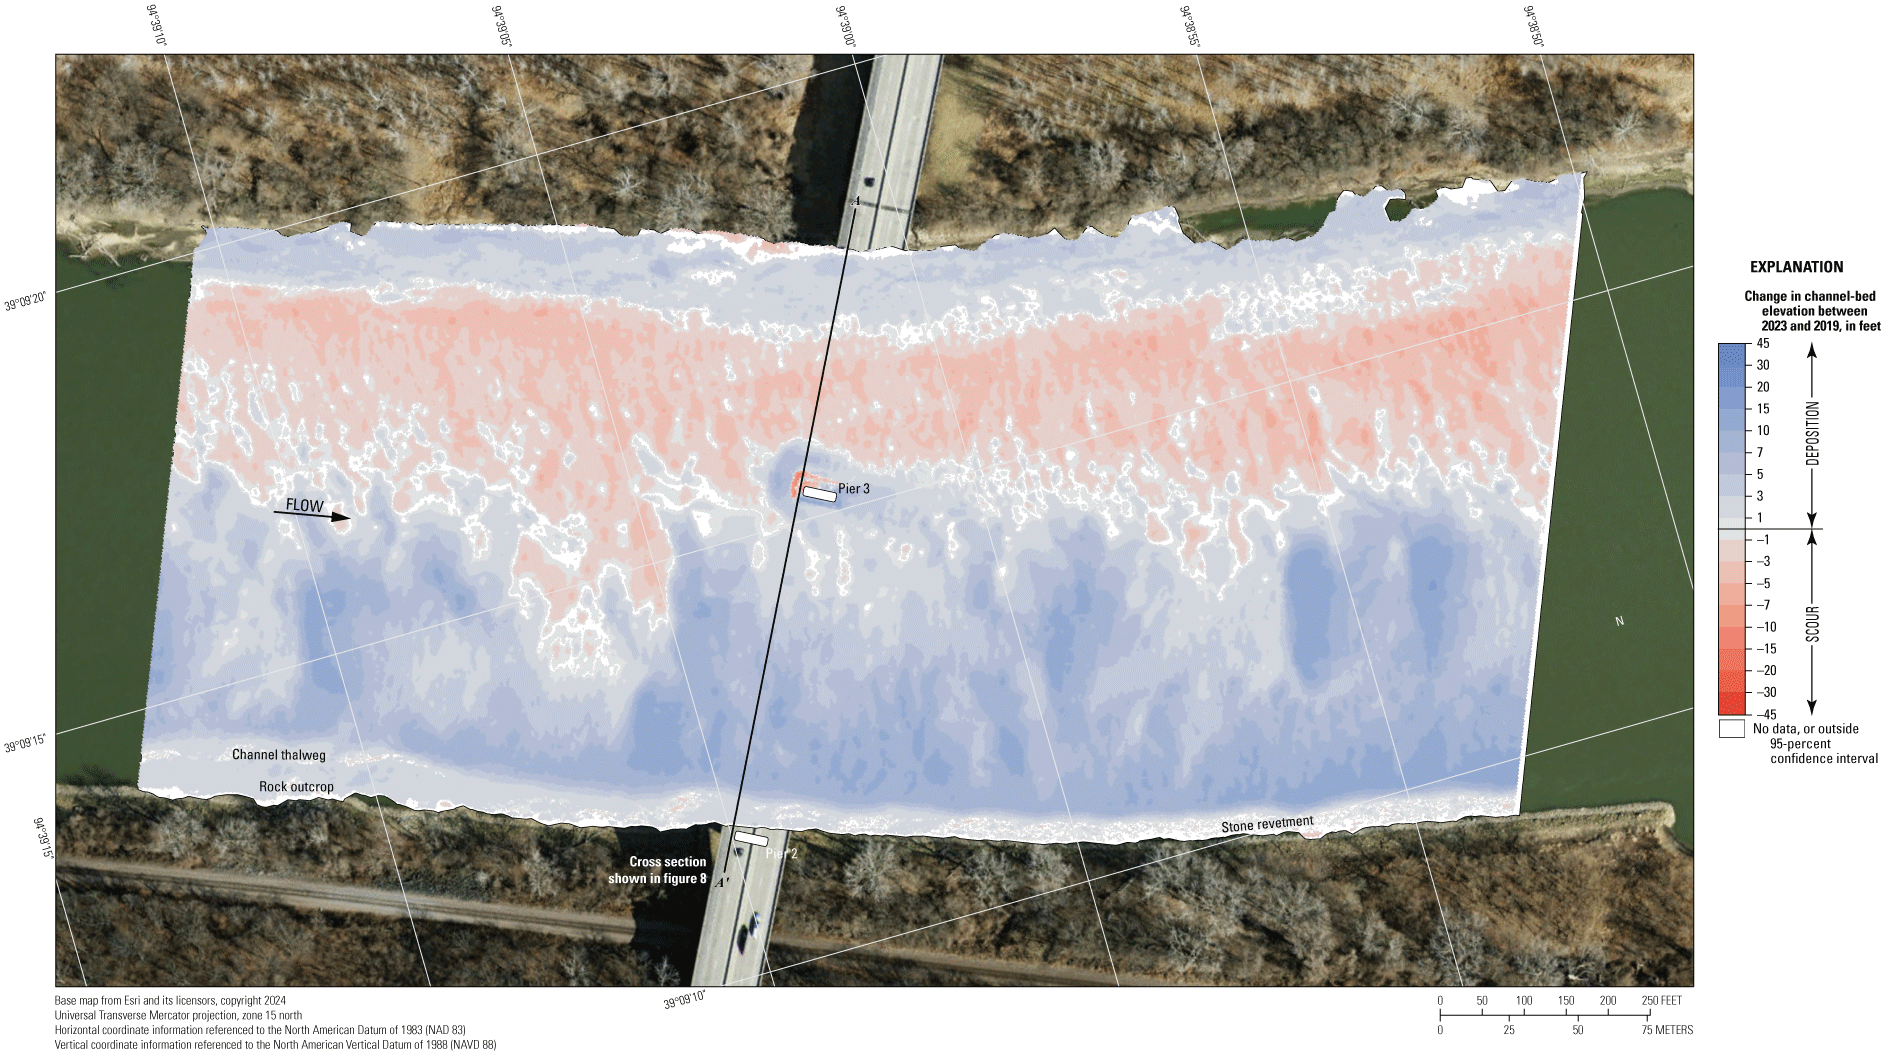
Map showing difference between surfaces created from bathymetric surveys of the Missouri River channel near structure A1800 on Interstate 635 in Kansas City, Missouri, on August 8, 2023, and August 13, 2019, with probabilistic thresholding.
Table 7.
Summary information and bathymetric surface difference statistics from surveys on the Missouri River near Kansas City, Missouri, from August 8–9, 2023, and previous surveys (Huizinga, 2010, 2012, 2016, 2020a, 2022a).[Dates are shown as month/day/year. All elevations are referenced to the North American Vertical Datum of 1988. MoDOT, Missouri Department of Transportation; min, minimum; max, maximum; A, Huizinga (2010); B, Huizinga (2012); C, Huizinga (2016); D, Huizinga (2020a); E, Huizinga (2022a)]
| Bridge site number (fig. 1) | MoDOT structure number | Previous survey | Difference between 2023 survey and previous surveya | Average water-surface elevation, in feet | Statistics of differences between 2023 bathymetric survey surface and previous bathymetric survey surface, in feet | Max surface difference near upstream pier face(s)c,d, in feet | Joint area of interest with detectable change, in percent | Net volume of cut, in cubic yards | Net volume of fill, in cubic yards | Net change in sediment volume, in cubic yards | ||||||||||
|---|---|---|---|---|---|---|---|---|---|---|---|---|---|---|---|---|---|---|---|---|
| Source of data | Date | Streamflow, in cubic feet per second | Surveyed area, in 1×10⁶ square feet | Average water-surface elevation, in feet | Streamflow, in cubic feet per second | Streamflow, in percent | Surveyed area, in 1×10⁶ square feet | Surveyed area, in percent | Minb,c | Maxb,c | Averagec | Standard deviation | ||||||||
| 6 | A1800 | A | 03/15/10 | e103,000 | 1.134 | 734.8 | −58,400 | −130.9 | 0.039 | 3.3 | −9.9 | −15.6 | 14.9 | −0.35 | 6.14 | 9.5 | 91 | 106,700 | 93,900 | −12,800 |
| B | 07/16/11 | 213,000 | 1.209 | 745.3 | −168,400 | −377.6 | −0.036 | −3.1 | −20.5 | −14.7 | 22.2 | +0.94 | 6.85 | 8.7 | 89 | 95,000 | 131,100 | 36,100 | ||
| C | 06/02/15 | 73,000 | 1.227 | 730.4 | −28,400 | −63.7 | −0.054 | −4.6 | −5.5 | −20.5 | 19.8 | +1.44 | 3.56 | 5.4 | 81 | 34,100 | 84,100 | 50,000 | ||
| E | 08/13/19 | 112,000 | 1.245 | 731.9 | −67,400 | −151.1 | −0.072 | −6.2 | −7.0 | −15.7 | 18.1 | +2.36 | 4.19 | 7.5 | 95 | 31,700 | 128,600 | 96,900 | ||
| 7 | A8340 | A | 03/15/10 | e103,000 | 1.165 | 733.7 | −58,400 | −130.9 | 0.128 | 9.9 | −10.4 | −16.6 | 40.4 | +3.17 | 5.79 | f31.6 | 91 | 41,400 | 152,200 | 110,800 |
| B | 07/16/11 | 213,000 | 1.326 | 743.9 | −168,400 | −377.6 | −0.034 | −2.6 | −20.6 | −36.3 | 35.2 | −0.39 | 6.73 | f26.2 | 88 | 108,200 | 93,200 | −15,000 | ||
| D | 05/22/17 | 140,000 | 1.351 | 736.9 | −95,400 | −213.9 | −0.058 | −4.5 | −13.6 | −23.9 | 26.0 | −0.35 | 3.92 | 2.0 | 88 | 66,500 | 52,400 | −14,100 | ||
| E | 08/13/19 | 114,000 | 1.338 | 730.6 | −69,400 | −155.6 | −0.045 | −3.5 | −7.3 | −27.7 | 21.0 | +1.45 | 4.40 | 6.7 | 96 | 48,000 | 112,500 | 64,500 | ||
| 9 | A4060 | A | 03/16/10 | 126,000 | 1.492 | 727.1 | −79,600 | −171.6 | −0.210 | −16.4 | −10.9 | −33.4 | 18.6 | +1.13 | 4.71 | 5.7 | 86 | 56,400 | 100,900 | 44,500 |
| B | 07/17/11 | 217,000 | 1.434 | 737.1 | −170,600 | −367.7 | −0.152 | −11.8 | −20.9 | −35.5 | 22.1 | −1.25 | 5.27 | 7.2 | 80 | 101,500 | 54,500 | −47,000 | ||
| C | 06/03/15 | 93,900 | 1.389 | 723.7 | −47,500 | −102.4 | −0.107 | −8.3 | −7.5 | −42.1 | 23.0 | +0.24 | 3.59 | −6.8 | 73 | 44,600 | 52,700 | 8,100 | ||
| E | 08/13/19 | 126,000 | 1.507 | 728.2 | −79,600 | −171.6 | −0.224 | −17.5 | −12.0 | −30.5 | 22.7 | +2.45 | 4.20 | 5.3 | 95 | 34,700 | 145,100 | 110,400 | ||
| 10 | A7650 | B | 07/17/11 | 217,000 | 1.372 | 736.4 | −170,800 | −369.7 | −0.028 | −2.1 | −21.1 | −22.4 | 24.6 | +3.18 | 4.45 | −1.8 | 85 | 28,600 | 154,800 | 126,200 |
| C | 06/03/15 | 97,100 | 1.318 | 723.1 | −50,900 | −110.2 | 0.026 | 1.9 | −7.7 | −37.1 | 26.8 | +1.06 | 4.49 | −1.8 | 78 | 42,700 | 81,600 | 38,900 | ||
| E | 08/14/19 | 142,000 | 1.321 | 728.2 | −95,800 | −207.4 | 0.023 | 1.7 | −12.8 | −33.1 | 35.6 | +3.68 | 4.78 | −2.0 | 94 | 18,600 | 189,100 | 170,500 | ||
| 11 | A5817 | A | 03/17/10 | 124,000 | 1.666 | 724.1 | −77,300 | −165.5 | −0.232 | −16.2 | −10.7 | −14.3 | 14.3 | −1.45 | 3.64 | 13.3 | 73 | 90,600 | 35,600 | −55,000 |
| B | 07/18/11 | 212,000 | 1.609 | 733.7 | −165,300 | −354.0 | −0.175 | −12.2 | −20.4 | −20.7 | 9.4 | −5.19 | 3.03 | −11.1 | 88 | 245,100 | 5,700 | −239,400 | ||
| C | 06/03/15 | 103,000 | 1.572 | 721.9 | −56,300 | −120.6 | −0.138 | −9.7 | −8.6 | −15.3 | 14.8 | −1.88 | 2.60 | 5.8 | 79 | 93,500 | 16,600 | −77,000 | ||
| E | 08/14/19 | 142,000 | 1.644 | 726.5 | −95,300 | −204.1 | −0.210 | −14.6 | −13.2 | −16.8 | 16.2 | +0.07 | 2.34 | 10.3 | 91 | 44,100 | 47,600 | 3,500 | ||
| 12 | A0767 | A | 03/17/10 | 123,000 | 1.540 | 722.5 | −76,500 | −164.5 | −0.207 | −15.5 | −11.1 | −12.3 | 27.7 | +0.73 | 4.32 | −3.0 | 76 | 52,500 | 79,100 | 26,600 |
| B | 07/18/11 | 212,000 | 1.540 | 732.3 | −165,500 | −355.9 | −0.207 | −15.5 | −20.9 | −18.4 | 29.7 | +2.66 | 5.57 | 6.1 | 82 | 43,800 | 148,700 | 104,900 | ||
| C | 06/04/15 | 119,000 | 1.464 | 721.6 | −72,500 | −155.9 | −0.131 | −9.8 | −10.2 | −16.1 | 28.6 | +0.88 | 3.59 | −3.5 | 79 | 41,300 | 75,200 | 33,900 | ||
| E | 08/14/19 | 139,000 | 1.527 | 725.1 | −92,500 | −198.9 | −0.194 | −14.6 | −13.7 | −14.2 | 40.2 | +4.16 | 4.78 | −5.2 | 95 | 14,200 | 207,000 | 192,800 | ||
| 13 | A4757/L0568 | A | 03/18/10 | 120,000 | 1.455 | 717.2 | −73,400 | −157.5 | −0.166 | −12.9 | −11.6 | −15.7 | 23.0 | +0.24 | 5.42 | 10.7 | 87 | 94,500 | 104,200 | 9,700 |
| B | 07/19/11 | 212,000 | 1.359 | 726.7 | −165,400 | −354.9 | −0.070 | −5.4 | −21.1 | −17.5 | 26.9 | +2.86 | 6.11 | 13.1 | 90 | 63,000 | 185,100 | 122,100 | ||
| C | 06/04/15 | 112,000 | 1.401 | 715.9 | −65,400 | −140.3 | −0.112 | −8.7 | −10.3 | −27.5 | 23.9 | +1.34 | 3.47 | 7.2 | 79 | 33,700 | 84,100 | 50,400 | ||
| E | 08/14/19 | 141,000 | 1.408 | 720.1 | −94,400 | −202.6 | −0.119 | −9.2 | −14.5 | −24.7 | 27.5 | +2.59 | 2.96 | 8.6 | 91 | 11,300 | 123,000 | 111,700 | ||
A positive value of difference means the 2023 value was larger than the previous value, whereas a negative value means the 2023 value was smaller than the previous value.
The maximum or minimum value of change is measured near a vertical pier face and likely affected by minor positional variances.
The measurement for the maximum surface difference near the upstream pier face was taken near the location of the “approximate elevation of scour hole at upstream pier face” in table 6.
This streamflow is the value reported for the streamgage at St. Joseph, Missouri, for March 14, 2010, and does not match the value reported for this bridge site in Huizinga (2010). The value reported in Huizinga (2010) for this bridge site was for March 15, 2010, at the streamgage at Kansas City, which includes inflow from the Kansas River and, therefore, would be higher than the streamflow that would have been measured at this bridge site upstream from the confluence. Therefore, the streamflow value from March 14, 2010, at the St. Joseph streamgage was used to account for the time of travel of the river between St. Joseph and Kansas City.
The difference between the surveys from August 8, 2023, and June 2, 2015, (fig. 10), indicated about 81 percent of the joint area of interest had detectable change, which means about 19 percent of the differences in the joint area of interest are equivocal and within the bounds of uncertainty (table 7). Deposition appears more dominant throughout most of the reach between 2015 and 2023 in the DoD, albeit with some erosion along the left (north) side (fig. 10). The average difference between the bathymetric surfaces was +1.44 ft (table 7), indicating moderate overall channel aggradation between the 2015 and 2023 surveys. The net volume of cut between 2015 and 2023 was about 34,100 yd3, and the net volume of fill was about 84,100 yd3, resulting in a net gain of about 50,000 yd3 of sediment between 2015 and 2023 (table 7). The stone revetment and rock outcrop on the right (south) bank has minor localized areas of erosion and deposition in the 2023 survey, but most of the differences are within the bounds of uncertainty (fig. 10). The scour hole near pier 3 was narrower and shallower in the 2023 survey than in the 2015 survey, as indicated by the deposition near the pier. As with the previous DoD, deposition or scour apparent on opposing sides of pier 3 and its upstream face was likely caused by minor horizontal positional variances between the surveys (see “Uncertainty Estimation” section; fig. 5).
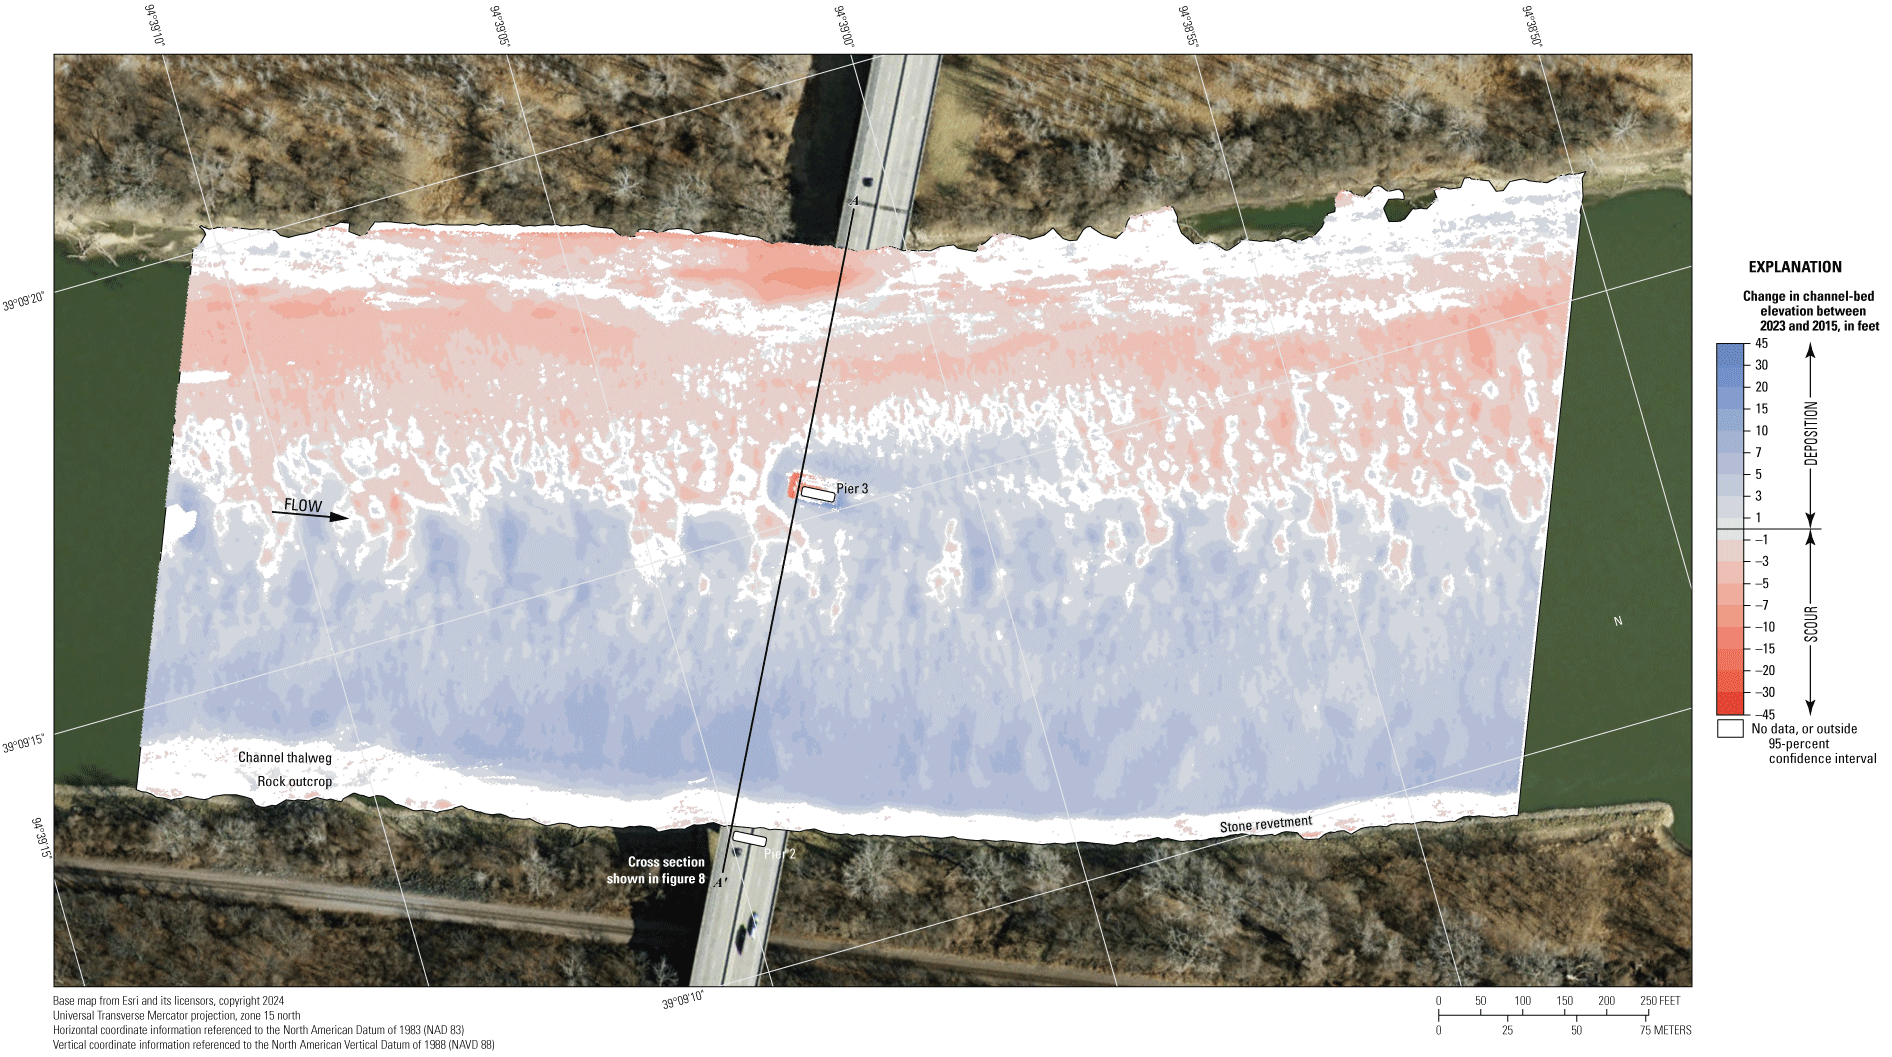
Map showing difference between surfaces created from bathymetric surveys of the Missouri River channel near structure A1800 on Interstate 635 in Kansas City, Missouri, on August 8, 2023, and June 2, 2015, with probabilistic thresholding.
The difference between the surveys on August 8, 2023, and during flooding on July 16, 2011 (fig. 11), indicates about 89 percent of the joint area of interest had detectable change, which means only about 11 percent of the differences in the joint area of interest are equivocal and within the bounds of uncertainty (table 7). Scour and deposition appear roughly balanced throughout most of the reach between 2011 and 2023 in the DoD, with erosion along the left (north) bank and deposition along the right bank (south) side (fig. 11). The average difference between the bathymetric surfaces from the 2011 and 2023 surveys was +0.94 ft (table 7), indicating minor channel aggradation. The net gain of sediment in the reach between 2011 and 2023 was about 36,100 yd3, which substantiates the rough balance of erosion and deposition in the reach (table 7). The cross section from the 2023 survey along the upstream face of the bridge varies from 5 to 15 ft below the 2011 cross section on the left side and 5 to 20 ft above the 2011 cross section on the right side (fig. 8). The frequency distribution of bed elevations in the 2011 survey is somewhat unique compared with distributions from other years at this site; the bed elevations from the 2011 survey had more grid cells at a much wider range of channel-bed elevations than the other surveys (fig. 7). Again, the stone revetment and rock outcrop on the right (south) bank has minor localized areas of erosion and deposition in the 2023 survey, but many of the differences are within the bounds of uncertainty (fig. 11). Similarly, the scour hole near pier 3 was narrower and shallower in the 2023 survey than it was in the 2011 survey, as indicated by the deposition near the pier. As with the previous DoDs, deposition or scour apparent on opposing sides of pier 3 and its upstream face are likely caused by minor horizontal positional variances between the surveys (see “Uncertainty Estimation” section; fig. 5).
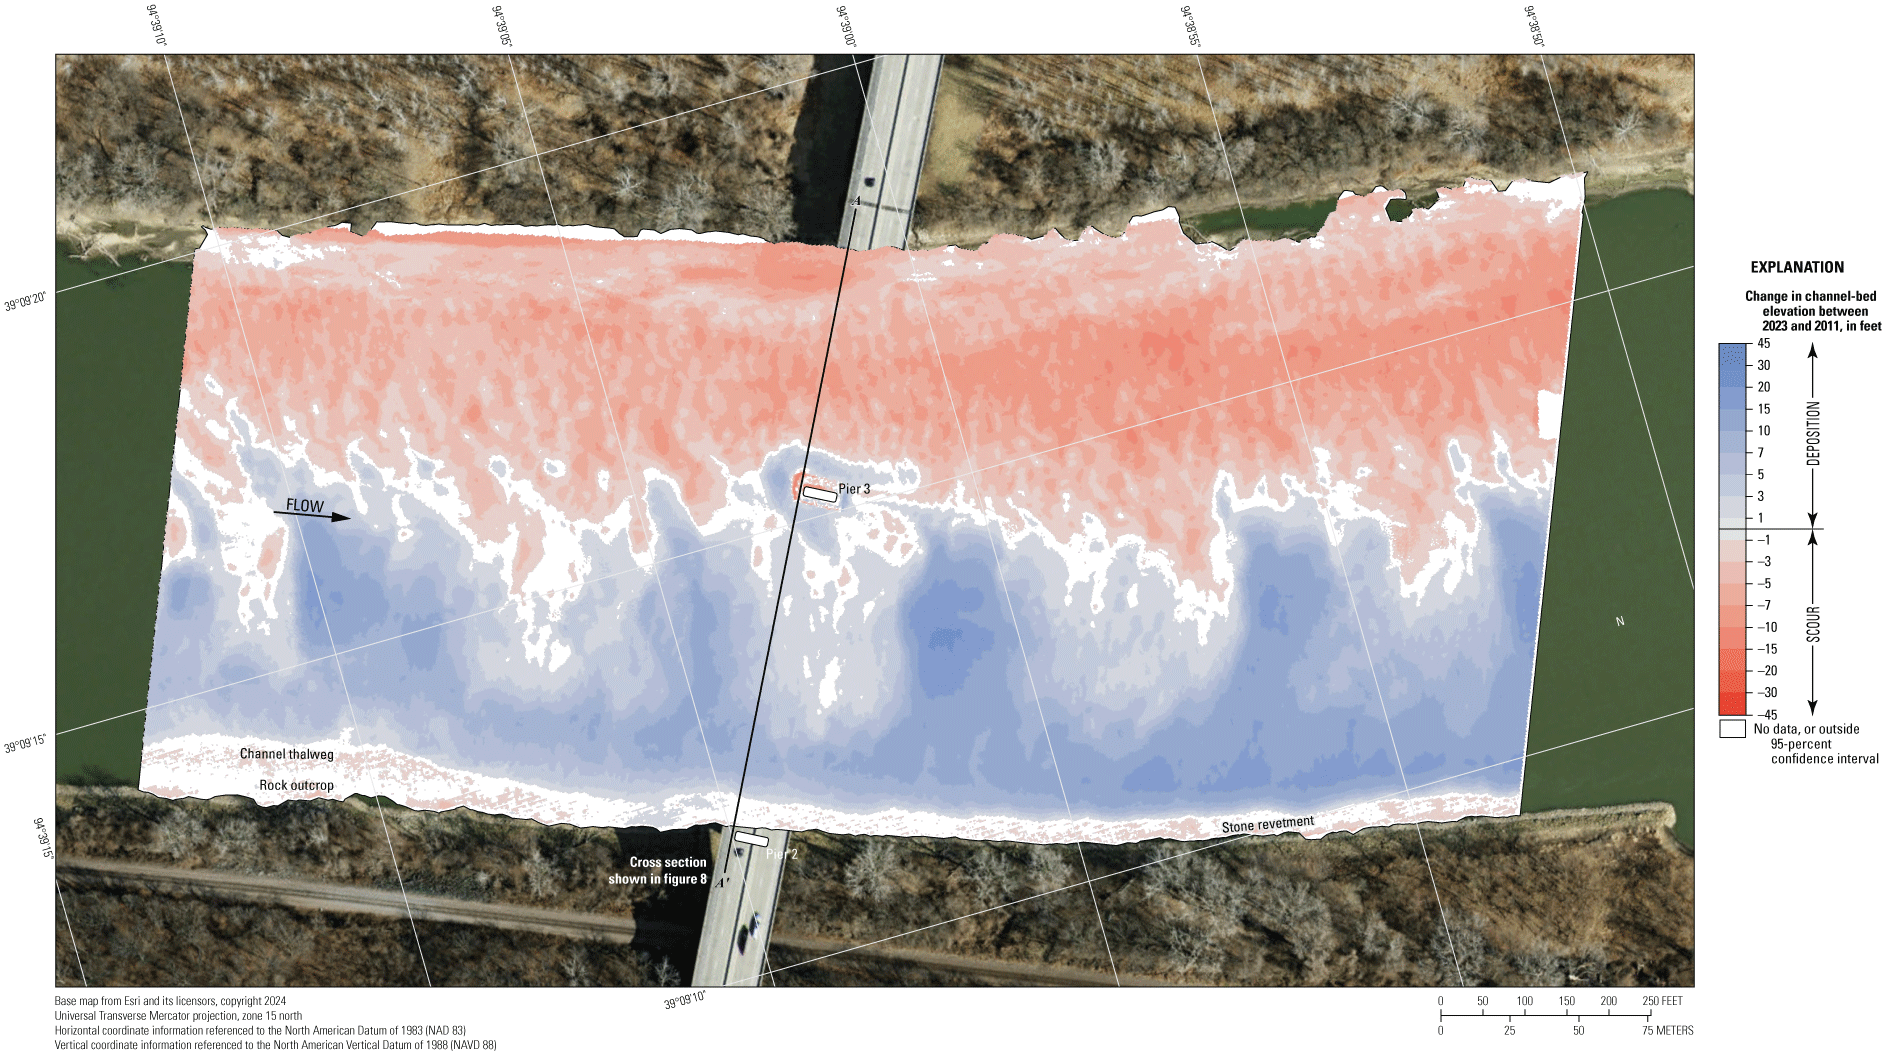
Map showing difference between surfaces created from bathymetric surveys of the Missouri River channel near structure A1800 on Interstate 635 in Kansas City, Missouri, on August 8, 2023, and July 16, 2011, with probabilistic thresholding.
The difference between the surveys on August 8, 2023, and the earliest on March 15, 2010 (fig. 12), indicates that about 91 percent of the joint area of interest had detectable change, which means that only about 9 percent of the differences in the joint area of interest are equivocal and within the bounds of uncertainty (table 7). Like 2011, scour and deposition appear roughly balanced throughout most of the reach between 2010 and 2023 in the DoD, with erosion along the left (north) bank and deposition along the right (south) bank (fig. 12). The average difference between the bathymetric surfaces for survey years was –0.35 ft (table 7), indicating minor channel degradation between the 2010 and 2023 surveys. The net loss of sediment from the reach between 2010 and 2023 was about 12,800 yd3, which again substantiates the rough balance of erosion and deposition in the reach (table 7). The cross section from the 2010 survey along the upstream face of the bridge is generally like the 2011 survey section, resulting in similar differences with the 2023 survey section (fig. 8). Furthermore, the frequency distribution of bed elevations in 2010 is like the 2011 distributions at this site (fig. 7). The stone revetment and rock outcrop on the right (south) bank has substantial areas of moderate erosion (fig. 12), which indicates the revetment may have slumped somewhat between the 2010 and 2011 surveys. As in all the previous comparisons, the scour hole near pier 3 was narrower and shallower than it was in the 2010 survey, as indicated by the deposition near the pier. Furthermore, the location of pier 3 in the 2010 survey appears to have a moderate overall positional difference, resulting in substantial apparent erosion on the left (north) side of the pier (see “Uncertainty Estimation” section; fig. 5).
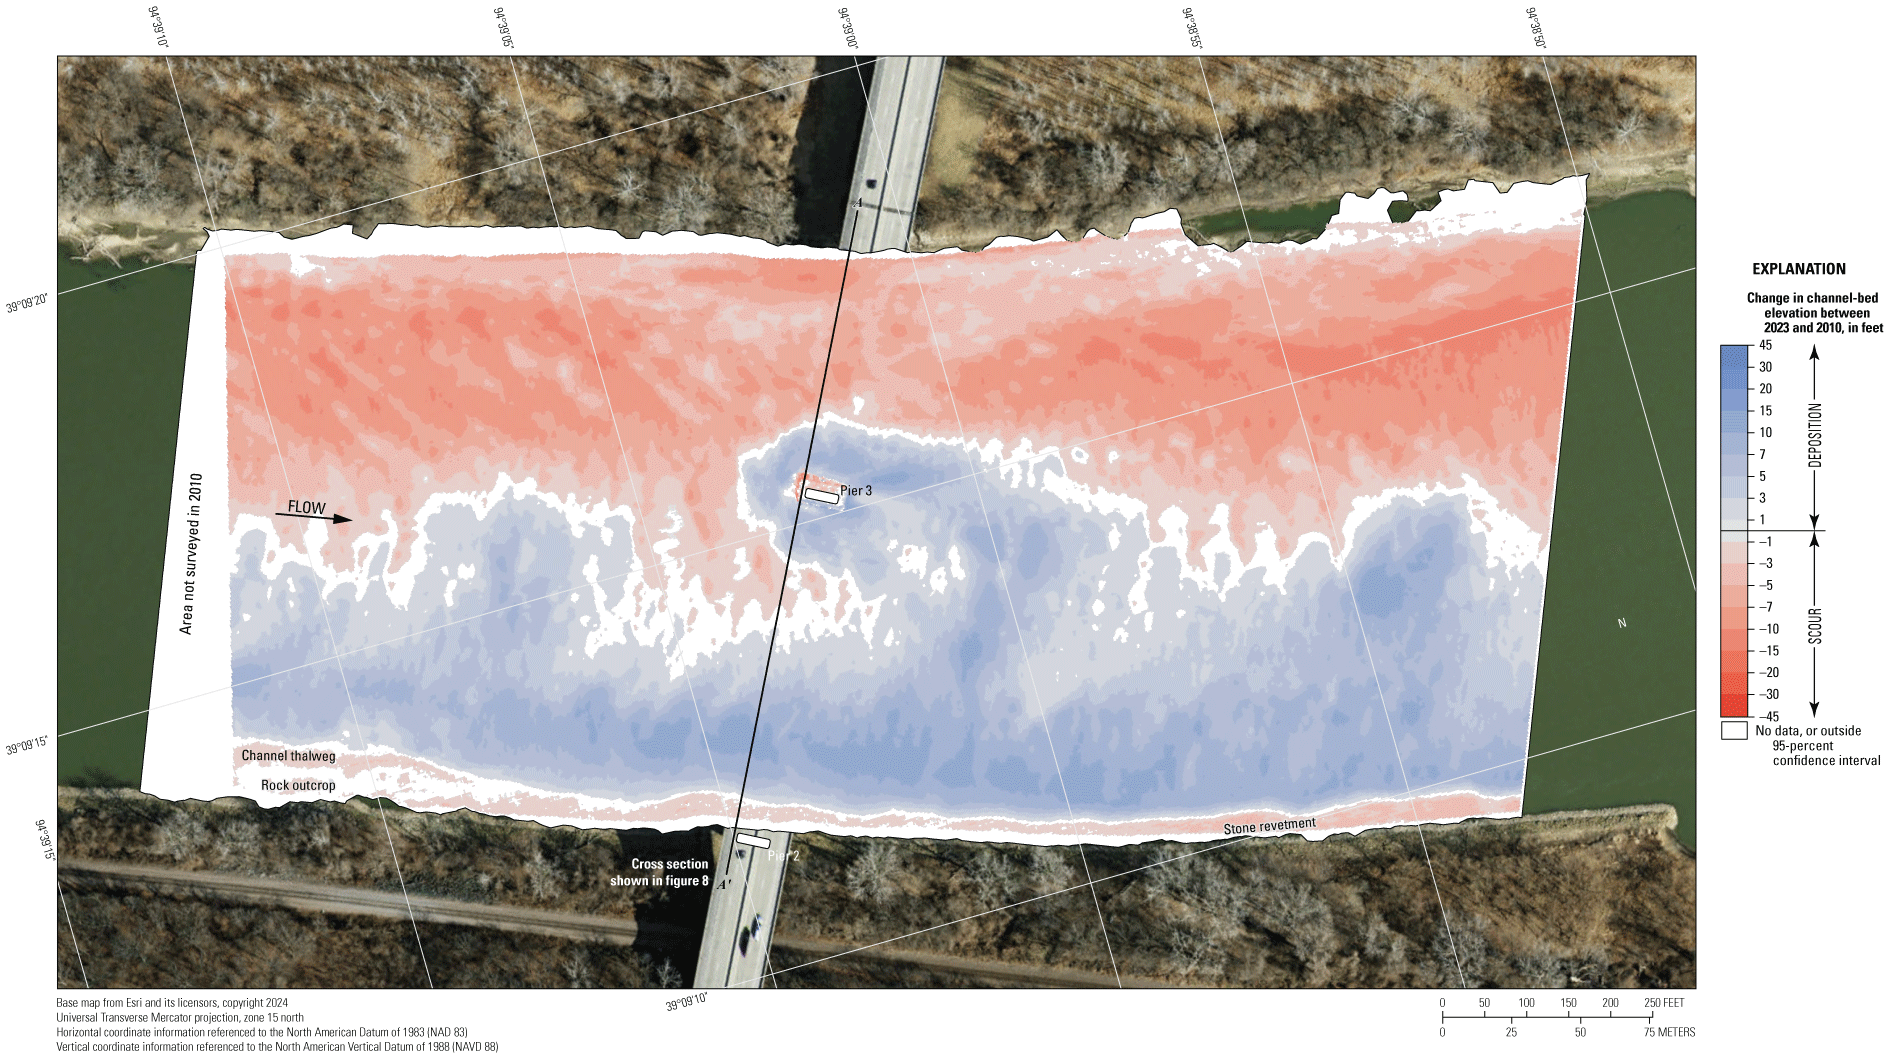
Map showing difference between surfaces created from bathymetric surveys of the Missouri River channel near structure A1800 on Interstate 635 in Kansas City, Missouri, on August 8, 2023, and March 15, 2010, with probabilistic thresholding.
The vertically averaged velocity vectors indicate mostly uniform flow throughout the reach, with velocities ranging from about 3 to 7 feet per second (ft/s; fig. 13). The wake vortices downstream from pier 3 were not pronounced and seemed to be no greater than the general nonuniformity of flow observed in the channel (fig. 13). All sections had minor localized turbulence (fig. 13).
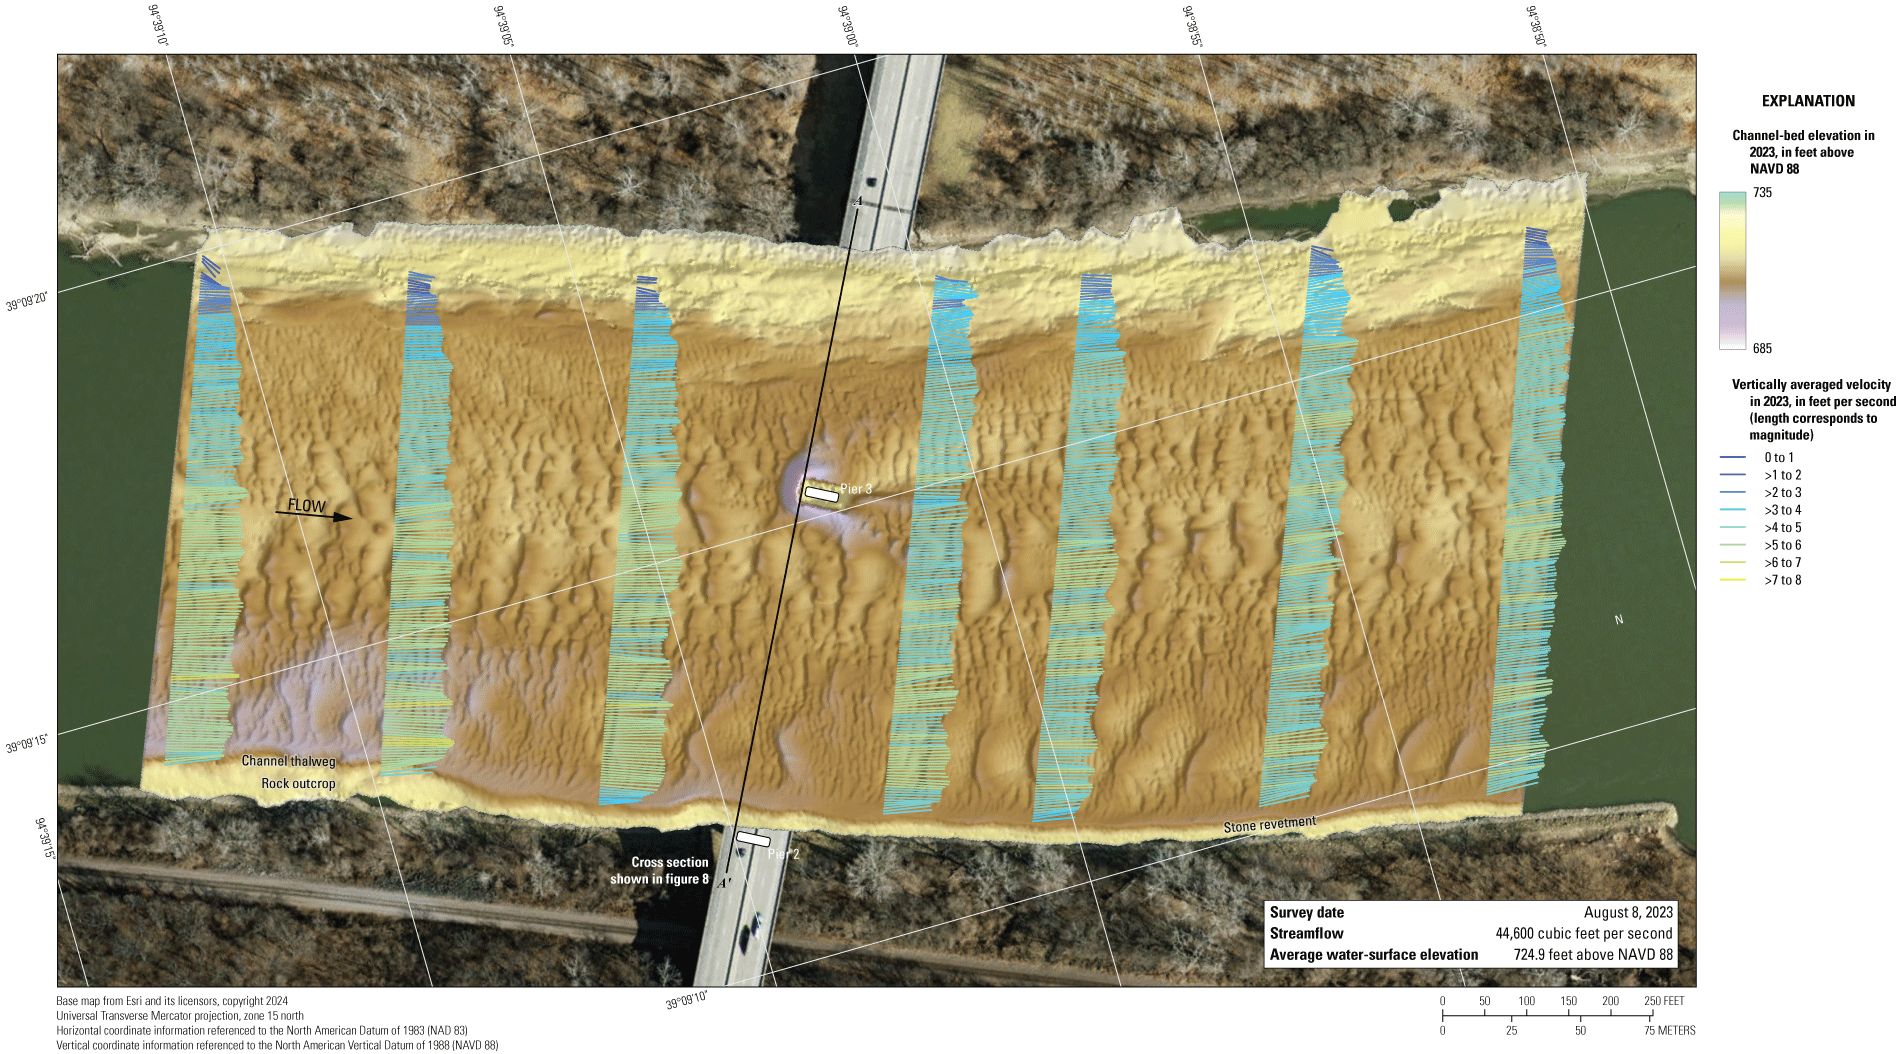
Map showing bathymetry and vertically averaged velocities of the Missouri River channel near structure A1800 on Interstate 635 in Kansas City, Missouri. [NAVD 88, North American Vertical Datum of 1988; >, greater than]
Structure A8340 on U.S. Highway 69
Structure A8340 (site 7; table 2) on U.S. Highway 69 crosses the Missouri River at RM 372.6, on the northwestern side of Kansas City (fig. 1). The site was surveyed on August 8, 2023, and the average water-surface elevation of the river in the survey area, determined by the RTK GNSS tide solution, was 723.3 ft (table 5; fig. 14), and streamflow was about 44,600 ft3/s during the survey (table 5).
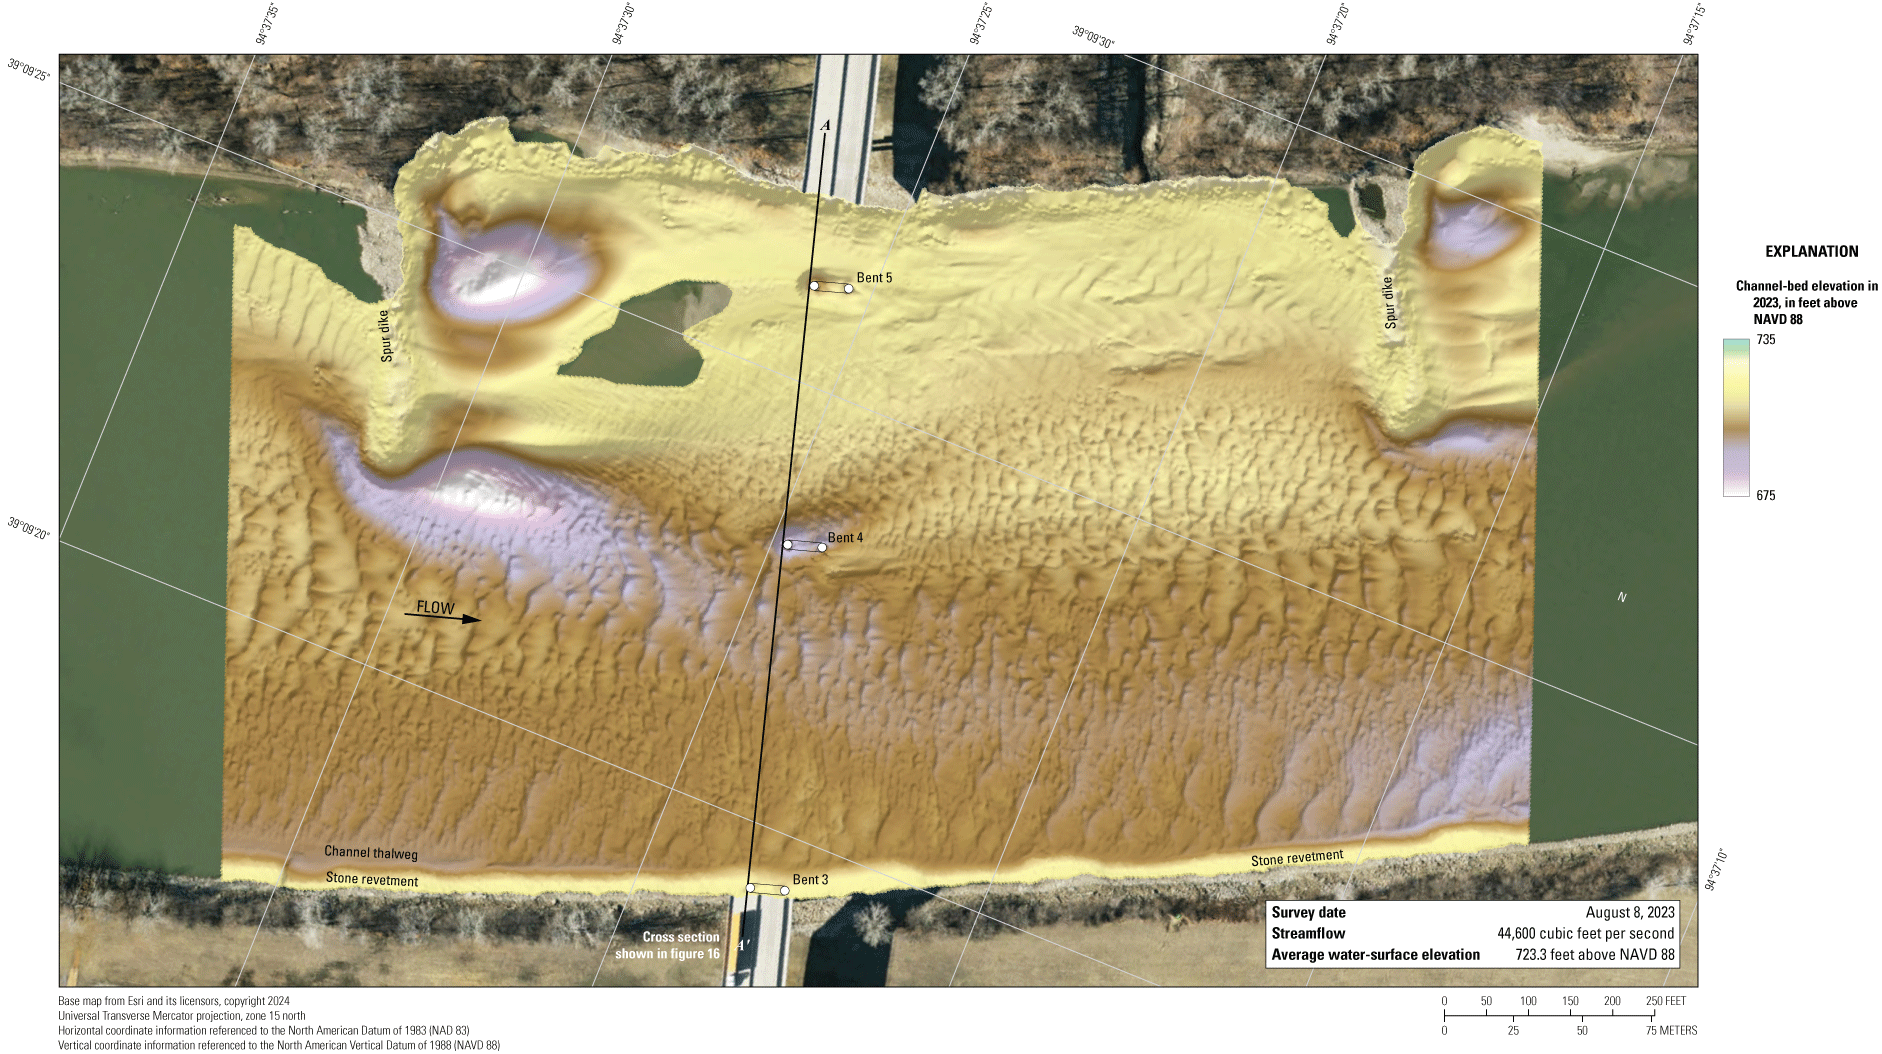
Map showing bathymetric survey of the Missouri River channel near structure A8340 on U.S. Highway 69 in Kansas City, Missouri, on August 8, 2023. [NAVD 88, North American Vertical Datum of 1988]
The survey area was about 1,550 ft long and about 875 ft wide, extending from bank to bank in the main channel except for a shallow area downstream from the spur dike on the upstream left (north) side (fig. 14). The survey area extended about 680 ft upstream from the centerline of structure A8340 (fig. 14). The channel-bed elevations in 2023 ranged from about 701to 717 ft throughout the survey area (5 to 95 percentile range of the bathymetric data; fig. 15), except near the spur dikes on the left (north) bank (fig. 14; table 5). There was a poorly defined thalweg along the toe of the right (south) bank, which was about 5 to 8 ft deeper than the channel bed in the middle of the river, and the channel was filled with small dunes and ripples (fig. 14). As in previous surveys (Huizinga, 2010, 2012, 2020a, 2022a), a stone revetment was on the right (south) bank throughout the reach, and two spur dikes were on the left (north) bank (fig. 14). Substantial scour holes were downstream from and near the tip of the upstream spur dike on the left bank. The scour hole downstream from the spur dike had the minimum channel-bed elevation of about 685 ft (table 5; fig. 14).
Graphs showing (A) frequency distribution and (B) cumulative percent of bed elevations for bathymetric survey grid cells in 1-foot elevation bins from a survey on the Missouri River near structure A8340 on U.S. Highway 69 in Kansas City, Missouri, on August 8, 2023, compared with previous surveys in 2010, 2011, 2017, and 2019 (Huizinga, 2010, 2012, 2020a, and 2022a, respectively).
A local scour hole near bent 4 had an approximate minimum channel-bed elevation of about 696 ft, about 10 ft below the average channel bed immediately upstream from the bent (fig. 14; table 6). A local scour hole near bent 5 had a minimum elevation of 708 ft, also about 10 ft below the average channel bed elevation immediately upstream from the pier (fig. 14; table 6). Bent 3 is surrounded by the rock revetment on the right (south) bank, with no scour hole evident nearby (fig. 14; table 6). Information from bridge plans indicates that all the main channel bents of structure A8340 are shafts drilled about 23 to 28 ft into bedrock and have about 58 ft of bed material between the bottom of the scour hole and bedrock at bent 4 (fig. 16; table 6); bents 5 and 3 have about 70 and 83 ft of bed material between the bottom of the scour hole and bedrock, respectively (fig. 16; table 6).
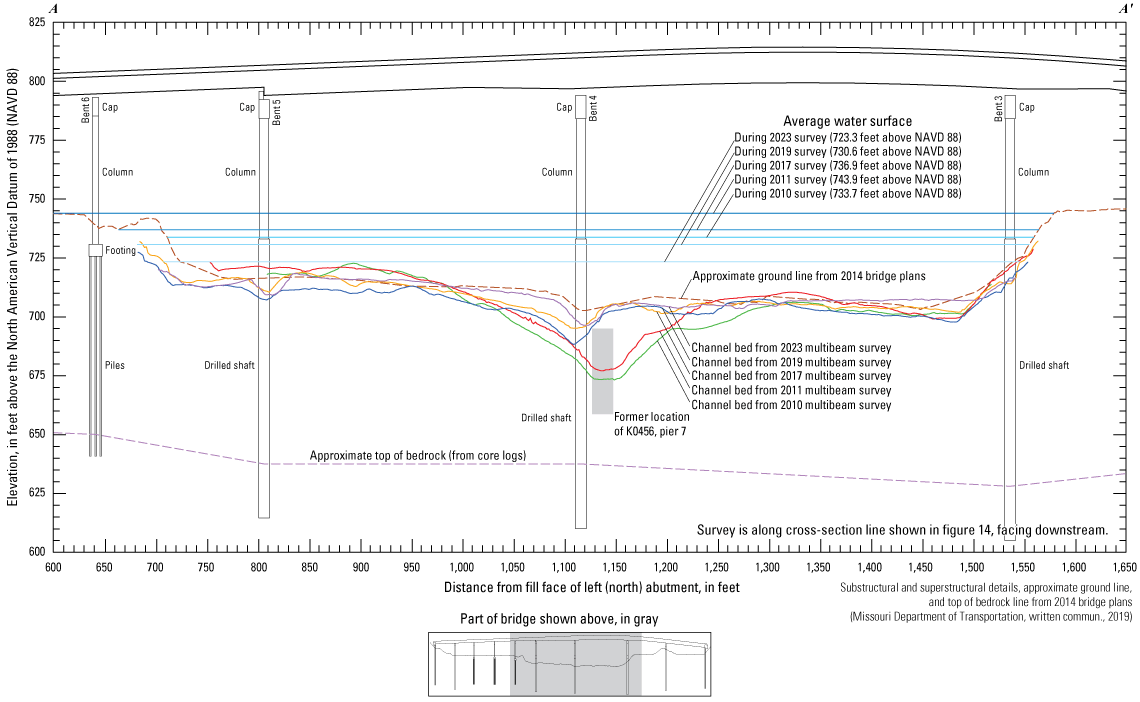
Diagram showing key features, substructural and superstructural details, and surveyed channel bed of structure A8340 on U.S. Highway 69 crossing the Missouri River in Kansas City, Missouri. [NAVD 88, North American Vertical Datum of 1988]
The difference between the surveys on August 8, 2023, and August 13, 2019 (fig. 17), indicates about 96 percent of the joint area of interest had detectable change, which means only about 4 percent of the differences in the joint area of interest are equivocal and within the bounds of uncertainty (table 7). Deposition appears dominant throughout the reach between 2019 and 2023 in the DoD, except in localized areas of substantial erosion near the ends and downstream from the spur dikes on the left (north) bank (fig. 17). The average difference between the bathymetric surfaces was +1.45 ft (table 7), indicating moderate channel aggradation between the 2019 and 2023 surveys. The net volume of cut in the reach from 2019 to 2023 was about 48,000 yd3, and the net volume of fill was about 112,500 yd3, resulting in a net gain of about 64,500 yd3 of sediment between 2019 and 2023 (table 7). The cross section from the upstream face of the bridge from the 2023 survey is like but above the cross section from the 2019 survey section (fig. 16). The frequency distribution of bed elevations in 2023 is similar in shape to the 2019 distribution but with a higher percentage of cells in a narrower channel-bed elevation range (fig. 15). As with the upstream site at structure A1800, the stone revetment on the right (south) bank showed consistent minor deposition between 2019 and 2023, as do the spur dikes on the left (north) side of the channel (fig. 17); however, this deposition may be the result of a systematic vertical error in the 2019 survey at this site because it is unlikely that the spur dikes have been raised since 2019, and the typical deposition and erosion on opposing faces of these features (indicative of horizontal positional variance) do not exist. Furthermore, the previous study (Huizinga, 2022a) had noted that the right bank revetment showed signs of nearly uniform minor scour between the 2019 survey and the previous one in 2017.
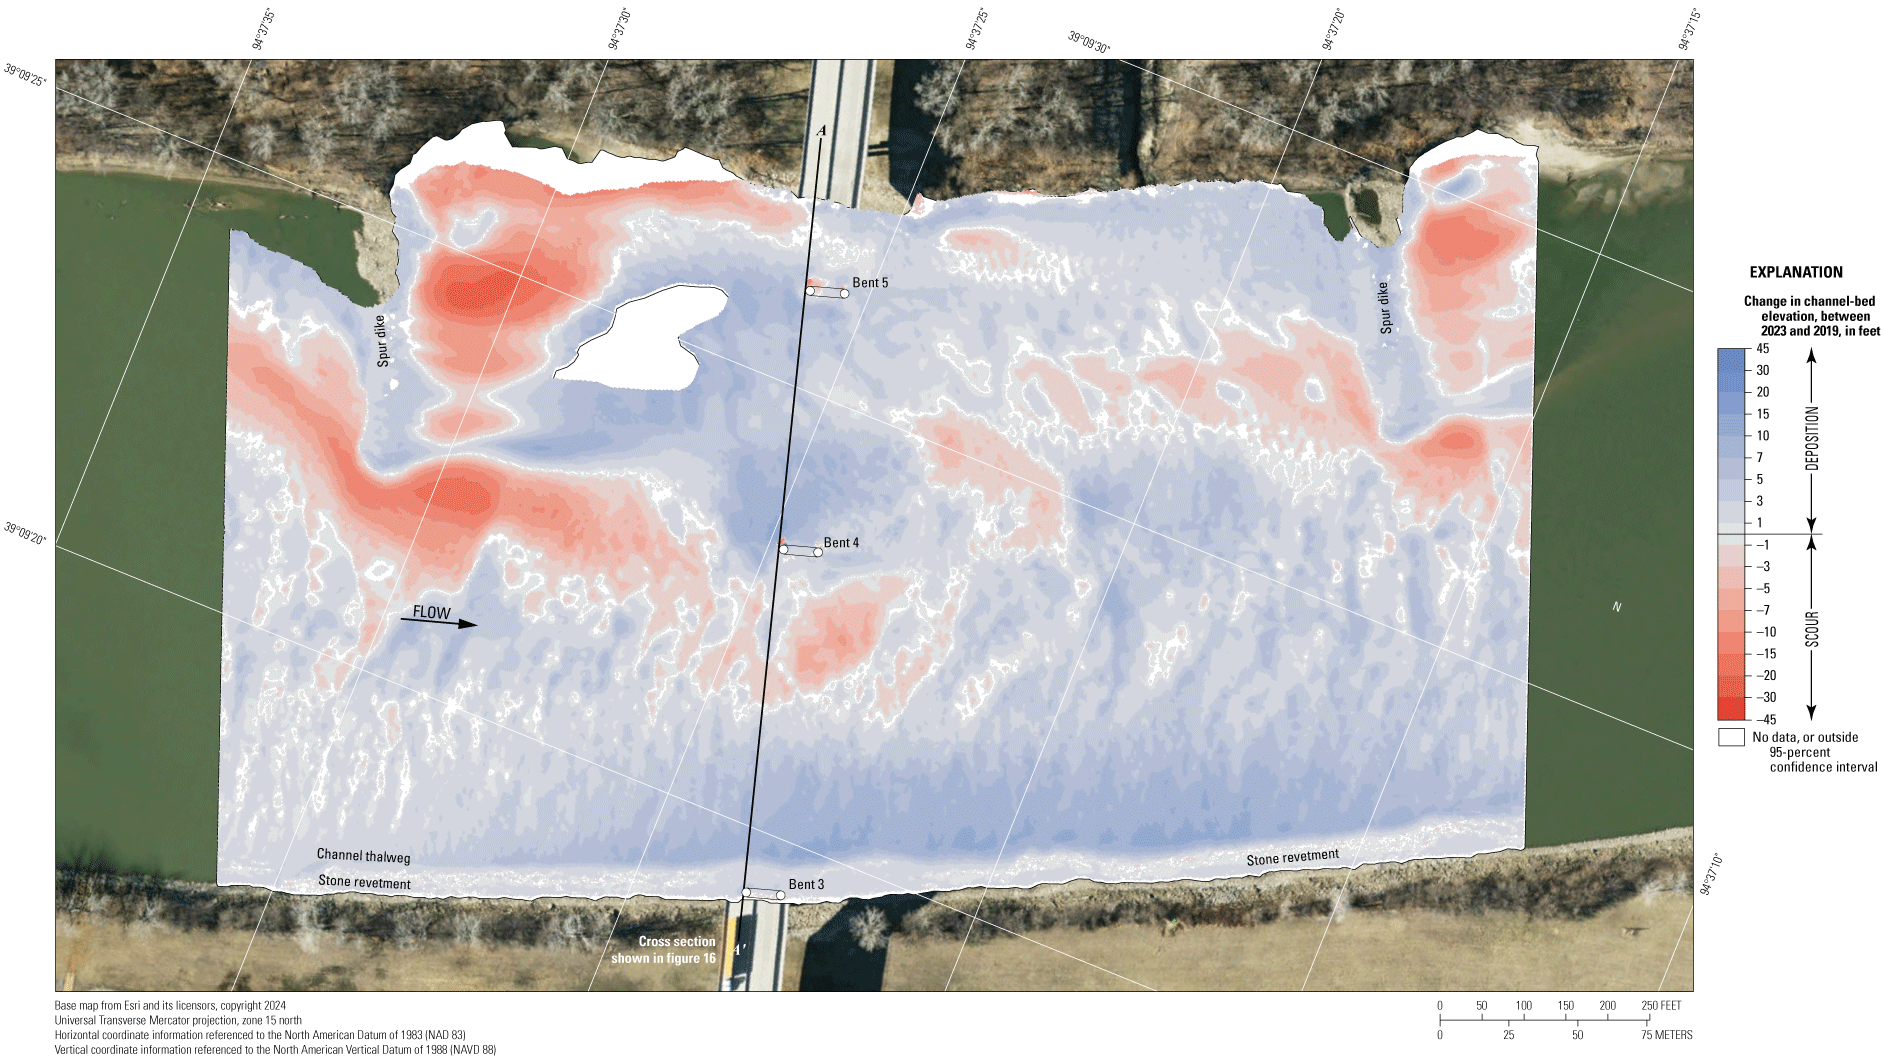
Map showing difference between surfaces created from bathymetric surveys of the Missouri River channel near structure A8340 on U.S. Highway 69 in Kansas City, Missouri, on August 8, 2023, and August 13, 2019, with probabilistic thresholding.
The difference between the surveys on August 8, 2023, and May 22, 2017 (fig. 18), indicates about 88 percent of the joint area of interest had detectable change, which means about 12 percent of the differences in the joint area of interest are equivocal and within the bounds of uncertainty (table 7). Minor to moderate erosion and deposition appear nearly balanced throughout the reach between 2017 and 2023 in the DoD, with erosion being slightly more dominant and with localized substantial erosion and deposition near the ends and downstream from the spur dikes (fig. 18). The average difference between the bathymetric surfaces was –0.35 ft (table 7), indicating minor channel degradation between the 2017 and 2023 surveys, and the net loss of sediment between 2017 and 2023 was about 14,100 yd3 (table 7). The cross section from the upstream face of the bridge from the 2023 survey is the most like the cross section from the 2017 survey section, varying only about 5 ft above and below the 2017 section except near bent 4 (fig. 16). However, the frequency distribution of bed elevations in 2017 is substantially different from the distributions of 2023; the bed elevations of 2017 shifted nearly 10 ft higher than the channel-bed elevations in 2023 (fig. 15). The stone revetment on the right (south) bank shows nearly uniform minor erosion, whereas the spur dikes indicate differences within the bounds of uncertainty (fig. 18). The scour apparent on the right (south) bank may be the result of minor horizontal positional variances that took place between the surveys (see “Uncertainty Estimation” section; fig. 5).
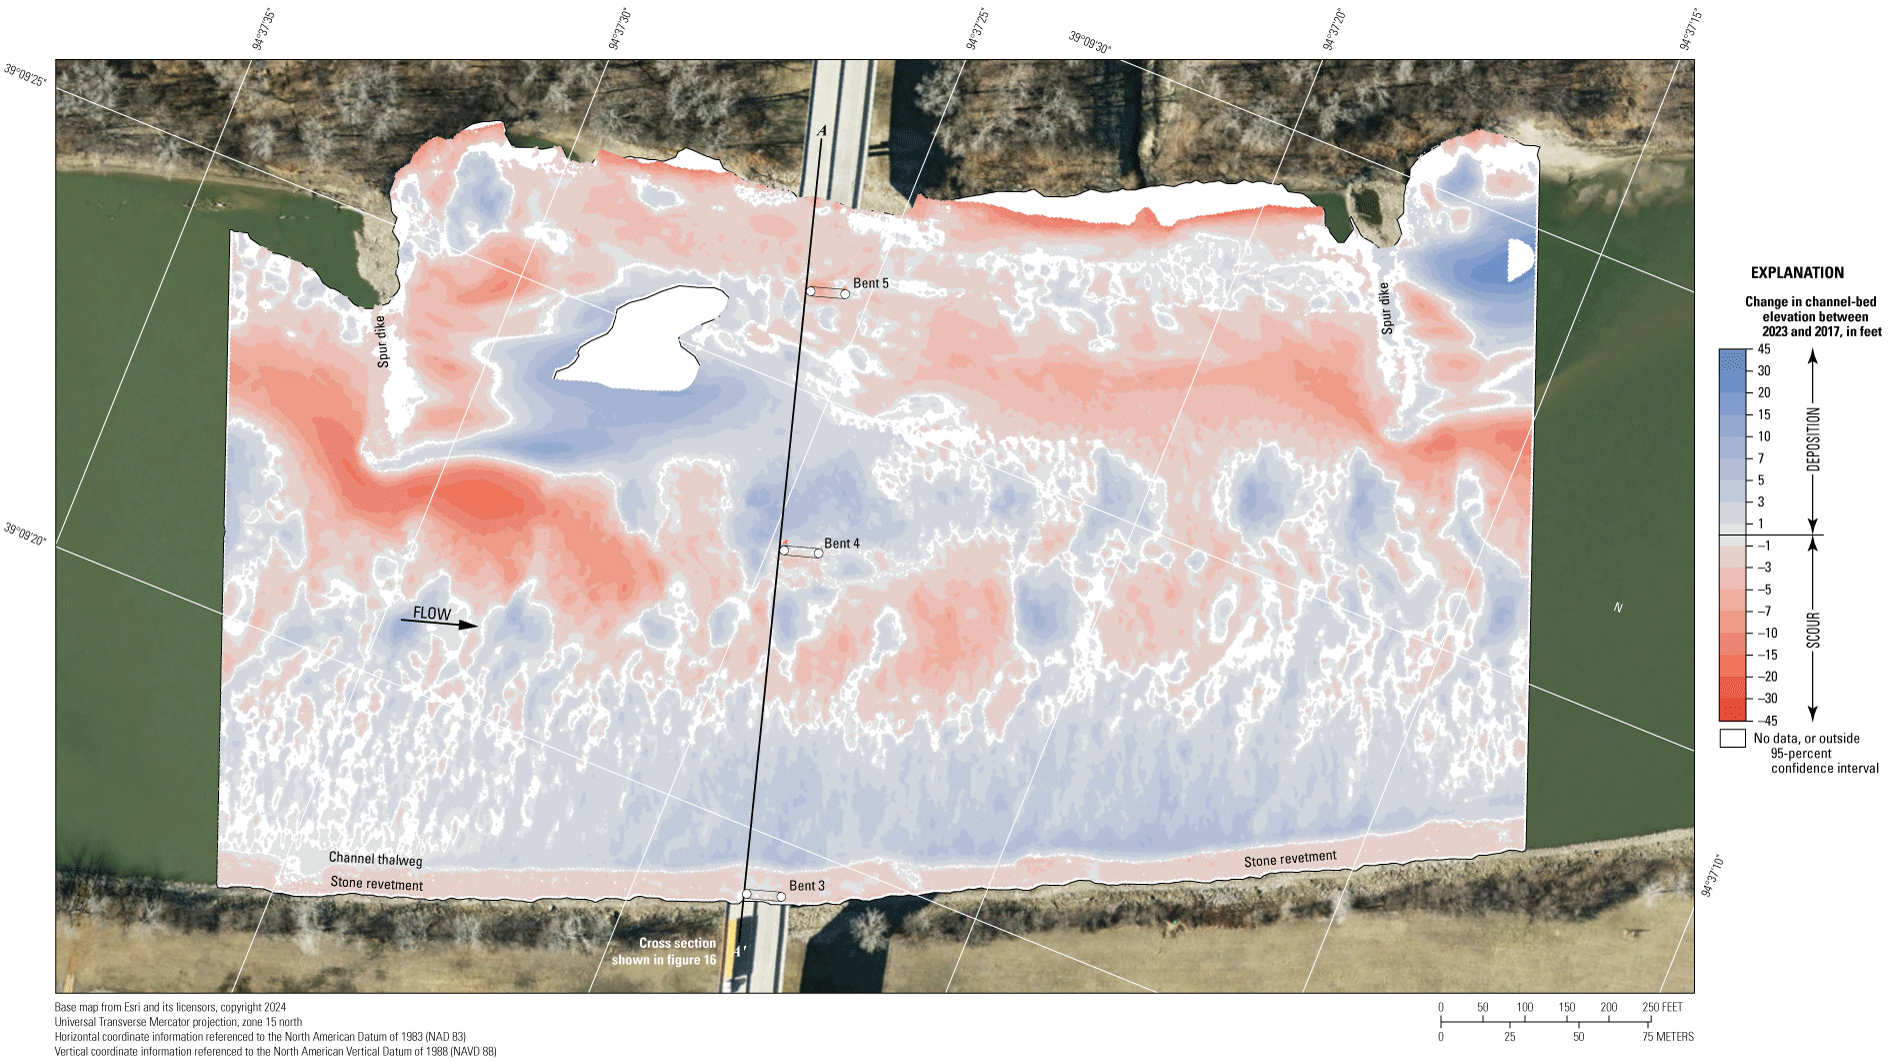
Map showing difference between surfaces created from bathymetric surveys of the Missouri River channel near structure A8340 on U.S. Highway 69 in Kansas City, Missouri, on August 8, 2023, and May 22, 2017, with probabilistic thresholding.
The difference between the surveys on August 8, 2023, and during flooding on July 16, 2011 (fig. 19), again indicates about 88 percent of the joint area of interest had detectable change, which means about 12 percent of the differences in the joint area of interest are equivocal and within the bounds of uncertainty (table 7). Erosion appears dominant in the surveys between 2011 and 2023 in the DoD, but there was also substantial deposition in the channel thalweg and near the location of the old bridge piers near bent 4 (fig. 19). The average difference between the bathymetric surfaces was –0.39 ft (table 7), indicating minor overall degradation between the 2011 and 2023 surveys, with a net loss of sediment of about 15,000 yd3 (table 7). The frequency distribution of bed elevations in 2011 is somewhat unique compared with the other distributions from other survey years at this site, with more grid cells at a much wider range of channel-bed elevations than the other surveys (fig. 15). The stone revetment on the right (south) bank again showed nearly uniform minor scour (fig. 19), like the 2017 to 2023 DoD (fig. 18). Similarly, the spur dikes showed differences within the bounds of uncertainty or minor scour (fig. 19). As with previous DoDs, deposition or scour apparent on opposing faces of a feature likely caused by minor horizontal positional variances between the surveys (see “Uncertainty Estimation” section; fig. 5).
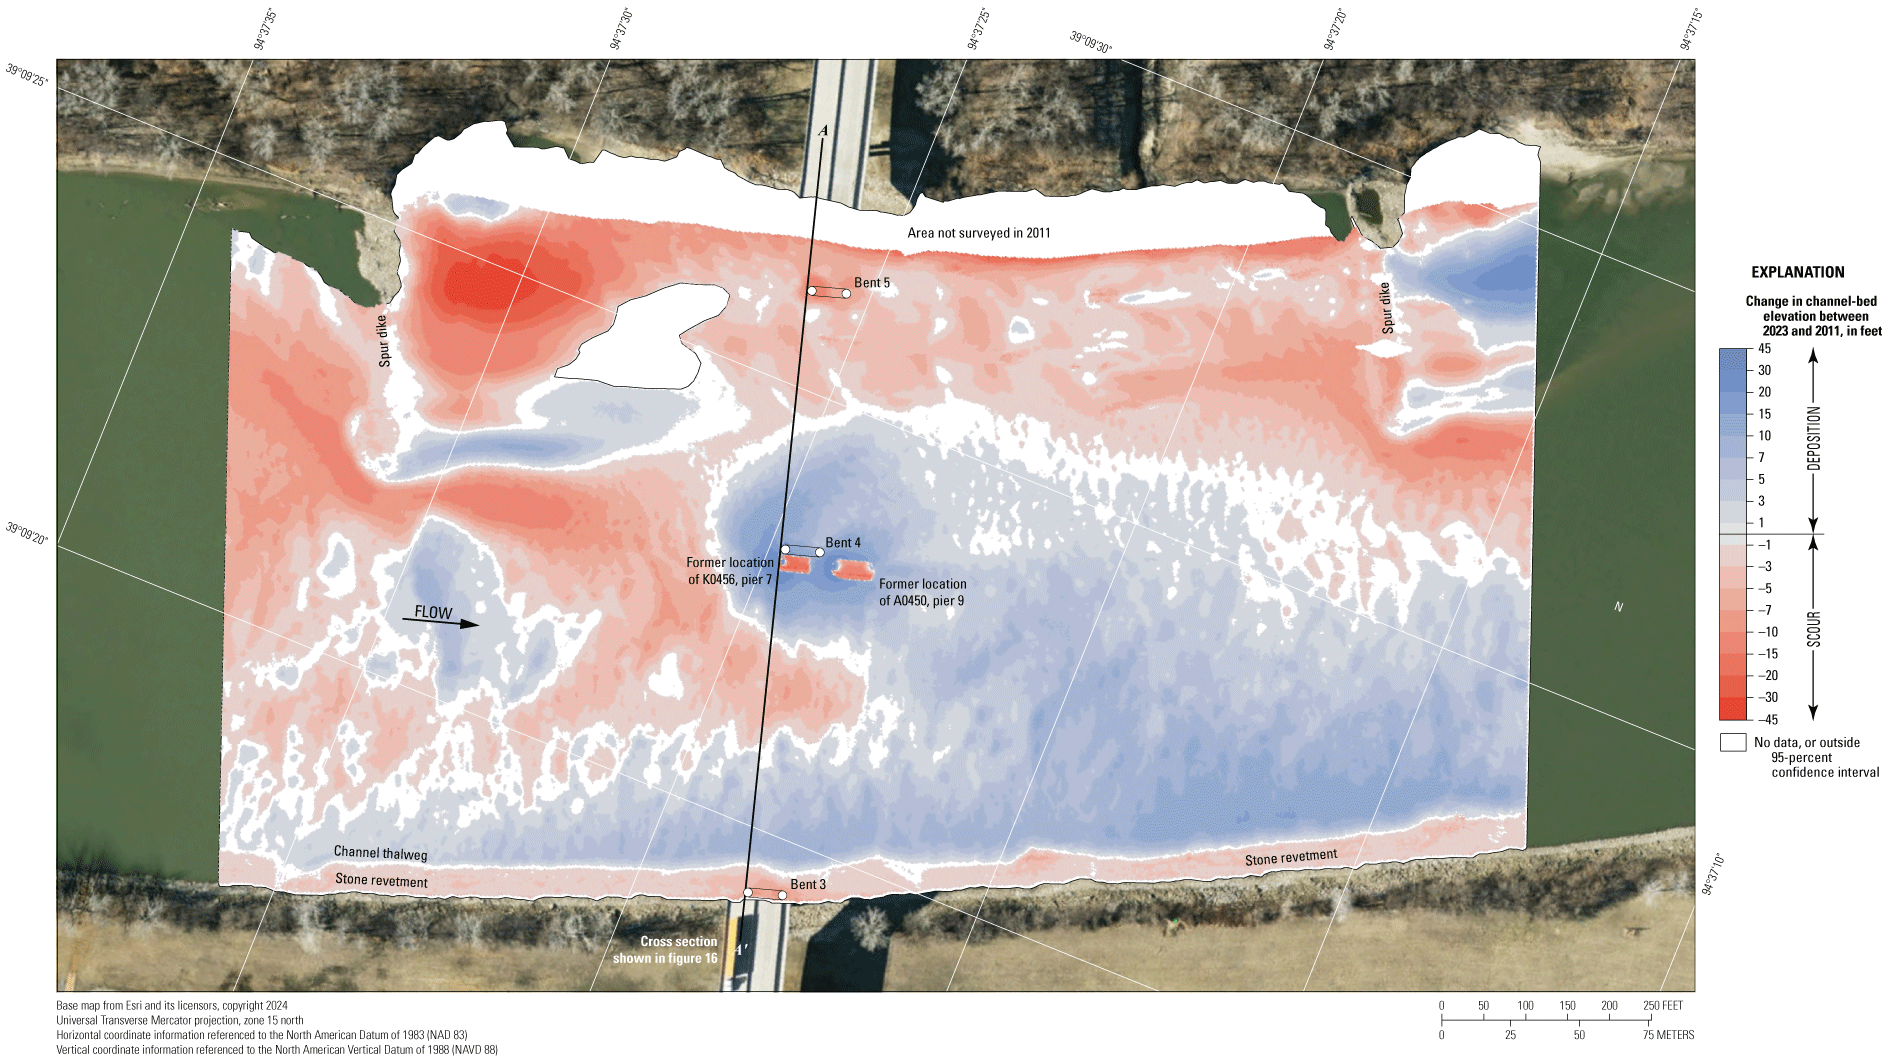
Map showing difference between surfaces created from bathymetric surveys of the Missouri River channel near structure A8340 on U.S. Highway 69 in Kansas City, Missouri, on August 8, 2023, and July 16, 2011, with probabilistic thresholding.
The difference between the surveys on August 8, 2023, and the earliest on March 15, 2010 (fig. 20), indicates about 91 percent of the joint area of interest had detectable change, which means only about 9 percent of the differences in the joint area of interest are equivocal and within the bounds of uncertainty (table 7). Deposition appears dominant throughout most of the reach between 2010 and 2023 in the DoD, with substantial localized erosion near the ends and between the spur dikes in the study area downstream from the bridge. Substantial deposition downstream from the upstream spur dike and near the location of the old bridge piers near bent 4 also took place (fig. 20). The average difference between the bathymetric surfaces among the surveys was +3.17 ft (table 7), indicating substantial channel aggradation between the 2010 and 2023 surveys, with a net gain of sediment in the reach between 2010 and 2023 of about 110,800 yd3 (table 7). The cross section from along the upstream face of the bridge from the 2010 survey is very similar to the same cross section from the 2011 survey, resulting in similar differences with the 2023 survey section (fig. 16). The frequency distribution of bed elevations in 2010 is roughly like the 2023 distribution at this site, but with a higher percentage of cells at elevations of about 5 to 7 ft lower than in 2023 (fig. 15). The stone revetment on the right (south) bank again showed nearly uniform minor scour (fig. 20), like the previous DoDs for 2017 and 2011 (fig. 18, fig. 19). The spur dikes showed minor scour or differences within the bounds of uncertainty (fig. 20). As with previous DoDs, deposition or scour apparent on opposing faces of a feature likely caused by either minor horizontal positional variances between the surveys (see “Uncertainty Estimation” section; fig. 5), a vertical difference that is greater than the uncertainty of the surveys, or a combination of these.
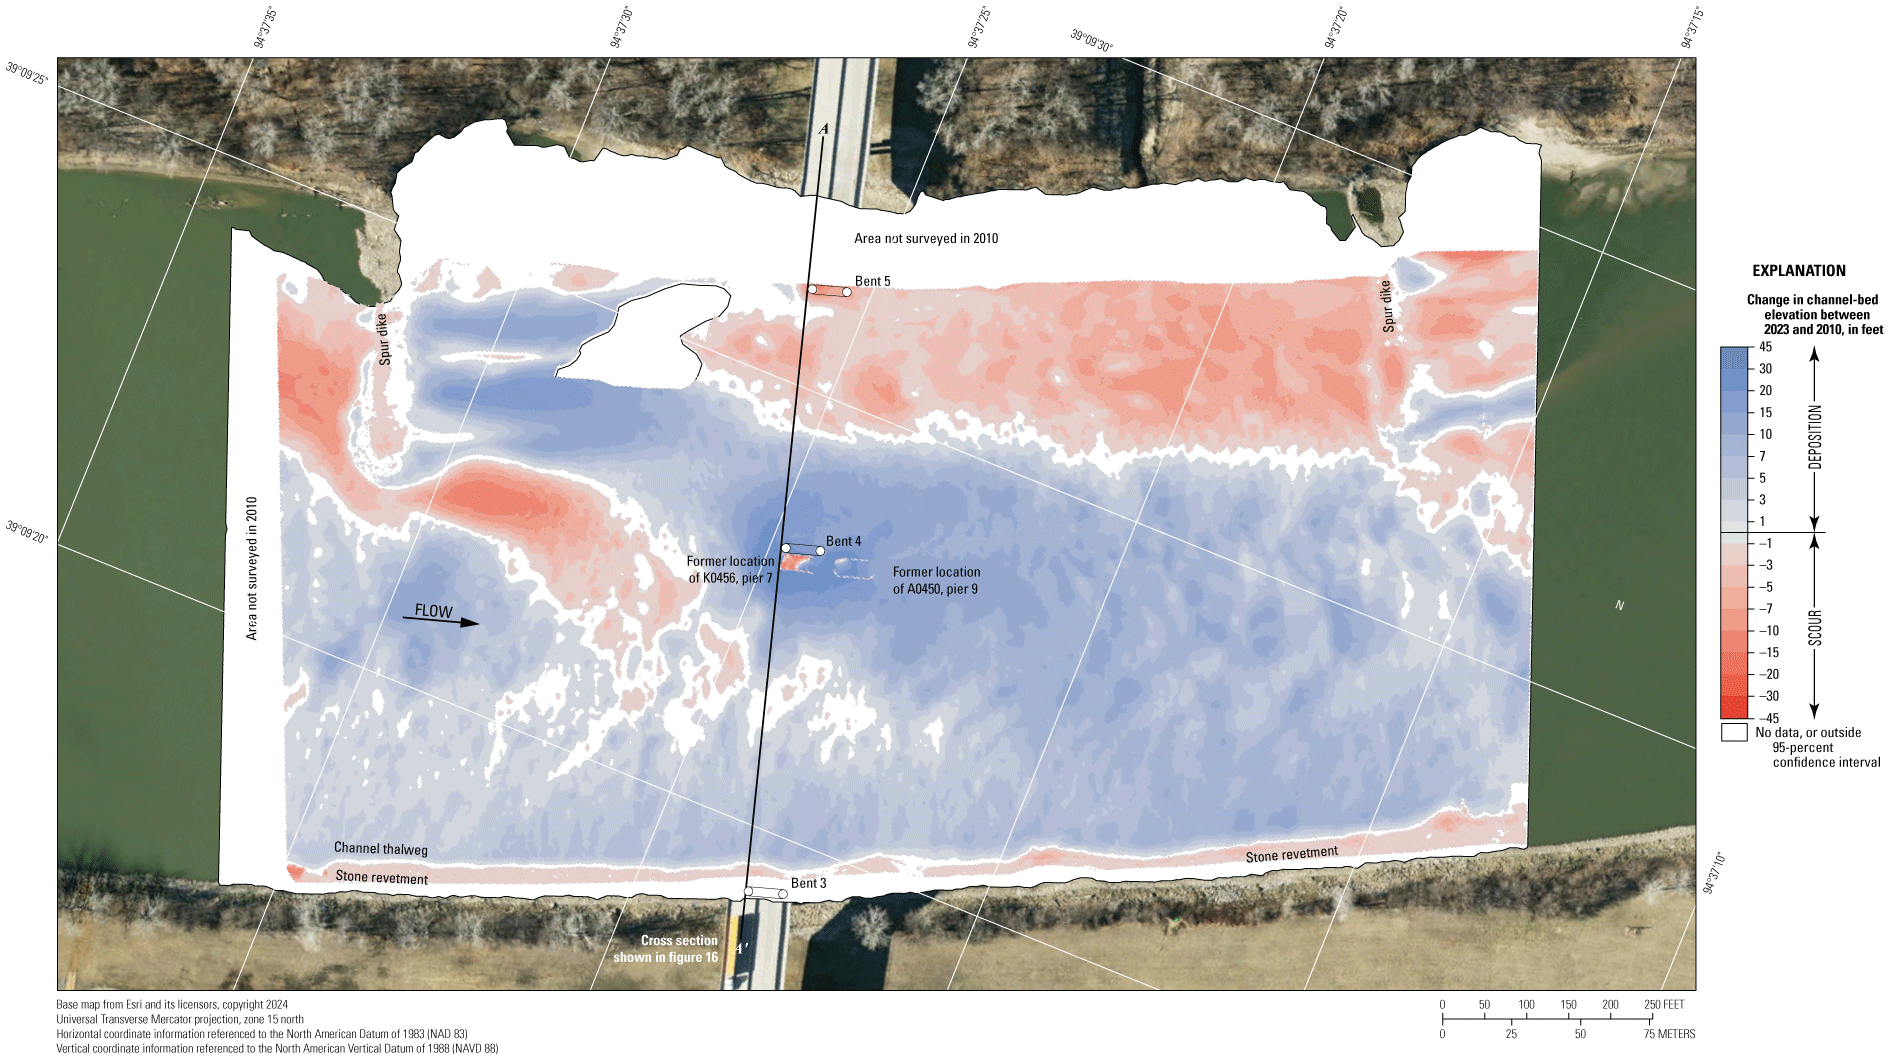
Map showing difference between surfaces created from bathymetric surveys of the Missouri River channel near structure A8340 on U.S. Highway 69 in Kansas City, Missouri, on August 8, 2023, and March 15, 2010, with probabilistic thresholding.
The vertically averaged velocity vectors indicate mostly uniform flow on the right (south) side of the channel, with a maximum velocity of about 8 ft/s (fig. 21). Local lower velocities and turbulence were observed downstream from the various spur dikes on the left (north) bank (fig. 21). Minimal effect on the velocity vectors was observed downstream from bents 4 and 5 (fig. 21), indicating the piers are appropriately hydrodynamic. All sections had minor localized turbulence (fig. 21).
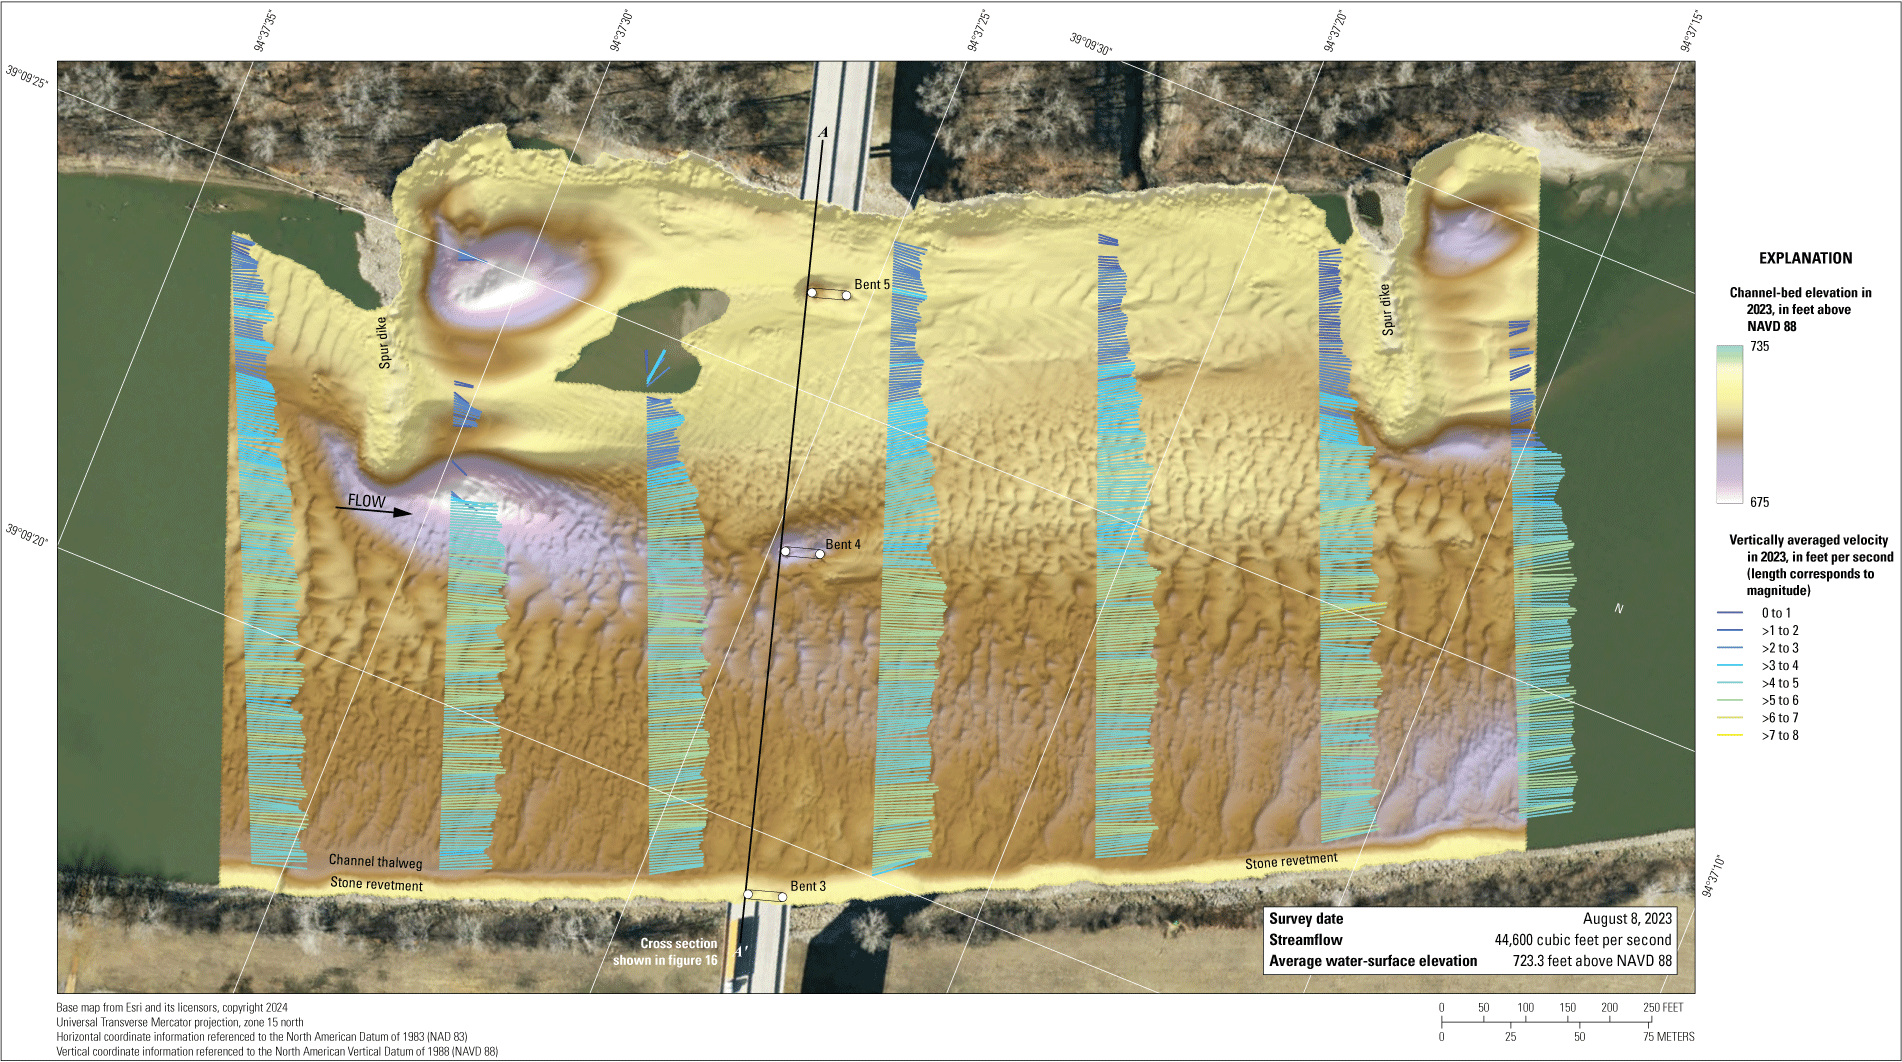
Map showing bathymetry and vertically averaged velocities of the Missouri River channel near structure A8340 on U.S. Highway 69 in Kansas City, Missouri. [NAVD, North American Vertical Datum of 1988; >, greater than]
Structure A4060 on State Highway 9
Structure A4060 (site 9; table 2) on State Highway 9 crosses the Missouri River at RM 365.5, immediately north of downtown Kansas City, Mo. (fig. 1). The site was surveyed on August 8, 2023, when the average water-surface elevation near the bridge, determined by the RTK GNSS tide solution, was 716.2 ft (table 5; fig. 22), and streamflow on the Missouri River was measured at about 46,400 ft3/s during the survey (table 5).
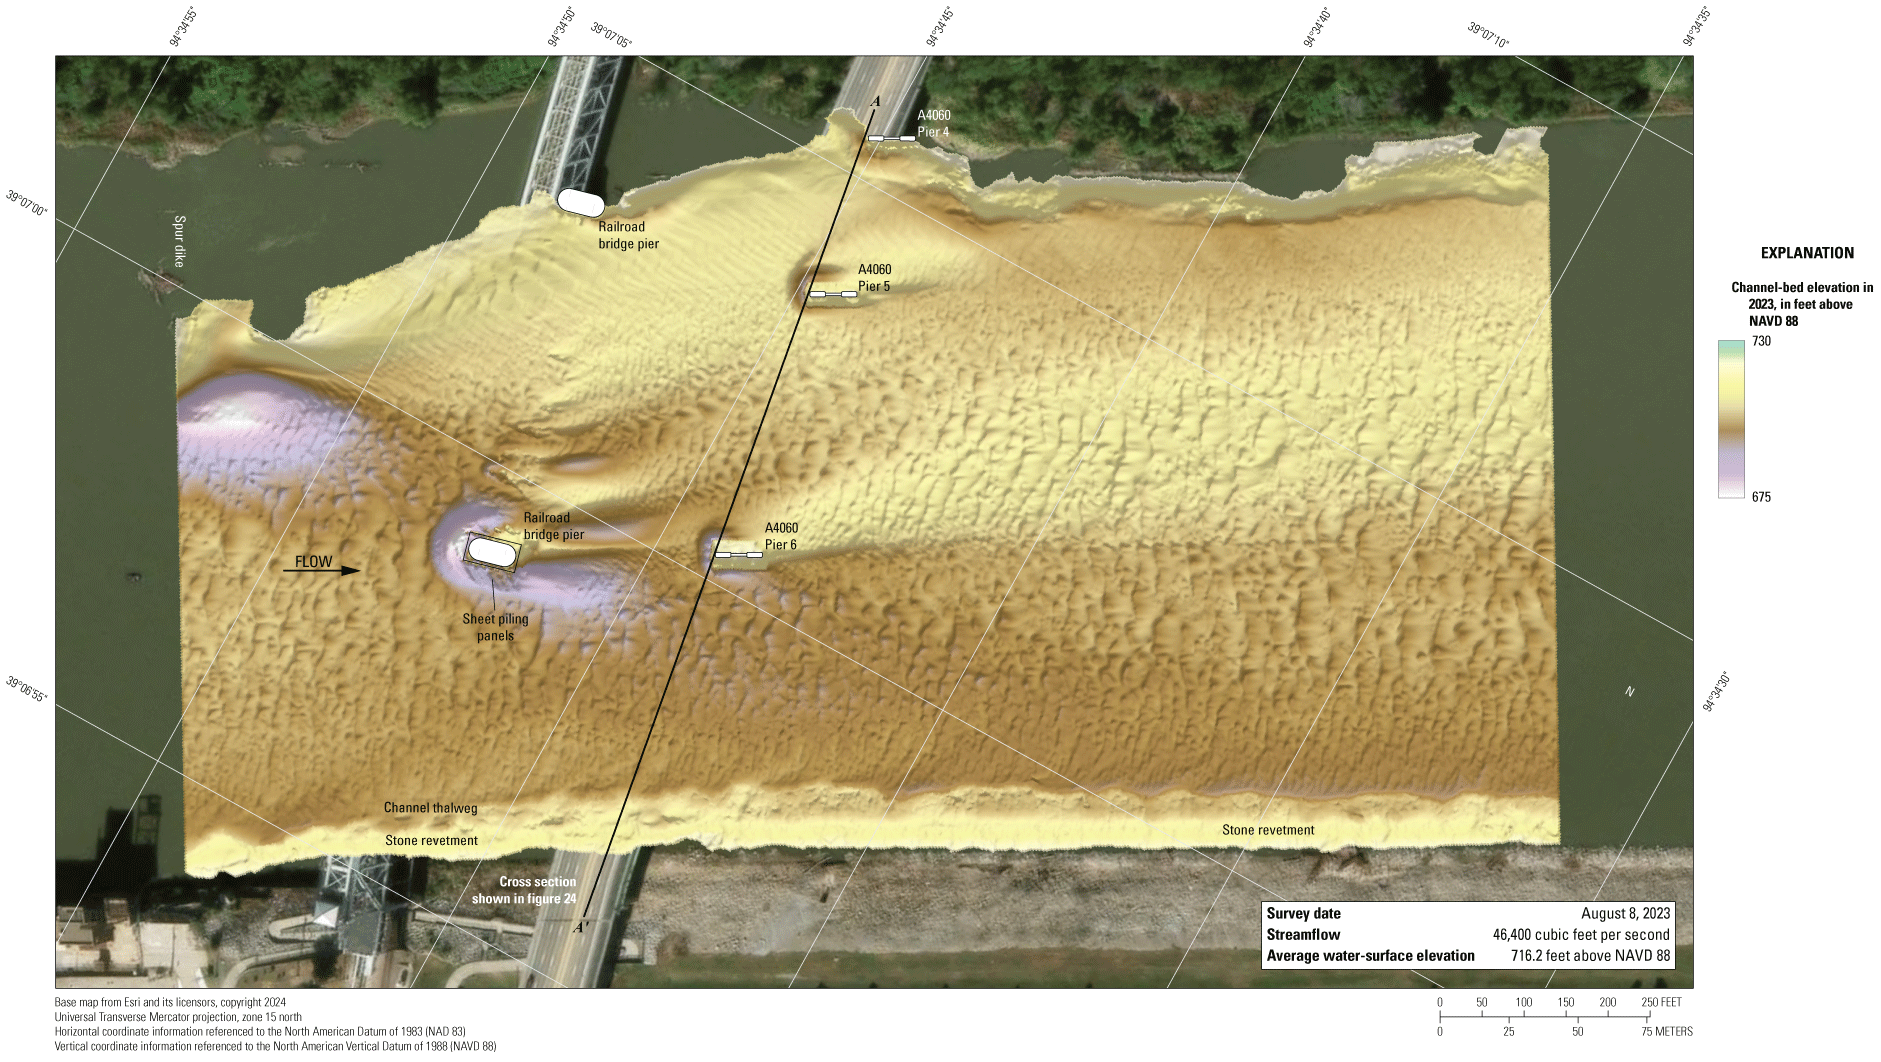
Map showing bathymetric survey of the Missouri River channel near structure A4060 on State Highway 9 in Kansas City, Missouri. [NAVD 88, North American Vertical Datum of 1988]
The survey area was about 1,640 ft long and averaged about 900 ft wide, extending from bank to bank in the main channel (fig. 22). The survey area extended about 665 ft upstream from the centerline of structure A4060 at pier 6 (fig. 22). The channel-bed elevations in 2023 ranged from about 695 to 708 ft for most of the surveyed area (5th to 95th percentile range of the bathymetric data; table 5; fig. 23), except for deeper areas near the end of the upstream spur dike on the left (north) bank and the railroad bridge pier upstream from pier 6 (fig. 22). A poorly defined thalweg along the toe of the right (south) bank was about 5 ft deeper than the middle of the channel, and the channel was filled with small dunes and ripples (fig. 22). As in previous surveys (Huizinga, 2010, 2012, 2016, 2022a), a stone revetment was on the right (south) bank throughout the reach (fig. 22).
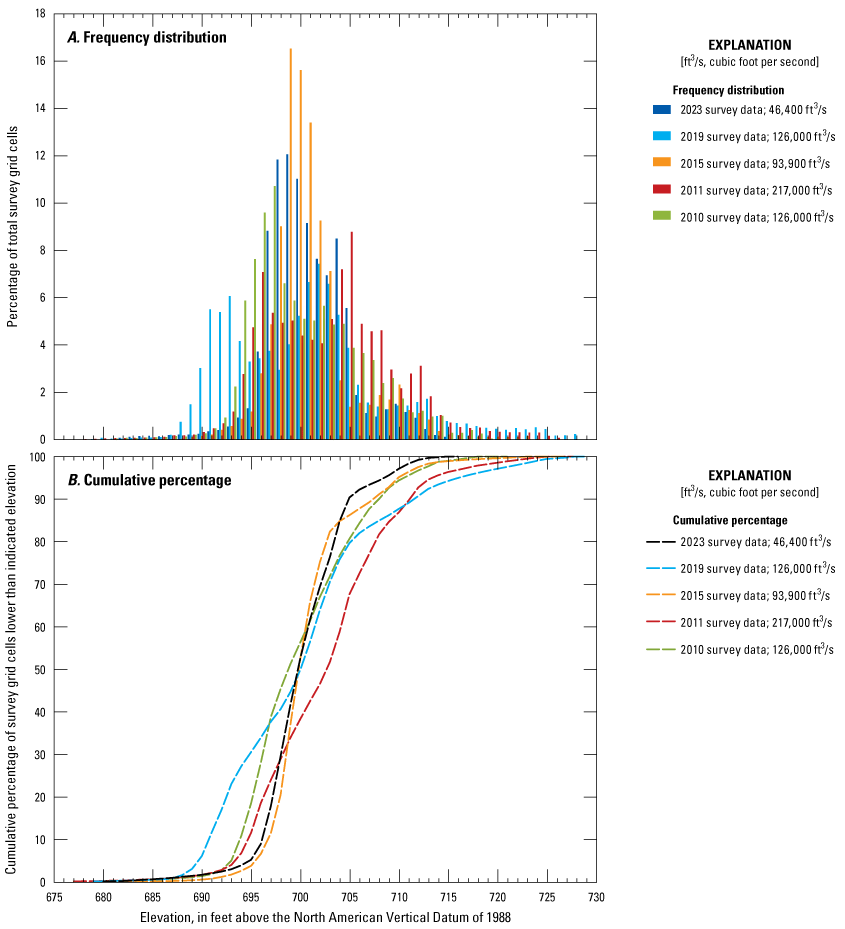
Graphs showing (A) frequency distribution and (B) cumulative percent of bed elevations for bathymetric survey grid cells in 1-foot elevation bins from a survey on the Missouri River near structure A4060 on State Highway 9 in Kansas City, Missouri, on August 8, 2023, compared with previous surveys in 2010, 2011, 2015, and 2019 (Huizinga, 2010, 2012, 2016, and 2022a, respectively).
The lower flow conditions in 2023 limited the ability to survey on the left (north) bank; nevertheless, a scour hole was found near main channel pier 4 on that bank (fig. 22, fig. 24) that had a minimum channel-bed elevation of 697 ft (table 6). A scour hole near main channel pier 5 (fig. 22) had a minimum channel-bed elevation of about 693 ft (table 6), about 3 ft below the elevation of the bottom of the pier seal course of 696.26 ft (fig. 24; table 6). Near the right (south) main channel pier 6 (fig. 22), a scour hole had a minimum channel-bed elevation of about 690 ft (table 6), about 6 ft below the elevation of the bottom of the pier seal course of 696.26 ft (fig. 24; table 6; fig. 1.3). A substantially deeper scour hole was observed near the upstream railroad bridge pier (fig. 22) that had a minimum elevation of about 679 ft, which is the lowest channel-bed elevation observed in this reach (table 5). This deeper hole was likely caused by flow around the upstream railroad pier that was combined with flow over large sheet piling panels that were lying on the channel bottom on the right (south) side of the pier first observed in the 2010 survey (Huizinga, 2010) and observed in all subsequent surveys (Huizinga 2012, 2016, 2022a). Information from bridge plans indicates that piers 4 through 6 are founded on shafts drilled 20 ft into the bedrock, and about 32 ft of bed material were between the bottom of the scour hole and bedrock at pier 4, about 26 ft of material were between the bottom of the scour hole and bedrock at pier 5, and about 20 ft of material were between the bottom of the scour hole and bedrock at pier 6 (fig. 24; table 6).
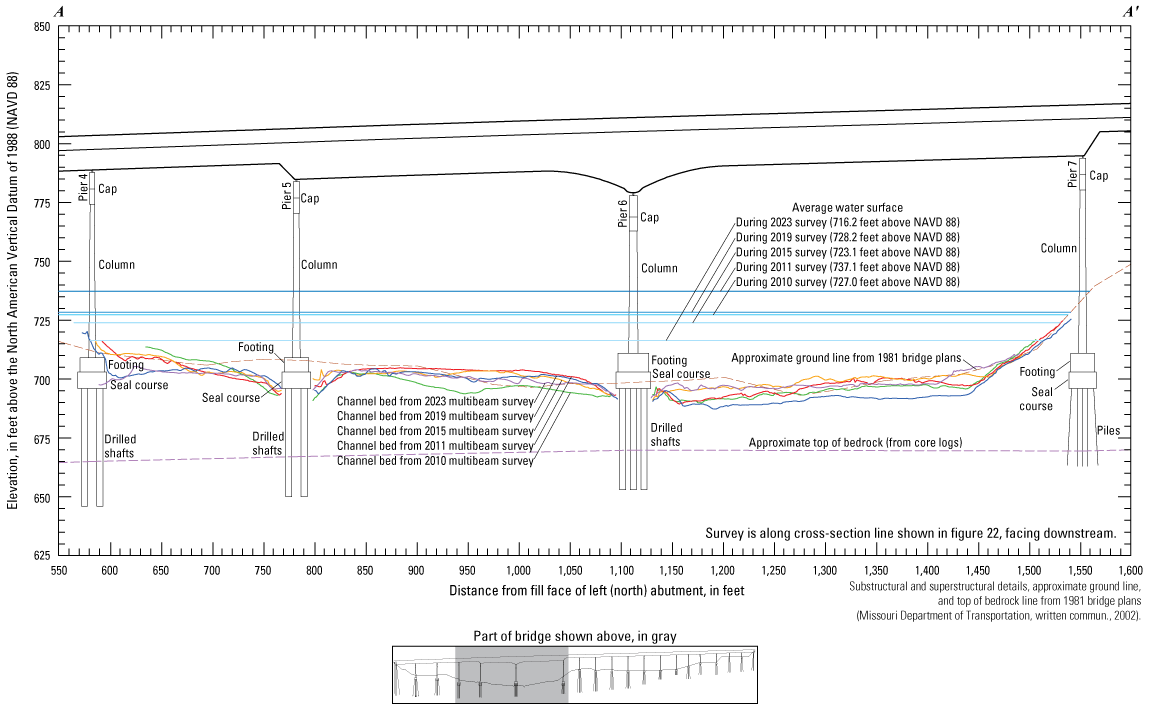
Diagram showing key features, substructural and superstructural details, and surveyed channel bed of structure A4060 on State Highway 9 crossing the Missouri River in Kansas City, Missouri.
The difference between the surveys on August 8, 2023, and August 13, 2019 (fig. 25), indicates about 95 percent of the joint area of interest had detectable change, which means only about 5 percent of the differences in the joint area of interest are equivocal and within the bounds of uncertainty (table 7). Deposition is clearly dominant throughout most of the reach between 2019 and 2023 in the DoD, except for localized areas of substantial erosion near the end of and downstream from the upstream spur dike on the left (north) bank (fig. 25). Furthermore, erosion and deposition are roughly balanced on the left side of the channel downstream from the bridge (fig. 25). The average difference between the bathymetric surfaces was +2.45 ft (table 7), indicating there was substantial channel aggradation between the 2019 and 2023 surveys. The net volume of cut in the reach from 2019 to 2023 was about 34,700 yd3, whereas the net volume of fill was about 145,100 yd3, resulting in a net gain of about 110,400 yd3 of sediment between 2019 and 2023 (table 7). The frequency distribution of bed elevations in 2023 appears similar in shape to several of the previous surveys; however, the 2019 survey had more grid cells in a substantially wider band of channel-bed elevations (fig. 23), which indicates the 2023 survey had more uniform channel-bed elevations than the 2019 survey. The cross sections from the 2019 and 2023 surveys along the upstream face of the bridge also indicate these same differences (fig. 24); whereas the cross sections are like each other in the left (north) side of the channel, the 2023 cross section is 10 to 20 ft above the 2019 cross section on the right (south) side. The stone revetement on the right (south) bank showed minor to moderate deposition between 2019 and 2023, with more deposition near the toe of the bank throughout the reach, and the footing and seal course of piers 5 and 6 showed minor erosion on one side and deposition on the other (figs. 24, 25); however, as in previous DoDs, deposition or scour apparent on opposing faces of a particular feature is likely caused by minor horizontal positional variances between the surveys (see “Uncertainty Estimation” section; fig. 5).
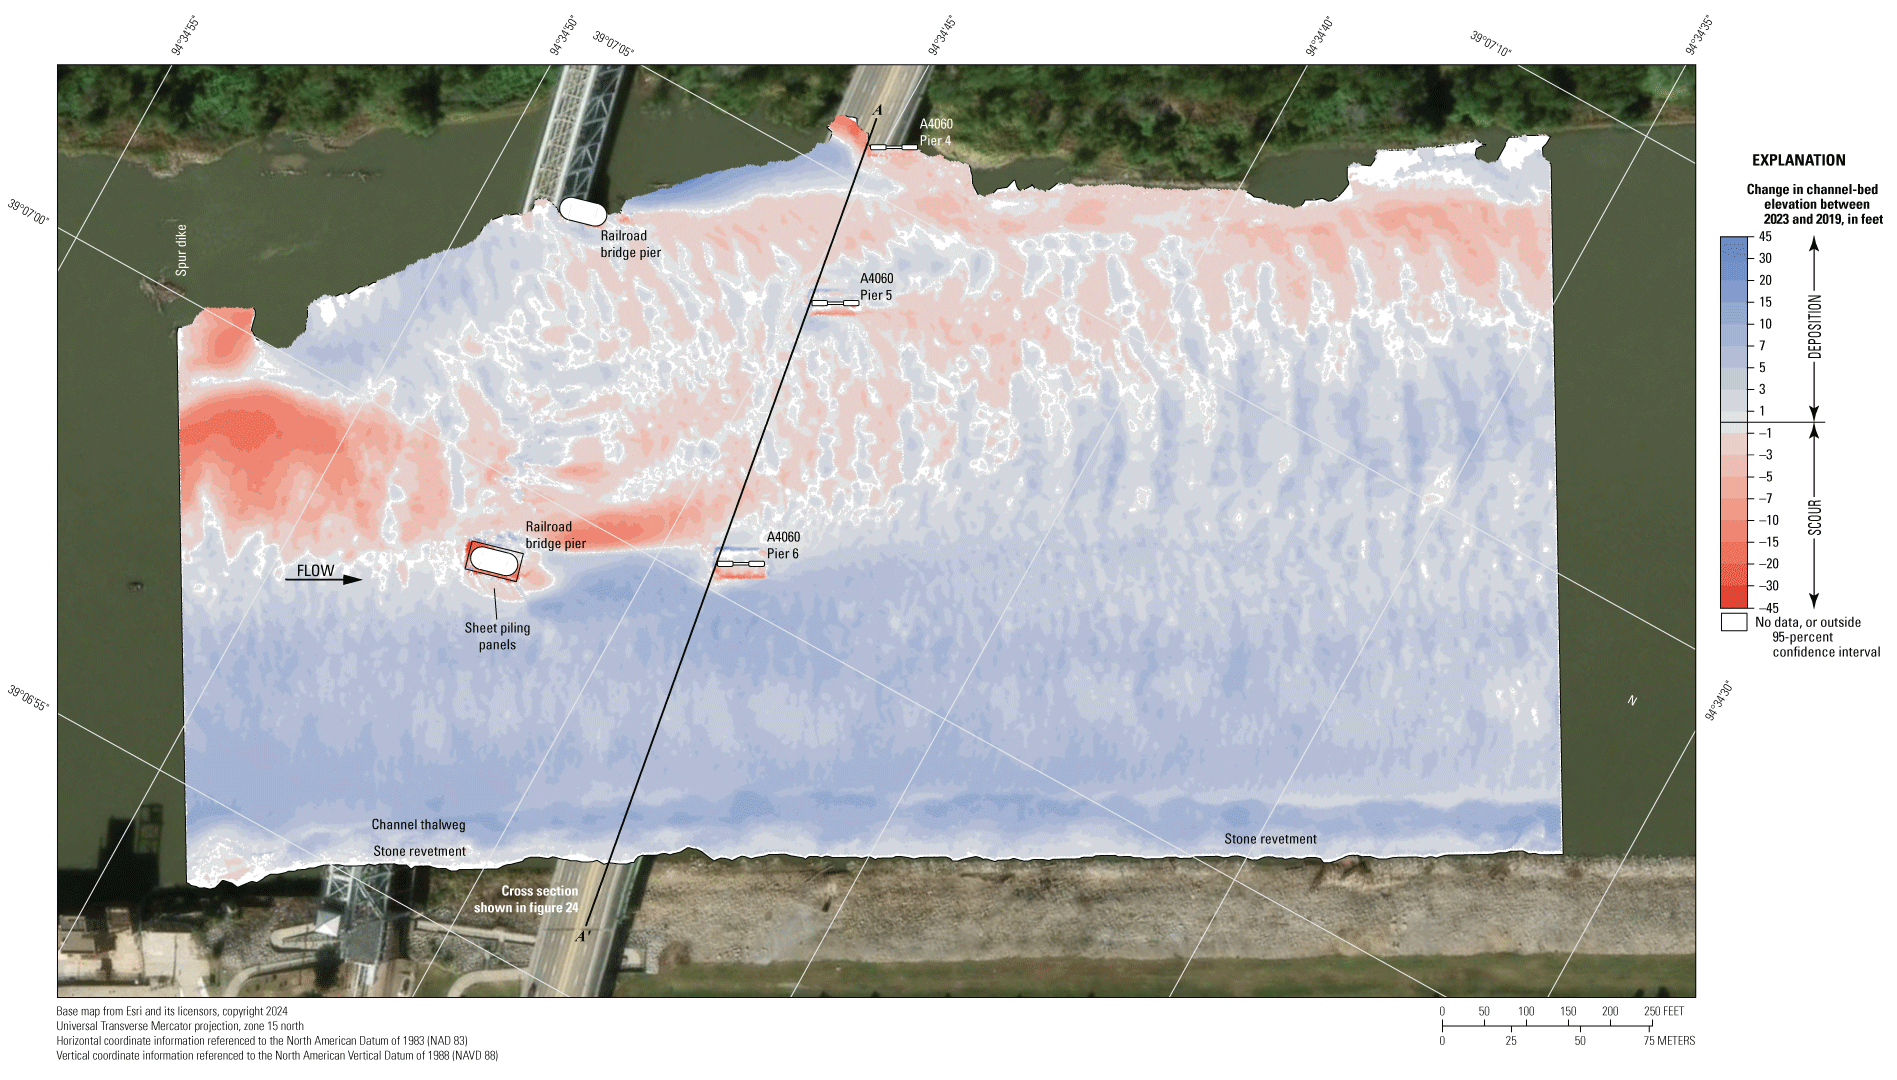
Map showing difference between surfaces created from bathymetric surveys of the Missouri River channel near structure A4060 on State Highway 9 in Kansas City, Missouri, on August 8, 2023, and August 13, 2019, with probabilistic thresholding.
The difference between the surveys on August 8, 2023, and on June 3, 2015 (fig. 26), indicates about 73 percent of the joint area of interest had detectable change in bed geomorphology (table 7), which means about 27 percent of the differences in the joint area of interest are equivocal and within the bounds of uncertainty. Scour and deposition appear roughly balanced throughout the reach between 2015 and 2023 in the DoD, with deposition generally more prominent on the left (north) side and erosion more prominent on the right (south) side of the channel (fig. 26). Localized areas of substantial erosion are evident near the end of and downstream from the upstream spur dike on the left (north) bank (fig. 26). The average difference between the bathymetric surfaces was +0.24 ft between the 2015 and 2023 surveys (table 7), indicating minor channel aggradation during that time, the net gain of sediment between 2015 and 2023 being only about 8,100 yd3 (table 7). The frequency distribution of bed elevations in 2023 is very similar to 2015, but with a lower percentage of cells at channel-bed elevations between 698 and 703 ft (fig. 23). The 2023 cross section is also like the 2015 cross section, except near pier 4 on the left (north) bank where the 2023 bed elevation is lower than 2015 (fig. 24). The stone revetment on the right (south) bank again showed minor deposition between 2015 and 2023, with more deposition near the toe of the bank throughout the reach (fig. 26). As with previous DoDs, deposition or scour apparent on opposing faces of a feature (such as a pier or spur dike) is likely caused by minor horizontal positional variances between the surveys (see “Uncertainty Estimation” section; fig. 5).
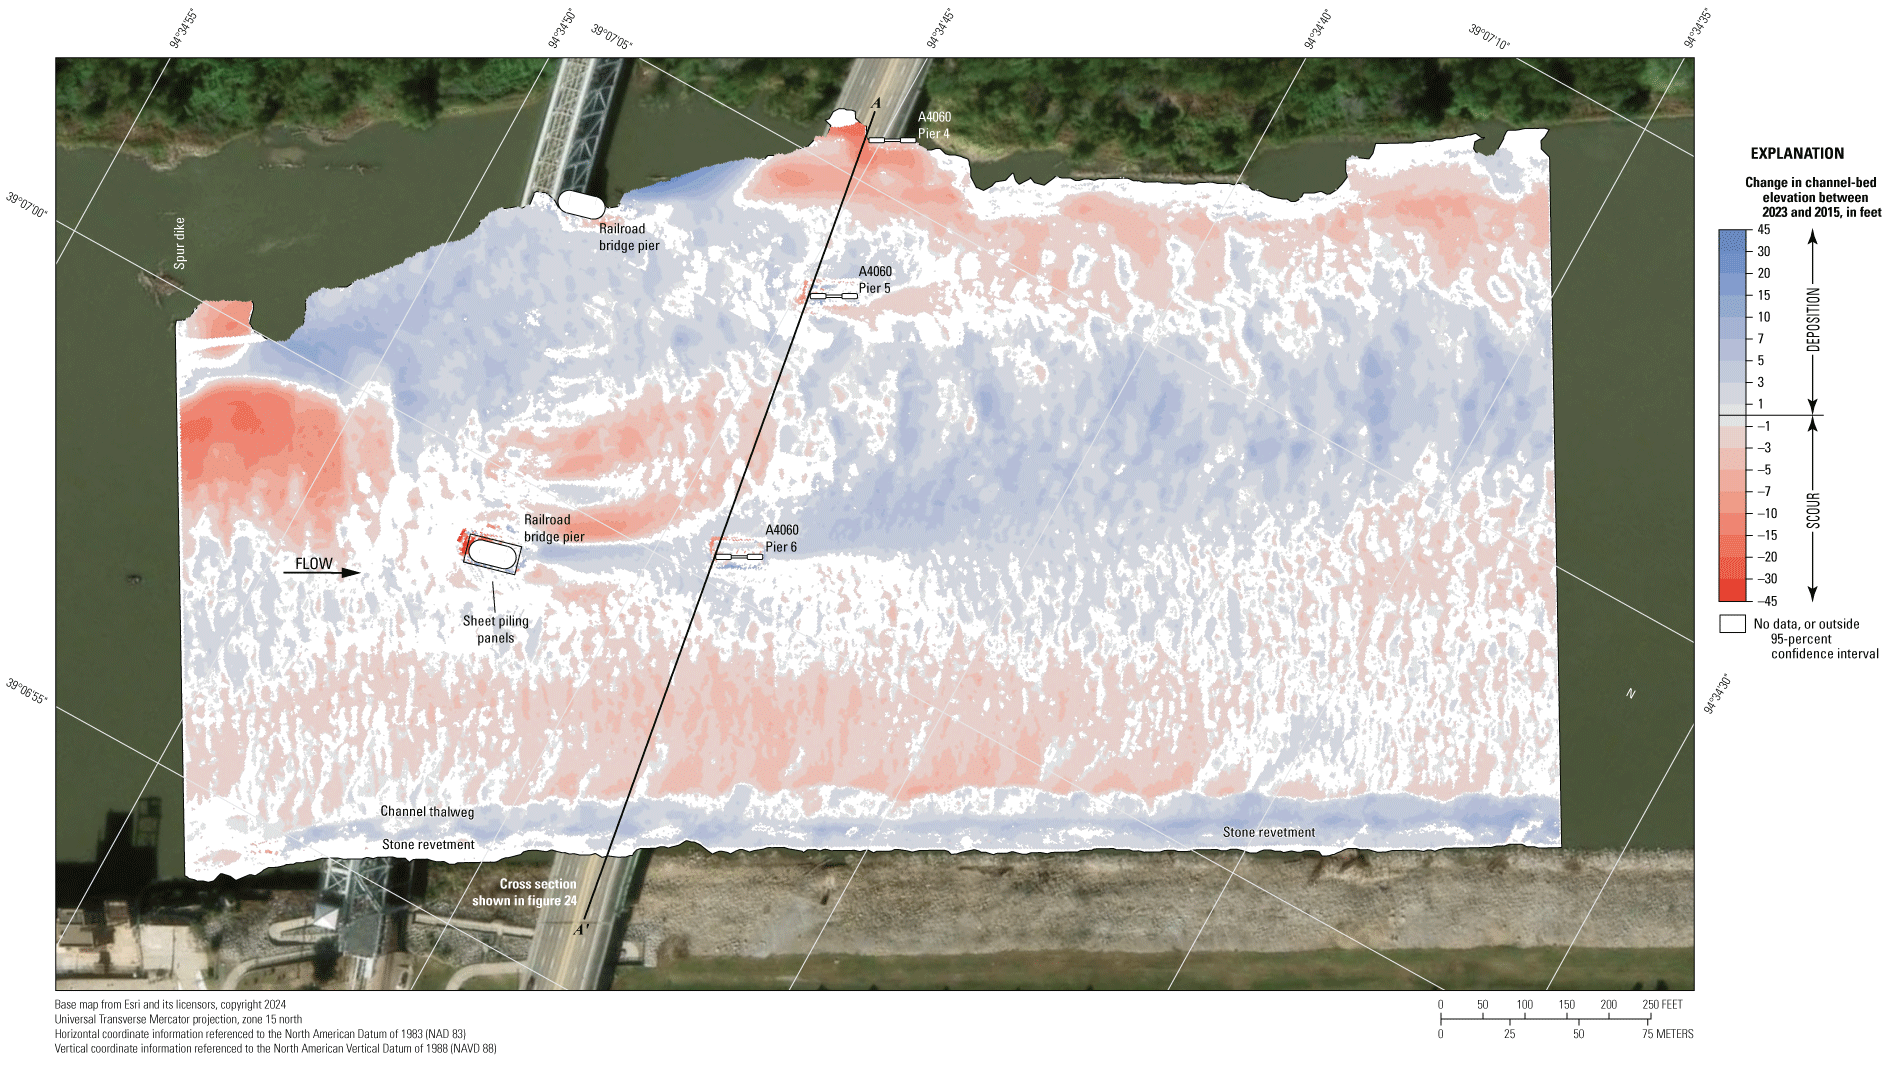
Map showing difference between surfaces created from bathymetric surveys of the Missouri River channel near structure A4060 on State Highway 9 in Kansas City, Missouri, on August 8, 2023, and June 3, 2015, with probabilistic thresholding.
The difference between the surveys on August 8, 2023, and during flooding on July 17, 2011 (fig. 27), indicates about 80 percent of the joint area of interest had detectable change, which means about 20 percent of the differences in the joint area of interest are equivocal and within the bounds of uncertainty (table 7). Scour appears to be dominant throughout most of the reach between 2011 and 2023 in the DoD, with substantial erosion near the end of and downstream from the upstream spur dike, erosion along the left (north) side of the river, and deposition along the right (south) side of the river (fig. 27). The average difference between the bathymetric surfaces of the 2011 and 2023 surveys was –1.25 ft (table 7), indicating moderate channel degradation, and the net loss of sediment was about 47,000 yd3 (table 7). The frequency distribution of bed elevations in 2011 is somewhat unique compared with the frequency distributions from other surveys at this site; the 2011 survey had more grid cells at a much wider range of channel-bed elevations than the other surveys, particularly above 705 ft (fig. 23). Like the other DoDs at this site, the stone revetment on the right (south) bank has localized areas of deposition, with more deposition along the toe of the bank and less farther up the bank, but there are also areas of localized erosion (fig. 27). The scour hole near pier 5 in the 2023 survey was narrower and shallower than the same scour hole in the 2011 survey, as indicated by the deposition near the pier; however, the scour hole near pier 4 was deeper in the 2023 survey (fig. 24 and fig. 27). As with the previous DoDs, deposition or scour apparent on opposing faces of piers 5 and 6 were likely caused by minor horizontal positional variances between the surveys (see “Uncertainty Estimation” section; fig. 5).
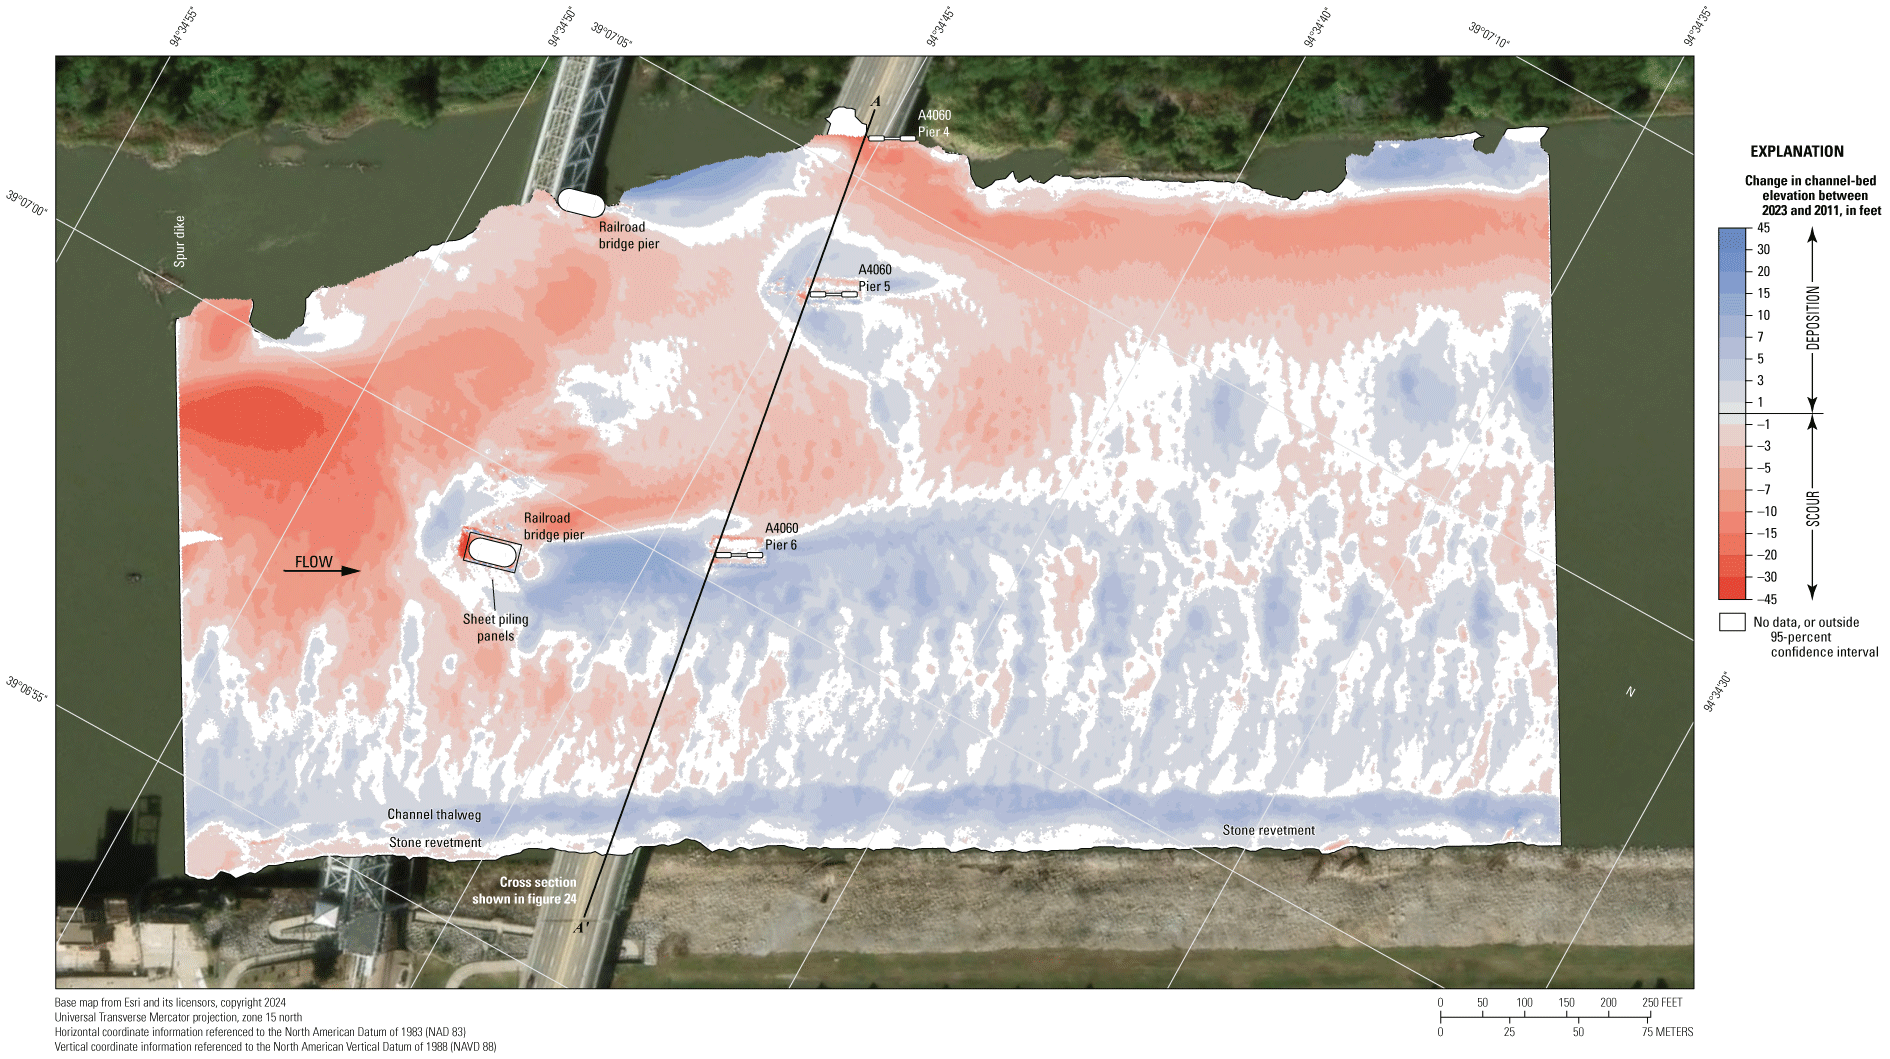
Map showing difference between surfaces created from bathymetric surveys of the Missouri River channel near structure A4060 on State Highway 9 in Kansas City, Missouri, on August 8, 2023, and July 17, 2011, with probabilistic thresholding.
The difference between the surveys on August 8, 2023, and the earliest on March 16, 2010 (fig. 28), indicates about 86 percent of the joint area of interest had detectable change, which means about 14 percent of the differences in the joint area of interest are equivocal and within the bounds of uncertainty (table 7). Deposition appears dominant throughout most of the reach between 2010 and 2023 in the DoD, with localized substantial erosion near the end of and downstream from the upstream spur dike as well as along the left (north) side and moderate deposition throughout the remainder of the reach (fig. 28). The average difference between the bathymetric surfaces was +1.13 ft (table 7), indicating moderate channel aggradation between the 2010 and 2023 surveys, and the net gain of sediment was about 44,500 yd3, which is like the net loss between 2011 and 2023 (table 7). The frequency distribution of bed elevations in 2010 is like the 2023 frequency distribution at this site (fig. 23). The stone revetment on the right (south) bank has an area of minor to moderate erosion near the upstream end of the study reach and an area of moderate deposition along the toe of the bank (fig. 28); however, much of the bank is within the bounds of uncertainty. Like the 2011 comparison, the scour hole near pier 5 was narrower and shallower in 2023 than it was in the 2010 survey, as indicated by the deposition near the pier. Like the previous DoDs, deposition or scour apparent on opposing faces of piers 5 and 6 is likely caused by minor horizontal positional variances between the surveys (see “Uncertainty Estimation” section; fig. 5).
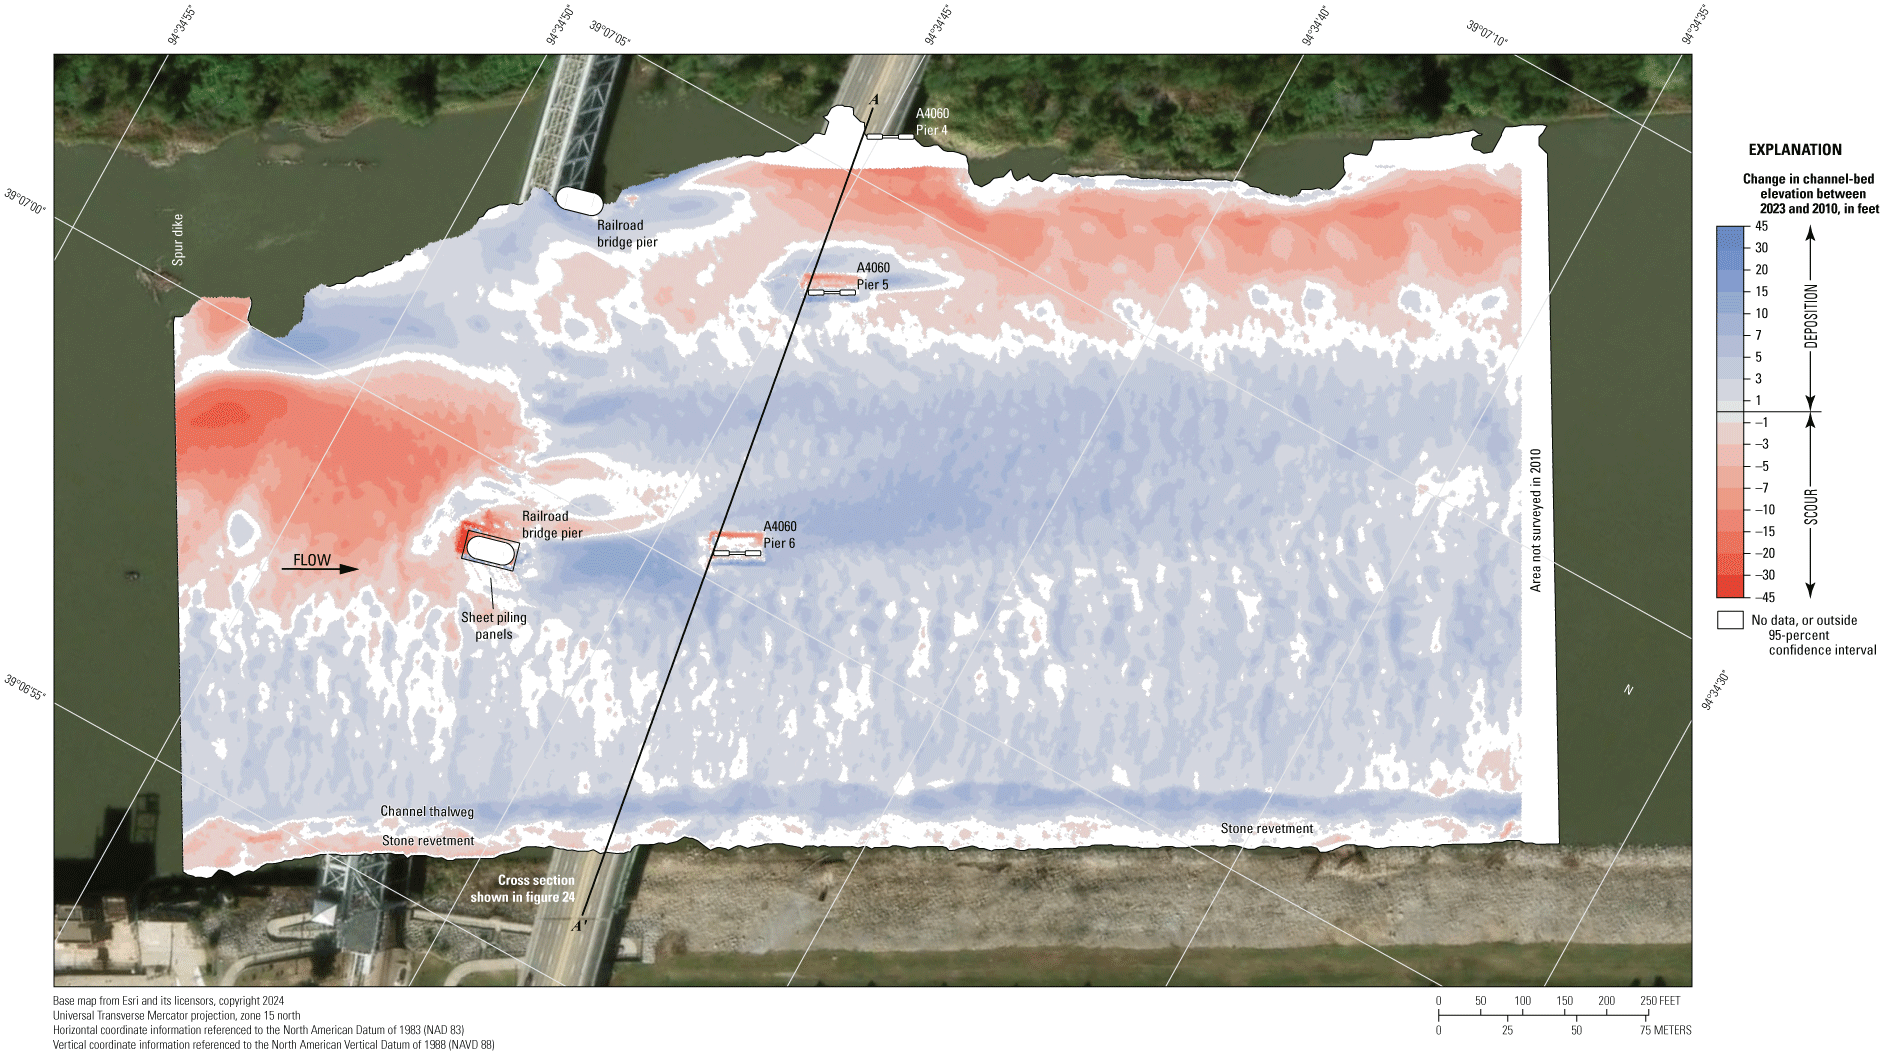
Map showing difference between surfaces created from bathymetric surveys of the Missouri River channel near structure A4060 on State Highway 9 in Kansas City, Missouri, on August 8, 2023, and March 16, 2010, with probabilistic thresholding.
The vertically averaged velocity vectors indicate mostly uniform flow in the reach, but several sections had localized flow disturbances in their direction and magnitude(fig. 29). Velocities ranged from about 2 to 7 ft/s (fig. 29), with lower velocities and more turbulence observed downstream from the railroad bridge piers and upstream spur dike (fig. 29). All the highway bridge piers were aligned to approach flow, minimizing additional wake vortices downstream (fig. 29).
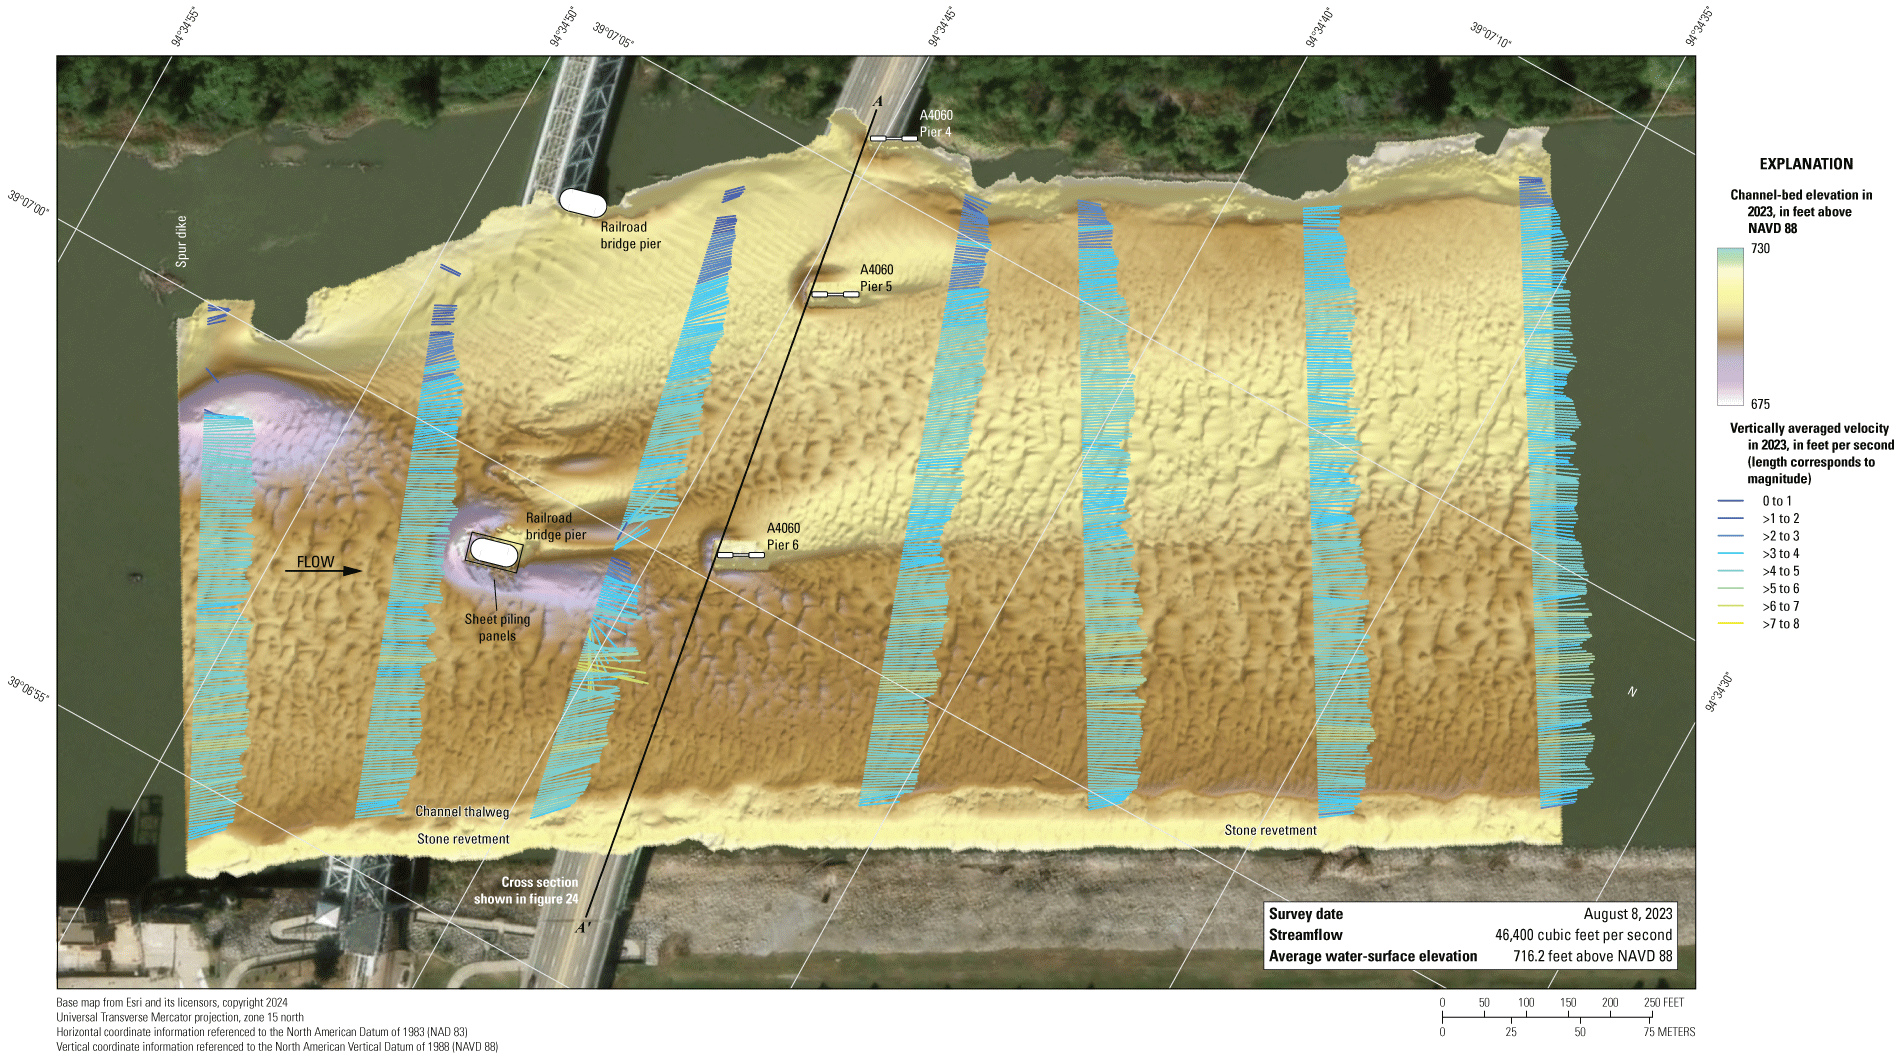
Map showing bathymetry and vertically averaged velocities of the Missouri River channel near structure A4060 on State Highway 9 in Kansas City, Missouri. [NAVD 88, North American Vertical Datum of 1988; >, greater than]
Structure A7650 on Interstate 35
Structure A7650 (site 10; table 2) on Interstate 35 crosses the Missouri River at RM 364.7, immediately north of downtown Kansas City, Mo. (fig. 1), and is about 4,300 ft downstream from structure A4060 on State Highway 9 (site 9). The site was surveyed on August 8, 2023, when the average water-surface elevation of the river in the survey area, determined by the RTK GNSS tide solution, was 715.4 ft (table 5; fig. 30), and streamflow on the Missouri River was about 46,200 ft3/s during the survey (table 5).
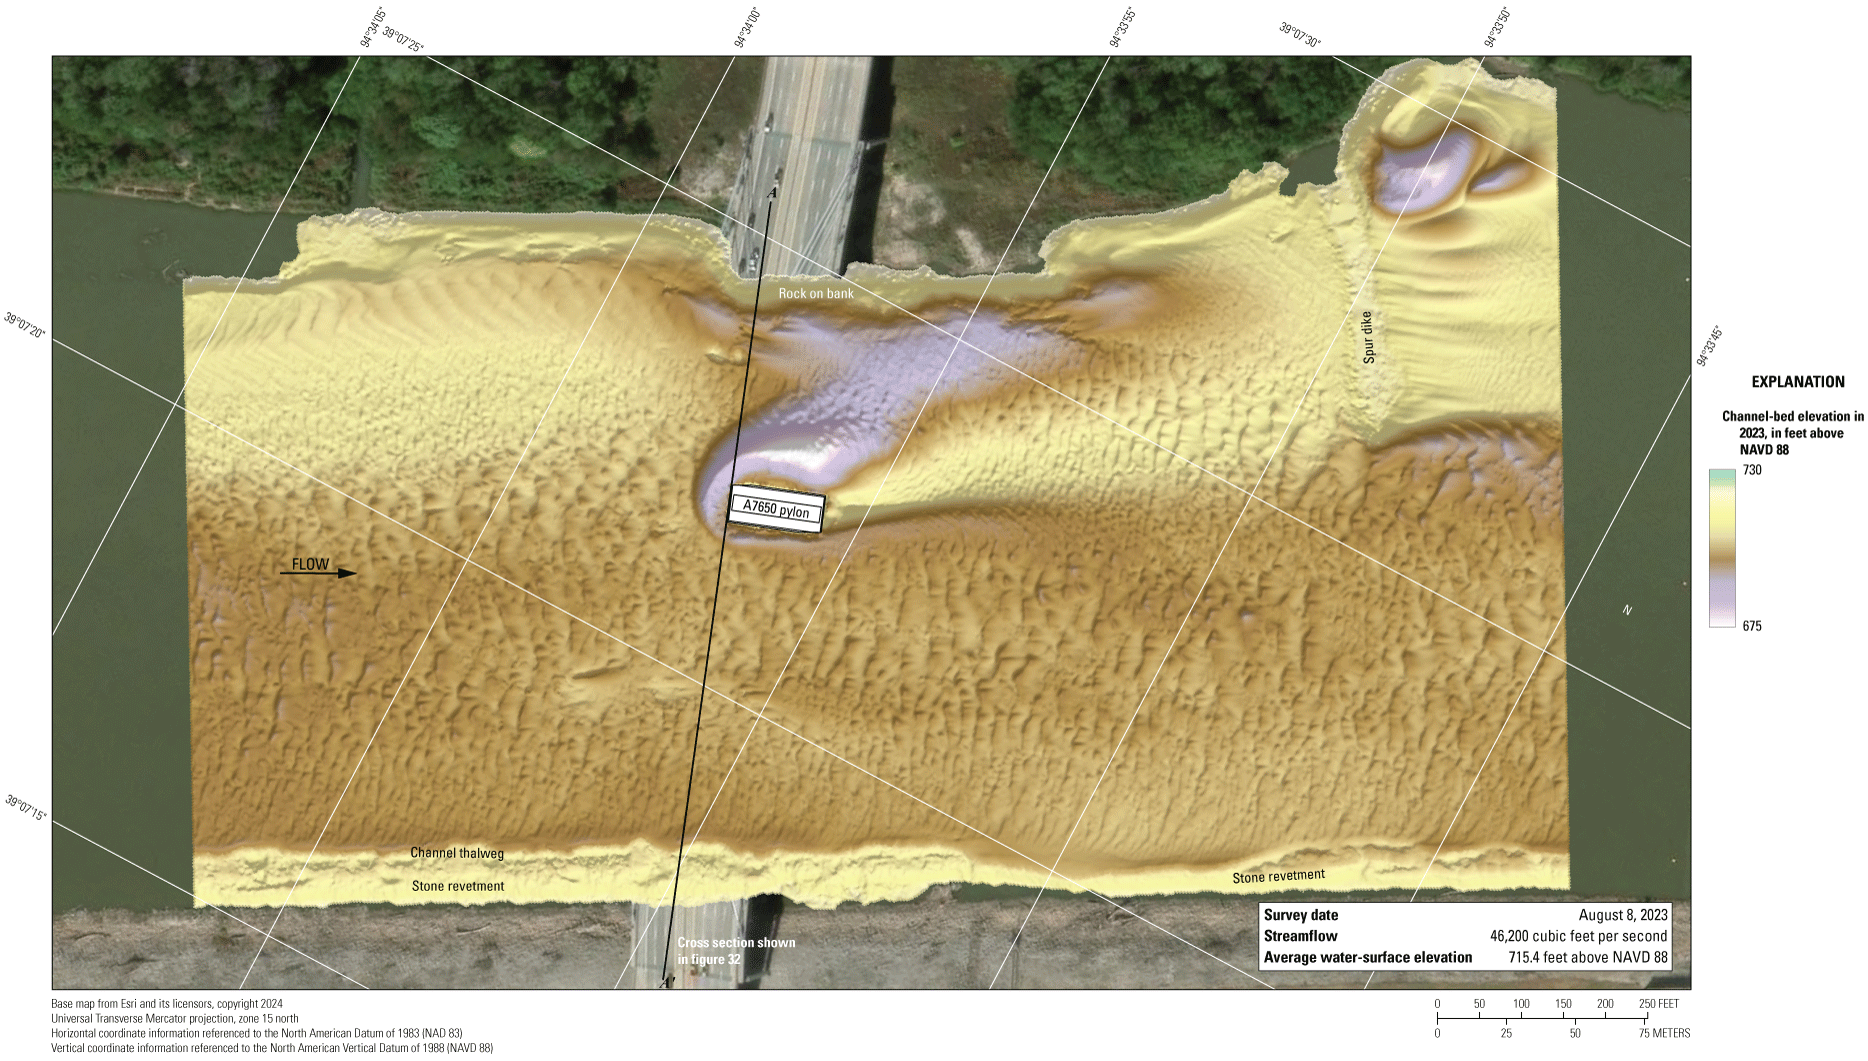
Map showing bathymetric survey of the Missouri River channel near structure A7650 on Interstate 35 in Kansas City, Missouri. [NAVD 88, North American Vertical Datum of 1988]
The survey area was about 1,640 ft long and averaged about 875 ft wide, extending from bank to bank across the main channel (fig. 30). The upstream end of the survey area was about 700 ft upstream from the centerline of structure A7650 at the main channel pylon (fig. 30). The channel-bed elevations in 2023 ranged from about 694 to 707 ft in height for most of the surveyed area (5 to 95 percentile range of the bathymetric data; table 5; fig. 31), except near the pylon and downstream from the spur dikes on the downstream left (north) bank (fig. 30; table 5). The channel is generally deeper on the right (south) side of the reach, and there is not a well-defined thalweg (fig. 30). The channel is filled with small dunes and ripples throughout the reach (fig. 30). As in previous surveys (Huizinga, 2012, 2016, 2022a), a stone revetment was on the right (south) bank throughout the reach (fig. 30).
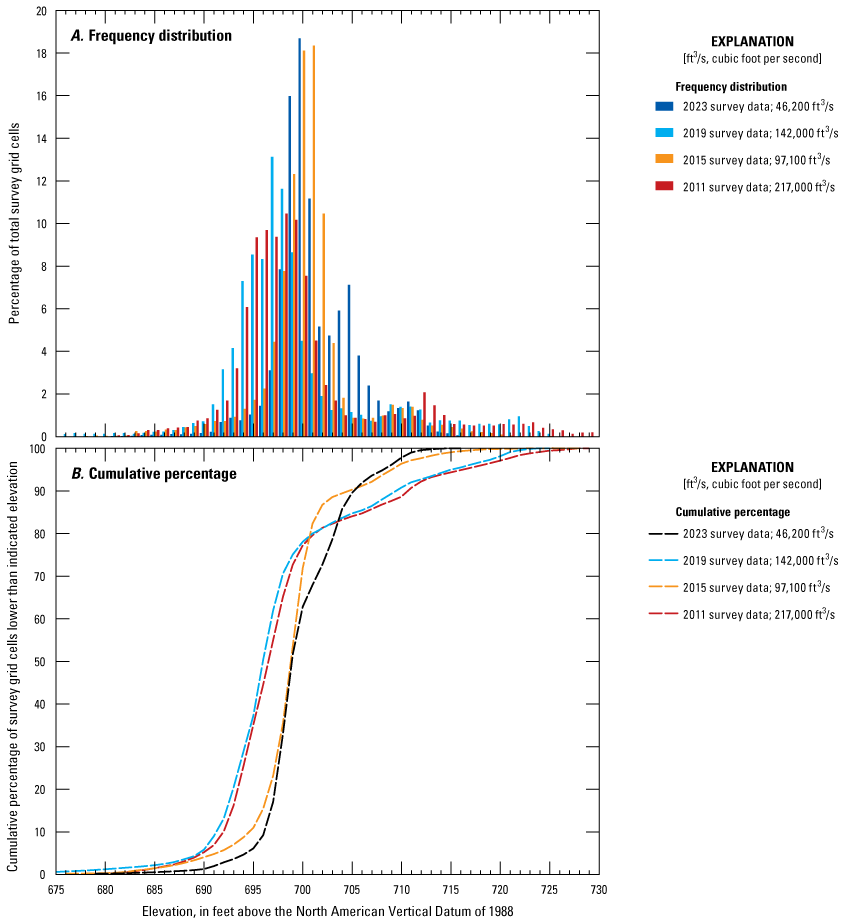
Graphs showing (A) frequency distribution and (B) cumulative percent of bed elevations for bathymetric survey grid cells in 1-foot elevation bins from a survey on the Missouri River near structure A7650 on Interstate 35 in Kansas City, Missouri, on August 8, 2023, compared with previous surveys in 2011, 2015, and 2019 (Huizinga, 2012, 2016, and 2022a, respectively).
Like previous surveys at this site (Huizinga, 2012, 2016, 2022a), the main channel pylon appears surrounded by piles of rock riprap that serve as a scour countermeasure. The local minimum channel-bed elevation is about 679 ft near the downstream left (north) corner of the study area (table 6; fig. 30; fig. 1.4), which is the minimum channel-bed elevation in the reach at this site (table 5). Although the pylon is skewed about 15 degrees to approaching flow (table 6), with impinging flow on the right (south) side, the scour hole is deeper and longer on the leeward left (north) side, likely because of the contraction and deflection of flow from the protrusion on the left (north) bank (fig. 30). At the upstream face, the scour hole is about 14 ft below the average channel elevation upstream from the pylon (fig. 30, fig. 1.4; table 6). The top of the riprap around the upstream face of the pylon was at an elevation of about 697 ft, which is slightly below the elevation of the bottom of the pylon seal course of 699.50 ft (table 6); the top of the riprap along the sides of the pylon is lower than at the upstream face (fig. 30 and fig. 32; fig. 1.4). The minimum channel-bed elevation near the pylon was about 20 ft below the elevation of the bottom of the pylon seal course (fig. 30; table 6). Information from bridge plans indicates that the pylon is founded on shafts drilled 32 ft into bedrock, with about 32 ft of bed material between the bottom of the scour hole and bedrock (fig. 32; table 6).
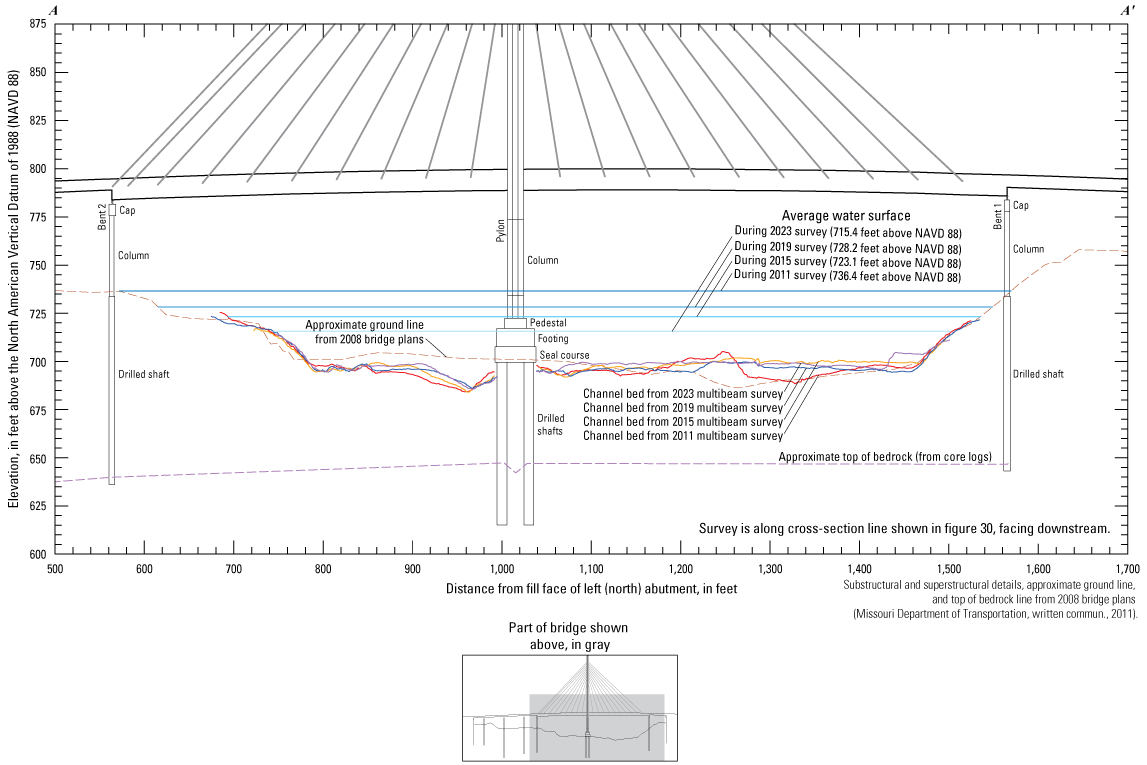
Diagram showing key features, substructural and superstructural details, and surveyed channel bed of structure A7650 on Interstate 35 crossing the Missouri River in Kansas City, Missouri.
The difference between the surveys on August 8, 2023, and August 14, 2019 (fig. 33), indicates about 94 percent of the joint area of interest had detectable change, which means only about 6 percent of the differences in the joint area of interest are equivocal and within the bounds of uncertainty (table 7). Deposition appears dominant throughout the reach between 2019 and 2023 in the DoD, with localized erosion in the upstream right (south) part of the channel, along the left (north) bank, near the end of and downstream from the spur dike on the downstream left (north) bank, and along the stone revetment along the right (south) bank (fig. 33). The average difference between the bathymetric surfaces was +3.68 ft (table 7), which indicated substantial aggradation of the reach between the 2019 and 2023 surveys. The net volume of cut in the reach from 2019 to 2023 was about 18,600 yd3, and the net volume of fill was about 189,100 yd3, resulting in a net gain of about 170,500 yd3 of sediment between 2019 and 2023, which is the second highest gain of all the comparisons of the bridges in the Kansas City area (table 7). The scour hole near the pylon was slightly deeper on the left (north) side and slightly shallower on the right (south) side in 2023 than in 2019, and the riprap around the pylon appeared to be slightly lower to equivocal with uncertainty in 2023 than in 2019 (fig. 32; fig. 33). The frequency distribution of bed elevations in 2023 is more like 2015 than 2019, but with a higher percentage of cells in the range of 703 to 708 ft than 2015 (fig. 31). The stone revetment along the right (south) bank showed substantial deposition upstream along the toe of the bank and immediately downstream from the bridge in the upstream 60 percent of the reach (fig. 33), which is also evident in the cross section (fig. 32). Farther downstream from the bridge, localized signs of minor scour and deposition are apparent, but most of the indicated changes are within 1–3 ft of the 2019 elevation or within the bounds of uncertainty (fig. 33). Differences on the top of the spur dike were also within the bounds of uncertainty.
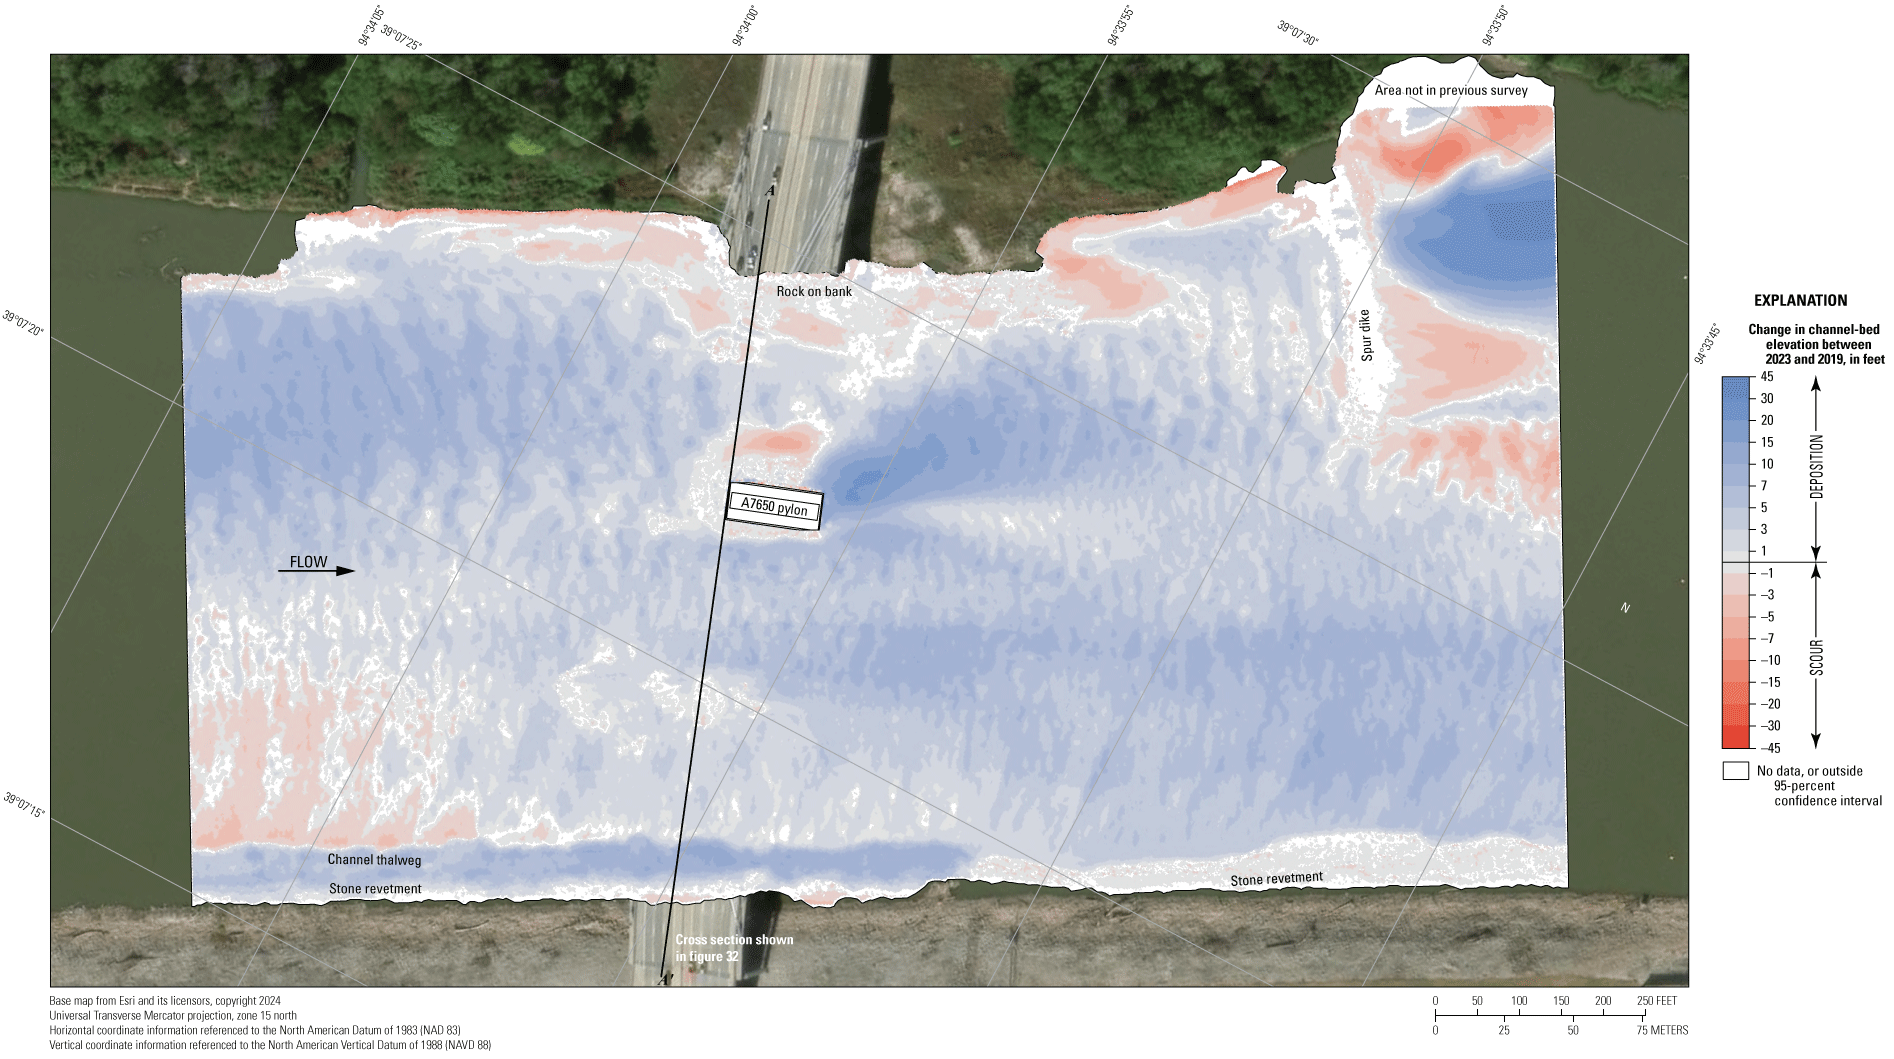
Map showing difference between surfaces created from bathymetric surveys of the Missouri River channel near structure A7650 on Interstate 35 in Kansas City, Missouri, on August 8, 2023, and August 14, 2019, with probabilistic thresholding.
The difference between the surveys on August 8, 2023, and June 3, 2015 (fig. 34), indicates about 78 percent of the joint area of interest had detectable change, which means about 22 percent of the differences in the joint area of interest are equivocal and within the bounds of uncertainty (table 7). Deposition and erosion appear roughly balanced throughout most of the reach between 2015 and 2023 in the DoD, with deposition primarily on the left (north) side and erosion primarily on the right (south) side of the channel (fig. 34). The average difference between the bathymetric surfaces was +1.06 ft (table 7), indicating moderate channel aggradation between the 2015 and 2023 surveys, and the net gain of sediment between 2015 and 2023 was about 38,900 yd3 (table 7). The scour hole near the pylon was generally shallower in 2023 than in 2015, as indicated by the horseshoe-shaped area of deposition around the nose of the pylon; however, the deepest part of the scour hole on the downstream left (north) side was deeper in 2023 (fig. 34). As noted in the previous paragraph, the frequency distribution of bed elevations in 2023 is most like 2015 (fig. 31). Also, as noted in the previous paragraph, there was deposition along the toe of the stone revetment on the right (south) bank in the upstream 60 percent of the reach; other differences to the stone revetment downstream appear to be erosional or within the bounds of uncertainty (fig. 34). Observed differences on the spur dike of the downstream left (north) bank are generally within the bounds of uncertainty, as are most of the differences to the riprap piled around the pylon and on the left (north) bank under the bridge (fig. 34). Upstream and downstream from the bridge, the left (north) bank appears to have experienced some lateral migration between 2015 and 2023, as indicated by the increasing depth of erosion as one moves towards the bank (fig. 34).
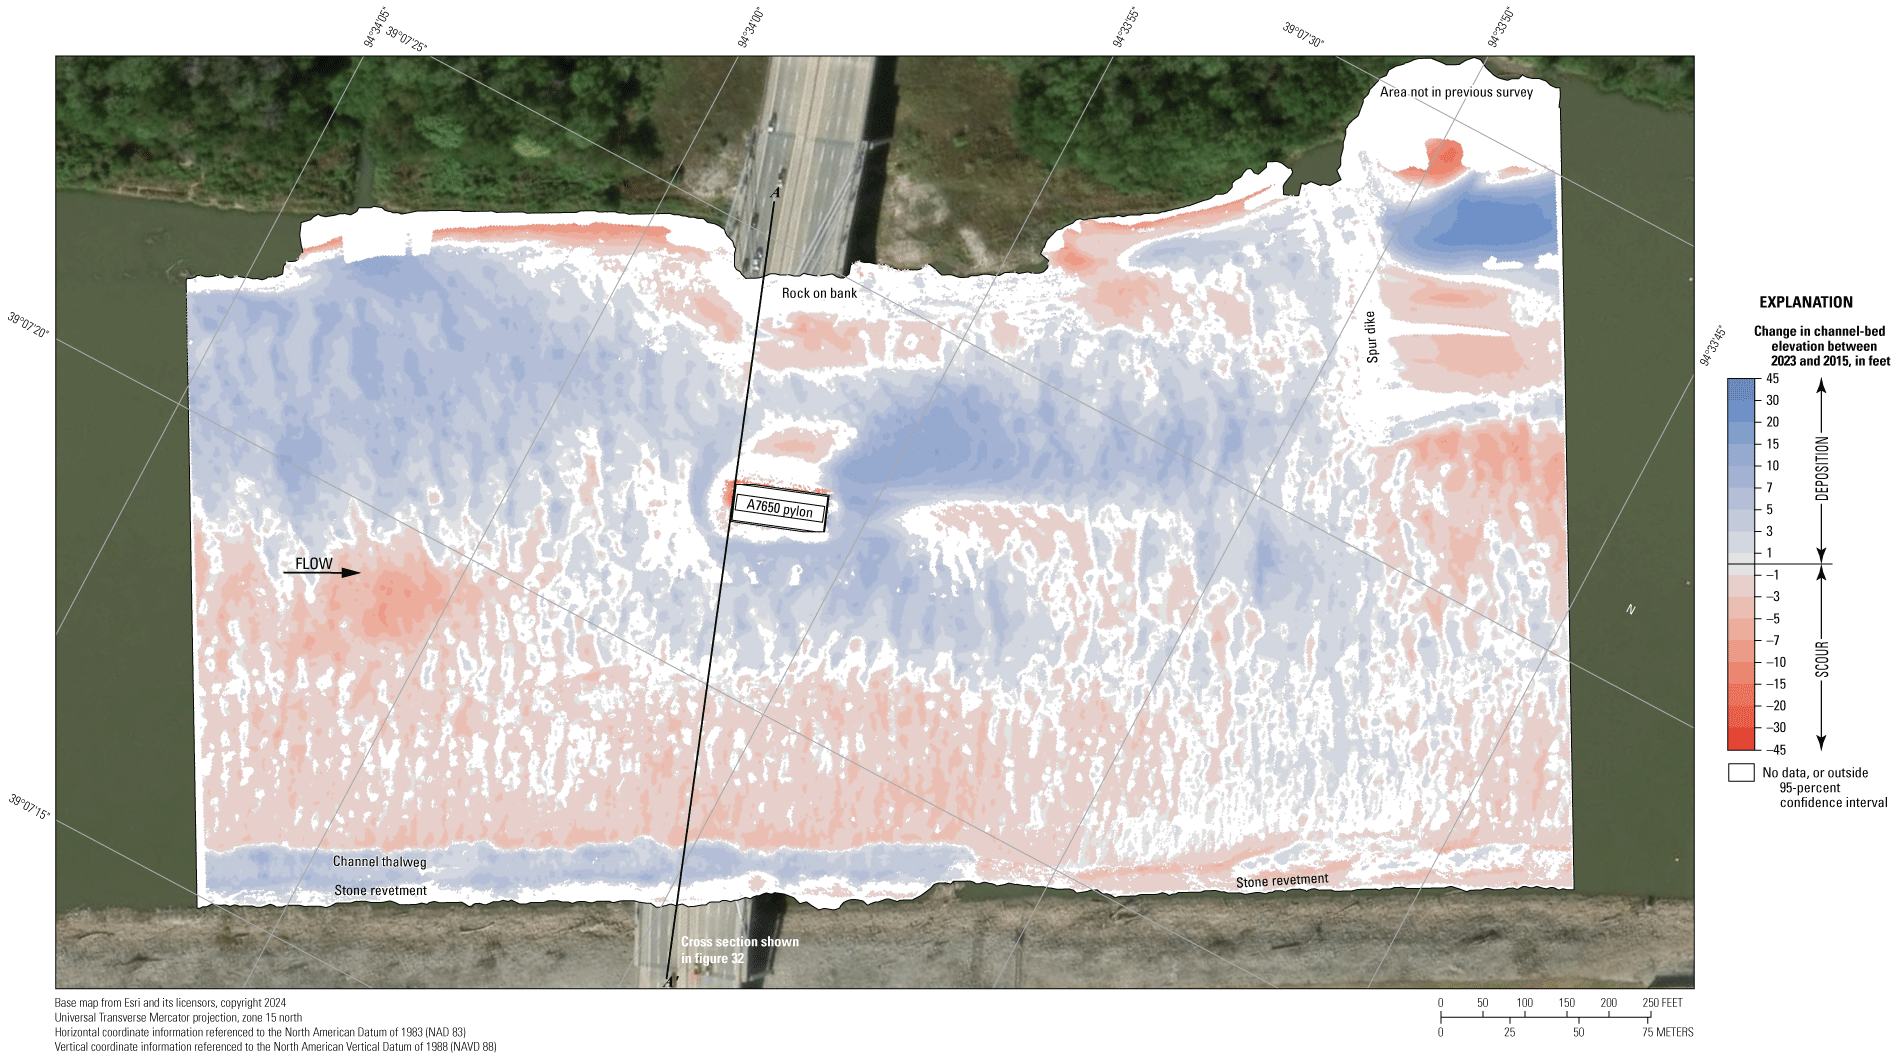
Map showing difference between surfaces created from bathymetric surveys of the Missouri River channel near structure A7650 on Interstate 35 in Kansas City, Missouri, on August 8, 2023, and June 3, 2015, with probabilistic thresholding.
The difference between the surveys on August 8, 2023, and the earliest during flooding on July 17, 2011 (fig. 35), indicates about 85 percent of the joint area of interest had detectable change, which means about 15 percent of the differences in the joint area of interest are equivocal and within the bounds of uncertainty (table 7). Deposition appears dominant throughout most of the reach between 2011 and 2023 in the DoD, with localized moderate to substantial erosion along the left (north) bank and downstream from the spur dike (fig. 35). The average difference between the bathymetric surfaces between surveys was +3.18 ft (table 7), indicating substantial aggradation of the reach between the 2011 and 2023 surveys, with a net gain of sediment of about 126,200 yd3 (table 7). The scour hole near the pylon was generally shallower in 2023 than in 2011, as indicated by the horseshoe-shaped area of deposition around the riprap around the nose of the pylon; however, as in other survey comparisons, the deepest part of the scour hole on the downstream left (north) side was deeper in 2023, and the riprap around the pylon appears to have subsided (fig. 32 and fig. 35), as was observed in the previous study (Huizinga, 2022a). As noted in the previous paragraphs, there was deposition along the toe of the stone revetment on the right (south) bank in the upstream 60 percent of the reach, whereas only minor to moderate erosion was observed downstream (fig. 35). Observed differences on the top of the spur dike on the downstream left (north) bank were generally within the bounds of uncertainty, but minor erosion was evident on the upstream face (fig. 35). The rock on the left (north) bank under the bridge had differences also, but they were generally within the bounds of the uncertainty (fig. 35). As in the previous comparison at this site, the left (north) bank upstream and downstream from the bridge appears to have experienced lateral migration between 2011 and 2023, as indicated by the increasing depth of erosion as one moves towards the bank (fig. 35).
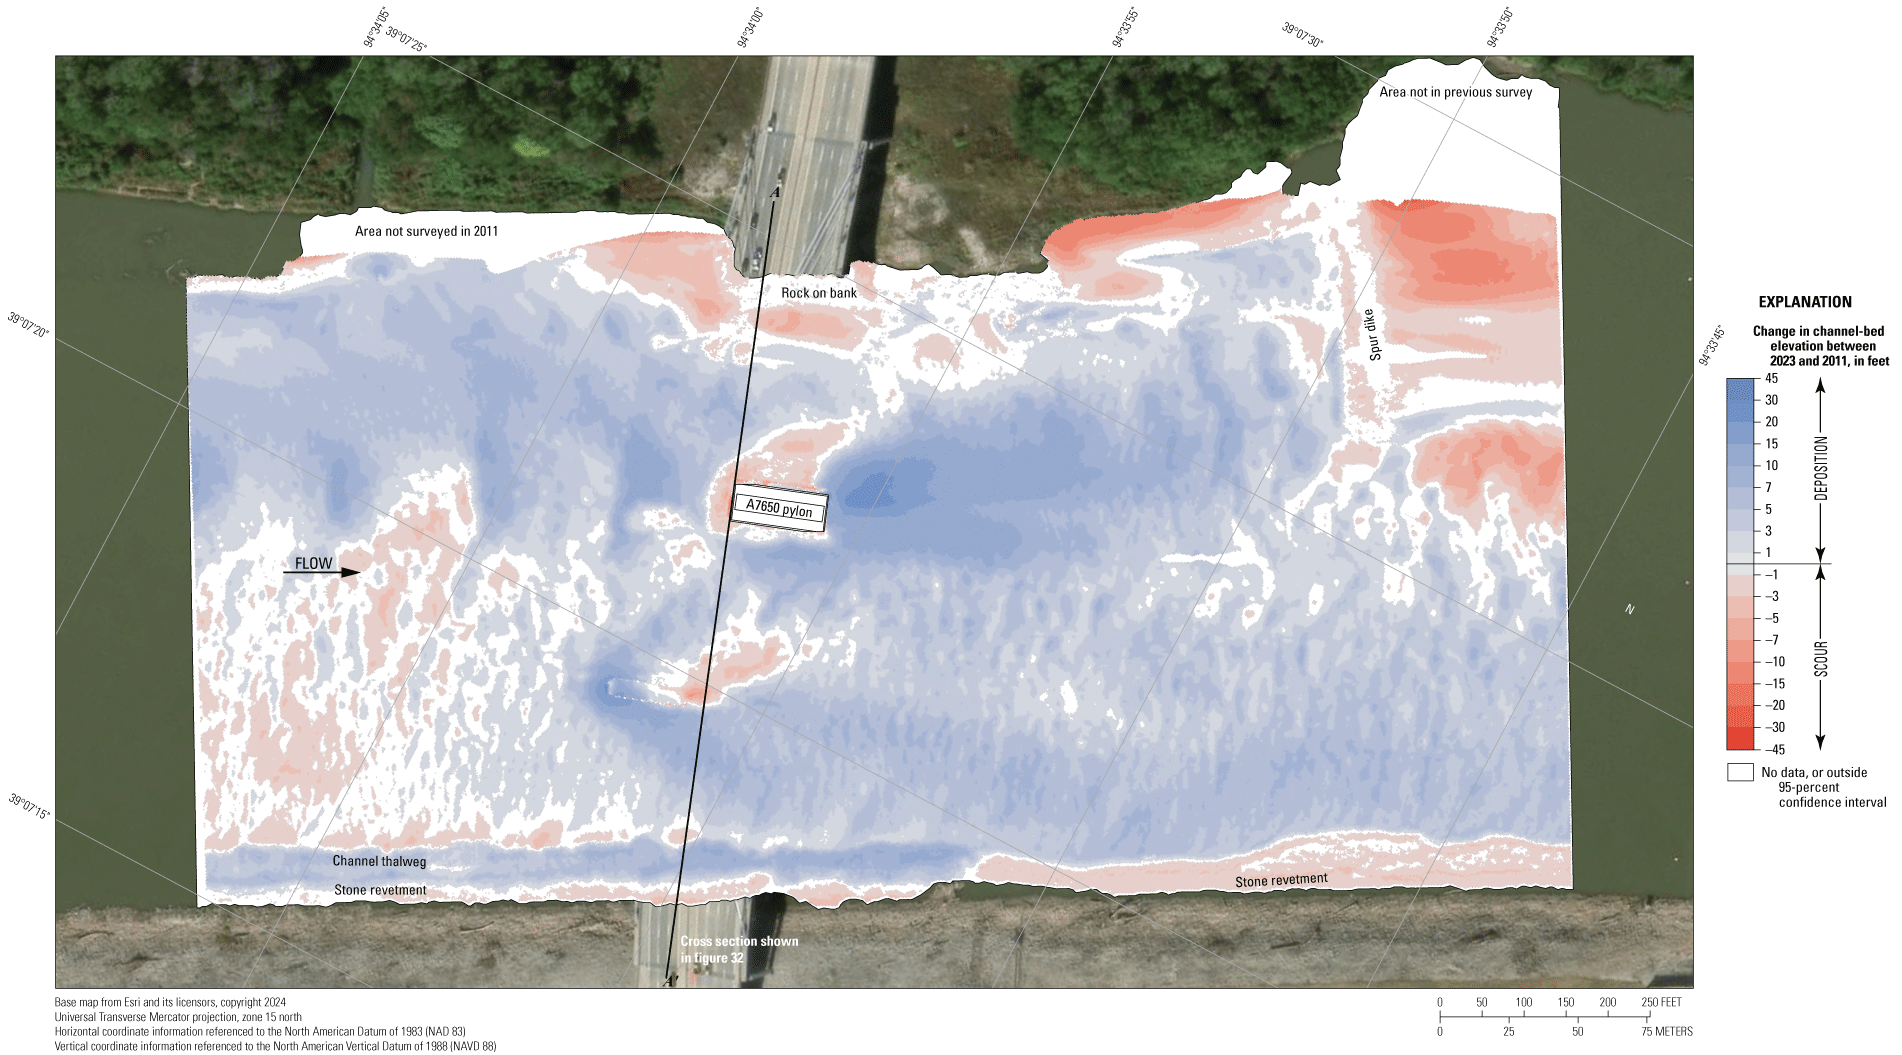
Map showing difference between surfaces created from bathymetric surveys of the Missouri River channel near structure A7650 on Interstate 35 in Kansas City, Missouri, on August 8, 2023, and July 17, 2011, with probabilistic thresholding.
The vertically averaged velocity vectors indicate mostly uniform flow in the reach, with velocities ranging from about 2 to 6 ft/s (fig. 36). The pylon is skewed about 15 degrees to approach flow and creates substantial turbulence downstream (fig. 36). The spur dike also causes flow disturbance, and a reduction of flow velocity downstream (fig. 36).
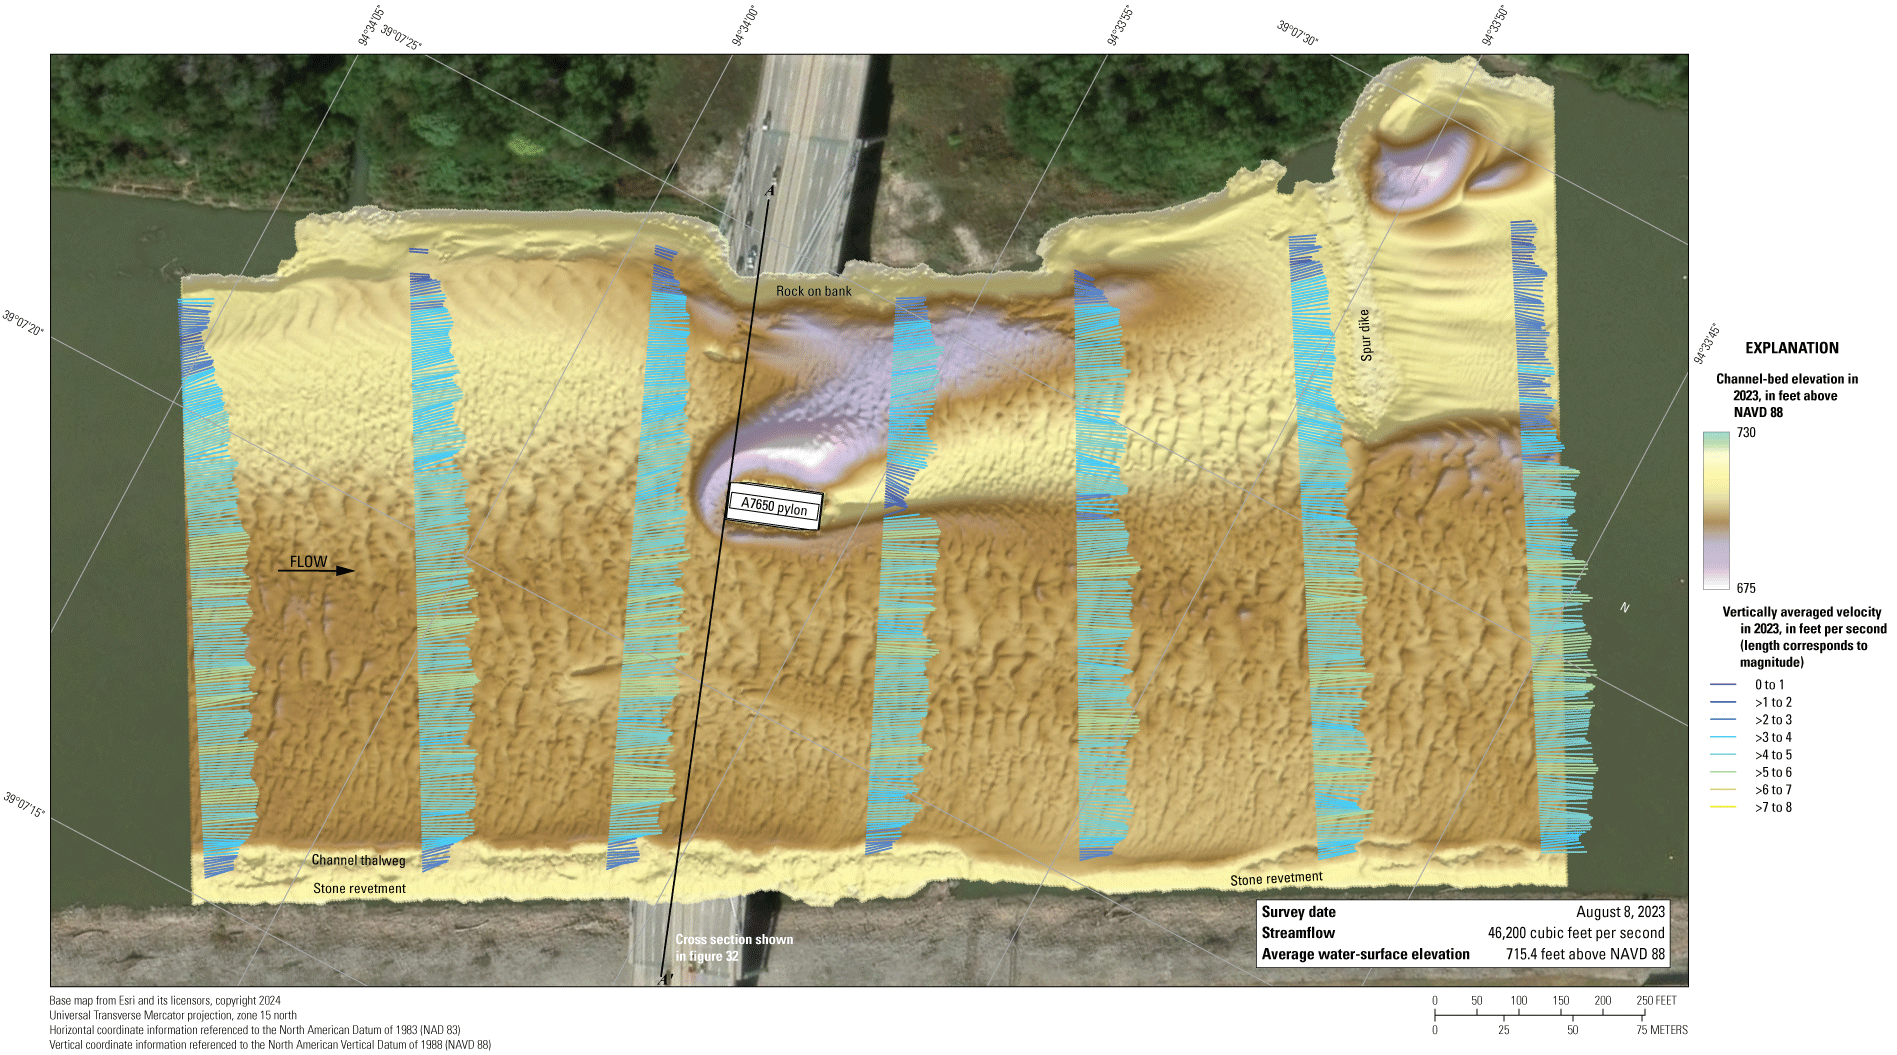
Map showing bathymetry and vertically averaged velocities of the Missouri River channel near structure A7650 on Interstate 35 in Kansas City, Missouri. [NAVD 88, North American Vertical Datum of 1988; >, greater than]
Structure A5817 on State Highway 269
Structure A5817 (site 11; table 2) on State Highway 269 crosses the Missouri River at RM 362.3, northeast of downtown Kansas City, Mo. (fig. 1). The site was surveyed on August 9, 2023, when the average water-surface elevation near the bridge, determined by the RTK GNSS tide solution, was 713.3 ft (table 5; fig. 37) and streamflow on the Missouri River was about 46,700 ft3/s during the survey (table 5).
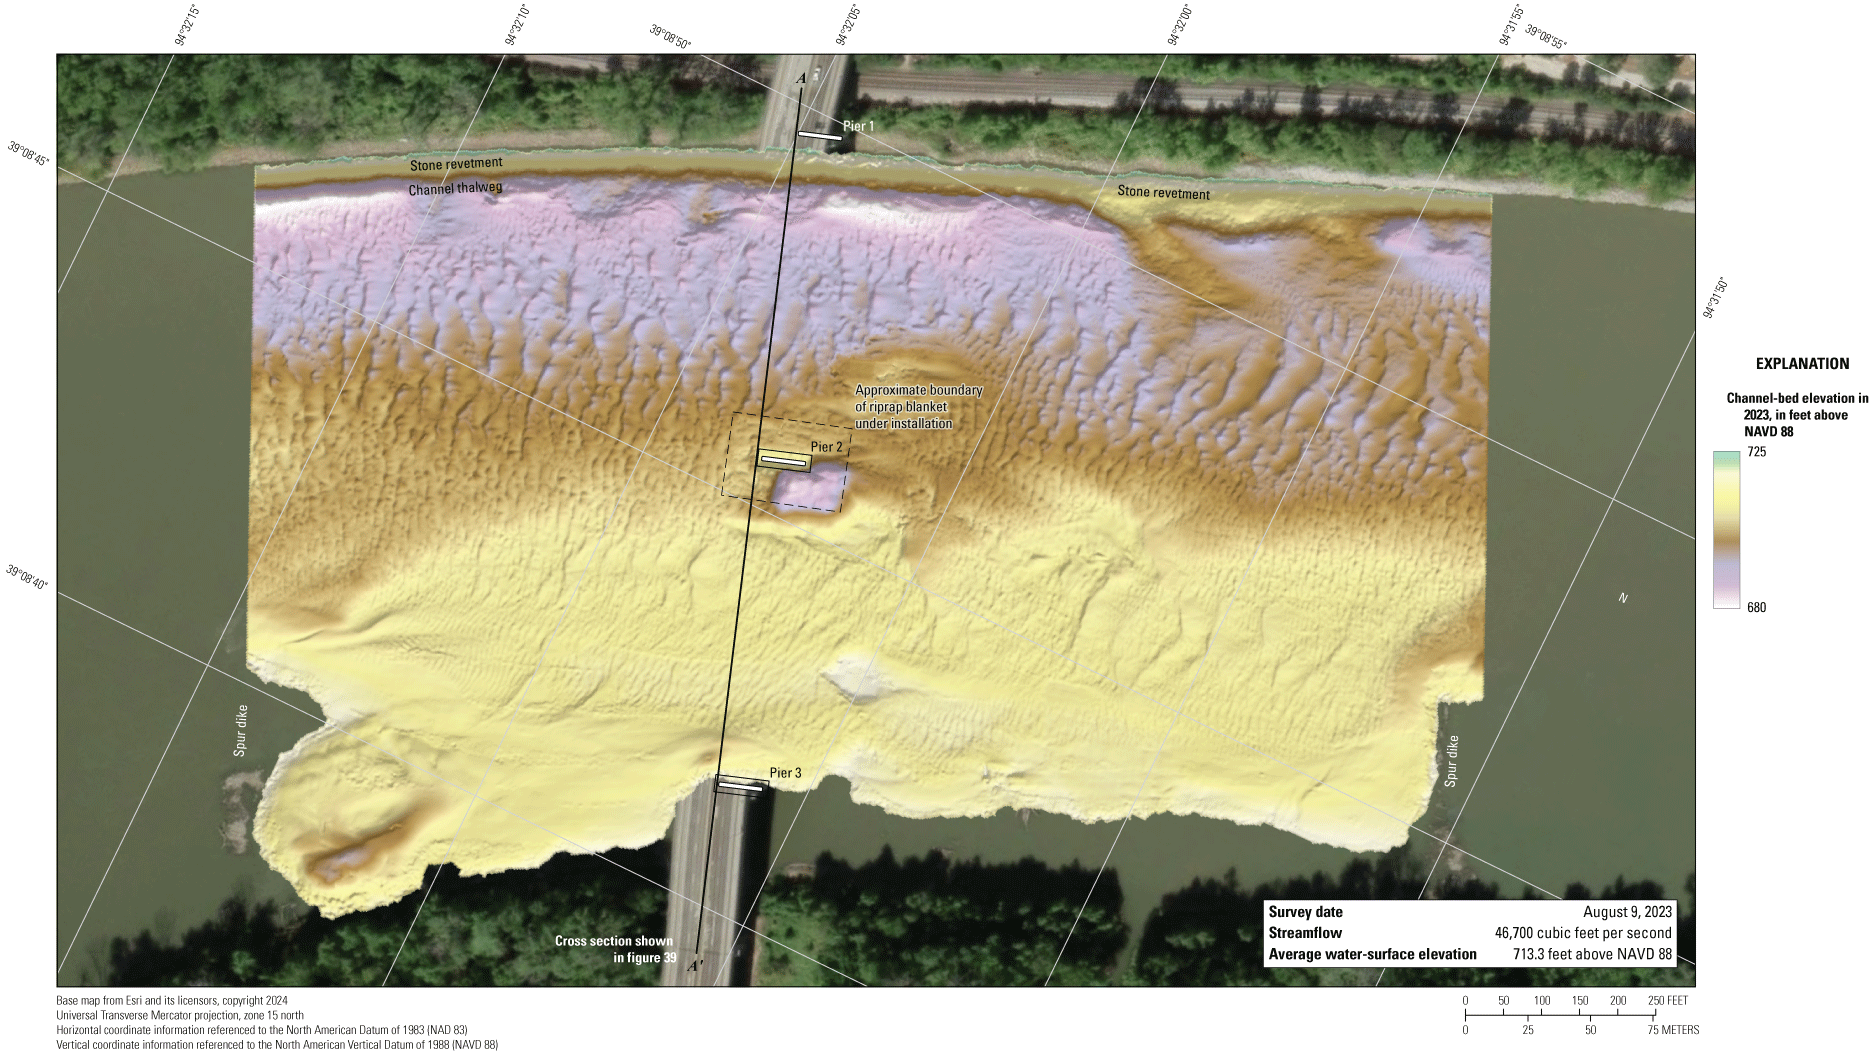
Map showing bathymetric survey of the Missouri River channel near structure A5817 on State Highway 269 in Kansas City, Missouri. [NAVD 88, North American Vertical Datum of 1988]
The survey area was about 1,640 ft long and averaged about 995 ft wide, extending from bank to bank in the main channel (fig. 37). The upstream end of the survey area was about 670 ft upstream from the centerline of structure A5817 at pier 2 (fig. 37). The channel-bed elevations in 2023 ranged from about 690 to 706 ft for most of the surveyed area (5th to 95th percentile range of the bathymetric data; table 5; fig. 38), except in the well-defined channel thalweg along the left (north) bank and near pier 2 (fig. 37; table 5). Small dunes and ripples were throughout the channel. The area between the spur dikes on the right (south) bank was about 20 ft shallower than the thalweg on the left side of the channel (fig. 37). As in previous surveys (Huizinga, 2010, 2012, 2016, 2022a), a stone revetment was on the left (north) bank throughout the reach (fig. 37). Scour countermeasures in the form of riprap blankets were being installed during the survey, and several construction barges moored near the bridge had to be avoided during the survey.
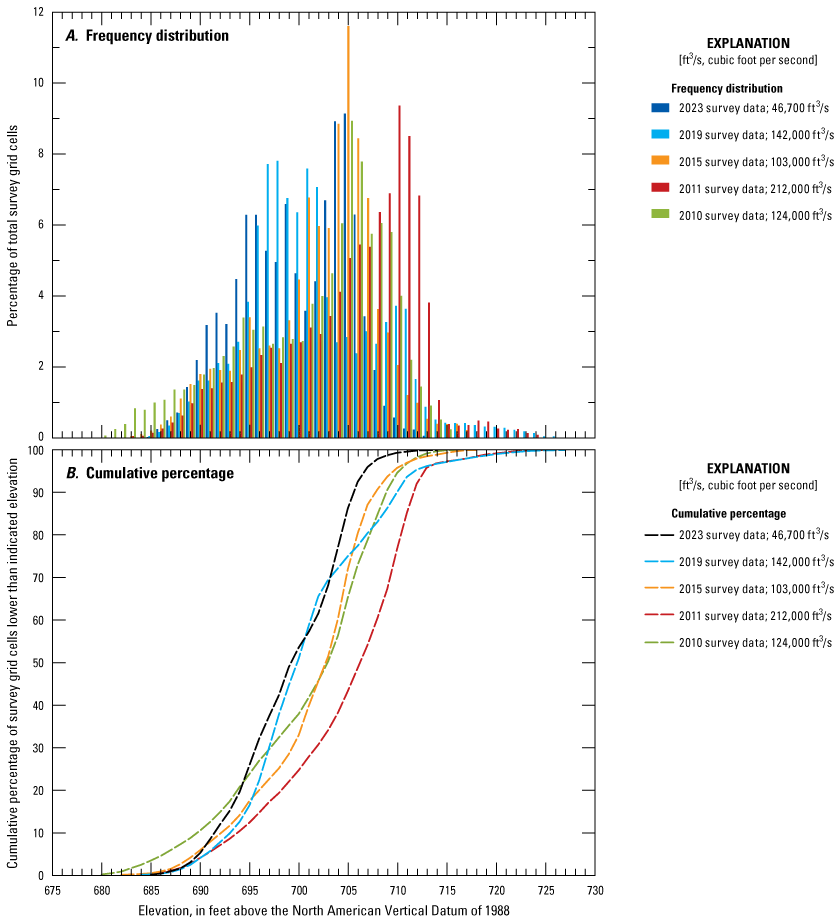
Graphs showing (A) frequency distribution and (B) cumulative percent of bed elevations for bathymetric survey grid cells in 1-foot elevation bins from a survey on the Missouri River near structure A5817 on State Highway 269 in Kansas City, Missouri, on August 9, 2023, compared with previous surveys in 2010, 2011, 2015, and 2019 (Huizinga, 2010, 2012, 2016, and 2022a, respectively).
The historical scour hole near main channel pier 2 was partially mitigated on the upstream side by the riprap blanket being installed during the survey (figs. 37, 39; fig. 1.5); however, a partial scour hole on the downstream right (south) side of pier 2 had a minimum elevation of 686 ft (table 6; fig. 37). This partial scour hole was the result of channel-bed dredging in preparation for the scour countermeasures and was fully mitigated by the completed riprap blanket like the area to the left (north) of the pier (Bryan Hartnagel, Missouri Department of Transportation, written commun., 2023). A minor scour hole was observed near pier 3 (fig. 37), having a minimum channel-bed elevation of about 699 ft, which is about 10 ft above the bottom of the seal course at this pier (table 6). Information from bridge plans indicates that piers 2 and 3 are founded on shafts drilled 20 ft into bedrock, with about 9 ft of bed material between the bottom of the scour hole and bedrock at pier 2 and about 42 ft of material at pier 3 (fig. 39; table 6).
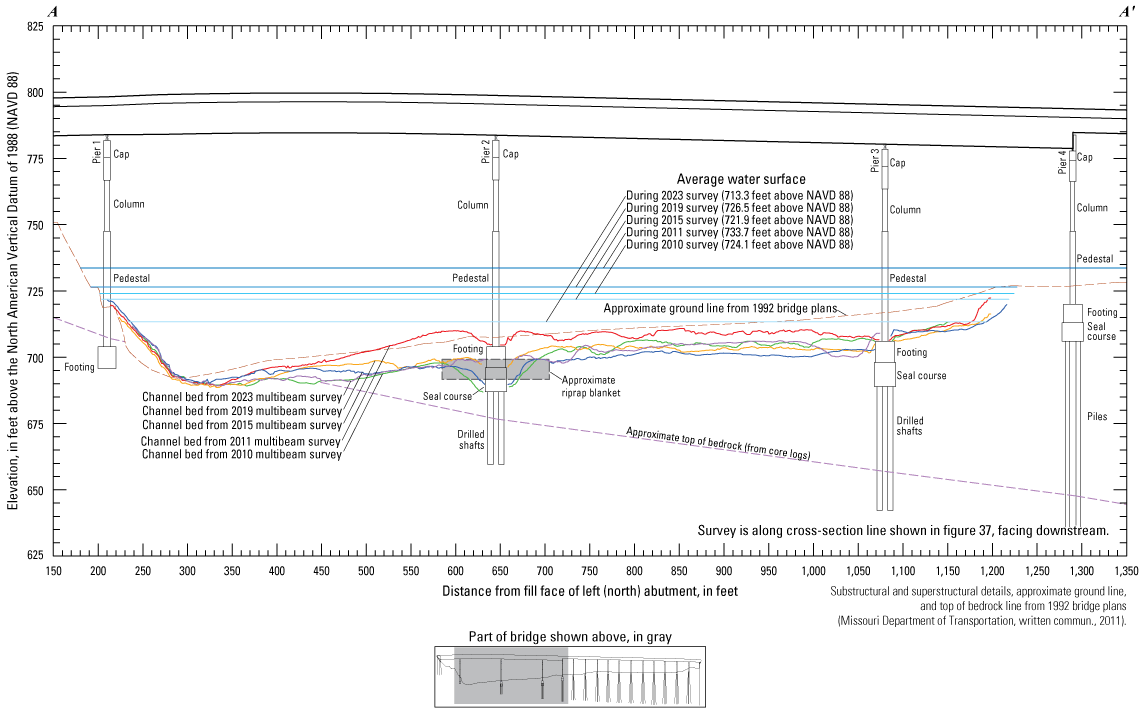
Diagram showing key features, substructural and superstructural details, and surveyed channel bed of structure A5817 on State Highway 269 crossing the Missouri River in Kansas City, Missouri.
The difference between the surveys on August 9, 2023, and August 14, 2019 (fig. 40), indicates about 91 percent of the joint area of interest had detectable change, which means only about 9 percent of the differences in the joint area of interest are equivocal and within the bounds of uncertainty (table 7). Deposition and erosion appear roughly balanced throughout the reach between 2019 and 2023 in the DoD, with alternating areas of erosion and deposition in the area between the left (north) bank and pier 2, primarily deposition between piers 2 and 3, and primarily erosion along the right (south) bank (fig. 40). The scour hole near pier 2 in 2019 has been mostly mitigated by the riprap blanket, except for the substantial “constructed” hole on the downstream right side of the pier (fig. 40). The cross section from along the upstream face of the bridge from the 2023 survey is generally like the lowest cross section from between the left (north) bank and pier 2 and plots among the middle sections between piers 2 and 3 (fig. 39); however, the effect of the riprap blanket around pier 2 is evident. Furthermore, the apparent erosion of the hole dredged for scour countermeasures installation shows that the countermeasures are intended to mitigate scour at a depth beyond the scour observed in the 2019 survey, which had the second deepest hole of all the surveys at pier 2 (fig. 39). The average difference between the bathymetric surfaces was only +0.07 ft (table 7), indicating little-to-no net change between the 2019 and 2023 surveys. The net volume of cut in the reach from 2019 to 2023 was about 44,100 yd3, and the net volume of fill was about 47,600 yd3, resulting in a net gain of only about 3,500 yd3 of sediment between 2019 and 2023, which is the least amount of net change of all the comparisons (table 7). The frequency distribution of bed elevations in 2023 is very similar to the distribution of 2019, but with a slightly higher percentage of cells in the range of 703 to 708 ft (fig. 38). The stone revetment on the left (north) bank showed localized areas of erosion, but nearly all the indicated changes are within 1 ft of the 2019 elevation, or outside the 95-percent confidence interval (fig. 40), and might be the result of a minor positional offset between the surveys (see “Uncertainty Estimation” section; fig. 5).
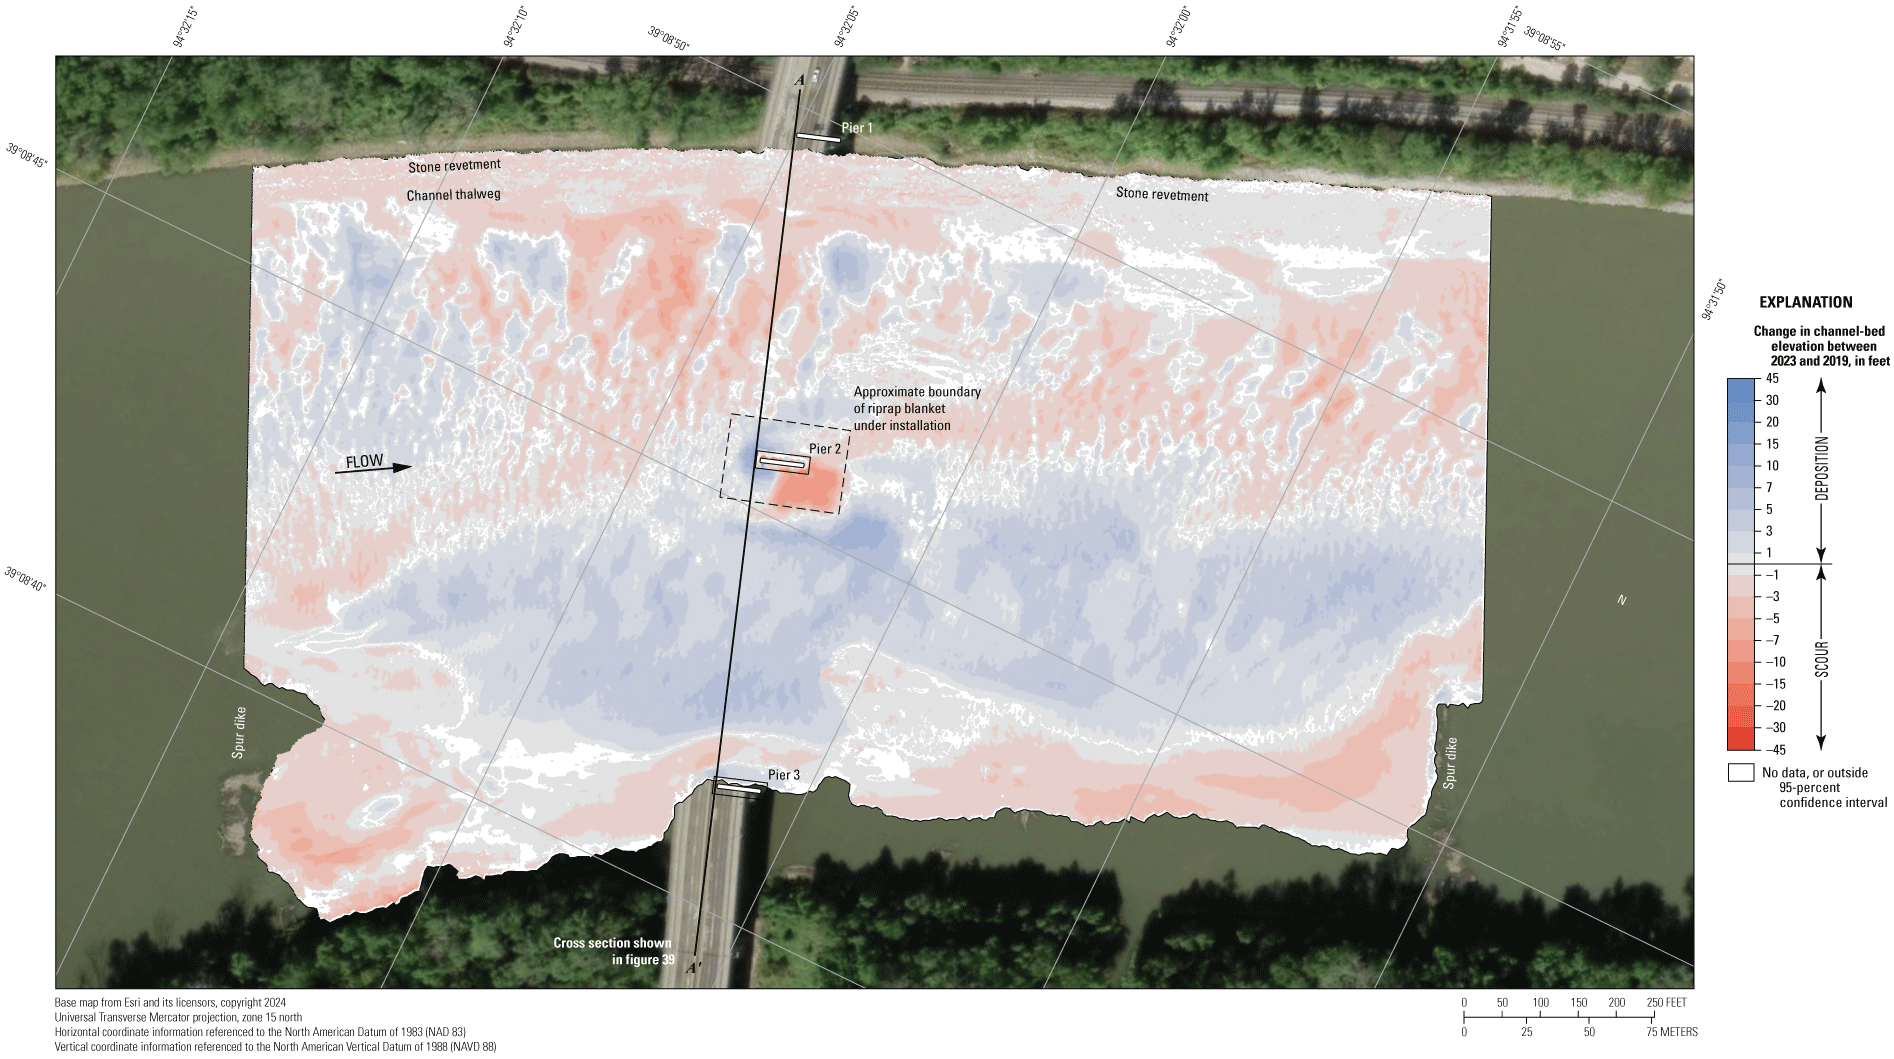
Map showing difference between surfaces created from bathymetric surveys of the Missouri River channel near structure A5817 on State Highway 269 in Kansas City, Missouri, on August 9, 2023, and August 14, 2019, with probabilistic thresholding.
The difference between the surveys on August 9, 2023, and June 3, 2015 (fig. 41), indicates about 79 percent of the joint area of interest had detectable change, which means about 21 percent of the differences in the joint area of interest are equivocal and within the bounds of uncertainty (table 7). Erosion appears dominant throughout the center of the reach between 2015 and 2023 in the DoD, with a balance of erosion and deposition along the left (north) and right (south) edges (fig. 41). Because of this, the dredged hole on the downstream right side of pier 2 is again evident (fig. 41). The average difference between the bathymetric surfaces was –1.88 ft (table 7), indicating moderate to substantial channel degradation between the 2015 and 2023 surveys, and the net loss of sediment between 2015 and 2023 was about 77,000 yd3 (table 7). The frequency distribution of bed elevations in 2023 has more grid cells at lower overall elevations than 2015 (fig. 38). The stone revetment on the left (north) bank showed localized areas of deposition (fig. 41); however, nearly all the indicated changes are within 1 ft of the 2015 elevation, or were equivocal with uncertainty, and may result from minor horizontal positional variances between the surveys (see “Uncertainty Estimation” section; fig. 5).
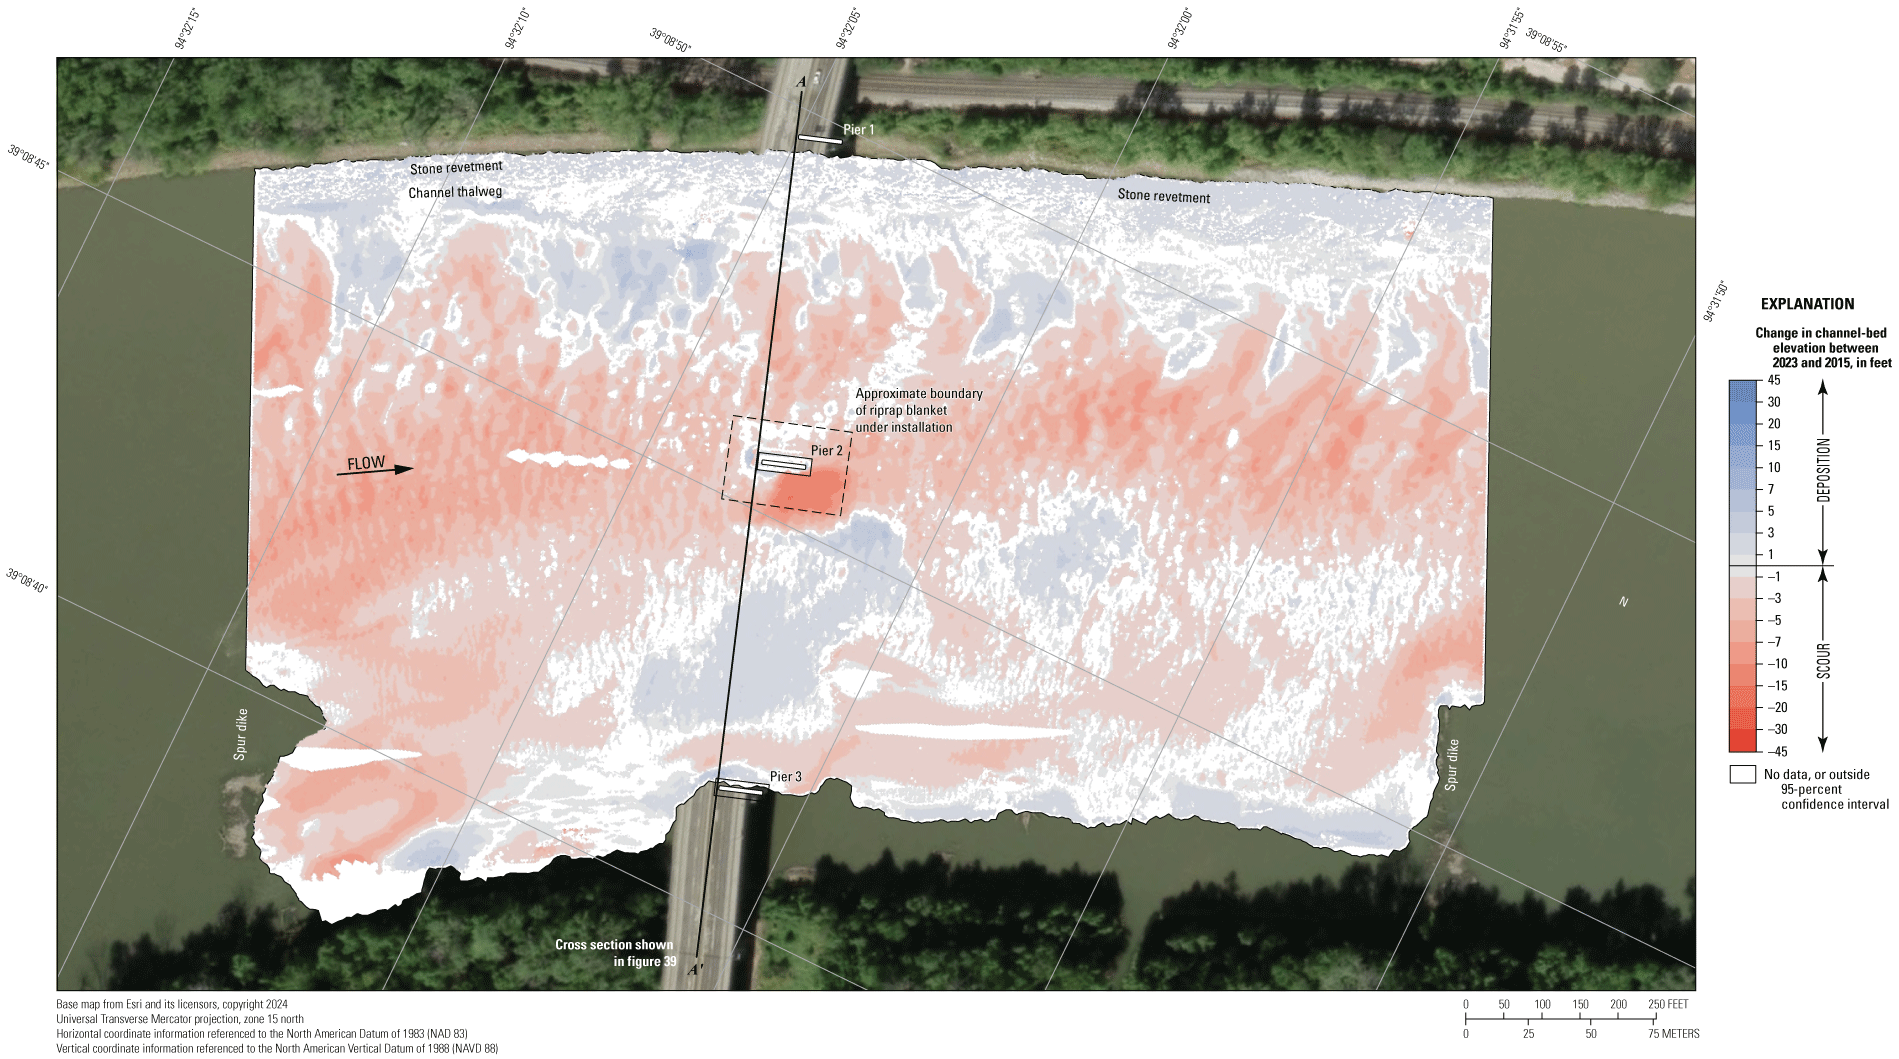
Map showing difference between surfaces created from bathymetric surveys of the Missouri River channel near structure A5817 on State Highway 269 in Kansas City, Missouri, on August 9, 2023, and June 3, 2015, with probabilistic thresholding.
The difference between the surveys on August 9, 2023, and during flooding on July 18, 2011 (fig. 42), indicates about 88 percent of the joint area of interest had detectable change, which means about 12 percent of the differences in the joint area of interest are equivocal and within the bounds of uncertainty (table 7). Erosion appears dominant throughout most of the reach between 2011 and 2023 in the DoD, with localized moderate deposition only in the trough of a single large dune in the 2011 survey (fig. 42). The average difference between the bathymetric surfaces was –5.19 ft, the largest average change in surfaces from all the survey comparisons in this study (table 7), indicating substantial channel degradation between the 2011 and 2023 survey. Furthermore, the net loss of sediment was about –239,400 yd3, the largest net loss of sediment from all the survey comparisons in this study (table 7). Accordingly, the frequency distribution of bed elevations in 2011 differs most from the bed elevations from the 2023 survey, with a higher percentage of cells at a higher elevation than 2023 (fig. 38). As with the other DoDs at this site, the stone revetment on the left (north) bank has localized areas of deposition, but most of the bank is within the bounds of uncertainty (fig. 42). The bed near pier 2 was substantially higher in the 2011 survey (fig. 39), and the effects of the riprap blanket near that pier are less evident (fig. 42).
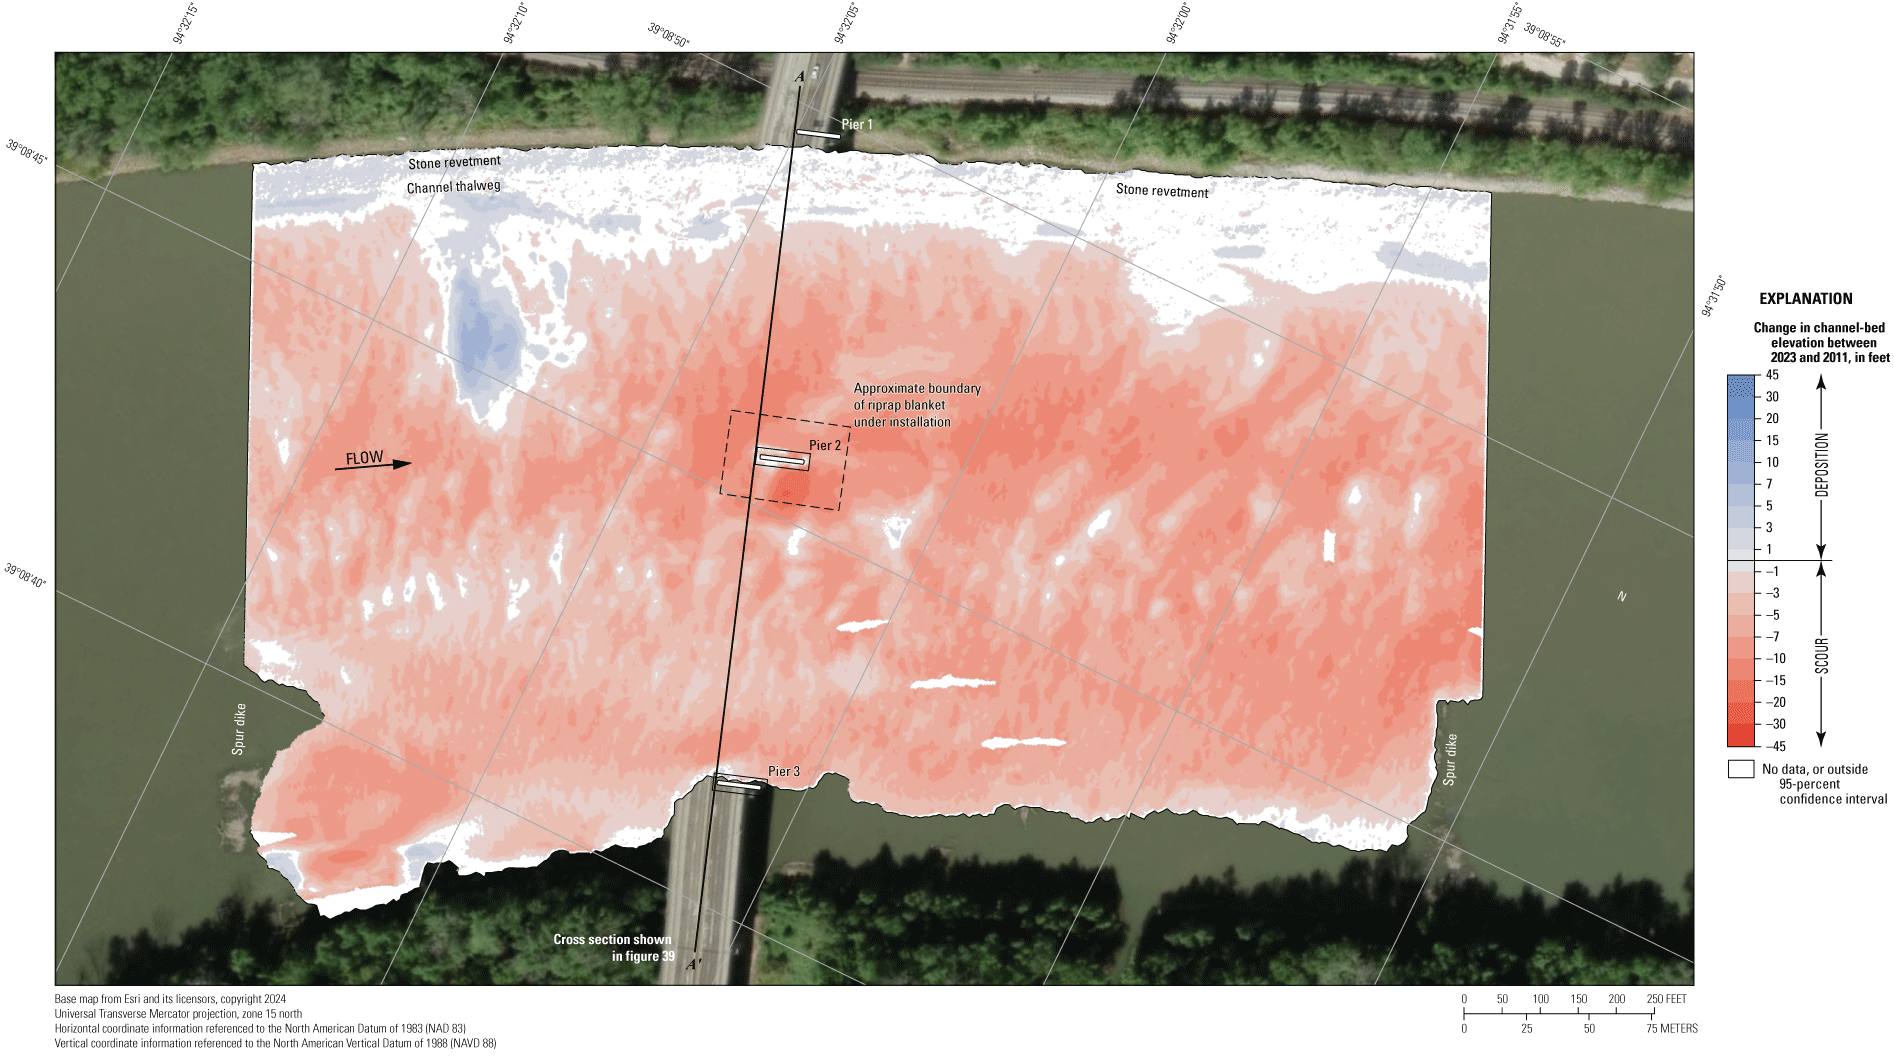
Map showing difference between surfaces created from bathymetric surveys of the Missouri River channel near structure A5817 on State Highway 269 in Kansas City, Missouri, on August 9, 2023, and July 18, 2011, with probabilistic thresholding.
The difference between the surveys on August 9, 2023, and the earliest on March 17, 2010 (fig. 43), indicates about 73 percent of the joint area of interest had detectable change, which means about 27 percent of the differences in the joint area of interest are equivocal and within the bounds of uncertainty (table 7). Erosion again appears dominant throughout most of the reach between 2010 and 2023 in the DoD, but with localized substantial deposition in the thalweg along the left (north) bank (fig. 43). The average difference between the bathymetric surfaces was –1.45 ft (table 7), indicating moderate channel degradation between the 2010 and 2023 surveys, and the net loss of sediment was about 55,000 yd3 (table 7). The stone revetment on the left (north) bank has small areas of erosion, but much of the bank is within the bounds of uncertainty (fig. 43). The dredged hole on the downstream right side of pier 2 is again evident, as is the scour mitigating effects of the riprap blanket (fig. 43).
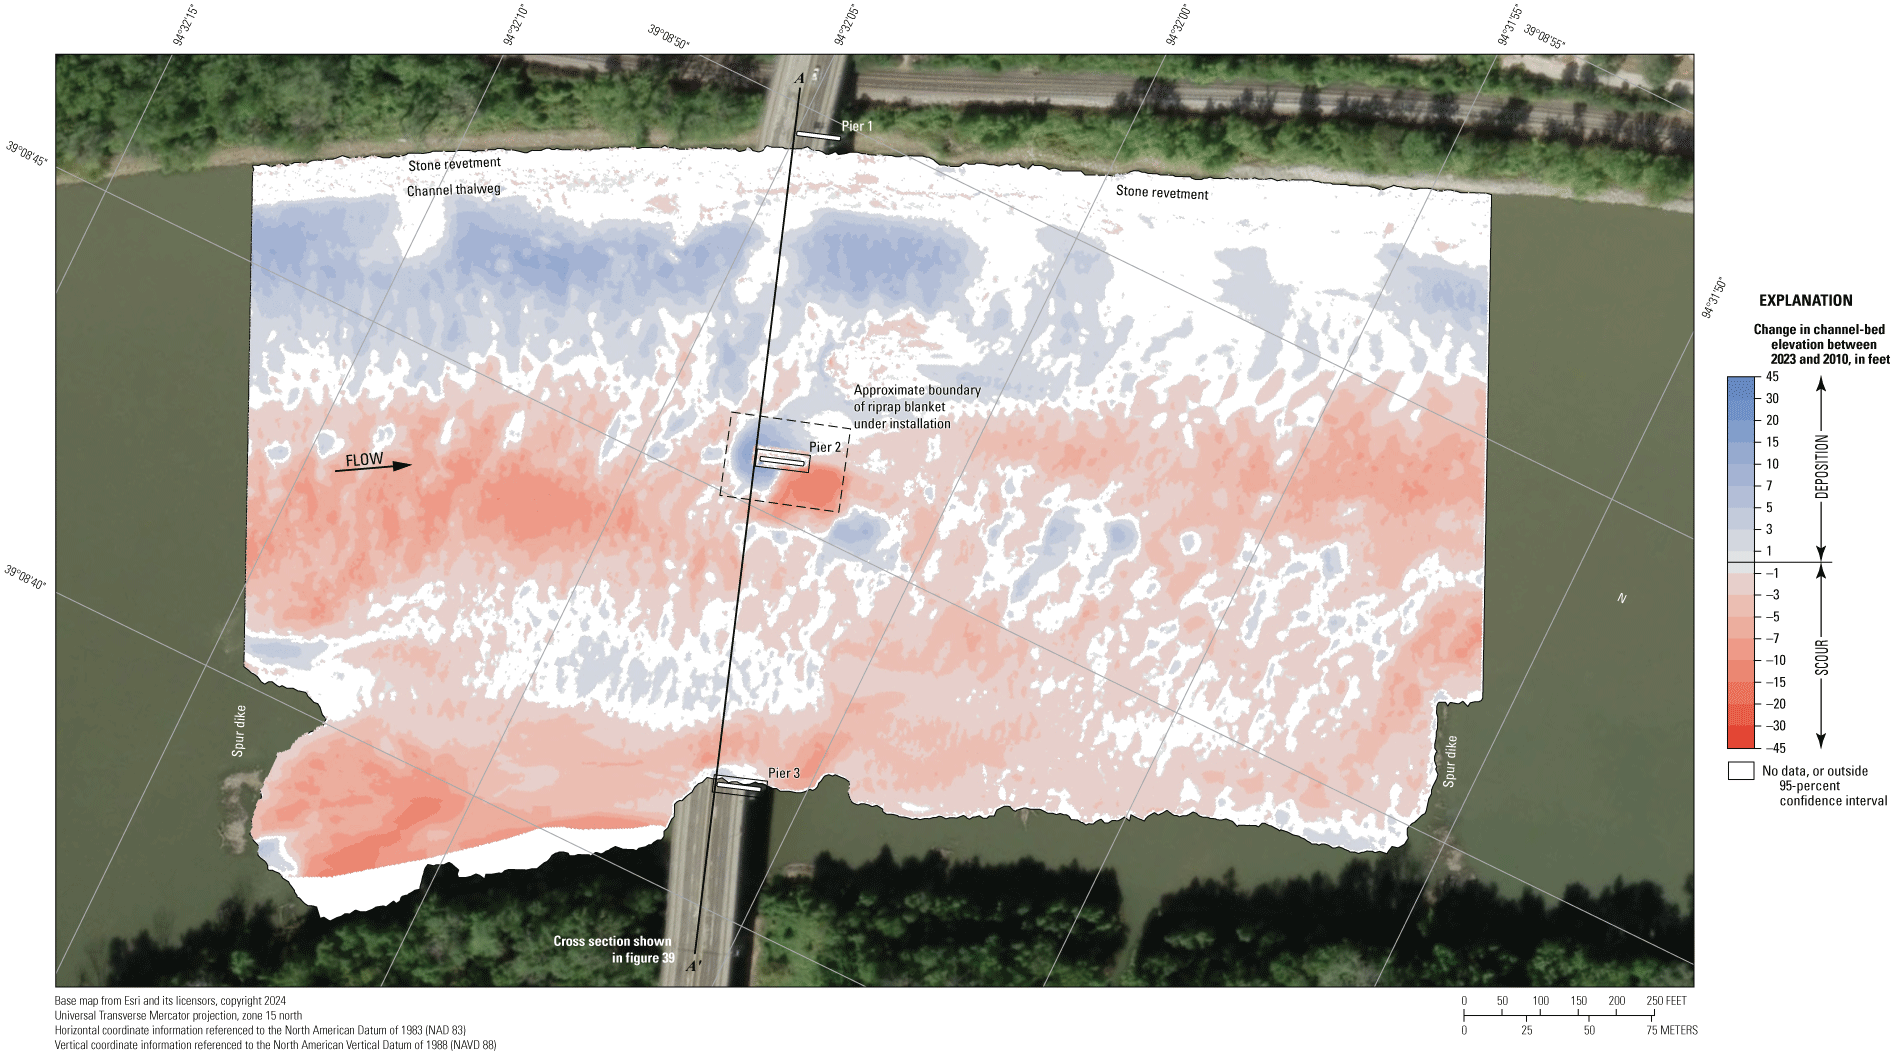
Map showing difference between surfaces created from bathymetric surveys of the Missouri River channel near structure A5817 on State Highway 269 in Kansas City, Missouri, on August 9, 2023, and March 17, 2010, with probabilistic thresholding.
The vertically averaged velocity vectors indicate mostly uniform flow throughout most of the reach, ranging from about 2 ft/s along the inside of the bend on the right (south) bank to about 7 ft/s in the downstream thalweg along the left (north) bank (fig. 44). Variations in the shape of the stone revetment on the left (north) bank resulted in localized turbulence along that bank (fig. 44).
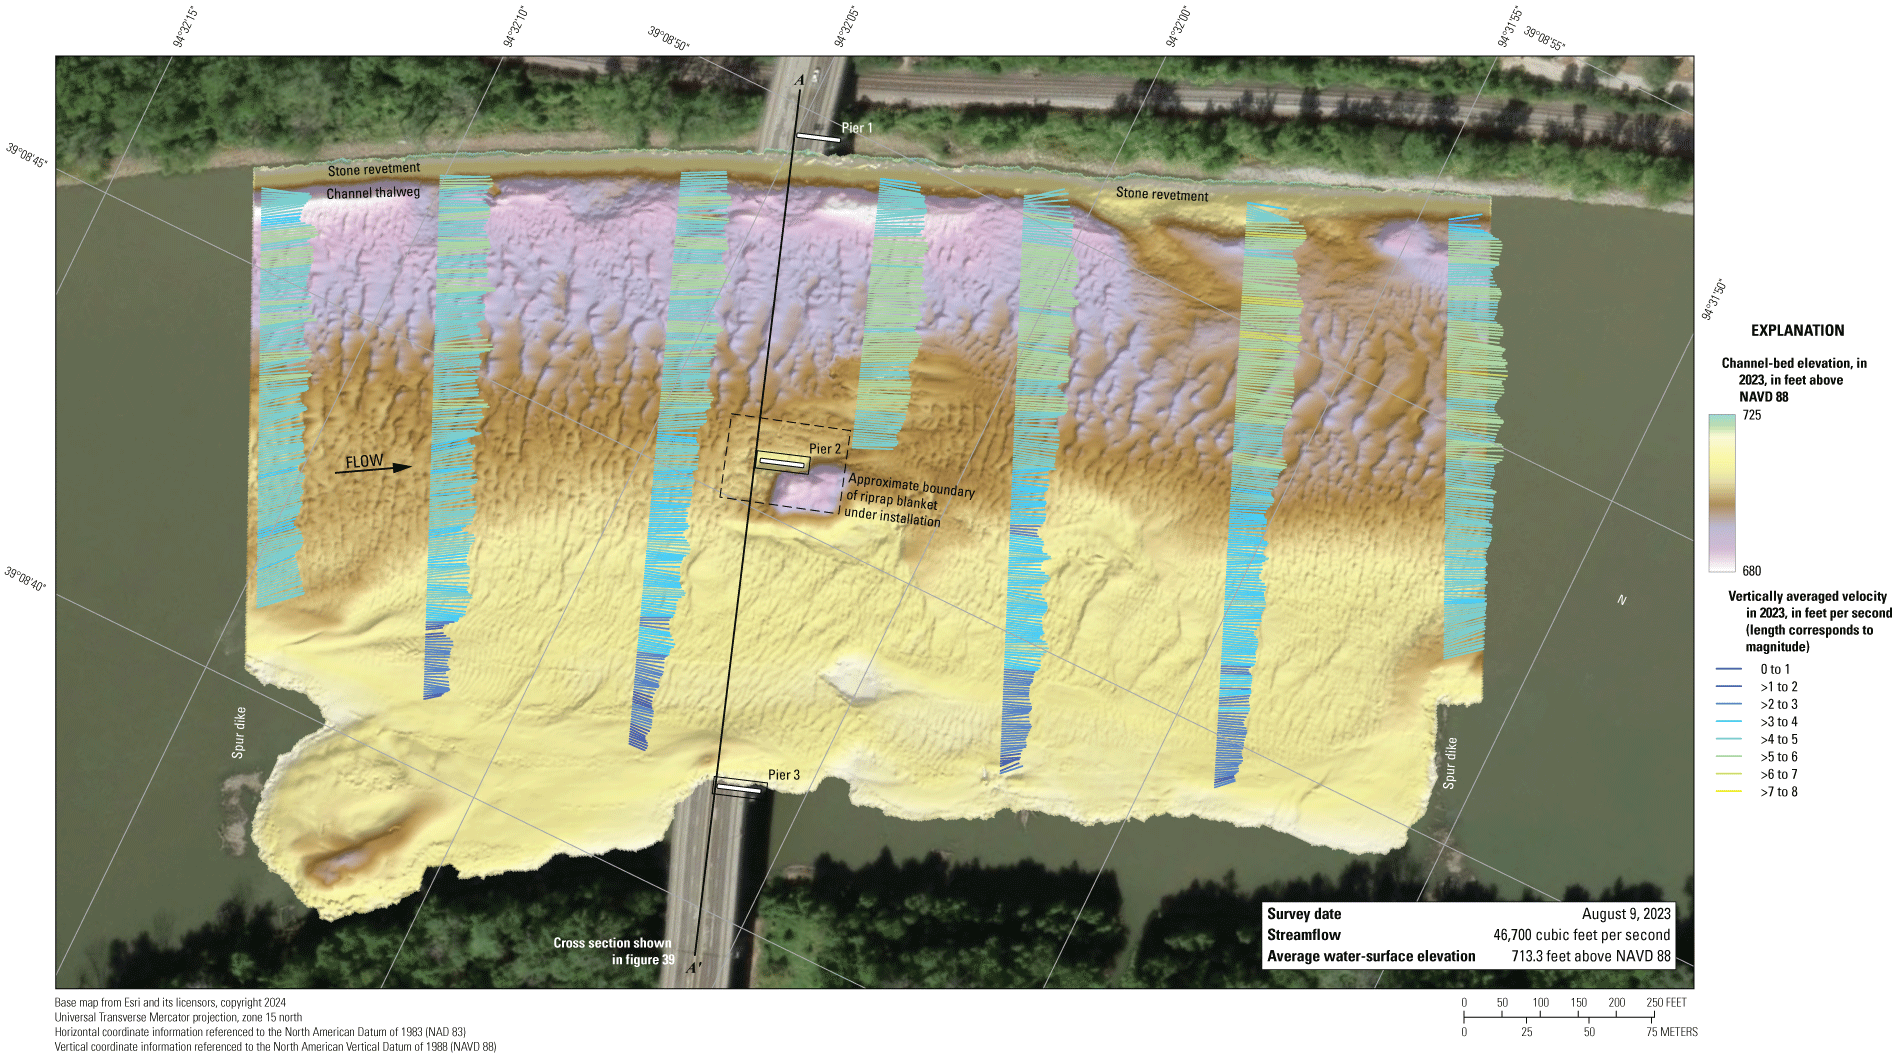
Map showing bathymetry and vertically averaged velocities of the Missouri River channel near structure A5817 on State Highway 269 in Kansas City, Missouri. [NAVD 88, North American Vertical Datum of 1988; >, greater than]
Structure A0767 on Interstate 435
Structure A0767 (site 12; table 2) on Interstate 435 crosses the Missouri River at RM 360.3, on the northeastern side of Kansas City, Mo. (fig. 1). The site was surveyed on August 9, 2023, when the average water-surface elevation of the river in the survey area, determined by the RTK GNSS tide solution, was 711.4 ft (table 5; fig. 45) and streamflow on the Missouri River was about 46,500 ft3/s during the survey (table 5).
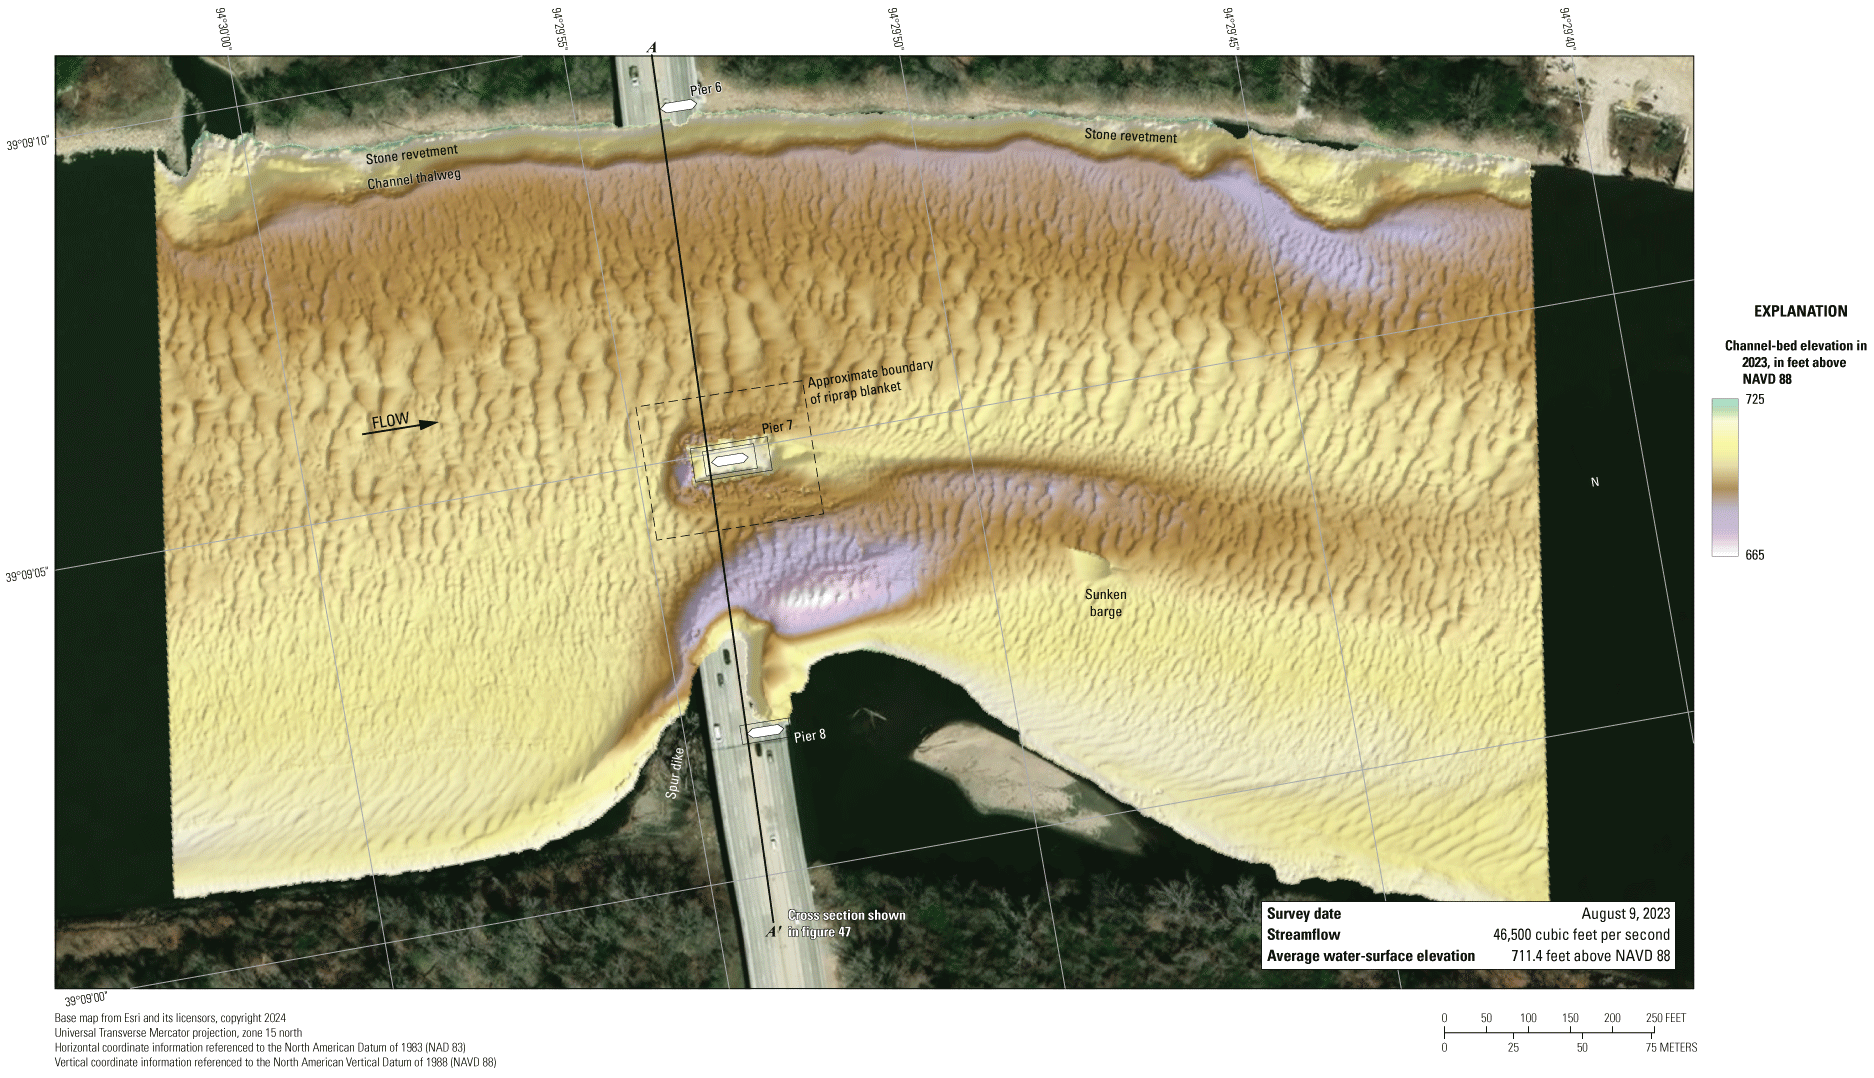
Map showing bathymetric survey of the Missouri River channel near structure A0767 on Interstate 435 in Kansas City, Missouri. [NAVD 88, North American Vertical Datum of 1988]
The survey area was about 1,640 ft long and about 930 ft wide, extending across the active channel from the left (north) bank to the right (south) bank in the main channel (fig. 45). The upstream end of the survey area was about 660 ft upstream from the centerline of structure A0767 at pier 7 (fig. 45). Piers 7 and 8 were in the water; however, as in previous surveys (Huizinga, 2010, 2012, 2016, 2020a), pier 8 was immediately downstream from a spur dike and the upstream side of the pier was surrounded by a persistent and substantial debris raft. Furthermore, a persistent sand bar was also downstream from pier 8, as in previous surveys (Huizinga, 2010, 2012, 2016, 2020a), which limited accessibility to that part of the survey area (fig. 45). The channel-bed elevations in 2023 ranged from about 689 to 704 ft for most of the surveyed area (5 to 95 percentile range of the bathymetric data; fig. 46; table 5), except downstream from the end of the spur dike on the right (south) bank. A shallow but wide thalweg (about 3 to 5 ft deep and 150 ft wide) was along the left (north) bank throughout the surveyed area, and small dunes and ripples were detected throughout the channel (fig. 45). As in previous surveys (Huizinga, 2010, 2012, 2016, 2020a), stone revetment and bedrock outcrops were on the left (north) bank throughout the reach (fig. 45).
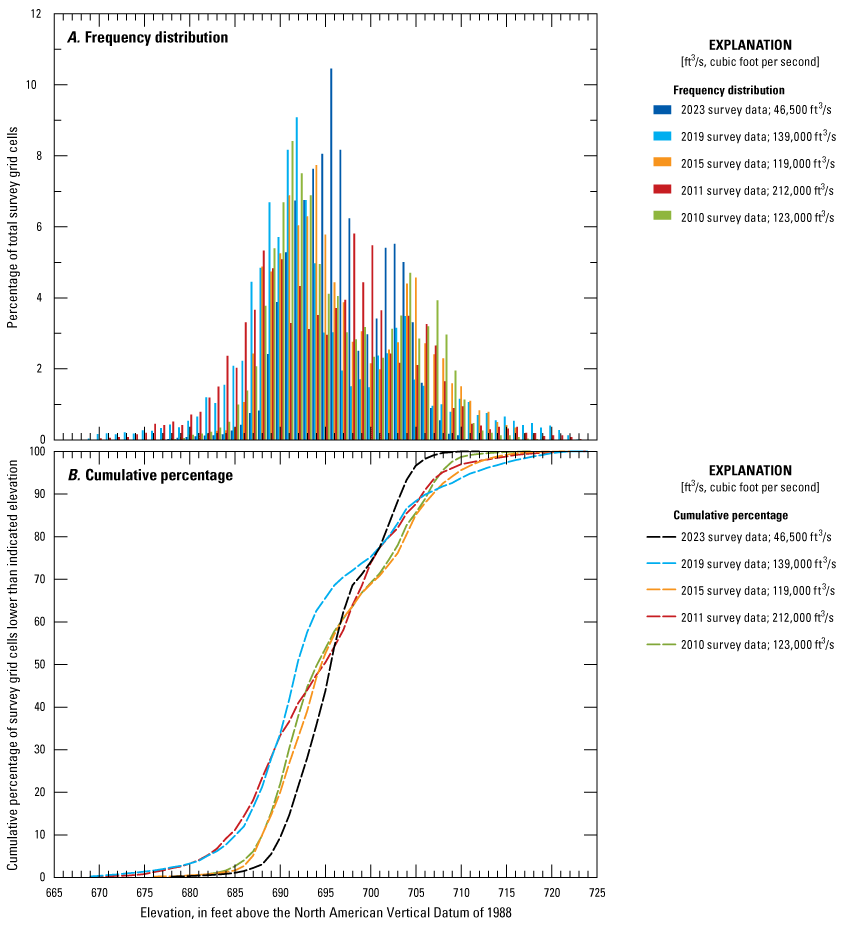
Graphs showing (A) frequency distribution and (B) cumulative percent of bed elevations for bathymetric survey grid cells in 1-foot elevation bins from a survey on the Missouri River near structure A0767 on Interstate 435 in Kansas City, Missouri, on August 9, 2023, compared with previous surveys in 2010, 2011, 2015, and 2019 (Huizinga, 2010, 2012, 2016, and 2022a, respectively).
The scour hole historically observed at pier 7 was not present in the 2023 survey (figs. 45, 47). The most recent previous study (Huizinga, 2022a) details how MoDOT installed scour countermeasures in the form of a riprap blanket around pier 7 in 2020, and that blanket is partly evident in the current (2023) survey (fig. 45; fig. 1.6). A gap in the blanket at the nose of the expanded seal course constructed as part of the countermeasures had a minimum elevation of 682 ft, which is 7 ft below the bottom of the original seal course at that pier (table 6); however, the elevation of the bottom of the modified seal course was not specified in the plans for the countermeasures (Travis Stump, Missouri Department of Transportation, written commun., 2020), but was implied to be below 675 ft. The upstream end of pier 8 was embedded in the rock spur dike and could not be surveyed because of the persistent, substantial debris raft (fig. 45). The top of the footing on the downstream end of the pier was partially visible (fig. 45), but the minimum channel elevation adjacent to the pier footing was about 697 ft, which was about 8 ft higher than the bottom of the seal course elevation of 689.26 ft (table 6). Information from bridge plans indicates that piers 7 and 8 are founded on shafts drilled 20 ft into bedrock, with about 22 ft of bed material between the bottom of the scour hole and bedrock at pier 7 and about 49 ft of material between the bottom of the scour hole and bedrock at pier 8 (fig. 47; table 6). A substantial scour hole was downstream from the end of the spur dike, which contained the minimum channel elevation in the surveyed area of 677 ft (fig. 45; table 5); however, this hole was more than 50 ft away from pier 8, and substantial alluvial material was between the hole and the pier.
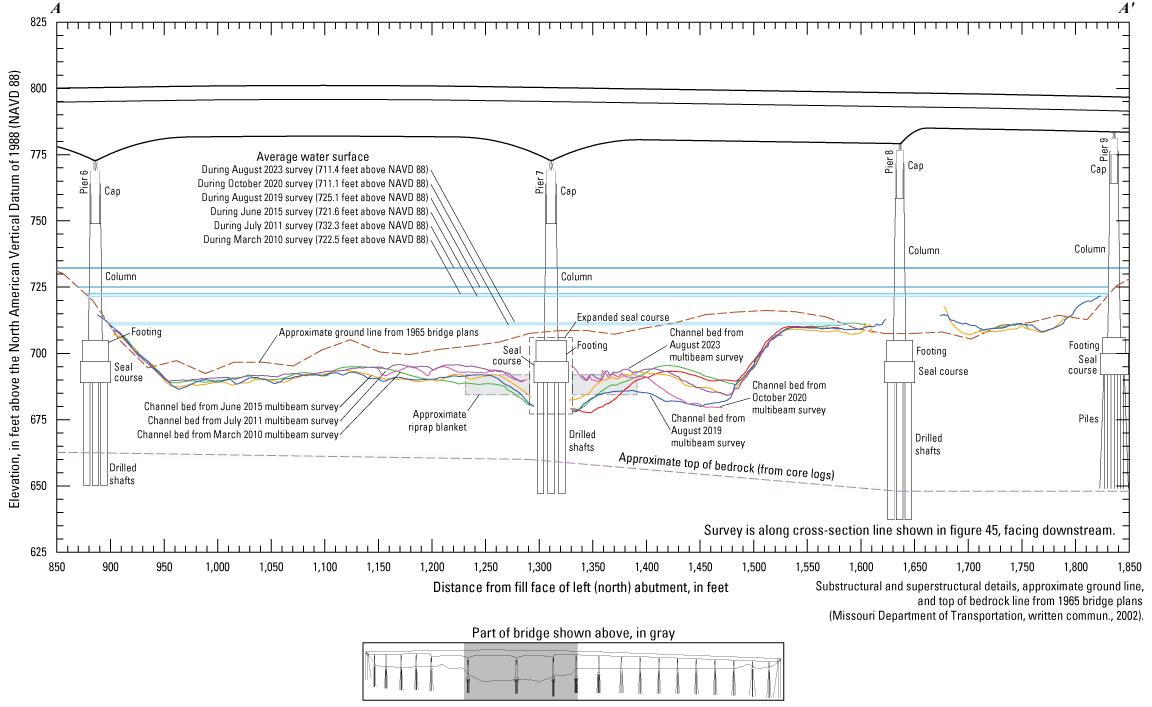
Diagram showing key features, substructural and superstructural details, and surveyed channel bed of structure A0767 on Interstate 435 crossing the Missouri River in Kansas City, Missouri.
The difference between the surveys on August 9, 2023, and August 14, 2019 (fig. 48), indicates about 95 percent of the joint area of interest had detectable change, which means only about 5 percent of the differences in the joint area of interest are equivocal and within the bounds of uncertainty (table 7). Deposition was dominant throughout most of the reach between 2019 and 2023 in the DoD (fig. 48). Substantial deposition of up to 20 ft was observed along the toe of the right (south) bank upstream from the bridge, as well as downstream from pier 7. Additional deposition of over 30 ft was observed immediately downstream from the spur dike near pier 8 (fig. 48). Localized erosion alternated with deposition in the channel thalweg, and an area of moderate erosion was on the downstream right (south) side of the channel (fig. 48). The scour hole historically observed near pier 7 is effectively mitigated by the riprap blanket, except for a small area of erosion at the nose of pier 7 (fig. 48). The average difference between the bathymetric surfaces was +4.16 ft, which is the largest positive average difference observed in all the surveys in this study (table 7), indicating substantial channel aggradation between the 2019 and 2023 surveys. The net volume of cut in the reach from 2019 to 2023 was about 14,200 yd3, and the net volume of fill was about 207,000 yd3, resulting in a net gain of about 192,800 yd3 of sediment between 2019 and 2023 (table 7), the largest net gain of the surveys in this study (table 7). Accordingly, the frequency distribution of bed elevations in 2023 is the most different from the 2019 survey, with a higher percentage of cells at a higher elevation than 2019 (fig. 46). The cross section along the upstream bridge face for 2023 is like the 2019 cross section, except near the new riprap blanket near pier 7 and between pier 7 and the spur dike (fig. 47). The stone revetment on the left (north) bank showed localized areas of erosion in 2023, but nearly all the indicated changes are within 3 ft of the 2019 elevation (fig. 48) and may be the result of positional variations between the surveys (see “Uncertainty Estimation” section; fig. 5). This positional variation seems apparent in the horizontal shift of the features near the pier in the cross sections from 2023 and the partial survey in October 2020, immediately after the riprap blanket was installed (fig. 47), but in this case it is unknown whether the positional variation applies to the 2023 survey, the October 2020 survey, or both.
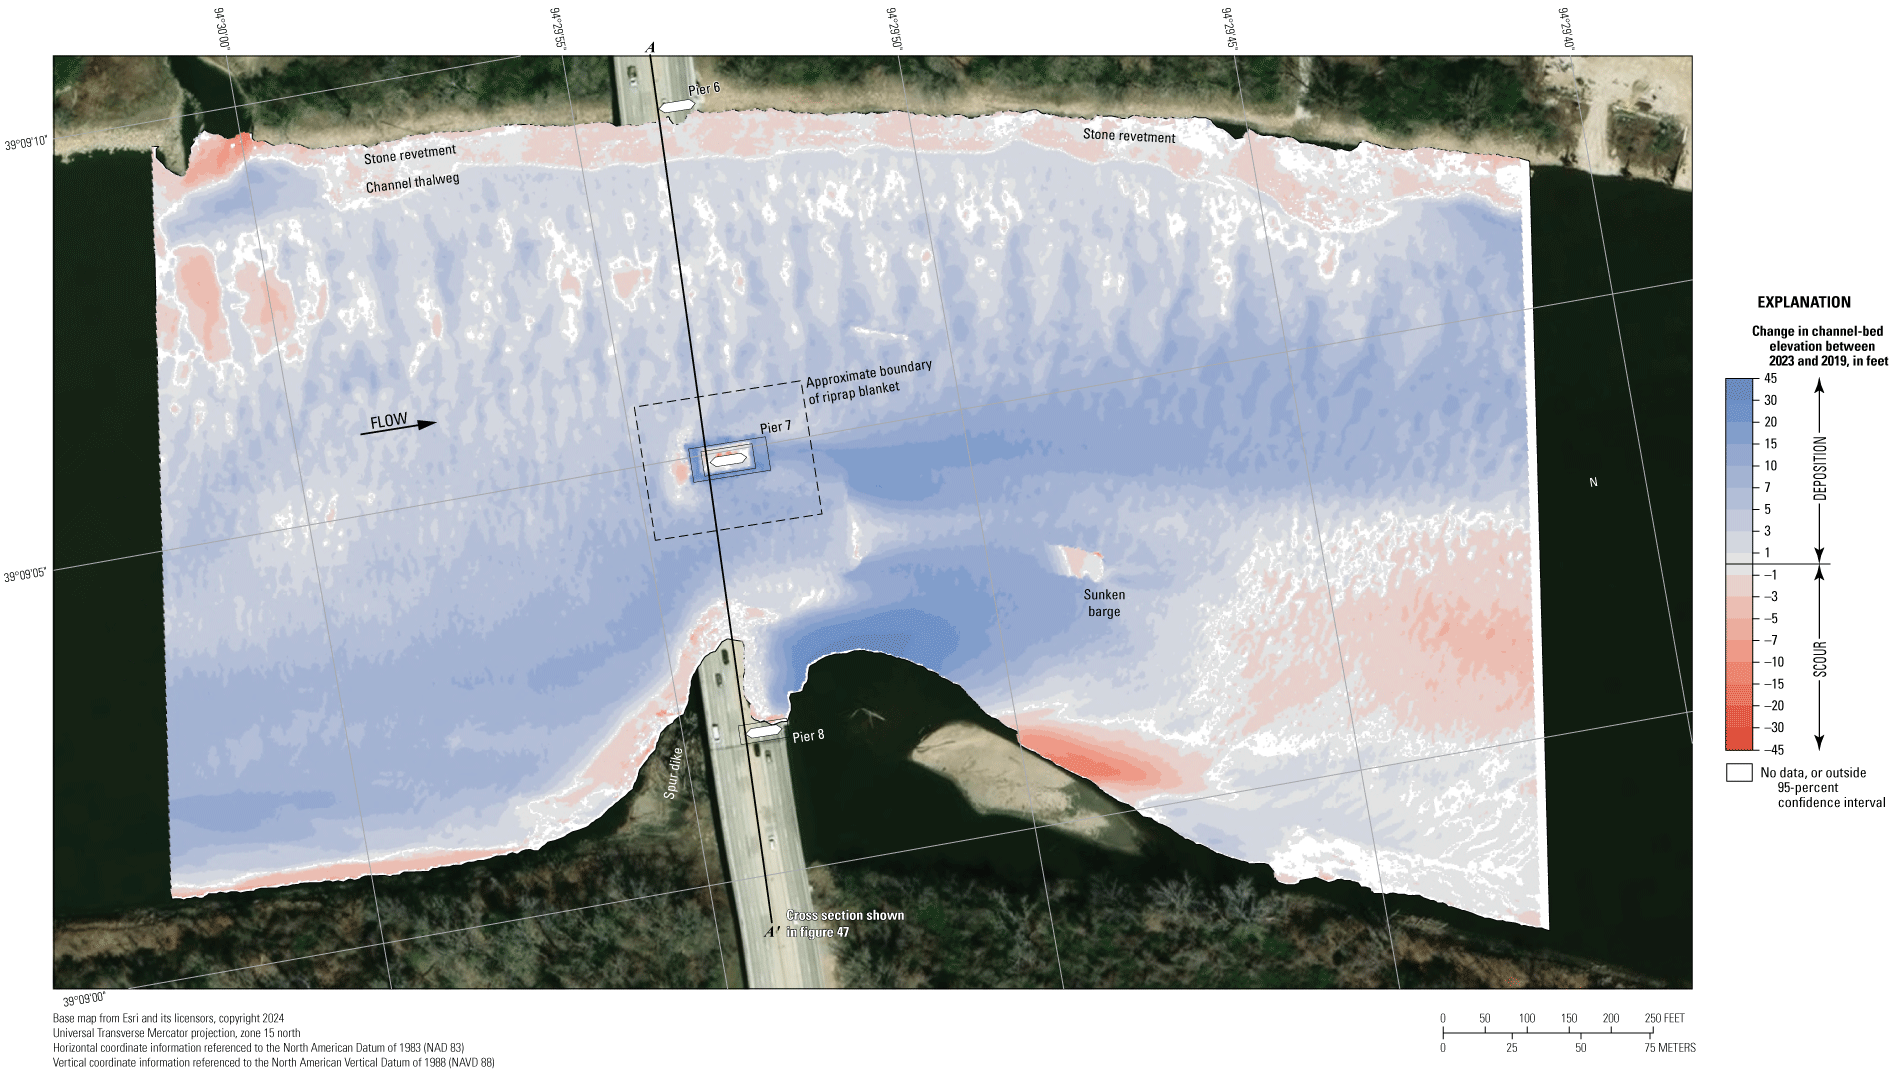
Map showing difference between surfaces created from bathymetric surveys of the Missouri River channel near structure A0767 on Interstate 435 in Kansas City, Missouri, on August 9, 2023, and August 14, 2019, with probabilistic thresholding.
The difference between the surveys on August 9, 2023, and June 4, 2015 (fig. 49), indicates about 79 percent of the joint area of interest had detectable change, which means about 21 percent of the differences in the joint area of interest are equivocal and within the bounds of uncertainty (table 7). Deposition and erosion appear roughly balanced throughout most of the reach between 2015 and 2023 in the DoD, with substantial deposition downstream from the spur dike balanced by moderate erosion upstream, near the end of, and downstream from the end of the spur dike (fig. 49). Downstream from the bridge, deposition was dominant on the left (north) side of the channel, and erosion is dominant on the right (south) side (fig. 49). The effects of the riprap blanket near pier 7 are not evident (fig. 49). The average difference between the bathymetric surfaces was +0.88 ft (table 7), indicating minor channel aggradation between the 2015 and 2023 surveys, with a net gain of sediment of about 33,900 yd3 between 2015 and 2023 (table 7). The frequency distribution of bed elevations in 2023 was most like the distributions of 2015, with a higher percentage of cells at a narrower range of elevations than 2015 (fig. 46). As with the previous DoD, the stone revetment on the left (north) bank showed localized areas of erosion, some areas larger than 5 ft (fig. 49); however, the 2015 survey had erroneous positioning of the data during data collection (Huizinga, 2016) that created an offset of the data along the left (north) bank between surveys.
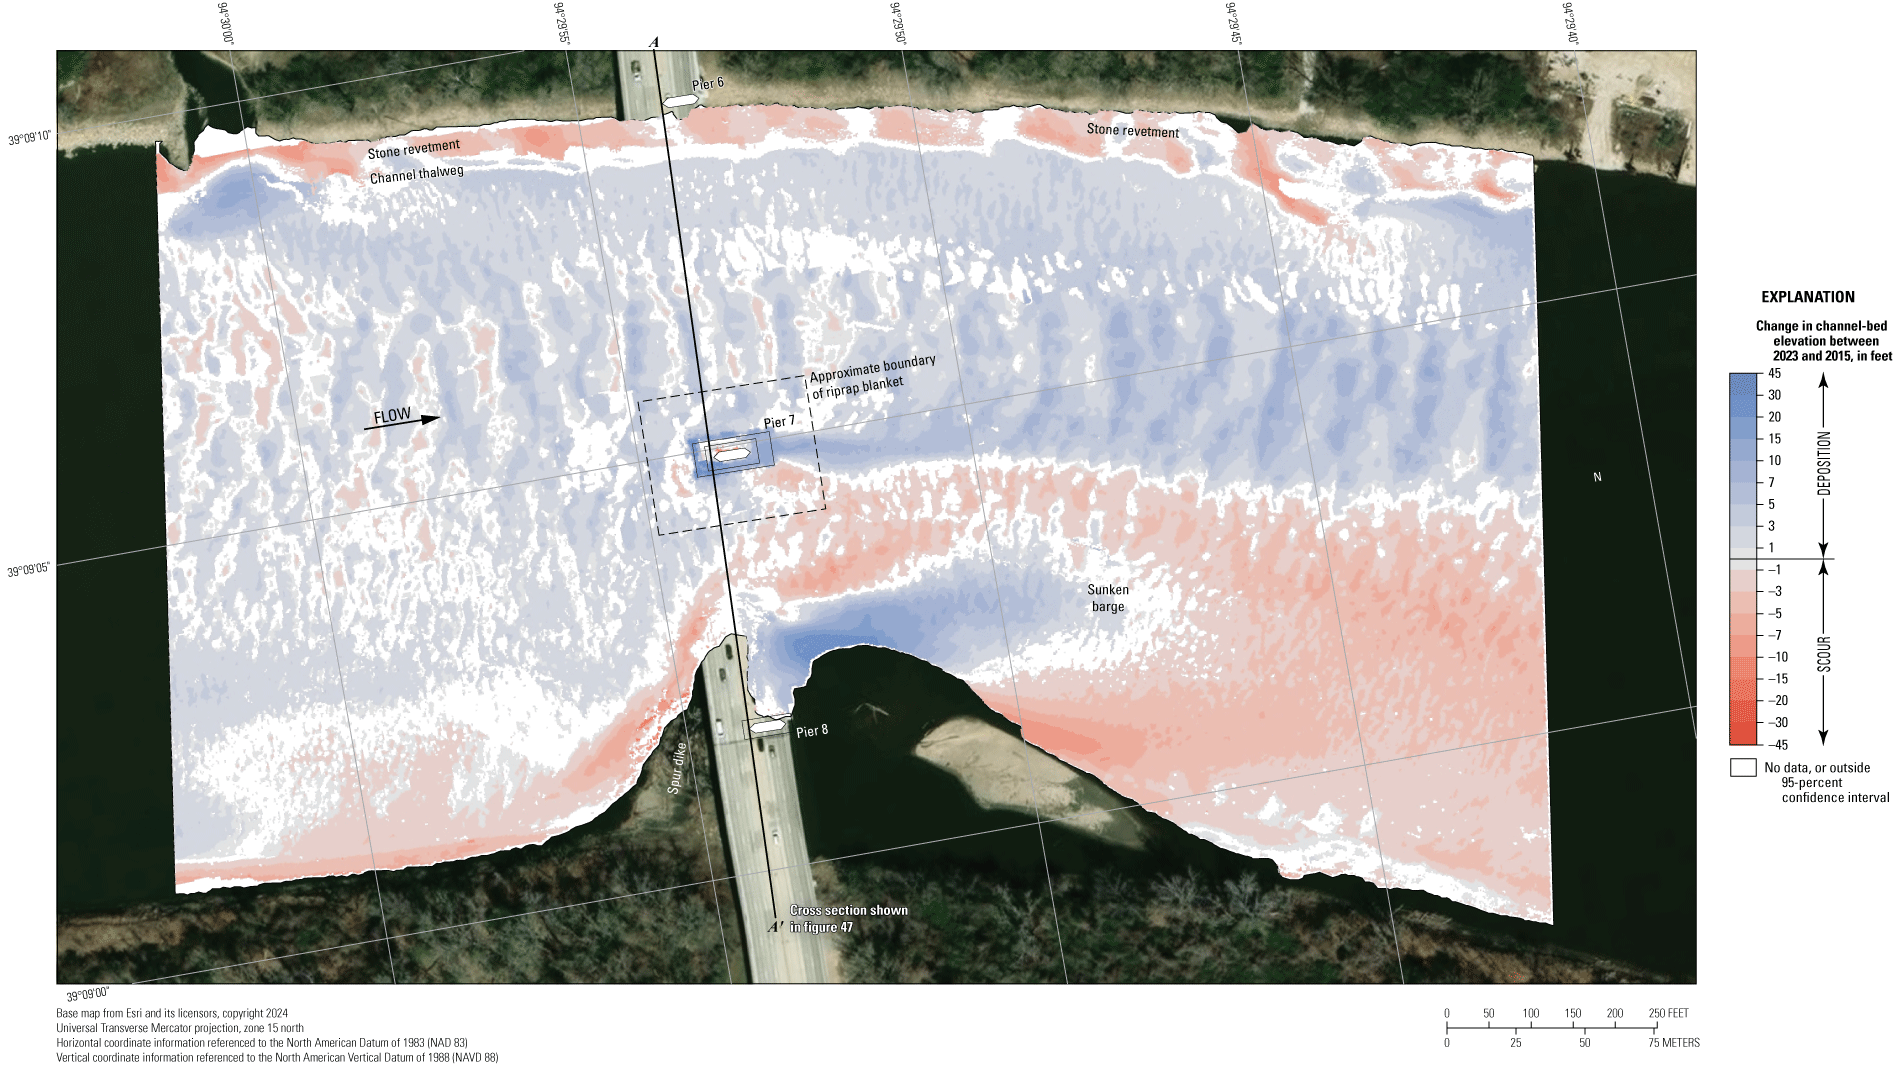
Map showing difference between surfaces of the Missouri River channel. Surfaces created from bathymetric surveys near structure A0767 on Interstate 435 in Kansas City, Missouri, on August 9, 2023, and June 4, 2015, with probabilistic thresholding.
The difference between the surveys on August 9, 2023, and during flooding on July 18, 2011 (fig. 50), indicates about 82 percent of the joint area of interest had detectable change, which means about 18 percent of the differences in the joint area of interest are equivocal and within the bounds of uncertainty (table 7). Deposition appears dominant throughout most of the reach between 2011 and 2023 in the DoD, with over 20 ft of deposition in the thalweg on the left side of the channel and small areas of erosion along the right (south) bank upstream from the bridge and along the upstream face of the spur dike, as well as over 10 ft of erosion on the right (south) side in the downstream channel (fig. 50). The substantial scour hole near pier 7 in the 2011 survey was clearly mitigated by the riprap blanket (fig. 50). The average difference between the 2011 and 2023 bathymetric surfaces was +2.66 ft (table 7), indicating substantial channel aggradation with a net gain of sediment of about 104,900 yd3 (table 7). The stone revetment on the left (north) bank showed areas of minor erosion and deposition, but much of the bank is within the bounds of uncertainty (fig. 50).
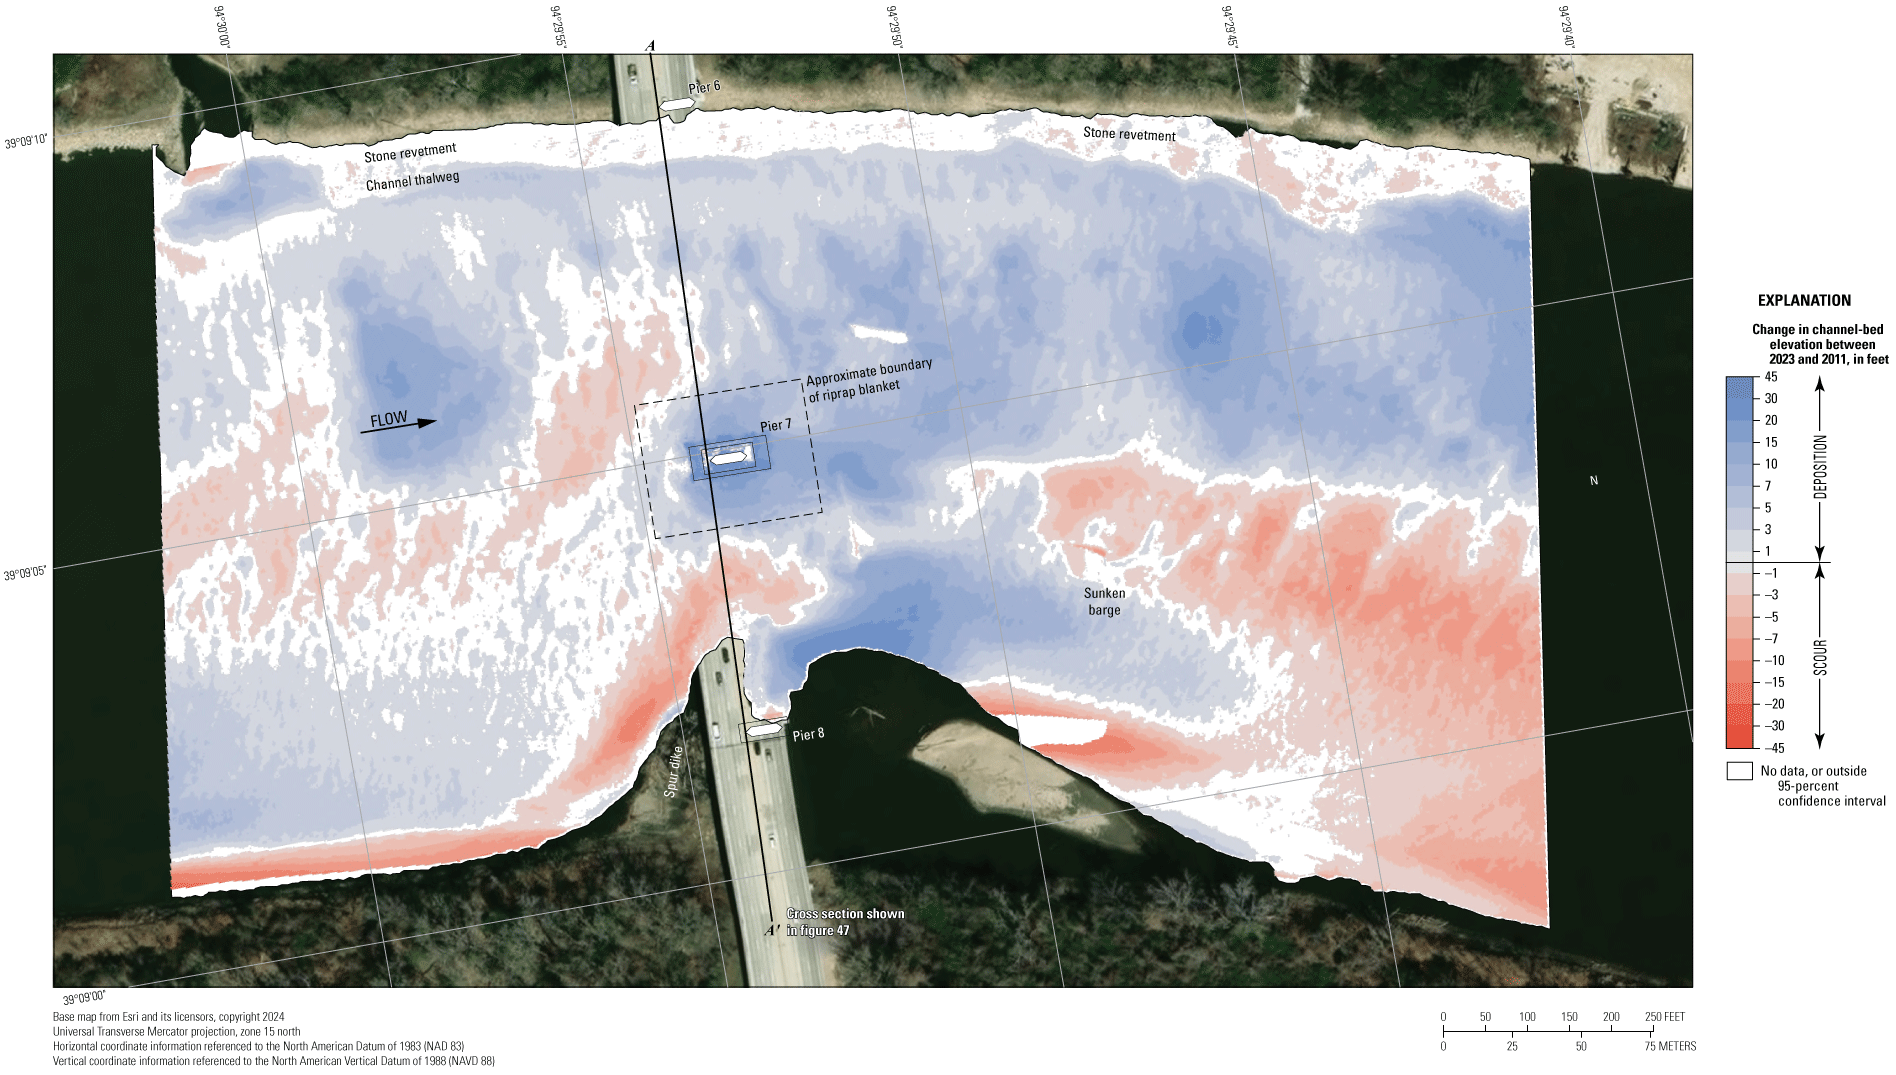
Map showing difference between surfaces created from bathymetric surveys of the Missouri River channel near structure A0767 on Interstate 435 in Kansas City, Missouri, on August 9, 2023, and July 18, 2011, with probabilistic thresholding.
The difference between the surveys on August 9, 2023, and the earliest on March 17, 2010 (fig. 51), indicates about 76 percent of the joint area of interest had detectable change, which means about 24 percent of the differences in the joint area of interest are equivocal and within the bounds of uncertainty (table 7). Deposition and erosion appear roughly balanced throughout most of the reach between 2010 and 2023 in the DoD, with localized areas of moderate deposition of up to 10 ft on the left (north) side of the channel balanced by localized erosion of up to 10 ft on the south side (fig. 51). The average difference between the 2010 and 2023 bathymetric surfaces was +0.73 ft (table 7), indicating minor channel aggradation with a net gain of sediment of about 26,600 yd3 (table 7). The stone revetment on the left (north) bank again showed areas of erosion, with much of the differences being within the bounds of uncertainty (fig. 51). However, the consistent observation of erosion on the left (north) bank in all the preceding comparisons (except 2011) likely implies a positional variation with the 2023 survey, in particular (see “Uncertainty Estimation” section; fig. 5).
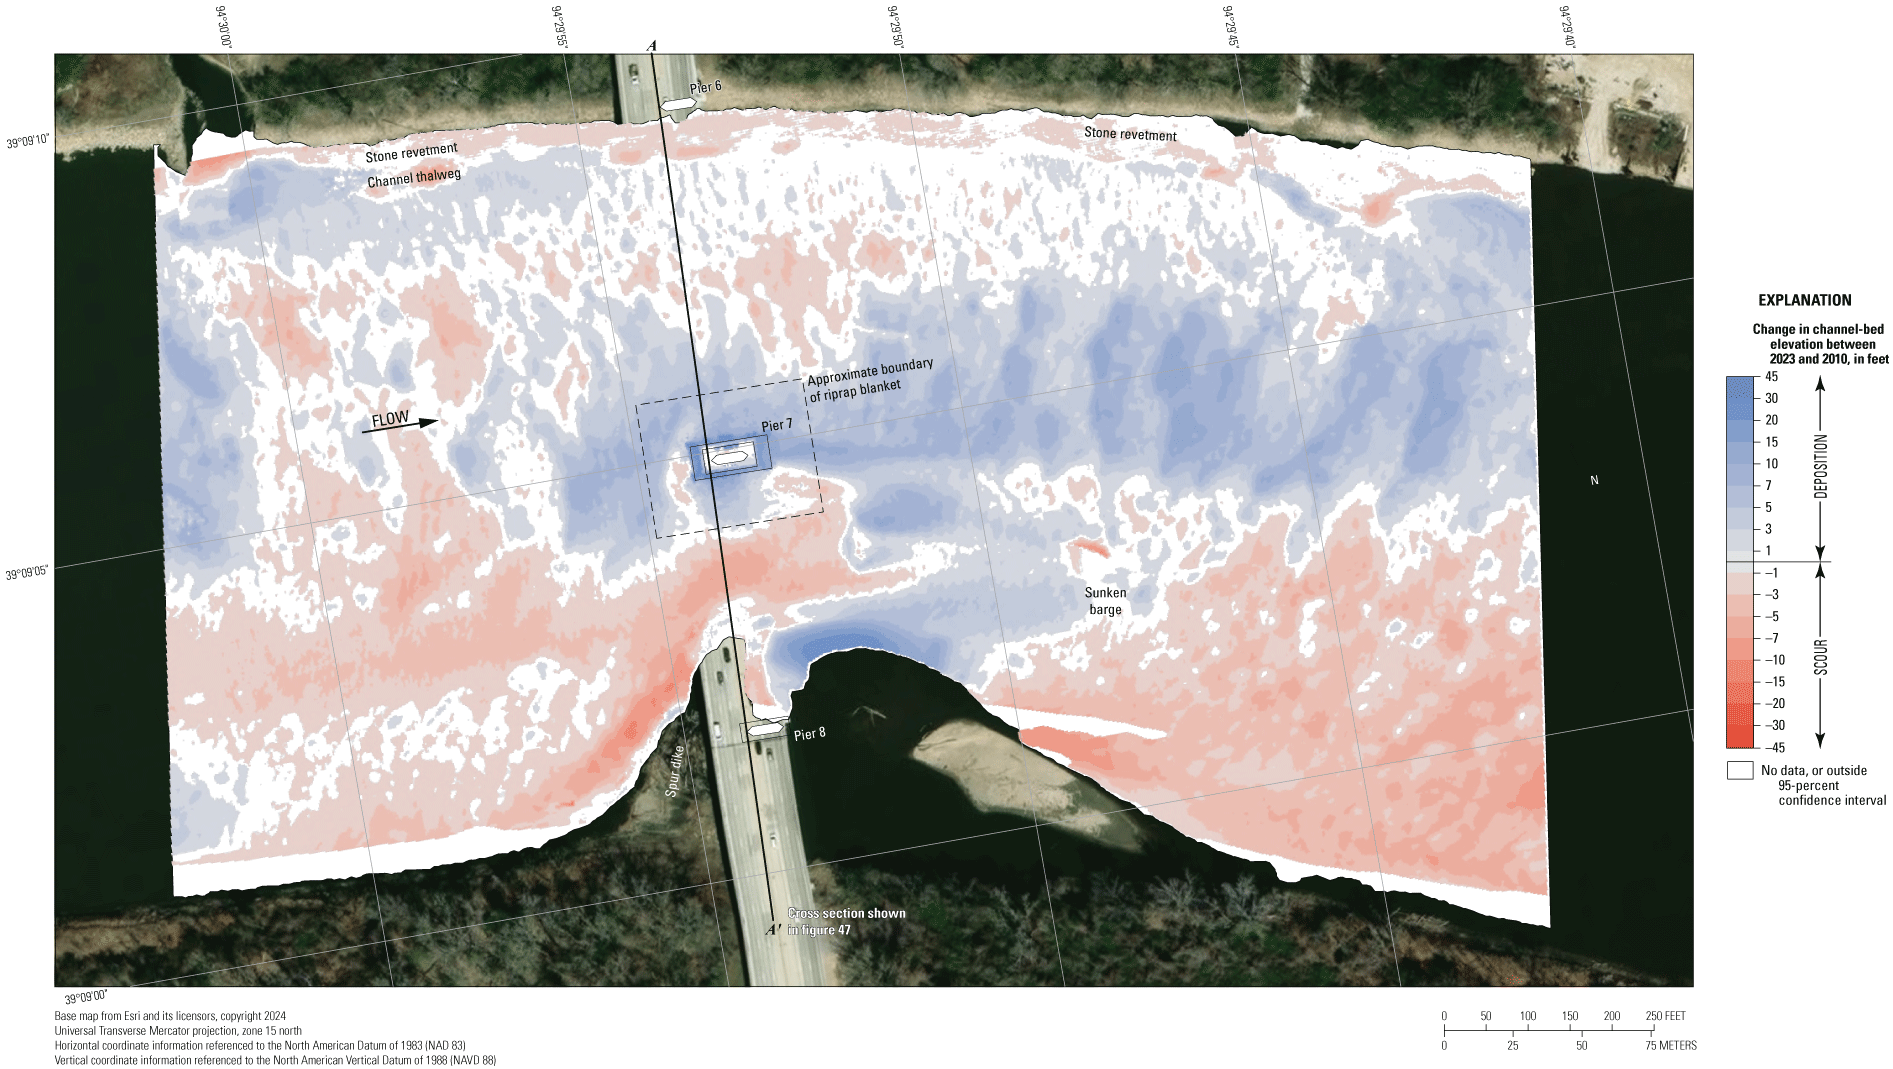
Map showing difference between surfaces created from bathymetric surveys of the Missouri River channel near structure A0767 on Interstate 435 in Kansas City, Missouri, on August 9, 2023, and March 17, 2010, with probabilistic thresholding.
The vertically averaged velocity vectors indicate mostly uniform flow throughout most of the reach, ranging from about 2 ft/s along the inside of the bend on the right (south) bank to about 6 ft/s in the downstream thalweg along the left (north) bank (fig. 52). Variations in the stone revetment on the left (north) bank resulted in localized turbulence along that bank, and turbulence and velocity reduction were observed downstream from the spur dike and pier 7 (fig. 52).
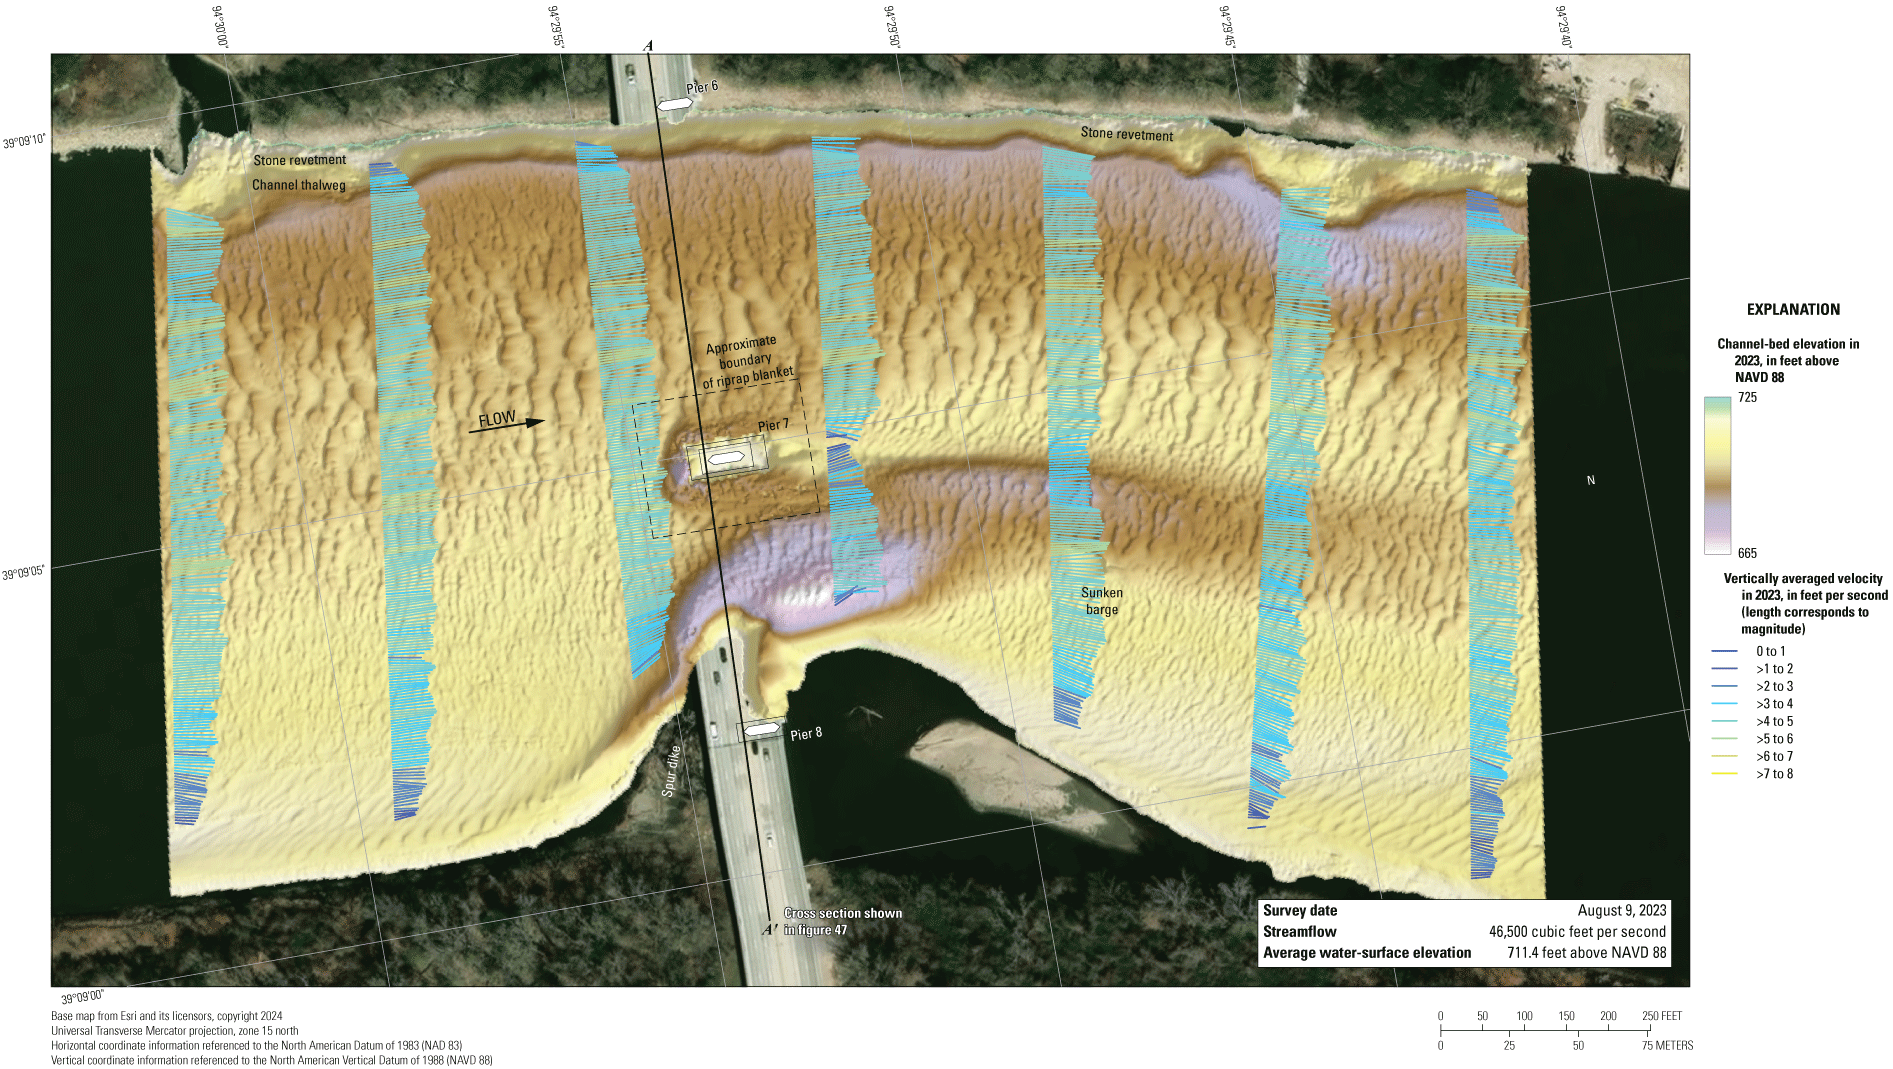
Map showing bathymetry and vertically averaged velocities of the Missouri River channel near structure A0767 on Interstate 435 in Kansas City, Missouri. [NAVD 88, North American Vertical Datum of 1988; >, greater than]
Structures A4757 and L0568 on State Highway 291
Structures A4757 and L0568 (site 13; table 2) are dual bridges on State Highway 291, crossing the Missouri River at RM 352.7 on the northeastern side of the Kansas City, Mo., metropolitan area (fig. 1). The site was surveyed on August 9, 2023, when the average water-surface elevation near the bridges, determined by the RTK GNSS tide solution, was 705.6 ft (table 5; fig. 53) and streamflow on the Missouri River was about 46,600 ft3/s during the survey (table 5).
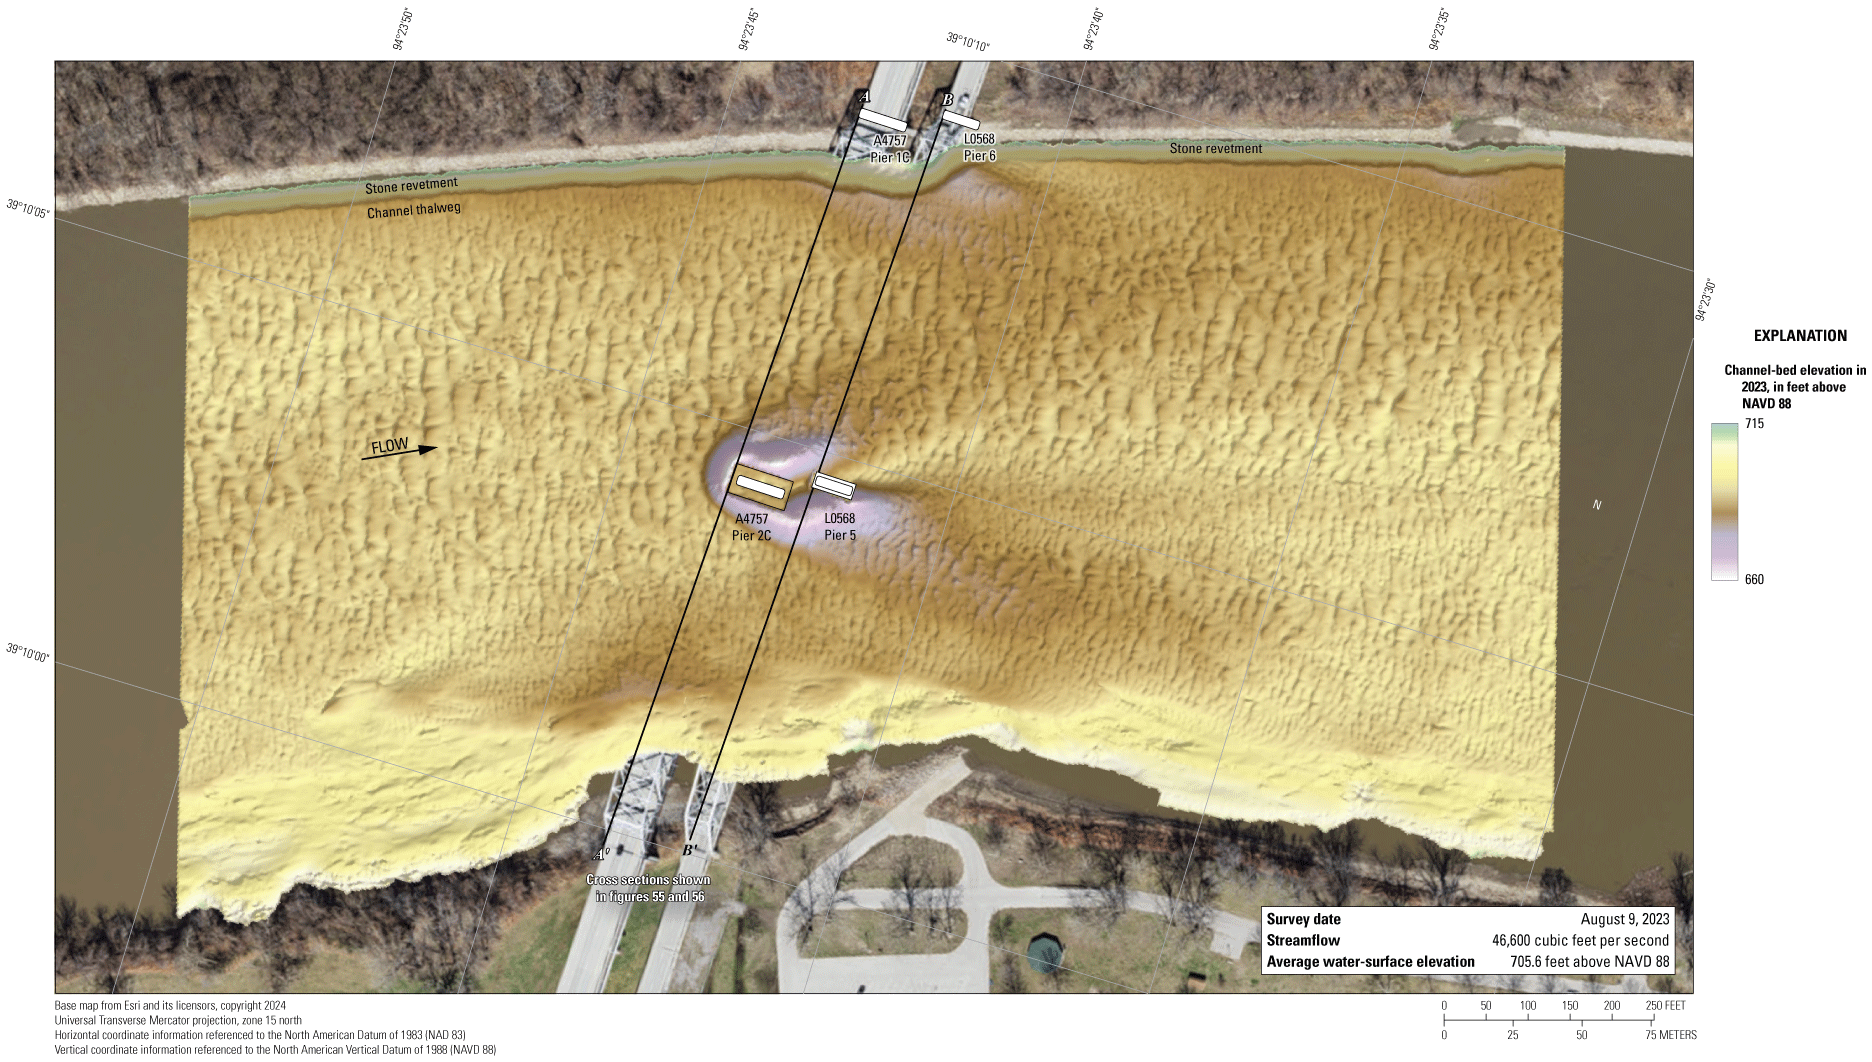
Map showing bathymetric survey of the Missouri River channel near structures A4757 and L0568 on State Highway 291 near Kansas City, Missouri. [NAVD 88, North American Vertical Datum of 1988]
The survey area was about 1,640 ft long and averaged about 890 ft wide, extending from bank to bank in the main channel (fig. 53). The upstream end of the survey area was about 720 ft upstream from the centerline between structures A4757 and L0568 at the piers (fig. 53). The channel-bed elevations in 2023 ranged from about 685 to 697 ft for most of the surveyed area (5th to 95th percentile range of the bathymetric data; table 5; fig. 54), except in the scour holes near the central main-channel piers (fig. 53; table 5). Many small dunes and ripples were throughout the channel. As in previous surveys (Huizinga, 2010, 2012, 2016, 2022a), a noticeable channel constriction was at and immediately downstream from the bridges, and a stone revetment was on the left (north) bank throughout the reach (fig. 53).
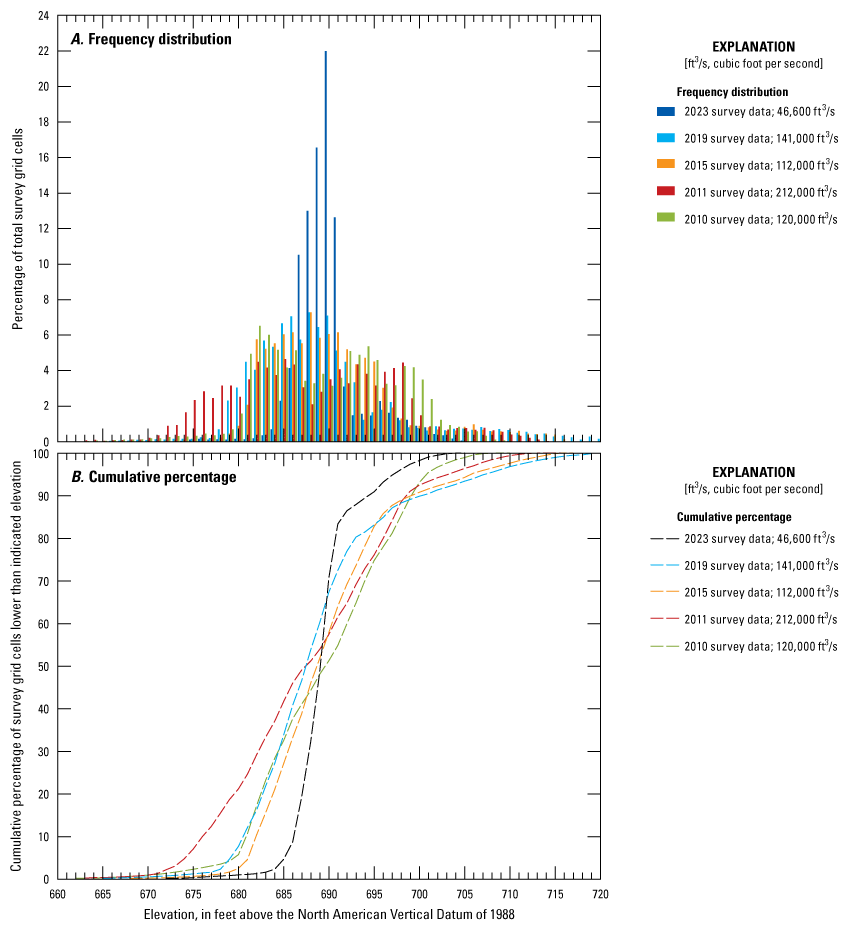
Graphs showing (A) frequency distribution and (B) cumulative percent of bed elevations for bathymetric survey grid cells in 1-foot elevation bins from a survey on the Missouri River near structures A4757 and L0568 on State Highway 291 near Kansas City, Missouri, on August 9, 2023, compared with previous surveys in 2010, 2011, 2015, and 2019 (Huizinga, 2010, 2012, 2016, and 2022a, respectively).
A large scour hole near the main channel piers that nearly encompassed both piers had a minimum channel-bed elevation of about 671 ft (table 6), which was also the minimum channel-bed elevation for the entire reach (table 5). The main channel piers were skewed to the approaching flow by about 25 degrees (table 6), with impinging flow on the right (south) side, which caused a wide scour hole with somewhat unique characteristics (wider, longer, and uniquely shaped) as compared with scour holes at the other surveyed bridges; nevertheless, the scour hole was deeper and longer on the right side. Pier 5 of structure L0568 was in the wake of pier 2C of structure A4757 and, therefore, had a less defined scour hole near it (fig. 53). At the upstream end of pier 2C of structure A4757, the minimum channel-bed elevation was about 671 ft, and near pier 5 of structure L0568, the minimum channel-bed elevation was about 682 ft (fig. 53; table 6). Information from bridge plans indicates that main channel pier 2C of structure A4757 is founded on shafts drilled 20 ft into bedrock (fig. 55), and about 52 ft of bed material are between the bottom of the scour hole and bedrock at the point of minimum elevation of the scour hole near the upstream pier face (fig. 55; table 6). At the point of minimum elevation, the surveyed channel bed was about 5 ft above the bottom of the seal course elevation of 666.26 ft (table 6). Information from bridge plans indicate that main channel pier 5 of structure L0568 is a caisson on bedrock (fig. 56), and about 56 ft of bed material are between the bottom of the scour hole and bedrock at the point of minimum elevation of the scour hole near the downstream right (south) corner (fig. 56; table 6).
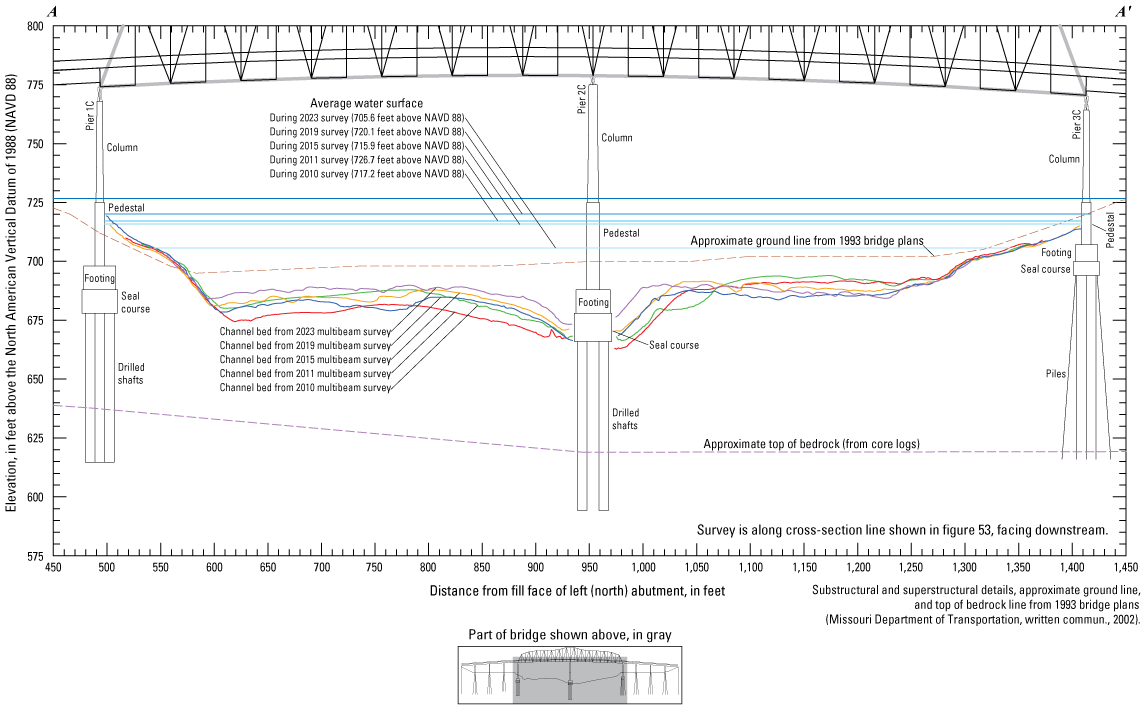
Diagram showing key features, substructural and superstructural details, and surveyed channel bed of structure A4757 on State Highway 291 crossing the Missouri River near Kansas City, Missouri.
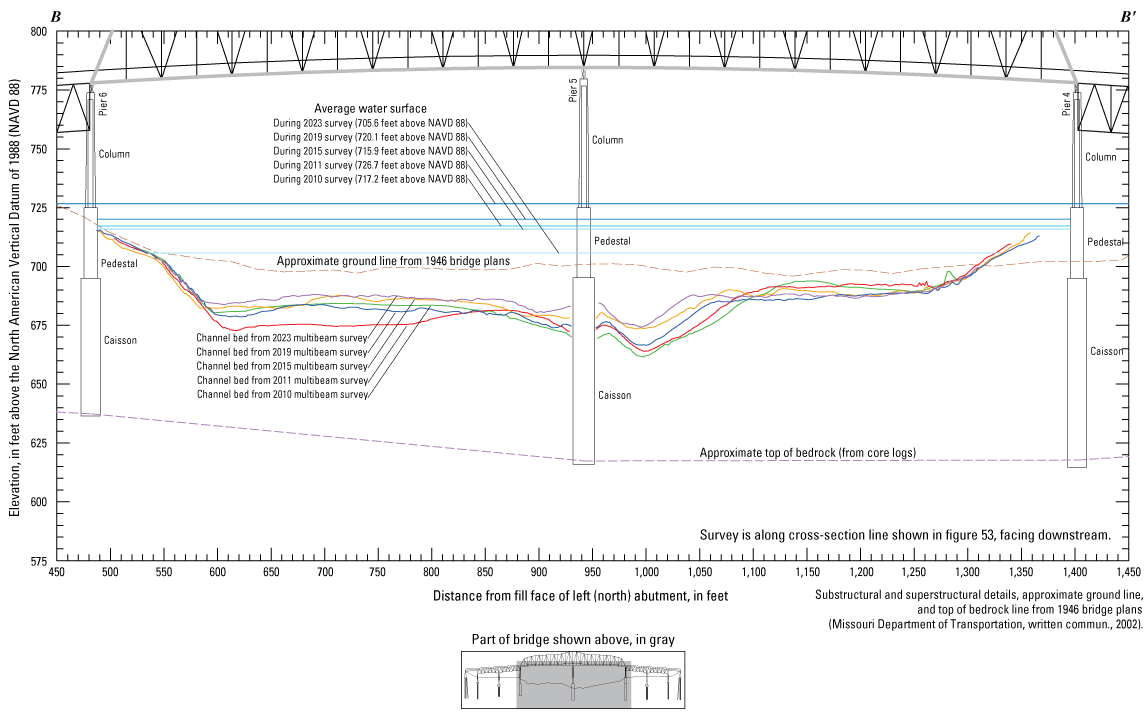
Diagram showing key features, substructural and superstructural details, and surveyed channel bed of structure L0568 on State Highway 291 crossing the Missouri River near Kansas City, Missouri.
The difference between the surveys on August 9, 2023, and August 14, 2019 (fig. 57), indicates about 91 percent of the joint area of interest had detectable change, which means only about 9 percent of the differences in the joint area of interest are equivocal and within the bounds of uncertainty (table 7). Deposition appears dominant throughout the reach between 2019 and 2023 in the DoD, with deposition up to 10 ft throughout the reach on the left (north) side, and alternating areas of erosion and deposition on the right side of the channel except immediately downstream from the bridges (fig. 57). The scour holes near the main channel piers are smaller and shallower, as evidenced by the horseshoe-shaped deposition near both piers (fig. 57); the cross section from along the upstream face of each bridge from the 2023 survey also indicates the smaller, shallower scour holes near the piers (fig. 55 and fig. 56). The average difference between the bathymetric surfaces was +2.59 ft (table 7), indicating substantial aggradation between the 2019 and 2023 surveys. The net volume of cut in the reach from 2019 to 2023 was about 11,300 yd3, and the net volume of fill was about 123,000 yd3, resulting in a net gain of about 111,700 yd3 of sediment between 2019 and 2023 (table 7). The frequency distribution of bed elevations in 2023 is unique, with a substantially higher percentage of cells (up to 22 percent for a given 1-ft increment) in the narrow range of elevations between 686 and 691 ft (fig. 54). The stone revetment on the left (north) bank showed localized areas of minor erosion in 2023, but nearly all the indicated changes are within 1 ft of the 2019 elevation, or outside the 95-percent confidence interval (fig. 57) and might be the result of a minor positional offset between the surveys (see “Uncertainty Estimation” section; fig. 5). Furthermore, as in previous DoDs, deposition or scour apparent on opposing faces of the piers is also likely caused by minor horizontal positional variances between the surveys (fig. 5).
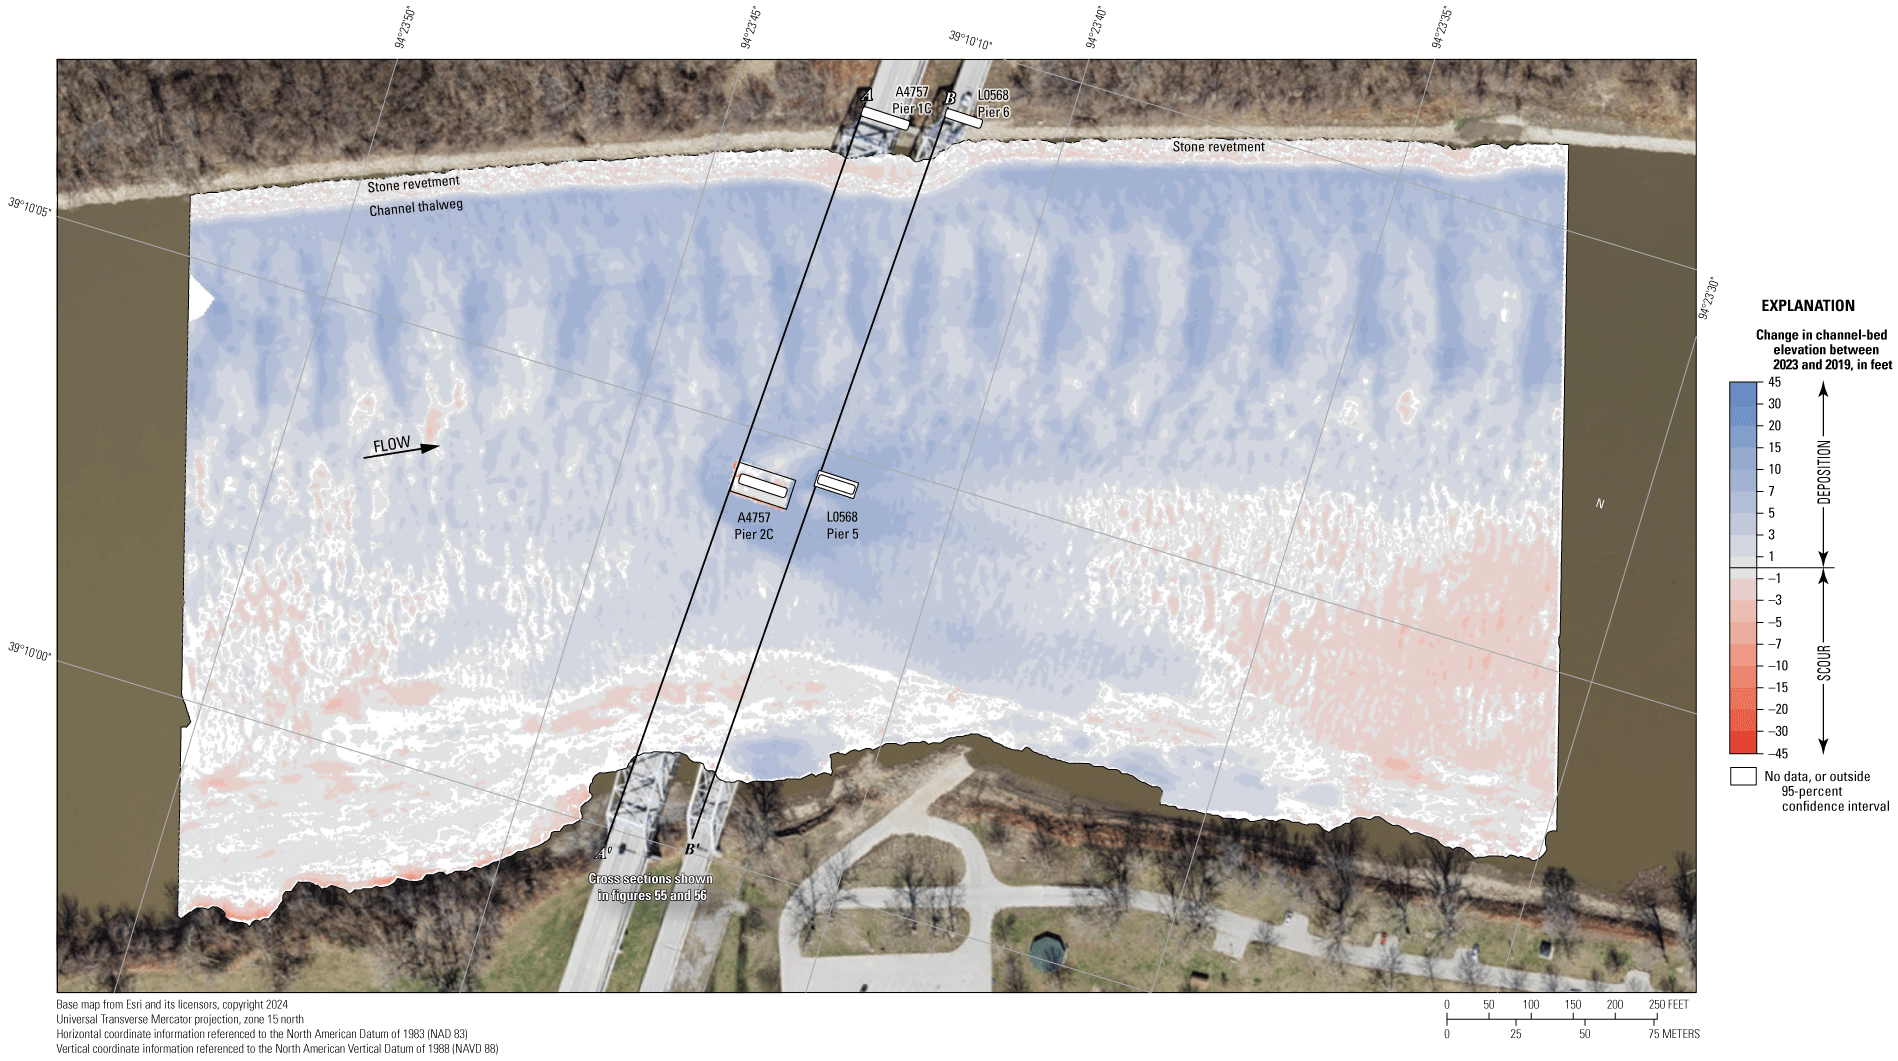
Map showing difference between surfaces created from bathymetric surveys of the Missouri River channel near structures A4757 and L0568 on State Highway 291 near Kansas City, Missouri, on August 9, 2023, and August 14, 2019, with probabilistic thresholding.
The difference between the surveys on August 9, 2023, and June 4, 2015 (fig. 58), indicates about 79 percent of the joint area of interest had detectable change, which means about 21 percent of the differences in the joint area of interest are equivocal and within the bounds of uncertainty (table 7). Deposition again appears dominant throughout the center of the reach between 2015 and 2023 in the DoD, with deposition clearly dominant in the thalweg on the left (north) side of the channel and a balance of erosion and deposition along the right (south) side (fig. 58). The scour holes near the main channel piers are smaller and shallower, evident in the cross sections (fig. 55 and fig. 56) and by the horseshoe-shaped deposition near both piers in the DoD (fig. 58). The average difference between the bathymetric surfaces was +1.34 ft, indicating moderate channel aggradation between the 2015 and 2023 surveys, with a net gain of sediment of about 50,400 yd3 (table 7). The stone revetment on the left (north) bank showed localized areas of deposition (fig. 58); however, nearly all the indicated changes in 2023 are within 1 ft of the 2015 elevation, or within the bounds of uncertainty, and may result from minor horizontal positional variances between the surveys (see “Uncertainty Estimation” section; fig. 5). Furthermore, as in previous DoDs, deposition or scour apparent on opposing faces of the piers is likely also caused by minor horizontal positional variances between the surveys (fig. 5).
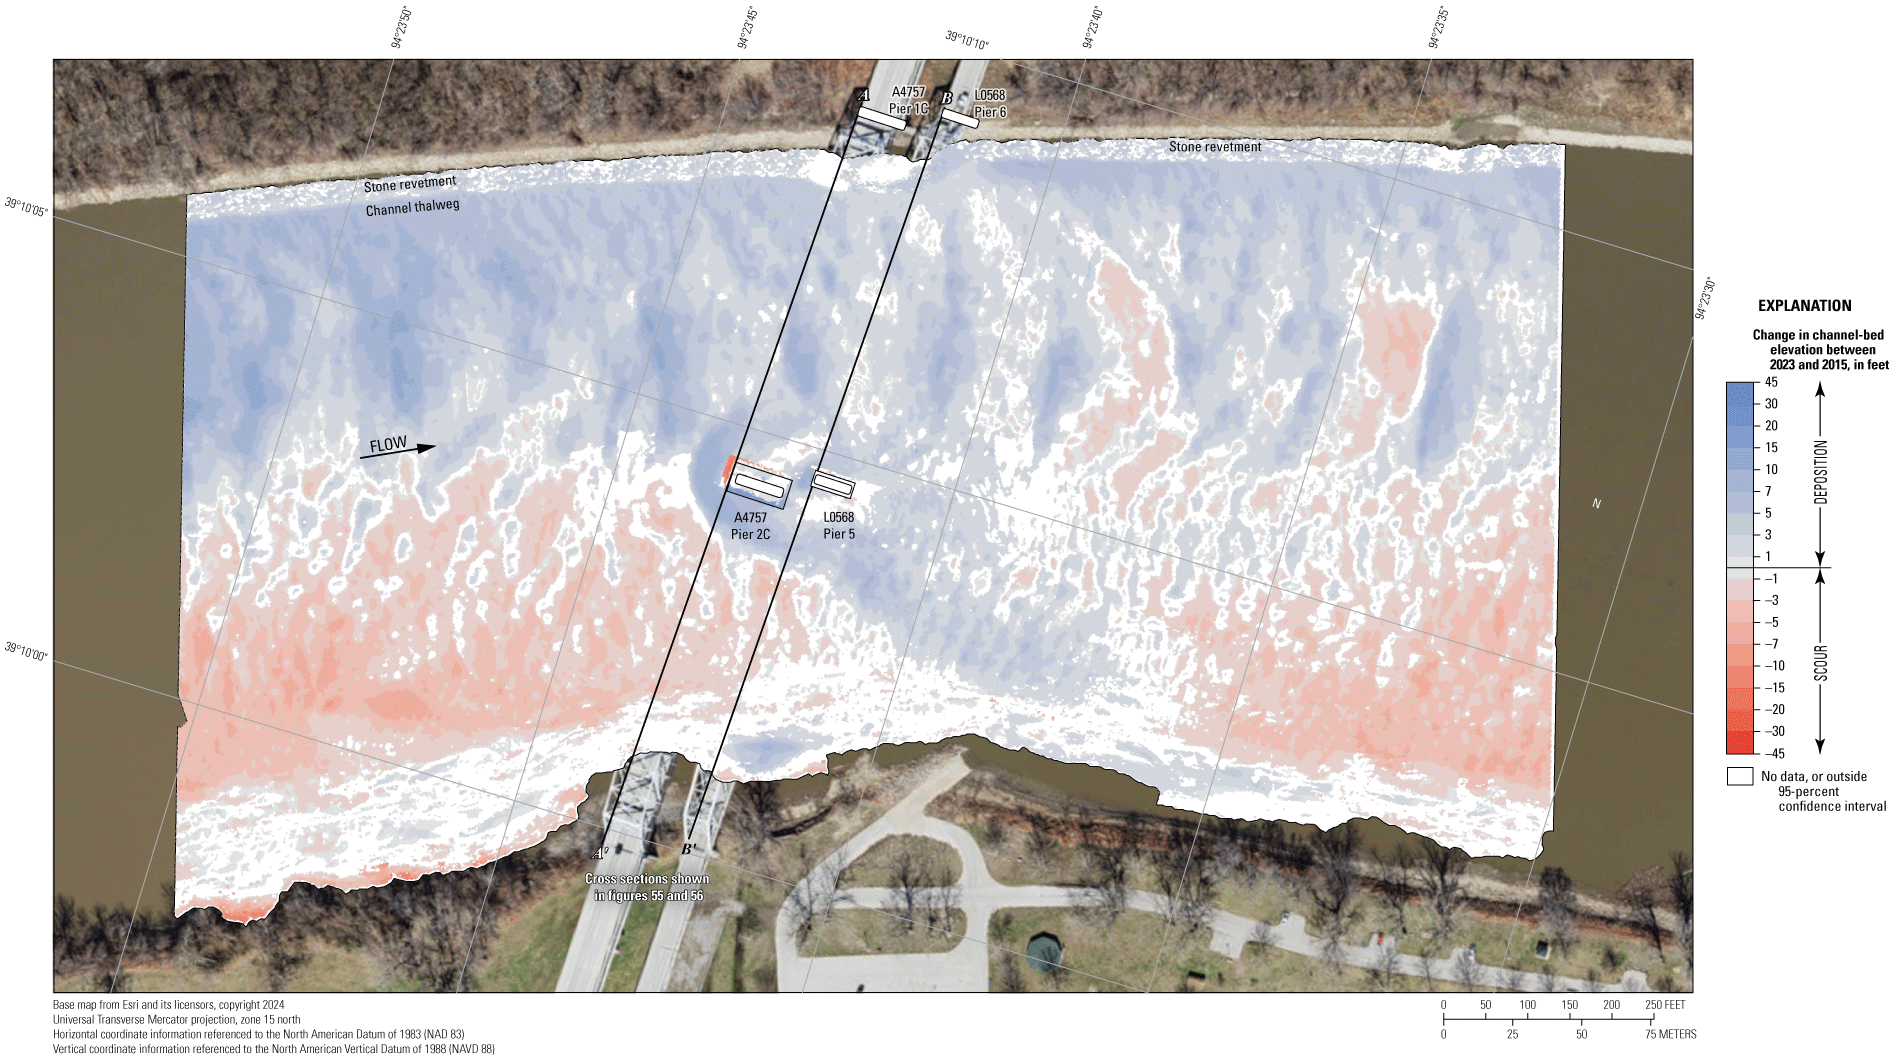
Map showing difference between surfaces created from bathymetric surveys of the Missouri River channel near structures A4757 and L0568 on State Highway 291 near Kansas City, Missouri, on August 9, 2023, and June 4, 2015, with probabilistic thresholding.
The difference between the surveys on August 9, 2023, and during flooding on July 19, 2011 (fig. 59), indicates about 90 percent of the joint area of interest had detectable change, which means about 10 percent of the differences in the joint area of interest are equivocal and within the bounds of uncertainty (table 7). Deposition appears dominant throughout most of the reach between 2011 and 2023 in the DoD, with moderate to substantial deposition near the piers and in the thalweg on the left (north) side of the channel and moderate erosion on the right (south) side (fig. 59). The average difference between the bathymetric surfaces was +2.86 ft, indicating substantial channel aggradation between the 2011 and 2023 surveys, with a net gain of sediment of about 122,100 yd3 (table 7). Accordingly, the frequency distribution of bed elevations in 2011 is the most different from the 2023 survey, with a substantially lower percentage of cells (generally less than 5 percent) at a substantially wider range of elevations than 2023 (fig. 54). As with the other DoDs at this site, the stone revetment on the left (north) bank has localized areas of deposition, as well as deposition and scour apparent on opposing faces of the piers (fig. 59), which likely results from minor horizontal positional variances between the surveys (see “Uncertainty Estimation” section; fig. 5).
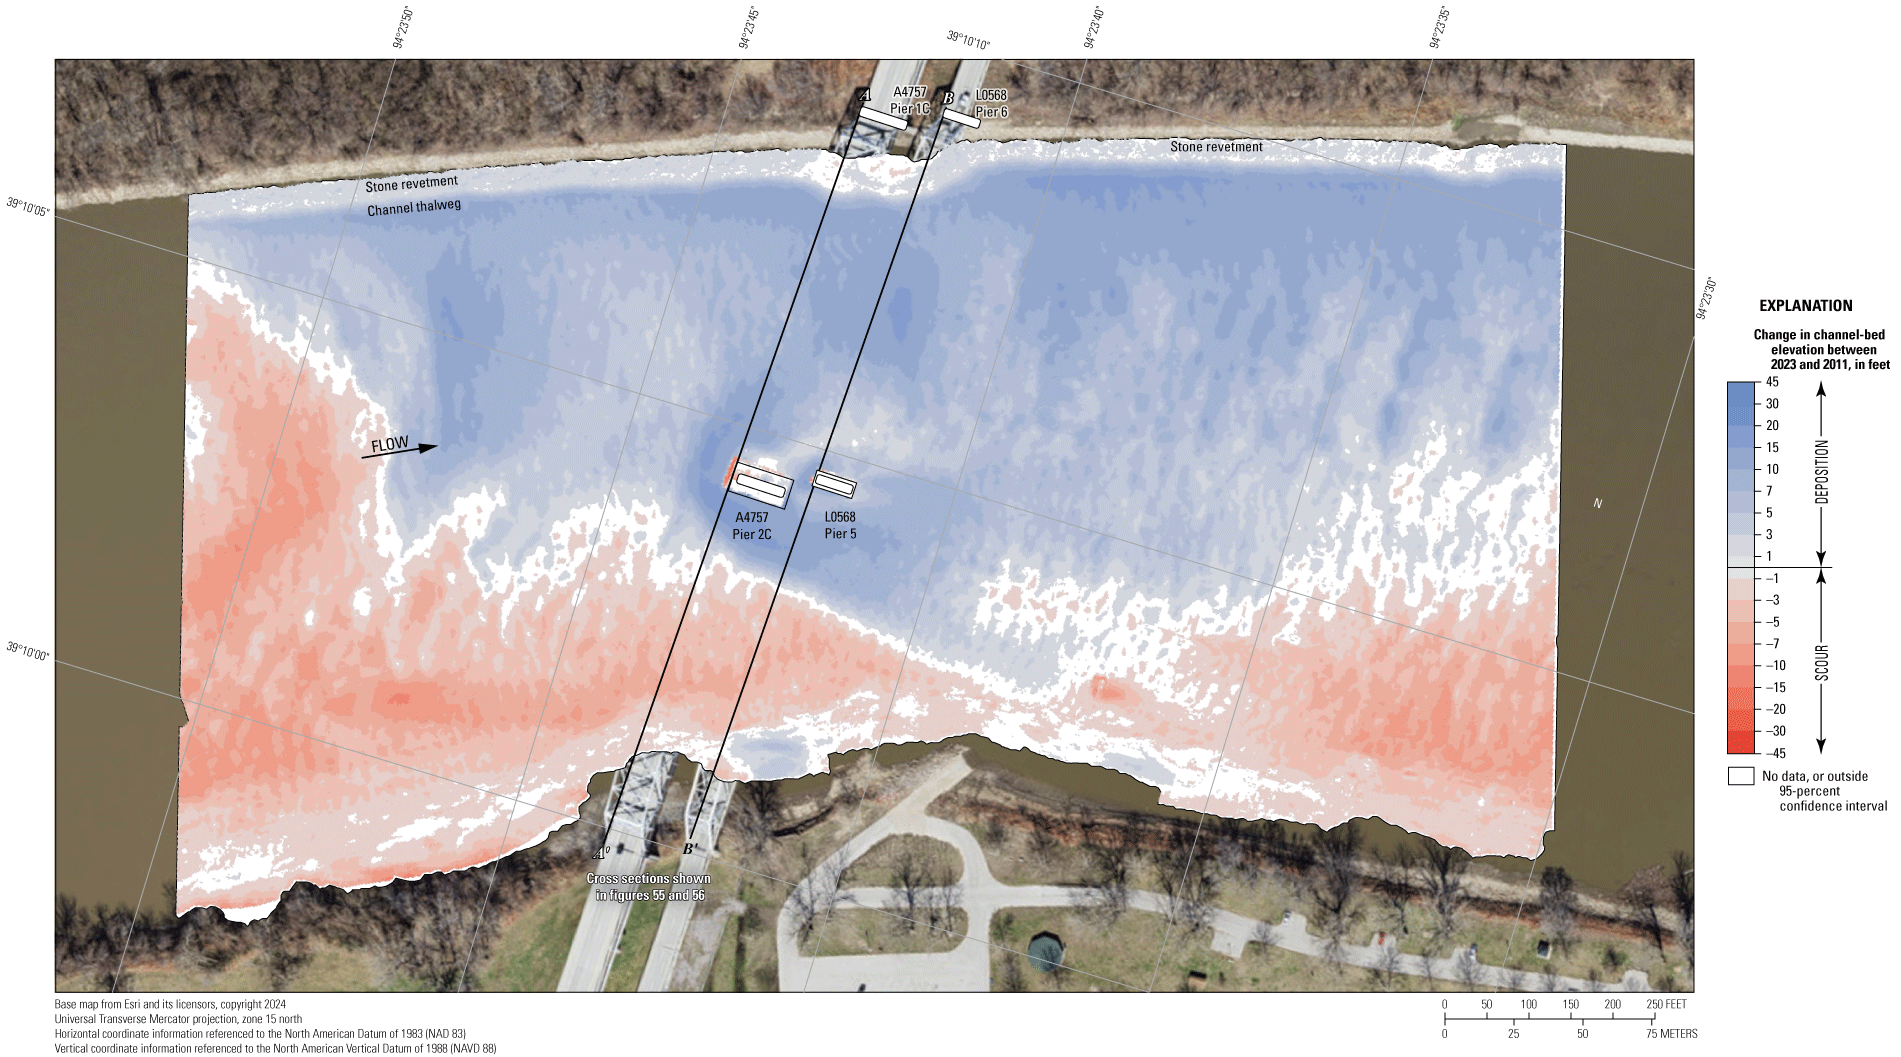
Map showing difference between surfaces created from bathymetric surveys of the Missouri River channel near structures A4757 and L0568 on State Highway 291 near Kansas City, Missouri, on August 9, 2023, and July 19, 2011, with probabilistic thresholding.
The difference between the surveys on August 9, 2023, and the earliest on March 18, 2010 (fig. 60), indicates about 87 percent of the joint area of interest had detectable change, which means about 13 percent of the differences in the joint area of interest are equivocal and within the bounds of uncertainty (table 7). Deposition and erosion appear roughly balanced throughout the reach between 2010 and 2023 in the DoD, with localized substantial deposition near the piers and moderate deposition in the downstream left (north) part of the channel and moderate erosion along the right (south) side throughout the reach (fig. 60). The average difference between the bathymetric surfaces between the 2010 and 2023 surveys was +0.24 ft, indicating minor overall channel aggradation during that time, the net gain of sediment being only about 9,700 yd3 (table 7). The stone revetment on the left (north) bank has areas of erosion, but much of the bank is within the bounds of uncertainty (fig. 60). As in previous DoDs, deposition or scour apparent on opposing faces of the piers is also likely results from minor horizontal positional variances between the surveys (see “Uncertainty Estimation” section; fig. 5).
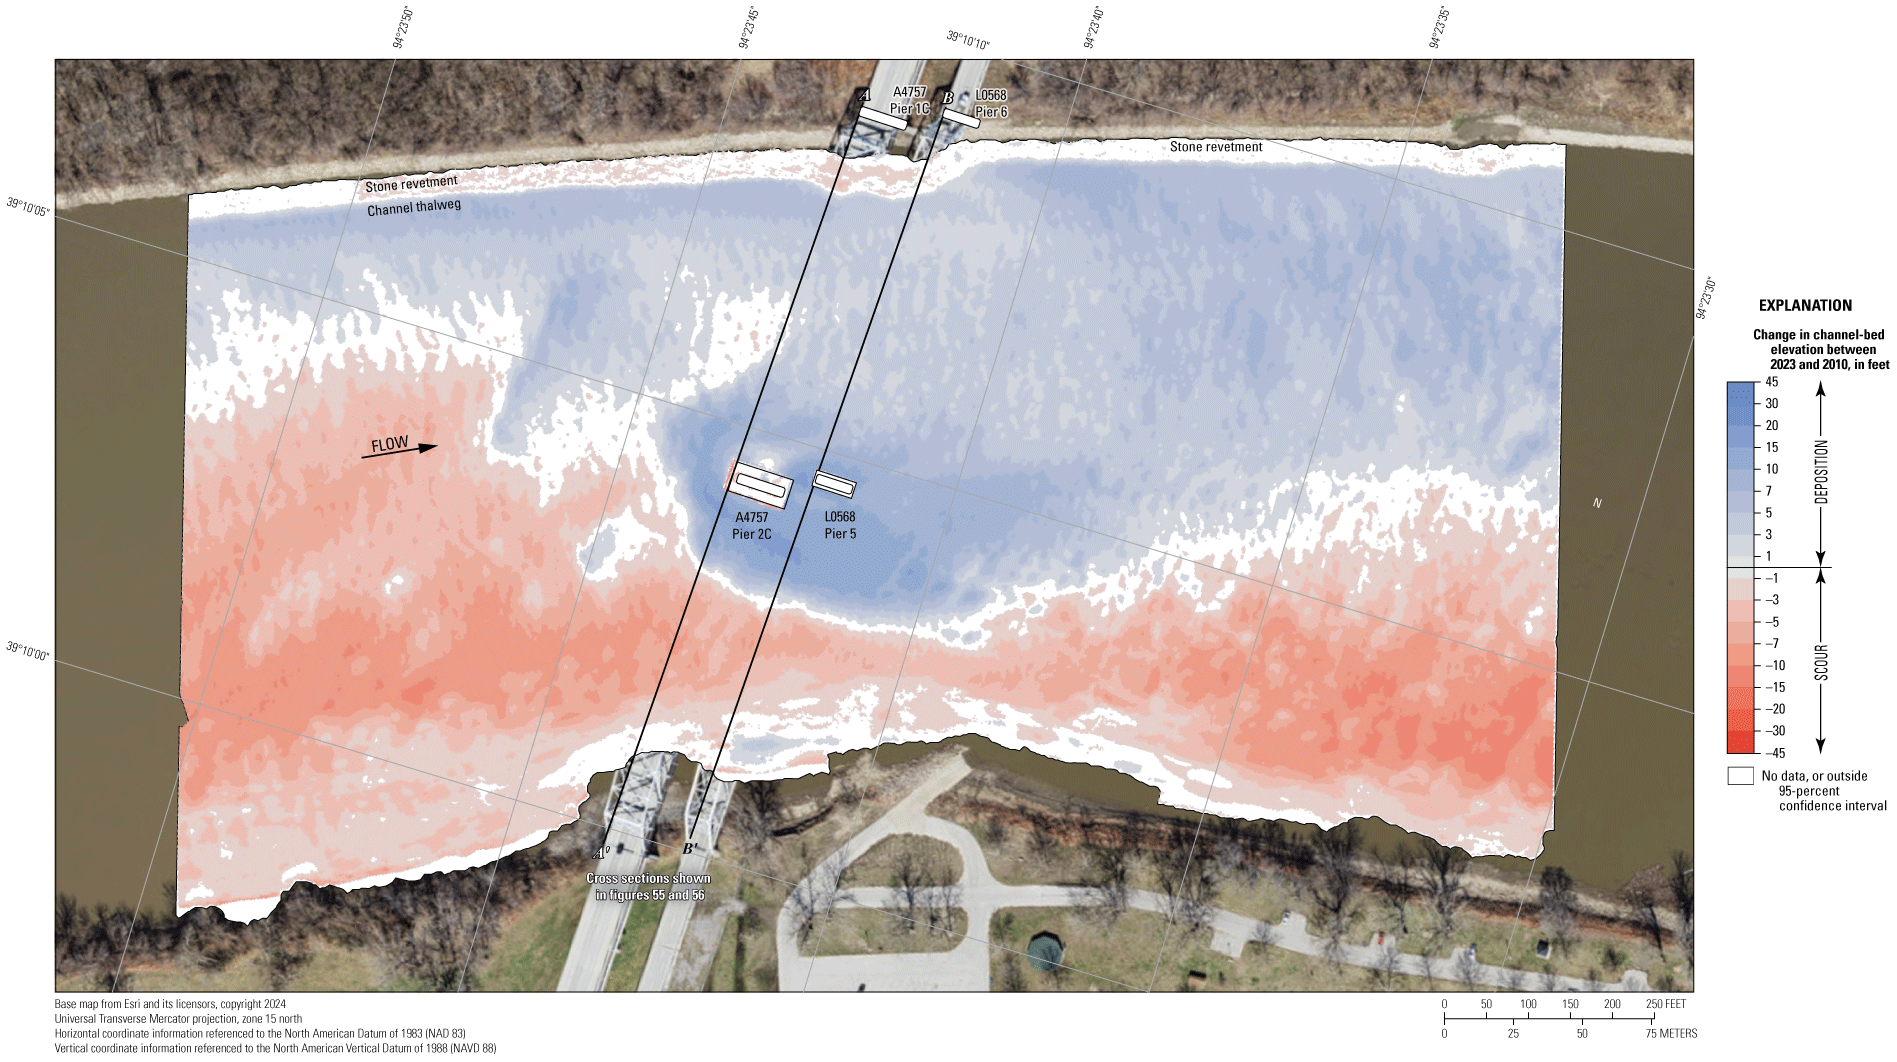
Map showing difference between surfaces created from bathymetric surveys of the Missouri River channel near structures A4757 and L0568 on State Highway 291 near Kansas City, Missouri, on August 9, 2023, and March 18, 2010, with probabilistic thresholding.
The vertically averaged velocity vectors indicate mostly uniform flow throughout the reach, ranging from about 1 ft/s along the inside of the bend on the right (south) bank to about 4 to 6 ft/s in much of the rest of the channel (fig. 61). Moderate turbulence was observed in several sections, particularly near the bank protrusions near the bridges and downstream from the main channel piers (fig. 61).
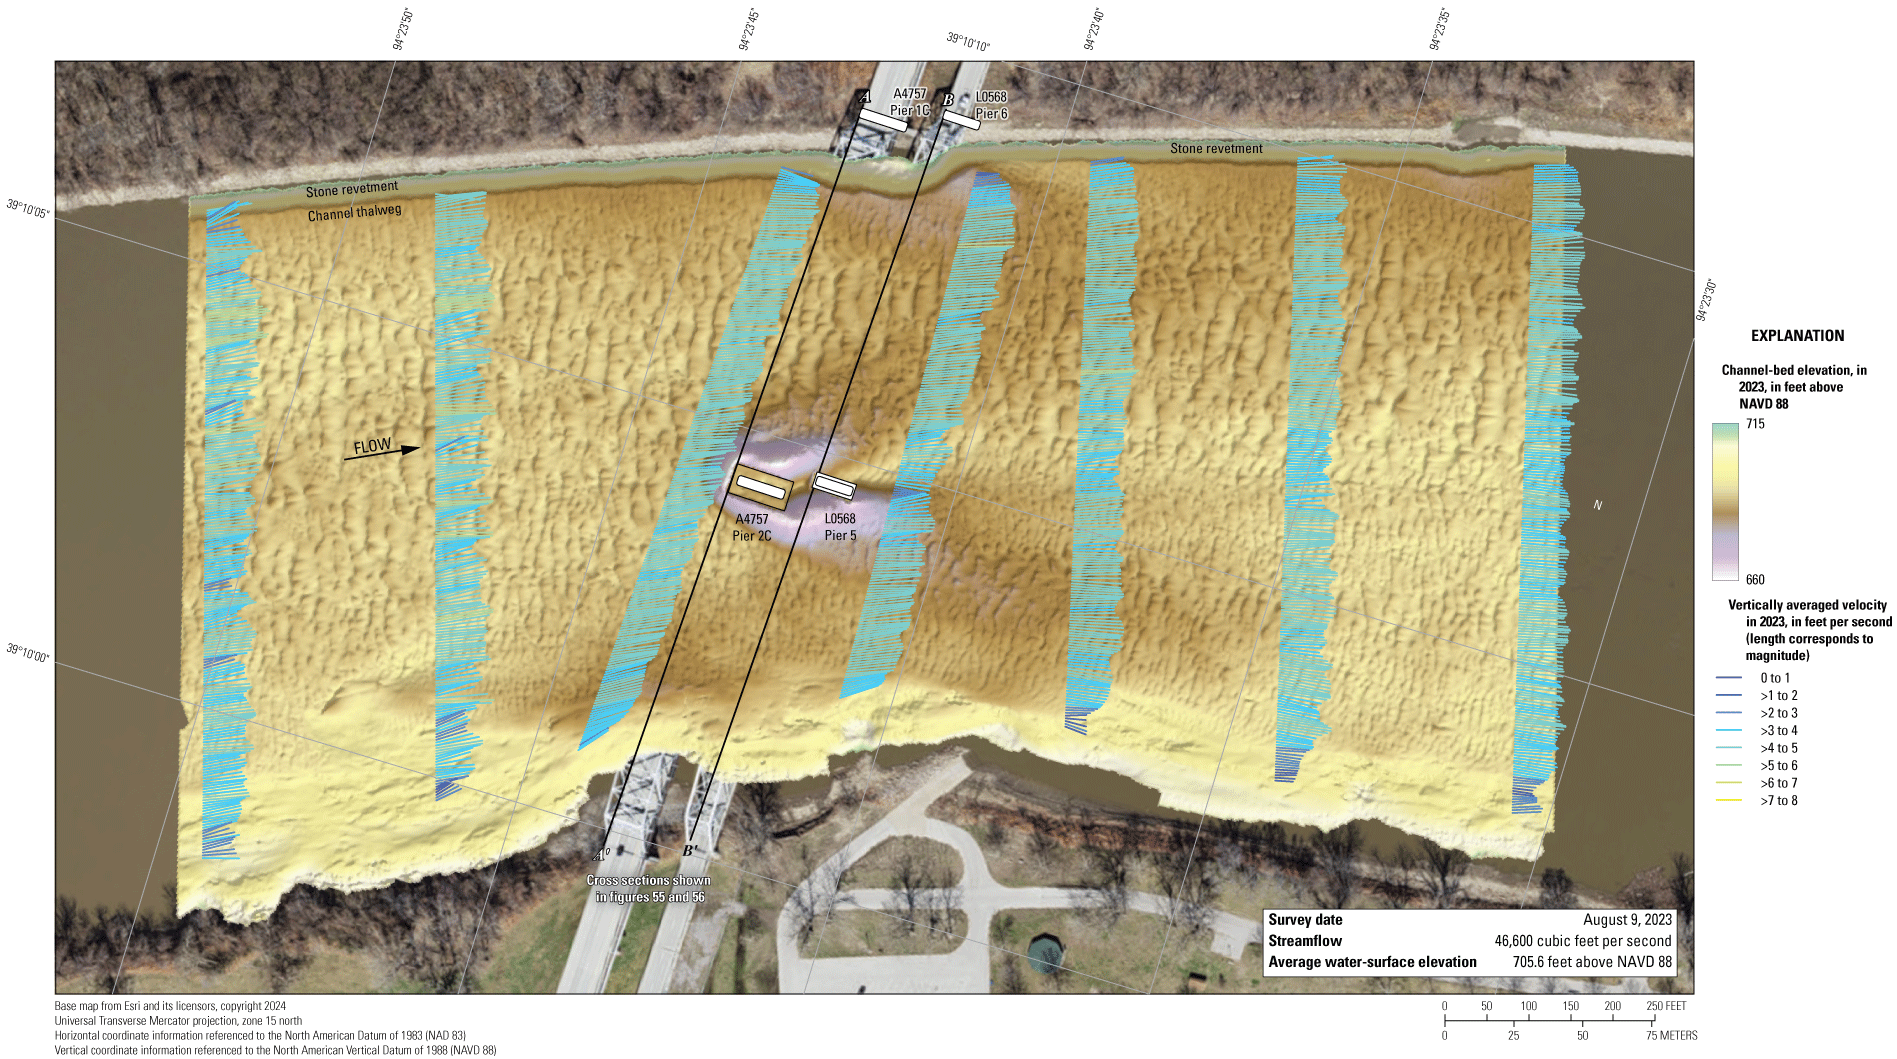
Map showing bathymetry and vertically averaged velocities of the Missouri River channel near structures A4757 and L0568 on State Highway 291 near Kansas City, Missouri. [NAVD 88, North American Vertical Datum of 1988; >, greater than]
General Findings and Implications
Several findings in the site-specific discussions were common to all surveyed bridges, and some more general findings were only evident when they were examined as a set. These general findings are of benefit when assessing scour at the surveyed bridges, as well as other bridges close by or in similar settings.
Comparing Flow Conditions of this Survey with Previous Surveys
Arneson and others (2012) separated long-term aggradation and degradation of a channel from the contraction scour and local scour that happens at a bridge site during floods. Long-term aggradation or degradation refers to changes in channel-bed elevation observed at a particular site as a result of long-term, systemic changes in the overall channel system. Contraction scour refers to the general change in the channel-bed elevation caused by increased material in suspension and transport caused by flood water passing through a constricted bridge opening. Local scour refers to the localized erosion of material caused by flow-vortex action that forms near bridge piers and abutments. Although all the scour processes (long-term, contraction, and local scour) are continually at work, contraction and local scour are generally cyclic for the live-bed scour typically observed in alluvial channels (Arneson and others, 2012) and generally result in a decrease and then subsequent increase of the channel-bed elevation during and after a flood.
Previous studies using an MBES in the Kansas City area and elsewhere (see report references listed in table 1) have shown that the configuration and size of bed forms observed during a particular survey depend on more than the instantaneous streamflow at a given site. Several factors and interactions of factors affect sediment transport conditions and the resultant bed configuration. Although the current (2023) study does not examine all the antecedent conditions that created the observed channel-bed configuration in the most recent (2023) surveys, the following discussion attempts to draw conclusions based on the conditions observed at each site during the most recent and previous surveys.
As discussed in previous reports about Kansas City area bridges (Huizinga, 2010, 2012, 2016, 2020a, 2022a), the durations of most large floods on the Missouri River can be measured in days to weeks because of the contributing large upstream drainage area. Dams on the upper Missouri River upstream from Yankton, South Dakota, can lessen the magnitude and lengthen the duration of a given flood because of streamflow regulation, as was seen during the 2011 flood (Huizinga, 2012), but the substantial drainage area contributing unregulated streamflows downstream from Yankton can create substantial variability in the streamflow conditions at Kansas City. As described in the “Description of Streamflow Conditions” section earlier in this report, the Missouri River was in a period of low flow for much of the summer of 2023, being at or below the 10-percent mean daily value for several periods between April 15 and July 1, 2023, and generally between the 25- and 75-percent mean daily values for much of the rest of the year (fig. 2). Streamflow from the surveys of the current (2023) study was in a low floodflow to nonflood regime and was the lowest streamflow from among all the surveys at these sites.
The average differences between the 2023 and 2019 bathymetric surfaces ranged from 0.07 to 4.16 ft, which indicates overall deposition between the survey dates (table 7), as might be expected based on streamflow at the time of the 2023 survey alone. However, the average differences between the 2023 and 2015 bathymetric surfaces ranged from 1.44 to –1.88 ft, which indicates an overall balance of scour and deposition between those surveys, despite the lower flow conditions in 2023 (table 7). Similarly, the average difference between the 2023 and 2011 bathymetric surfaces ranged from 3.18 to –5.19 ft, which indicates a relative balance of scour and deposition overall, albeit tending towards scour as might be expected with the substantial flood event in 2011 (table 7).
When examining the average channel-bed and water-surface elevations over time (fig. 62), the water-surface elevations from the 2023 surveys were clearly the lowest of the five surveys taken at all the sites, and the channel-bed elevations from the 2023 surveys follow a more consistent and gradual longitudinal decline (fig. 62) in contrast to the channel-bed elevations from previous surveys that have exhibited substantial longitudinal variability. Various cause-and-effect mechanisms for the observed longitudinal variability of channel-bed and water-surface elevations have been hypothesized in the previous studies (Huizinga, 2010, 2012, 2016, 2020a, 2022a), such as effects from tributary inflow from the Kansas River upstream from structure A4649 near downtown Kansas City (fig. 1), straight versus curved reaches, a slug of sediment in parts of the reach during the 2011 flood, and other effects of flooding before the previous surveys. However, the general low-flow conditions experienced in 2023 appear to have had the effect of smoothing away the longitudinal variability observed in the previous surveys, resulting in a channel-bed and water-surface elevation profile that are parallel with each other in 2023 (fig. 62).
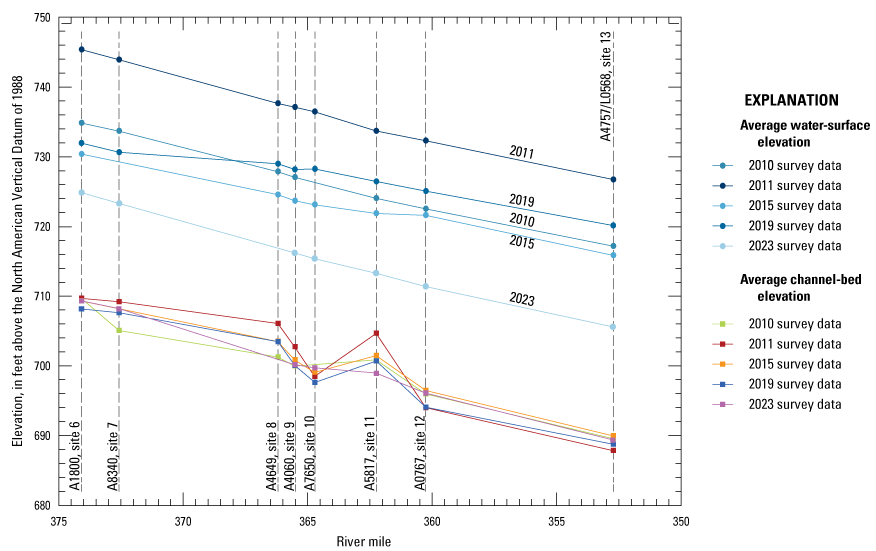
Graph showing average water-surface and channel-bed elevations near bridges on the Missouri River near Kansas City, Missouri, from surveys in 2010, 2011, 2015, 2019, and 2023 (Huizinga 2010, 2012, 2016, 2022a, and this report, respectively).
The spatially localized minimum channel-bed elevation observed at structure A7650 (site 10) in the 2015 and 2019 surveys (Huizinga, 2022a) was not evident in the 2023 surveys (fig. 62); however, even though the minimum channel-bed elevation was not observed in the 2023 surveys, that does not negate the hypothesis that this site is at or near a local feature that controls sediment deposition and scour. As posited in Huizinga (2016), the feature may be a combination of the constriction at this site (fig. 30) and being near the downstream end of the relatively straight reach of the river between structures A4649 and A7650 (fig. 1). Huizinga (2016) further posited that the sediment unable to deposit near structure A7650 during higher flow conditions might be flushed downstream and deposited at the next downstream site, structure A5817 (site 11), which seems consistent with the average channel-bed elevation profile observed in previous surveys (fig. 62). The constant gradual decline of the channel-bed elevation profile in the 2023 surveys may indicate that the lower streamflow in 2023 did not create the same kind of sediment transport conditions as in the previous surveys.
The relatively consistent shape of the frequency distribution and cumulative percentage curves (hereinafter referred to as “accumulation curves”) between the surveys at site 10 (fig. 31) further substantiates that site 10 may be a channel-sediment control point, allowing minor deposition during lower streamflows as in 2015 and 2023, but flushing the deposition during higher streamflows to make for a relatively consistent bed-elevation distribution during higher streamflow. Alternatively, the variability of the frequency distribution and accumulation curves between the surveys at structure A5817 (site 11) (fig. 38) displays a wider range of elevations at a lower percentage of grid cells, resulting in a wider range of slopes for the accumulation curves not clearly tied to streamflow. Accumulation curves that are steep indicate a channel bed with a narrower range of elevations (more level throughout the reach, such as structure A7560 [fig. 30]), whereas those that are less steep indicate a wider variation of elevations. Accumulation curves with “steps” indicate a channel with distinct groups of elevations, such as a thalweg on one side of the channel and a shallow area on the opposite side (such as those for structure A1800 [fig. 6 and fig. 7] or structures A4757/L0568 [fig. 53 and fig. 54]).
In the previous study (Huizinga, 2022a), an examination of the frequency distributions of the various sites through time (fig. 63) supports the scenario of a sediment control feature being near structure A7650. In the previous surveys (2010–19), the frequency distribution curves for structures A4060 and A7650 tended to have local maxima with a higher percentage of survey-grid cells than other sites in all the surveys (fig. 63A), and the accumulation curves for these two sites were generally steeper than for the other surveys in the area (fig. 63B), which indicates a more level bed with less variation in elevation at these sites. However, in 2023, several other sites also had local maxima (“2023 survey” in fig. 63A), and the accumulation curves all were steep (“2023 survey” in fig. 63B) compared with curves from previous surveys, which is likely the result of lower streamflow conditions during the 2023 surveys. The frequency distributions were generally narrower in the 2023 survey, with a higher percentage of survey-grid cells in a particular elevation range than previous surveys (“2023 survey” in fig. 63A), which resulted in generally steeper accumulation curves (“2023 survey” in fig. 63B). Furthermore, in 2023, the frequency distributions and accumulation curves more consistently decrease in elevation with distance downstream than in previous surveys.
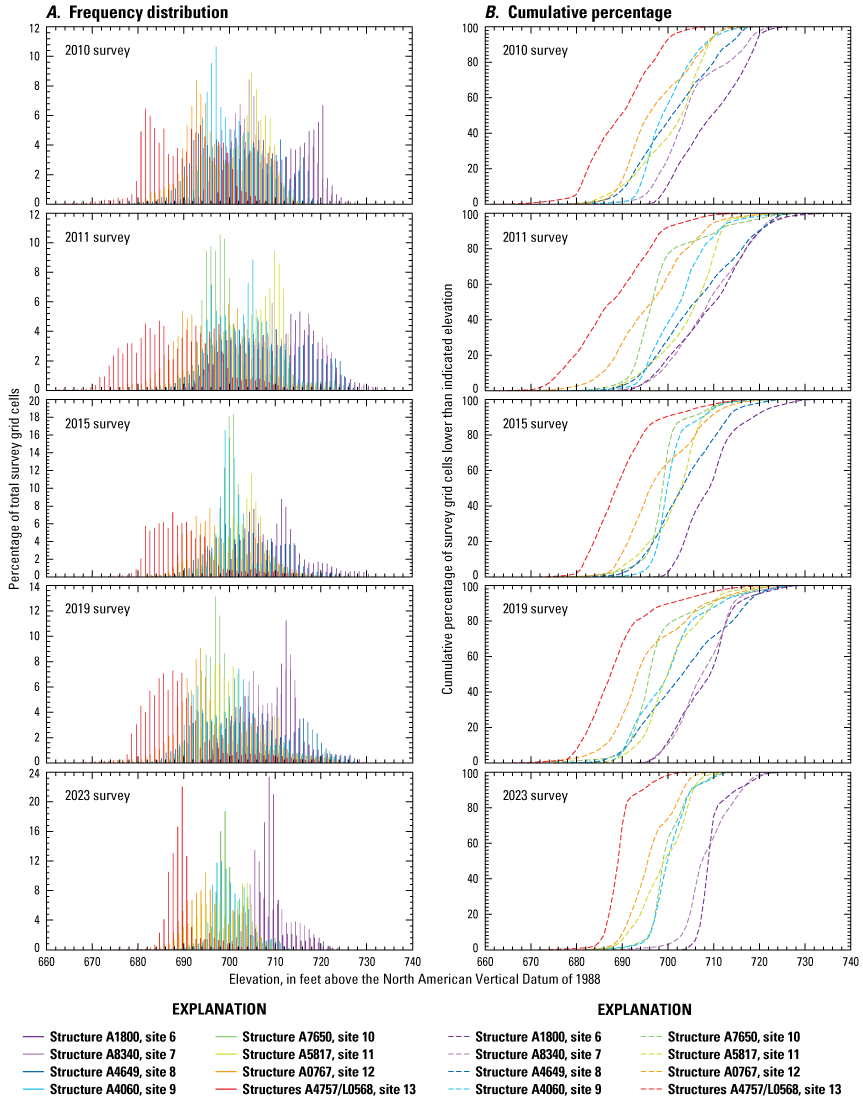
Graphs showing comparison of frequency distribution and cumulative percentage of bed elevations for bathymetric survey grid cells in 1-foot elevation bins from surveys on the Missouri River near Kansas City in 2010, 2011, 2015, 2019, and 2023 (Huizinga 2010, 2012, 2016, 2022a, and this report, respectively). A, frequency distribution; B, cumulative percentage.
An examination of the dune features at the various sites through time can also explain the different flow regimes during the various surveys. Nearly all the features in the 2023 surveys were small dunes and ripples. At structure A1800 (site 6, fig. 1), the dune features were medium to very large for all the surveys at that site, almost regardless of the streamflow conditions (see fig. 6 in Huizinga, 2010, 2012, 2016, 2022a). Whereas many of the surveys in 2011 had a planar bed area and large to very large dune features that were indicative of high energy flow (Simons and Richardson, 1966), the 2023 surveys were more like the 2015 surveys, being filled throughout with mostly small dune features and superimposed ripples (fig. 6, fig. 14, fig. 22, fig. 30, fig. 37, fig. 45, and fig. 53). The largest dune features from the 2023 surveys were observed at structure A1800 (site 6, fig. 6). The smaller size and amplitude of the dune features in the 2023 survey compared with all the previous surveys indicates less bed material and bedload transport overall (Simons and Richardson, 1966; Simon and Associates, 1985).
Effects of Riprap Blankets near Piers
The main channel pylon of structure A7650 (site 10) has piles of rock surrounding it (fig. 30), and scour countermeasures in the form of a riprap blanket were placed around the central main channel pier of structure A0767 (site 12; fig. 45) in 2020 as described in the previous study (Huizinga, 2022a). A riprap blanket was being installed at the central main channel pier of structure A5817 (site 11; fig. 37) at the time of the 2023 surveys. Whereas the riprap blankets at structures A5817 (site 11) and A0767 (site 12) were specifically designed to resist scour at those sites, it is unknown whether the rock around the main channel pylon of structure A7650 (site 10) was specifically designed, was an ad hoc placement of riprap to mitigate potential scour at that substructural bridge element, or was simply construction detritus. Nevertheless, these features had a substantial effect on the observed scour at these piers, particularly when compared with the scour on other piers at the same sites without such a feature or when examining the survey results from before and after installation of a feature.
The main channel pylon of structure A7650 (site 10) has historically been partially surrounded with piles of coarse material (fig. 30, fig. 32). Bridge plans do not indicate that these piles are a designed scour countermeasure. Some settling of the various piles around the pylon was observed in the 2023 survey compared with the previous surveys (fig. 33, fig. 34, fig. 35) such that the bottom of the seal course was exposed by 5 to 10 ft along the upstream face of the bridge (fig. 32). Nevertheless, these piles seem to effectively divert most of the scour near the pylon away from the pylon base. Scour immediately downstream from the pylon was substantial, particularly on the left side of the pylon (fig. 30) but likely does not directly affect the stability of the pylon.
Pier 7 of structure A0767 on Interstate 435 (site 12, fig. 1) has a long history of substantial scour (Huizinga, 2010, 2012, 2016). An enlarged seal course and riprap blanket were installed between August and October of 2020 around the pier that was a minimum of 7.5 ft thick (Huizinga, 2022a). The 2023 survey clearly indicated the riprap blanket limited the scour near pier 7 (fig. 45, fig. 47). The top surface of the blanket is very irregular, partly because of the size of riprap stones used (fig. 47, fig. 1.6), and had a substantial depression next to the pier nose that seemed to penetrate it (fig. 47, fig. 1.6), which may have been the result of back-filling the existing scour hole or other low spot when the blanket was installed.
The partially installed riprap blanket near pier 2 of structure A5817 on State Highway 269 also clearly limited the scour near that pier, except where the blanket had not yet been completed on the right (south) side of the pier(fig. 37; fig. 1.5). The hole on the downstream right (south) side of the pier was the result of channel-bed dredging in preparation for the scour countermeasures and was fully mitigated by the completed riprap blanket like the area to the left (north) of the pier (fig. 1.5).
Summary and Conclusions
Bathymetric and velocimetric data were collected during surveys by the U.S. Geological Survey, in cooperation with the Missouri Department of Transportation, near 8 bridges at 7 highway crossings of the Missouri River in the Kansas City, Missouri, area on August 8–9, 2023. A multibeam echosounder mapping system was used to obtain channel-bed elevations for areas ranging from 1,550 to 1,640 feet (ft) longitudinally and generally extending across the active channel from bank to bank in the Missouri River during low floodflow to nonflood conditions. These surveys represented the channel conditions at the time and provided characteristics of scour holes that may be useful in developing predictive guidelines or equations for scour holes. These data may also be useful to the Missouri Department of Transportation as a low floodflow assessment of the bridges to help determine their stability and integrity with respect to the bridge scour that predominates during floods.
The estimated gridded uncertainty for the bathymetric surface of each survey area was computed as an estimate of the accuracy to be expected for each point with all relevant sources of error considered. An analysis of the surveys indicated that more than 95 percent of the bathymetric data at all the sites have a gridded uncertainty of less than 0.10 ft. The gridded uncertainty of the data has been decreasing with time compared with data from previous surveys, and this can be attributed to improvements in data-collection equipment and methods.
At all the surveyed bridges, fluvial geomorphic features were detected in the channel, generally consisting of small dunes and ripples that indicate minor transport of bedload. Rock outcrops were also detected along one bank at several sites where the alluvial material of the channel bed had been washed away, consistent with previous surveys. Bathymetric data were collected around every pier that was in water, except for piers in very shallow water and around the nose of one pier that is surrounded by a persistent debris raft. Scour holes were at most piers where bathymetry could be obtained, except for those piers on banks or surrounded by riprap.
All the bridge sites in this study were previously surveyed. Comparisons between bathymetric surfaces from the previous surveys and those of the current (2023) study indicate some correlation in channel-bed elevations with streamflow conditions. The Missouri River was in a period of low flow for much of the summer of 2023, being at or below the 10-percent mean daily value for much of the period from April 15 to July 1, 2023, and near the 25-percent mean daily value for much of the rest of the year. Streamflow during the surveys in the current (2023) study was in a low floodflow to nonflood regime, and the lowest of all the various surveys at these sites. The average difference between the 2023 and 2019 bathymetric surfaces ranged from 0.07 to 4.16 ft, which indicates overall deposition to the surfaces between the survey dates, as might be expected based purely on streamflow at the time of the survey. However, the average differences between the 2023 and 2015 bathymetric surfaces ranged from 1.44 to –1.88 ft, which indicates an overall balance of scour and deposition to the surfaces between those surveys, despite the lower flow conditions in 2023. Similarly, the average difference between the 2023 and 2011 bathymetric surfaces ranged from 3.18 to –5.19 ft, which indicates an overall relative balance of scour and deposition in those surfaces, albeit tending towards scour as might be expected with the substantial flood event in 2011.
A spatially localized minimum channel-bed elevation at structure A7650 (site 10) compared with elevations at adjacent sites that had been observed in previous surveys was not evident in the 2023 survey. In previous studies, site 10 was hypothesized to be at or near a local channel feature that controls sediment deposition and scour, and may be a combination of the minor constriction at the site and being near the downstream end of the relatively straight reach of river. Furthermore, previous studies showed that the average channel-bed elevation values and the distribution of channel-bed elevations imply that sediment unable to deposit near structure A7650 may be flushed downstream and deposited at the next downstream site, structure A5817 (site 11). However, in 2023, the average channel-bed elevation values were more consistently and gradually decreasing in a downstream direction. Although this does not negate the hypothesis from the previous study, it also does not definitively confirm it.
Several of the structures had piers that were skewed to primary approach flow, and at most of these structures, the scour holes were deeper and longer on the side of the pier with impinging flow, with some amount of deposition on the leeward side, as typically has been observed at piers skewed to approach flow. However, at structure A7650 (site 10), the scour hole was deeper and longer on the leeward side of the pylon, possibly because of a deflection and contraction of flow caused by a protrusion of the corresponding bank at the bridge.
Scour countermeasures in the form of a riprap blanket had been installed at site 12 (structure A0767), and were being installed at site 11 (structure A5817). Survey results from before and after installation of these countermeasures show these features had a substantial effect on mitigating the observed scour at these piers, particularly when compared with other piers at other sites without such a feature.
References Cited
Arneson, L.A., Zevenbergen, L.W., Lagasse, P.F., and Clopper, P.E., 2012, Evaluating scour at bridges (5th ed.): U.S. Federal Highway Administration Publication FHWA–HIF–12–003, Hydraulic Engineering Circular no. 18, 340 p., accessed September 30, 2022, at https://www.fhwa.dot.gov/engineering/hydraulics/pubs/hif12003.pdf.
Becker, L.D., 1994, Investigation of bridge scour at selected sites on Missouri streams: U.S. Geological Survey Water-Resources Investigations Report 94–4200, 40 p., accessed September 30, 2022, at https://doi.org/10.3133/wri944200.
Calder, B.R., and Mayer, L.A., 2003, Automatic processing of high-rate, high-density multibeam echosounder data: Geochemistry, Geophysics, Geosystems (G3), v. 4, no. 6, 22 p. [Also available at https://doi.org/10.1029/2002GC000486.]
Densmore, B.K., Strauch, K.R., and Dietsch, B.J., 2013, Hydrographic surveys of the Missouri and Yellowstone Rivers at selected bridges and through Bismarck, North Dakota, during the 2011 flood: U.S. Geological Survey Scientific Investigations Report 2013–5087, 59 p., accessed September 30, 2022, at https://doi.org/10.3133/sir20135087.
Dietsch, B.J., Densmore, B.K., and Strauch, K.R., 2014, Repeated multibeam echosounder hydrographic surveys of 15 selected bridge crossings along the Missouri River from Niobrara to Rulo, Nebraska, during the flood of 2011: U.S. Geological Survey Scientific Investigations Report 2014–5062, 53 p., accessed September 30, 2022, at https://doi.org/10.3133/sir20145062.
Esri, 2024, ArcGIS Pro Resources: Esri web page, accessed December 19, 2024, at https://www.esri.com/en-us/arcgis/products/arcgis-pro/resources.
Gilbert, G.K., and Murphy, E.C., 1914, The transportation of debris by running water: U.S. Geological Survey Professional Paper 86, 263 p., accessed September 30, 2022, at https://doi.org/10.3133/pp86.
Hughes-Clarke, J.E., Mayer, L.A., and Wells, D.E., 1996, Shallow-water imaging multibeam sonars—A new tool for investigating seafloor processes in the coastal zone and on the continental shelf: Marine Geophysical Researches, v. 18, p. 607–629, accessed November 29, 2022, at https://doi.org/10.1007/BF00313877.
Huizinga, R.J., 2010, Bathymetric surveys at highway bridges crossing the Missouri River in Kansas City, Missouri, using a multibeam echo sounder, 2010: U.S. Geological Survey Scientific Investigations Report 2010–5207, 61 p., accessed August 24, 2023, at https://doi.org/10.3133/sir20105207.
Huizinga, R.J., 2011, Bathymetric surveys at highway bridges crossing the Missouri and Mississippi Rivers near St. Louis, Missouri, 2010: U.S. Geological Survey Scientific Investigations Report 2011–5170, 75 p., accessed August 24, 2023, at https://doi.org/10.3133/sir20115170.
Huizinga, R.J., 2012, Bathymetric and velocimetric surveys at highway bridges crossing the Missouri River in and into Missouri during summer flooding, July–August 2011: U.S. Geological Survey Scientific Investigations Report 2012–5204, 166 p., accessed August 24, 2023, at https://doi.org/10.3133/sir20125204.
Huizinga, R.J., 2013, Results of repeat bathymetric and velocimetric surveys at the Amelia Earhart Bridge on U.S. Highway 59 over the Missouri River at Atchison, Kansas, 2009–2013: U.S. Geological Survey Scientific Investigations Report 2013–5177, 50 p., accessed August 24, 2023, at https://doi.org/10.3133/sir20135177.
Huizinga, R.J., 2014, Bathymetric and velocimetric surveys at highway bridges crossing the Missouri River between Kansas City and St. Louis, Missouri, April–May, 2013: U.S. Geological Survey Scientific Investigations Report 2014–5116, 79 p., accessed August 24, 2023, at https://doi.org/10.3133/sir20145116.
Huizinga, R.J., 2015, Bathymetric and velocimetric surveys at highway bridges crossing the Missouri and Mississippi Rivers on the periphery of Missouri, June 2014: U.S. Geological Survey Scientific Investigations Report 2015–5048, 81 p., accessed August 24, 2023, at https://doi.org/10.3133/sir20155048.
Huizinga, R.J., 2016, Bathymetric and velocimetric surveys at highway bridges crossing the Missouri River near Kansas City, Missouri, June 2–4, 2015: U.S. Geological Survey Scientific Investigations Report 2016–5061, 93 p., accessed August 24, 2023, at https://doi.org/10.3133/sir20165061.
Huizinga, R.J., 2017a, Bathymetric and velocimetric surveys at highway bridges crossing the Missouri and Mississippi Rivers near St. Louis, Missouri, May 23–27, 2016: U.S. Geological Survey Scientific Investigations Report 2017–5076, 102 p., accessed August 24, 2023, at https://doi.org/10.3133/sir20175076.
Huizinga, R.J., 2017b, Bathymetry and velocity data from surveys at highway bridges crossing the Missouri and Mississippi Rivers near St. Louis, Missouri, October 2008 through May 2016: U.S. Geological Survey data release, accessed August 24, 2023, at https://doi.org/10.5066/F71C1VCC.
Huizinga, R.J., 2020a, Bathymetric and velocimetric surveys at highway bridges crossing the Missouri River between Kansas City and St. Louis, Missouri, May 22–31, 2017: U.S. Geological Survey Scientific Investigations Report 2020–5018, 104 p., accessed August 24, 2023, at https://doi.org/10.3133/sir20205018.
Huizinga, R.J., 2020b, Bathymetry and velocity data from surveys at highway bridges crossing the Missouri River in Kansas City, Missouri, March 2010 through May 2017: U.S. Geological Survey data release, accessed August 24, 2023, at https://doi.org/10.5066/P9L6GW57.
Huizinga, R.J., 2020c, Bathymetry and velocity data from surveys at highway bridges crossing the Missouri River between Kansas City and St. Louis, Missouri, January 2010 through May 2017: U.S. Geological Survey data release, accessed August 24, 2023, at https://doi.org/10.5066/P94M4US7.
Huizinga, R.J., 2020d, Bathymetry and velocity data from surveys at highway bridges crossing the Missouri and Mississippi Rivers on the periphery of Missouri, December 2008 through August 2018: U.S. Geological Survey data release, accessed August 24, 2023, at https://doi.org/10.5066/P9WDI9YF.
Huizinga, R.J., 2020e, Bathymetric and velocimetric surveys at highway bridges crossing the Missouri and Mississippi Rivers on the periphery of Missouri, July–August 2018: U.S. Geological Survey Scientific Investigations Report 2020–5088, 100 p., accessed August 24, 2023, at https://doi.org/10.3133/sir20205088.
Huizinga, R.J., 2021, Bathymetry and velocity data from surveys at highway bridges crossing the Missouri River in Kansas City, Missouri, in August 2019, August 2020, and October 2020: U.S. Geological Survey data release, accessed August 24, 2023, at https://doi.org/10.5066/P96TX8AE.
Huizinga, R.J., 2022a, Bathymetric and velocimetric surveys at highway bridges crossing the Missouri River near Kansas City, Missouri, August 2019, August 2020, and October 2020: U.S. Geological Survey Scientific Investigations Report 2021–5098, 112 p., accessed August 24, 2023, at https://doi.org/10.3133/sir20215098.
Huizinga, R.J., 2022b, Bathymetry and velocity data from surveys at highway bridges crossing the Missouri and Mississippi Rivers near St. Louis, Missouri, August 3–10, 2020: U.S. Geological Survey data release, accessed April 25, 2023, at https://doi.org/10.5066/P9F04JC5.
Huizinga, R.J., 2023, Bathymetric and velocimetric surveys at highway bridges crossing the Missouri and Mississippi Rivers near St. Louis, Missouri, August 3–10, 2020 (ver. 1.1, June 2023): U.S. Geological Survey Scientific Investigations Report 2023–5050, 129 p., accessed June 1, 2023, at https://doi.org/10.3133/sir20235050.
Huizinga, R.J., 2024a, Bathymetric and velocimetric surveys at highway bridges crossing the Missouri River between Kansas City and St. Louis, Missouri, May 19–26, 2021: U.S. Geological Survey Scientific Investigations Report 2024–5021, 101 p., accessed December 19, 2024, at https://doi.org/10.3133/sir20245021.
Huizinga, R.J., 2024b, Bathymetric and velocimetric surveys at highway bridges crossing the Missouri and Mississippi Rivers on the periphery of Missouri, June 13–22, 2022: U.S. Geological Survey Scientific Investigations Report 2024–5032, 82 p., accessed December 19, 2024, at https://doi.org/10.3133/sir20245032.
Huizinga, R.J., Elliott, C.M., and Jacobson, R.B., 2010, Bathymetric and velocimetric survey and assessment of habitat for pallid sturgeon on the Mississippi River in the vicinity of the proposed Interstate 70 Bridge at St. Louis, Missouri: U.S. Geological Survey Scientific Investigations Report 2010–5017, 28 p., accessed August 24, 2023, at https://doi.org/10.3133/sir20105017.
Huizinga, R.J., and Rivers, B.C., 2023a, Bathymetry and velocity data from surveys at highway bridges crossing the Missouri River between Kansas City and St. Louis, Missouri, May 19–26, 2021 (ver. 2.0, August 2023): U.S. Geological Survey data release, accessed December 19, 2024, at https://doi.org/10.5066/P9ULGQ4W.
Huizinga, R.J., and Rivers, B.C., 2023b, Bathymetry and velocity data from surveys at highway bridges crossing the Missouri and Mississippi Rivers on the periphery of Missouri, June 13–22, 2022: U.S. Geological Survey data release, accessed December 19, 2024, at https://doi.org/10.5066/P9K66GYC.
Huizinga, R.J., and Rivers, B.C., 2025, Bathymetry and velocity data from surveys at highway bridges crossing the Missouri River in Kansas City, Missouri, August 8–9, 2023: U.S. Geological Survey data release, accessed August 14, 2025, at https://doi.org/10.5066/P1XUN9A8.
Huizinga, R.J., and Rydlund, P.H., Jr., 2004, Potential-scour assessments and estimates of scour depth using different techniques at selected bridge sites in Missouri: U.S. Geological Survey Scientific Investigations Report 2004–5213, 42 p., accessed August 24, 2023, at https://doi.org/10.3133/sir20045213.
International Hydrographic Organization, 2022, International Hydrographic Organization standards for hydrographic surveys (6th ed.): Monaco, International Hydrographic Bureau, Special publication no. 44, 42 p., accessed January 21, 2025, at https://iho.int/uploads/user/pubs/standards/s-44/S-44_Edition_6.1.0.pdf.
Mueller, D.S., Wagner, C.R., Rehmel, M.S., Oberg, K.A., and Rainville, F., 2013, Measuring discharge with acoustic Doppler current profilers from a moving boat (ver. 2.0, December 2013): U.S. Geological Survey Techniques and Methods, book 3, chap. A22, 95 p., accessed January 21, 2025, at https://doi.org/10.3133/tm3A22.
National Geodetic Survey, 2020, GEOID18: National Oceanic and Atmospheric Administration web page, accessed March 5, 2025, at https://www.ngs.noaa.gov/GEOID/GEOID18/.
Parsons, D.R., Jackson, P.R., Czuba, J.A., Engel, F.L., Rhoads, B.L., Oberg, K.A., Best, J.L., Mueller, D.S., Johnson, K.K., and Riley, J.D., 2013, Velocity Mapping Toolbox (VMT)—A processing and visualization suite for moving-vessel ADCP measurements: Earth Surface Processes and Landforms, v. 38, no. 11, p. 1244–1260, accessed January 21, 2025, at https://doi.org/10.1002/esp.3367.
Rivers, B.C., Huizinga, R.J., and Waite, G.J., 2024, Bathymetric contour maps, surface area and capacity tables, and bathymetric change maps for selected water-supply lakes in Missouri, 2022–23: U.S. Geological Survey Scientific Investigations Report 2024–5114, 70 p., accessed January 24, 2025, at https://doi.org/10.3133/sir20245114.
Riverscapes Consortium, 2024, Geomorphic change detection software: Riverscapes Consortium web page, accessed December 19, 2024, at https://gcd.riverscapes.net/.
Rydlund, P.H., Jr., 2009, Real-time river channel-bed monitoring at the Chariton and Mississippi Rivers in Missouri, 2007–09: U.S. Geological Survey Scientific Investigations Report 2009–5254, 27 p., accessed January 21, 2025, at https://doi.org/10.3133/sir20095254.
Simons, D.B., and Richardson, E.V., 1966, Resistance to flow in alluvial channels: U.S. Geological Survey Professional Paper 422–J, 61 p., accessed April 27, 2023, at https://doi.org/10.3133/pp422J.
U.S. Army Corps of Engineers, 2013, Engineering and design—Hydrographic surveying: Washington D.C., U.S. Army Corps of Engineers, manual no. EM 1110–2–1003, 560 p., accessed January 21, 2025, at https://www.publications.usace.army.mil/Portals/76/Publications/EngineerManuals/EM_1110-2-1003.pdf?ver=gDGVUj_0XR2sXHiIpQZv2Q%3d%3d.
U.S. Army Corps of Engineers, 2023, Missouri River flow frequency study—Yankton, South Dakota to Hermann, Missouri: U.S. Army Corps of Engineers web page, accessed March 7, 2025, at https://www.nwk.usace.army.mil/Missions/Civil-Works/Civil-Works-Programs-And-Projects/Lower-Missouri-River-Basin/Flow-and-Stage-Frequency-Analysis/.
U.S. Geological Survey, 2024a, USGS water data for the Nation: U.S. Geological Survey National Water Information System database, accessed December 19, 2024, at https://doi.org/10.5066/F7P55KJN.
U.S. Geological Survey, 2024b, USGS streamgage statistics for station 06893000: U.S. Geological Survey WaterWatch toolkit, accessed December 19, 2024, at https://waterwatch.usgs.gov/index.php?sno=06893000&ds=dv01d_por&btnGo=GO&m=sitempnn.
Glossary
- bent
A vertical, load-bearing, intermediate bridge substructure unit between the ends of a bridge used to support the bridge at intermediate intervals, typically consisting of two or more piles (referred to as a “pile bent”) or columns, each supported by an individual footing, pile, or drilled shaft.
- caisson
An older type of bridge foundation consisting of a watertight retaining structure used as the foundation of a bridge pier, constructed in such a way that the water can be pumped out, keeping the work environment dry while the ground under the caisson is excavated and the caisson “sunk” into final position below the ground line. Upon reaching its final position, the caisson is backfilled with sand or gravel for added weight and stability.
- cap
The upper or bearing part of a bridge pier or bent, usually made of concrete or hard stone and designed to distribute concentrated loads from the bridge superstructure evenly over the columns of the pier or bent.
- cofferdam
A temporary retaining structure used in pier and pylon construction to retain water and support the sides of an excavation where water is present. A cofferdam generally consists of vertical sheet piling around the perimeter of a bracing system and a bottom seal course. Once sealed, the water can be pumped out, keeping the work environment dry while the footing, columns, and other substructural elements are built.
- column
The primary part of a bridge bent, pier, or pylon used to convey the load of the bridge superstructure to the foundation.
- dolphin
An isolated structure for berthing and mooring of vessels away from the riverbank. A dolphin generally consists of a group of piles or a cylinder of sheet piling filled with gravel or concrete and sometimes is used in conjunction with a moored service or loading dock.
- drilled shaft
A cylindrical shaft that is drilled into the ground as a bridge foundation, typically extending through the alluvial material into underlying rock and filled with reinforced concrete.
- footing
A part of the foundation of a bridge bent, pier, or pylon used to transmit the load from the column to the ground, either directly or indirectly through piles or drilled shafts.
- L-head dike
A special kind of stone spur dike that projects from a riverbank, but includes a distinctive bend and continues along the channel in a downstream direction.
- pedestal
A transitional element occasionally used in a bridge pier or pylon, typically found between the column and a footing or caisson.
- pier
A vertical, load bearing, intermediate bridge substructure unit between the ends of a bridge used to support the bridge at intermediate intervals, consisting of a single column or shaft, or multiple columns connected with a strut or solid web, and generally supported by a single footing.
- pile
A long, narrow cylinder or beam made of wood, metal, or concrete used as part of the foundation of a bridge, typically driven into the ground from above and integrated into a seal course or footing of a pier, or the cap of a pile bent. Groups of piles are also used as mooring dolphins.
- pylon
A tower-like vertical, load bearing substructural unit that usually supports the cables of a suspension bridge or a cable-stayed bridge. A pylon typically extends above the bridge superstructure.
- seal course
The base of a newer type of bridge foundation, created when a cofferdam used to build the foundation is “sealed” with concrete at the underwater ground level to prevent water from entering the cofferdam from below.
- spur dike
Linear structure usually constructed of piled stone projecting from the bank in a river to redirect the river's own energy to protect the bank from erosion and to direct the axis of flow.
- stone revetment
A facing of stone, concrete units, or slabs built to protect a bank or other feature against erosion by wave action, currents, and surges.
- strut
A horizontal intermediate bridge substructure unit used to connect and brace two or more columns or shafts of a pier.
- substructure
The part of a bridge that supports the superstructure and transmits the load of the superstructure and deck to the ground through the foundations.
- superstructure
The part of a bridge that supports the bridge deck and connects one substructural element to another and thereby transmits the load of the deck and anything on the deck to the substructure.
- water year
A continuous 12-month period selected to present data relative to hydrologic or meteorological phenomena during which a complete annual hydrologic cycle normally occurs. The water year used by the U.S. Geological Survey runs from October 1 through September 30 and is designated by the year in which it ends.
Appendix 1. Shaded Triangulated Irregular Network Images of the Channel and Side of Pier for Each Surveyed Pier
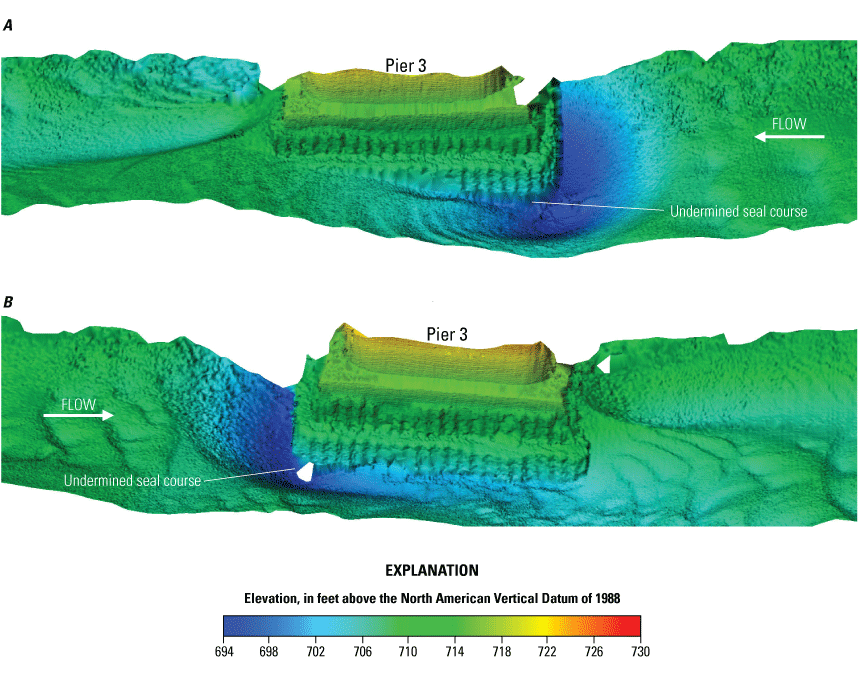
Shaded triangulated irregular network visualization of the channel bed and main channel pier of structure A1800 on Interstate 635 over the Missouri River in Kansas City, Missouri. A, left (northeast) side of pier 3; B, right (southwest) side of pier 3.
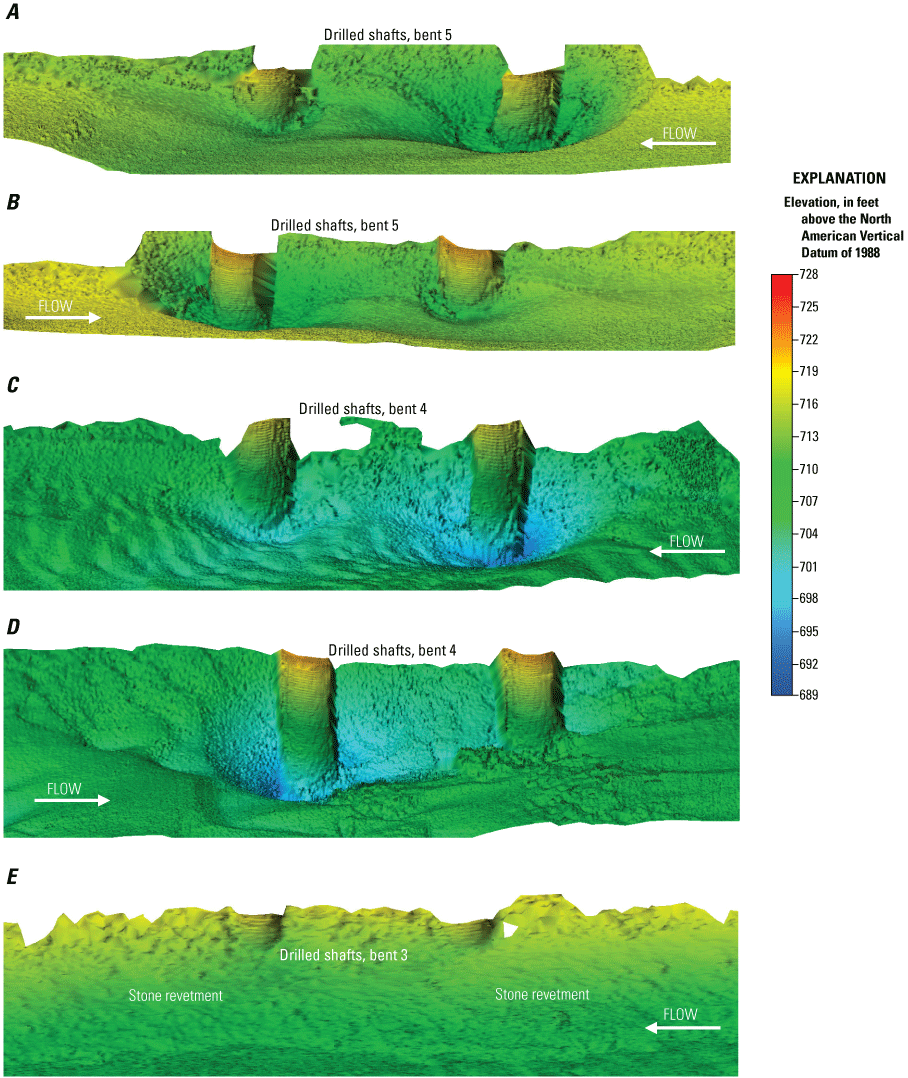
Shaded triangulated irregular network visualization of the channel bed and main channel bents of structure A8340 on U.S. Highway 69 over the Missouri River in Kansas City, Missouri. A, left (north) side of bent 5; B, right (south) side of bent 5; C, left (north) side of bent 4; D, right (south) side of bent 4; E, left (north) side of bent 3.
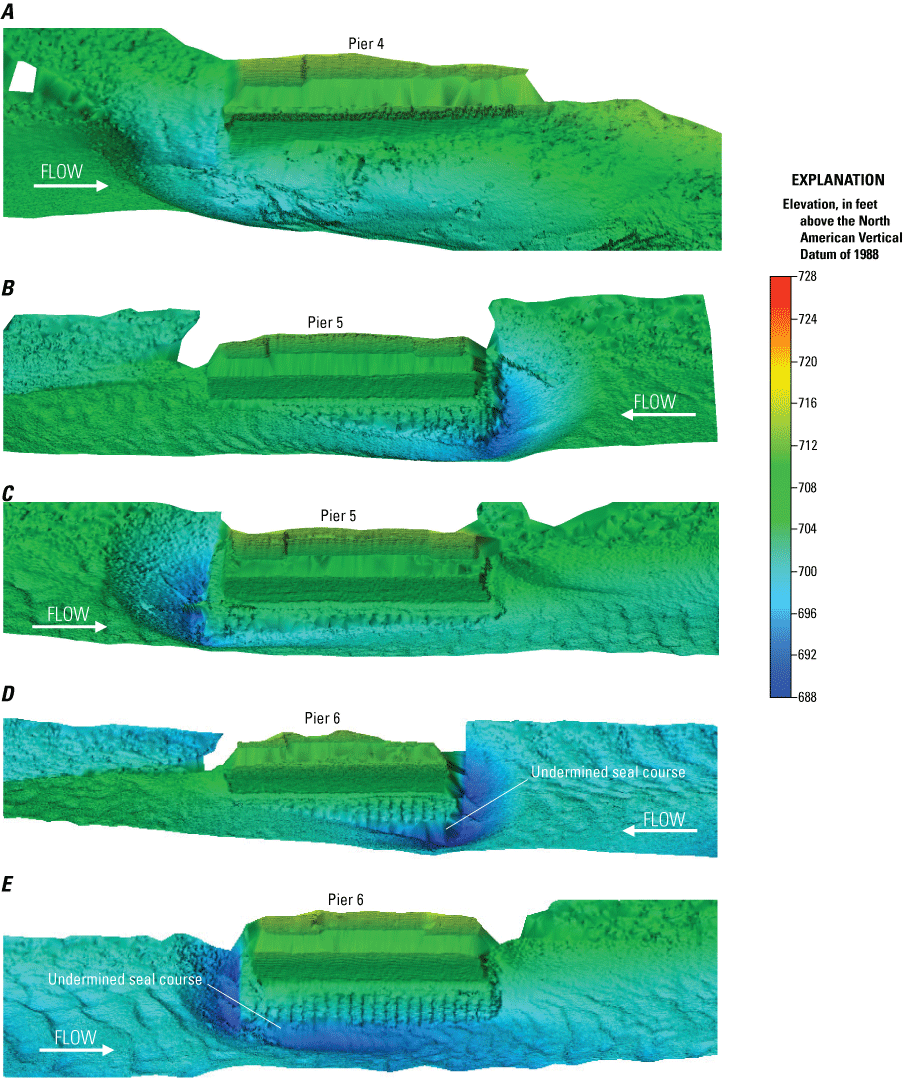
Shaded triangulated irregular network visualization of the channel bed and main channel piers of structure A4060 on State Highway 9 over the Missouri River in Kansas City, Missouri. A, right (south) side of pier 4; B, left (north) side of pier 5; C, right (south) side of pier 5; D, left (north) side of pier 6; E, right (south) side of pier 6.
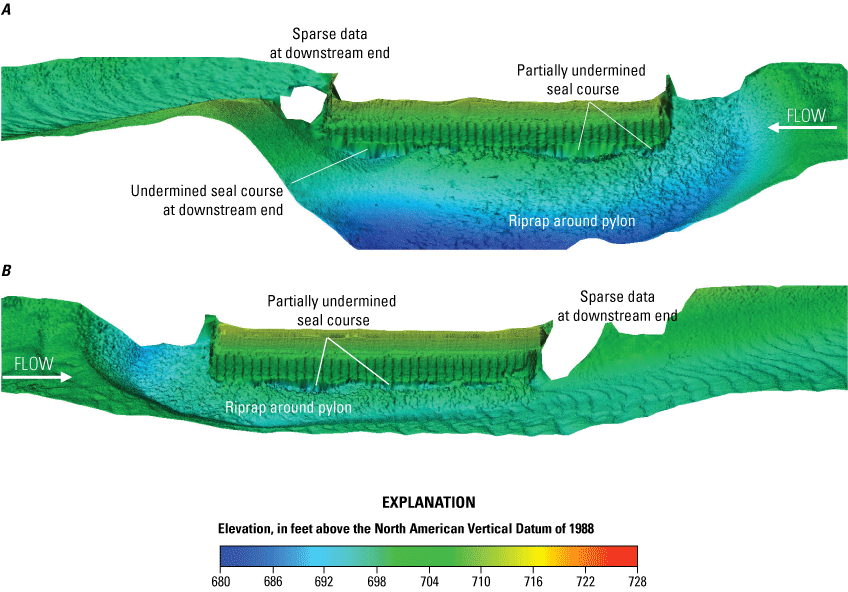
Shaded triangulated irregular network visualization of the channel bed and main channel pylon of structure A7650 on Interstate 35 over the Missouri River in Kansas City, Missouri. A, left (north) side of pylon; B, right (south) side of pylon.
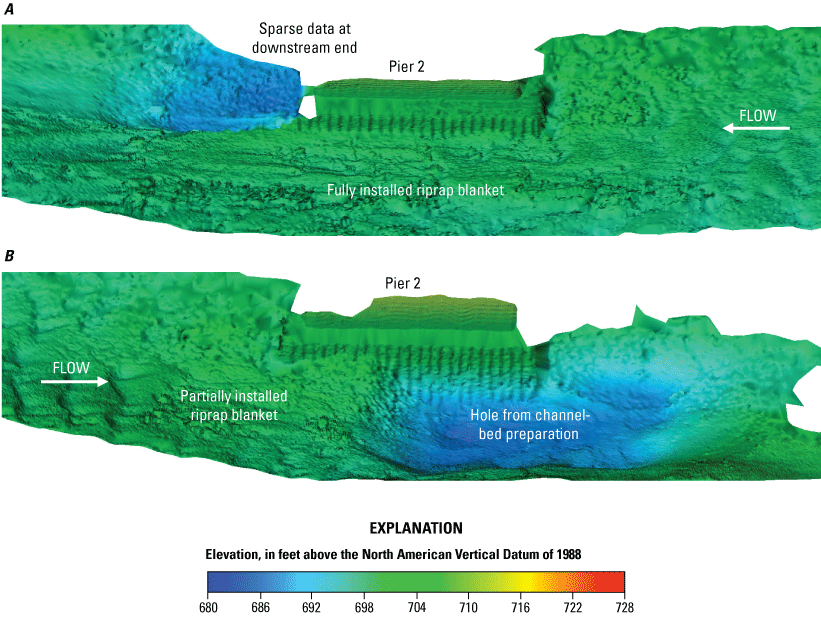
Shaded triangulated irregular network visualization of the channel bed and main channel pier 2 of structure A5817 on State Highway 269 over the Missouri River in Kansas City, Missouri. A, left (north) side of pier 2; B, right (south) side of pier 2.
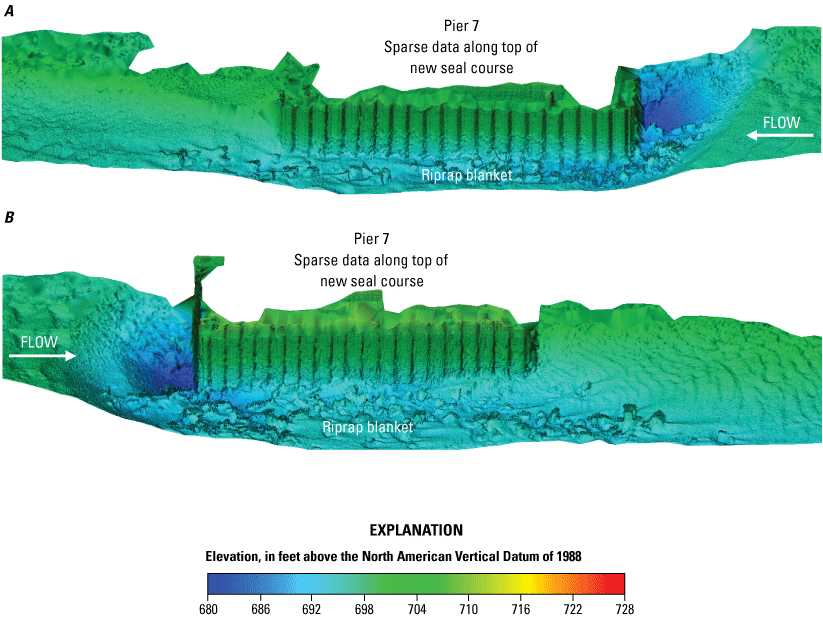
Shaded triangulated irregular network visualization of the channel bed and main channel pier 7 of structure A0767 on Interstate 435 over the Missouri River in Kansas City, Missouri. A, left (north) side of pier 7; B, right (south) side of pier 7.
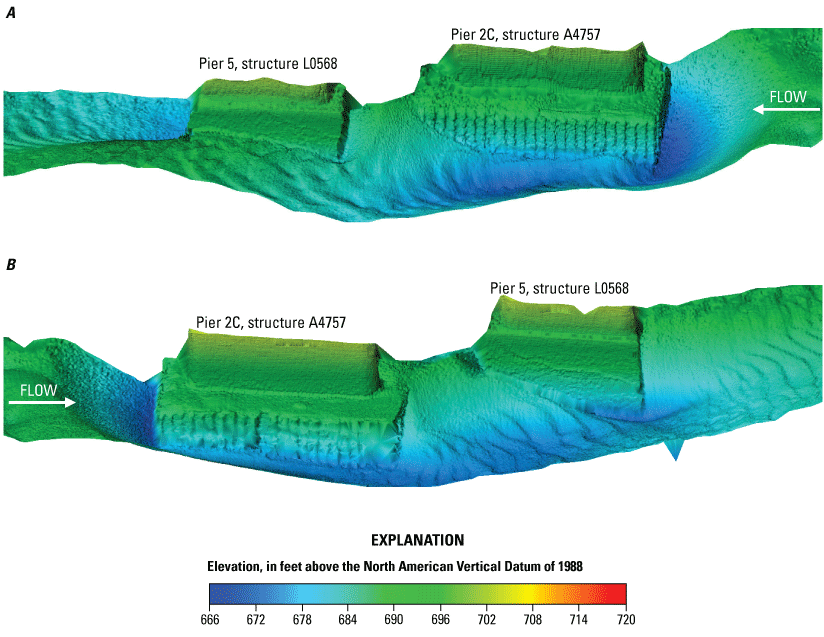
Shaded triangulated irregular network visualization of the channel bed and main channel piers of structures A4757 and L0568 on State Highway 291 over the Missouri River near Kansas City, Missouri. A, left (north) side of piers 2C and 5; B, right (south) side of piers 2C and 5.
Datums
Vertical coordinate information is referenced to the North American Vertical Datum of 1988 (NAVD 88).
Horizontal coordinate information is referenced to the North American Datum of 1983 (NAD 83).
Supplemental Information
In this report, the words “left” and “right” refer to directions that would be reported by an observer facing downstream.
Distance on the Missouri River is given in river miles (RM), with mile 0 being at the confluence of the Missouri River with the Mississippi River at St. Louis, Missouri, at RM 195.2 of the Upper Mississippi River.
Frequency is given in kilohertz (kHz).
Data were collected, processed, and output in the International System of Units then converted to U.S. customary units for presentation in the maps at the request and for the convenience of the cooperator.
Abbreviations
[Some abbreviations are used only once in the report but are used and included here for the convenience of readers who are often more familiar with the abbreviation than the definition.]
ADCP
acoustic Doppler current profiler
CUBE
Combined Uncertainty and Bathymetry Estimator
DEM
digital elevation model
DoD
digital elevation model of difference
GCD
Geomorphic Change Detection
GNSS
Global Navigation Satellite System
IHO
International Hydrographic Organization
IMU
inertial measurement unit
INS
inertial navigation system
MBES
multibeam echosounder
MBMS
multibeam mapping system
MMS
Mobile Mapping Suite
MoDOT
Missouri Department of Transportation
POS MV
Position Orientation Solution for Marine Vessels
RM
river mile
RTK
real time kinematic
SBET
smoothed best estimate of trajectory
TIN
triangulated irregular network
USGS
U.S. Geological Survey
For more information about this publication, contact:
Director, USGS Central Midwest Water Science Center
1400 Independence Road
Rolla, MO 65401
573–308–3667
For additional information, visit: https://www.usgs.gov/centers/cm-water
Publishing support provided by the
USGS Science Publishing Network,
Rolla and Baltimore Publishing Service Centers
Disclaimers
Any use of trade, firm, or product names is for descriptive purposes only and does not imply endorsement by the U.S. Government.
Although this information product, for the most part, is in the public domain, it also may contain copyrighted materials as noted in the text. Permission to reproduce copyrighted items must be secured from the copyright owner.
Suggested Citation
Huizinga, R.J., and Rivers, B.C., 2026, Bathymetric and velocimetric surveys at highway bridges crossing the Missouri River near Kansas City, Missouri, August 8–9, 2023: U.S. Geological Survey Scientific Investigations Report 2026–5124, 105 p., https://doi.org/10.3133/sir20265124.
ISSN: 2328-0328 (online)
Study Area
| Publication type | Report |
|---|---|
| Publication Subtype | USGS Numbered Series |
| Title | Bathymetric and velocimetric surveys at highway bridges crossing the Missouri River near Kansas City, Missouri, August 8–9, 2023 |
| Series title | Scientific Investigations Report |
| Series number | 2026-5124 |
| DOI | 10.3133/sir20265124 |
| Publication Date | February 13, 2026 |
| Year Published | 2026 |
| Language | English |
| Publisher | U.S. Geological Survey |
| Publisher location | Reston, VA |
| Contributing office(s) | Central Midwest Water Science Center |
| Description | Report: xi, 105 p.; Data Release; Dataset; 44 Oversize Map Figures: 17 x 11 inches |
| Country | United States |
| State | Kansas, Missouri |
| City | Kansas City |
| Other Geospatial | Missouri River |
| Online Only (Y/N) | Y |
| Additional Online Files (Y/N) | Y |