

Occurrence of Cyanobacteria and Associated Cyanotoxins in the Raritan Basin Water Supply Complex, New Jersey, August 2020 to August 2021
Links
- Document: Report (6.47 MB pdf) , HTML , XML
- Data Release: USGS Data Release - Cyanobacteria, other water-quality, and discharge data collected from the Raritan River Basin, New Jersey, August 2020 through August 2021
- NGMDB Index Page: National Geologic Map Database Index Page (html)
- Download citation as: RIS | Dublin Core
Acknowledgments
The authors would like to express their sincere gratitude to the following individuals and organizations for their invaluable contributions to the project design, conceptualization, and collaborative research discussions: Heather Desko (New Jersey Water Supply Authority [NJWSA], Meiyin Wu (New Jersey Center for Water Science and Technology [NJCWST]), Robert Newby (New Jersey Department of Environmental Protection [NJDEP]), Bob Schuster (NJDEP), and Eric Ernst (NJDEP). This study benefited from analytical services and consistent, timely provision of data from the NJCWST at Montclair State University, the NJDEP, and the State University of New York College of Environmental Science and Forestry (SUNY ESF). The authors also thank study partners Molly Hillenbrand (NJCWST), Anne Hurley (NJCWST), David Hsu (NJCWST), Alessandra Rossi (NJCWST), Melissa Mazzaro (NJWSA), and Kenneth Klipstein (NJWSA) for their support with data collection, analysis, and guidance. Additionally, Jared Berger (NJWSA) is credited for creating the map in this report. The authors thank Jennifer Graham, Joshua Rosen, and Sabina Gifford of the U.S. Geological Survey (USGS) for their expertise in phycology, lentic systems, and cyanotoxin analysis, and Erin Stelzer of the USGS for sample analysis and review. Special thanks are extended to USGS scientists Lawrence Feinson, Lisa Carper, Jonathan Cohl, Erika Bernal, and Zachary Bunnell for their diligent data-collection efforts. The authors also acknowledge Anna Boetsma of the USGS for project support and Kaitlin Bowen, Jacob Gray, and Lucas Sirotniak of the USGS for their assistance assembling solid phase adsorption toxin tracking (SPATT) passive samplers for this study.
Abstract
Harmful algal blooms, particularly cyanobacteria harmful algal blooms (cyanoHABs), have emerged as a substantial global concern because of their detrimental effects on water quality and aquatic ecosystem health. CyanoHABs can produce cyanotoxins, which pose serious health risks to humans and wildlife, such as liver failure and respiratory distress. This is particularly concerning for water bodies that serve as drinking-water sources. Recent trends indicate an increase in the frequency and intensity of cyanoHABs globally. This study focuses on the Raritan Basin Water Supply Complex in New Jersey, where extensive monitoring was conducted from August 2020 to August 2021 to assess the presence of cyanobacteria and associated cyanotoxins. The research utilized a combination of discrete water-quality sampling, continuous monitoring, and solid phase adsorption toxin tracking (SPATT) to capture the dynamics of cyanotoxin occurrence and potential transport. Findings revealed a widespread presence of cyanobacteria and potential for cyanotoxin production, although actual cyanotoxin concentrations remained below drinking water and recreational thresholds. The study, conducted by the U.S. Geological Survey (USGS) in collaboration with the New Jersey Water Supply Authority (NJWSA) and the New Jersey Department of Environmental Protection (NJDEP), highlighted the limitations of traditional sampling methods and emphasized that continuous monitoring can support better understanding of how cyanoHAB conditions change over time and in different places. Genetic testing included quantitative polymerase chain reaction (qPCR) analyses, which demonstrated higher sensitivity, or increased findings of cyanobacteria compared to microscopy, indicating the potential for use in early warning systems. This research underscores that integrating various detection methods and hydrological data can enhance understanding of cyanotoxin dynamics in river systems.
Introduction
Harmful algal blooms (HABs), or the excessive growth of certain taxa of protists, cyanobacteria, or algae in water, are of growing international concern (Chorus and Welker, 2021). In freshwater, cyanobacteria harmful algal blooms (cyanoHABs) can propagate under favorable conditions and produce secondary metabolites, such as cyanotoxins, which can have adverse effects on water quality and the health of aquatic ecosystems (Brooks and others, 2016). Cyanotoxins can cause acute toxicity in mammals. Exposure to cyanotoxins through ingestion, inhalation of aerosolized water droplets, or dermal contact has the potential to produce a wide range of symptoms in humans, including liver failure, gastrointestinal distress, or, in rare cases, death (Paerl and Otten, 2013; Chorus and Welker, 2021; Patiño and others, 2023). Of the most common classes of cyanotoxins (including anatoxins, microcystins, cylindrospermopsin and saxitoxins), microcystins are the most frequently detected and researched (Chorus and Welker, 2021). Increases in the frequency, duration, and magnitude of cyanoHABs have been observed globally in recent decades. Future climate projections, including the potential warming of surface waters and changes in precipitation, indicate increasingly favorable conditions for the growth of cyanobacteria (Paerl and Huisman, 2008; O’Neil and others, 2012; Brooks and others, 2016).
Many lakes and reservoirs that are used for drinking water are located within watersheds that have documented occurrences of cyanoHABs (Miller and others, 2017; Reinl and others, 2021), including the northeastern United States (Gifford and others, 2024; Hsu and others, 2024). Although past studies of cyanoHAB development in lakes are extensive, less is known regarding cyanoHAB formation and persistence in flowing-water systems. As opposed to lakes, in rivers, there is not always a direct correlation between nutrient availability and cyanobacteria amounts (Jarvie and others, 2025). The transport of cyanobacteria and associated cyanotoxins from lakes and reservoirs during cyanoHABs has been previously documented and modeled (Graham and others, 2012; Otten and others, 2015; Schmadel and others, 2024), but the mechanisms that control cyanobacteria occurrence and growth in rivers are not well understood (Bukaveckas and others, 2018; Graham and others, 2020; Zuellig and others, 2021).
CyanoHAB monitoring often relies on analysis of discrete samples, which provide a snapshot of the phytoplankton assemblage and cyanotoxin concentrations at a specific location and time (Chorus and Welker, 2021). Aquatic ecosystems are rarely uniform in composition, and the concentration of cyanotoxins and cyanobacteria cell densities is likely to be affected by many environmental factors, including water temperature, residence time, wind speed and direction, wave action, nutrient supply, and species competition (O’Neil and others, 2012; Paerl and Otten, 2013). Because of rapidly changing environmental conditions and the high spatial and temporal variability of cyanoHABs, discrete sampling methods may be insufficient to accurately capture the dynamic nature of the blooms.
Recent advances in genetic methodologies have increased the ability to detect cyanobacteria at low concentrations and the potential for cyanotoxin production through the measurement of specific genes, such as cyanobacteria 16S ribosomal ribonucleic acid (rRNA) and cyanotoxin synthetase genes (Al-Tebrineh and others, 2012; Stelzer and others, 2013; Graham and others, 2020; Hsu and others, 2024). Deoxyribonucleic acid (DNA)-based quantitative polymerase chain reaction (qPCR) assays quantify the presence of specific genes, which indicates the potential for cyanotoxin production; however, it is important to note that the presence of the cyanotoxin synthetase genes does not guarantee cyanotoxin occurrence. The cyanobacteria must first transcribe the DNA-encoded cyanotoxin gene into messenger RNA (mRNA) and then translate the mRNA into proteins to initiate the building of the cyanotoxin (Stelzer and others, 2013). Large datasets that enable comparison among cyanobacteria assemblage, cyanotoxin concentration, and cyanobacteria genetic composition are rare, especially in riverine systems (Graham and others, 2020), and are valuable for improving understanding of the relation between cyanobacteria abundance, cyanotoxin concentrations, and the results of genetic analyses.
Solid phase adsorption toxin tracking (SPATT) is an additional alternative method of measuring cyanotoxins through passive sampler deployment that can integrate cyanotoxin concentrations over time. The SPATT samplers are used to measure the adsorption of dissolved cyanotoxins on a known amount of resin beads, with increased cyanotoxin concentrations correlated to the total time of resin exposure within the water environment (Kudela, 2011). When the samplers are retrieved after deployment, cyanotoxins are extracted from the resin, and the extract is analyzed with standard analytical methods, such as liquid chromatography-tandem mass spectrometry (LC-MS/MS; Johnston and others, 2025). The SPATT samplers are relatively low-cost, simple to build, and easy to transport, deploy, and retrieve (Negrey and others, 2019; Jaegge and others, 202622). They can be deployed in areas with limited access where collecting discrete samples is challenging or in conditions not conducive to discrete sampling, such as high-flow conditions. Passive samplers have been shown to be a reliable, sensitive, and effective time-integrated sampling approach for marine, brackish, and freshwater contexts (Kudela, 2011; Jaegge and others, 2026). Combining passive samplers and discrete data across a riverine system can provide a more comprehensive understanding of cyanoHABs over space and time.
The U.S. Environmental Protection Agency (EPA) issued drinking-water health-advisory values and recommendations for recreational water-quality criteria for microcystins and cylindrospermopsin (U.S. Environmental Protection Agency, 2019; table 1). National guidelines for anatoxins or saxitoxins do not currently exist, and many States have developed State-specific guidelines in response to the rise in occurrence of cyanoHABs using several different metrics and thresholds to define potential harm to recreational or water-supply users (Stackpoole and others, 2024). The New Jersey Department of Environmental Protection (NJDEP) has developed recreational State guidance levels for microcystin, anatoxins, and cylindrospermopsin, and has proposed health advisory guidance levels for these three cyanotoxins and saxitoxin in treated drinking water (New Jersey Department of Environmental Protection, 2022, 2024; table 1). For recreational contexts, NJDEP has developed four-tiered harmful algal bloom (HAB) Alert Levels: “Watch,” “Advisory,” “Warning,” and “Danger,” based on cyanobacteria cell concentrations and cyanotoxin concentrations (New Jersey Department of Environmental Protection, 2022; table 2). In New Jersey, the potential and number of documented cyanoHABs has increased in recent years (Hsu and others, 2024); therefore, an improved understanding of sources and transport of cyanoHABs within the State can help water-resource managers design efficient monitoring programs and allocate resources to protect human health.
Table 1.
Cyanotoxin advisory thresholds for the New Jersey Department of Environmental Protection (NJDEP) and the U.S. Environmental Protection Agency (EPA) in both finished drinking water and recreational contexts.[Data are from the U.S. Environmental Protection Agency (2015a, 2019)59 and the New Jersey Department of Environmental Protection (2022, 2024)32. NJDEP, New Jersey Department of Environmental Protection; µg/L, micrograms per liter; EPA, U.S. Environmental Protection Agency; —, not applicable]
These guidance levels are draft until the point that more feasible testing is available (New Jersey Department of Environmental Protection, 2022).
Table 2.
New Jersey Department of Environmental Protection harmful algal bloom (HAB) alert levels applied to recreational contexts.[Data are from the New Jersey Department of Environmental Protection (2022). HAB, harmful algal bloom; cells/mL, cells per milliliter; µg/L, micrograms per liter; >, greater than; <, less than]
From August 2020 to August 2021, the U.S. Geological Survey (USGS), in cooperation with the New Jersey Water Supply Authority (NJWSA), the NJDEP, and Montclair State University conducted a study to characterize the extent, duration, and potential transport of cyanobacteria and associated cyanotoxins within the Raritan Basin Water Supply Complex to better understand cyanotoxin and cyanobacteria occurrence in this system. The complex consists of Budd Lake, Spruce Run and Round Valley Reservoirs, and the main stem of the Raritan and Millstone Rivers (fig. 1). Collectively, the Raritan Basin Water Supply Complex provides drinking water to more than 1.5 million people in New Jersey (Hsu and others, 2024). The study included extensive discrete-sample collection, use of continuous water-quality sensors, and deployment of SPATT samplers throughout the year.
Previous analysis of phytoplankton data found several cyanobacteria genera, including 24 known cyanotoxin producers that were present in several sites throughout the supply complex and a net decrease in phytoplankton abundance from upstream to downstream sampling sites. It was also shown that persistence mechanisms differed between the Millstone and Raritan River subwatersheds (Clonan, 2026). Using multivariate methods, the authors showed that the lake and river sampling sites had substantially different cyanobacteria assemblages—all mainstem sites were similar, but Spruce Run Outlet and Budd Lake Outlet were each distinct. Using flow data collected at USGS streamgages, Clonan and others (2026) determined cyanobacteria persistence in the Raritan River overlapped with discharge from Spruce Run Reservoir; however, the study did not address cyanotoxin occurrence in the system, the use of genetic methods and passive samplers, or additional phytoplankton and chlorophyll a data collected from within Spruce Run Reservoir.
Purpose and Scope
This report aims to evaluate the presence of cyanobacteria and characterize the detection of cyanotoxins and cyanobacteria genes in samples collected from August 2020 to August 2021 at sites within the Raritan Basin Water Supply Complex. The sampling locations in this study were selected to compare conditions among upstream lake sites, tributary sites, and downstream Raritan River mainstem sites, and from a buoy within the Spruce Run Reservoir. The specific objectives of this report were to: (1) characterize findings from discrete water-quality samples, SPATTs, and continuous sensor measurements, and (2) relate those results to cyanobacteria, cyanobacteria genes, cyanotoxins, chlorophyll a, and water-quality data in the context of relevant New Jersey cyanoHAB advisory thresholds. These objectives were achieved by comparing data from upstream lake or reservoir and downstream river sites in the Raritan River. This information will improve our understanding of the occurrence of microcystin (and other cyanotoxins) in river systems. All data discussed in this report are available in a USGS data release (Treviño and others, 2025) and the National Water Information System database (NWIS; U.S. Geological Survey, 2024).
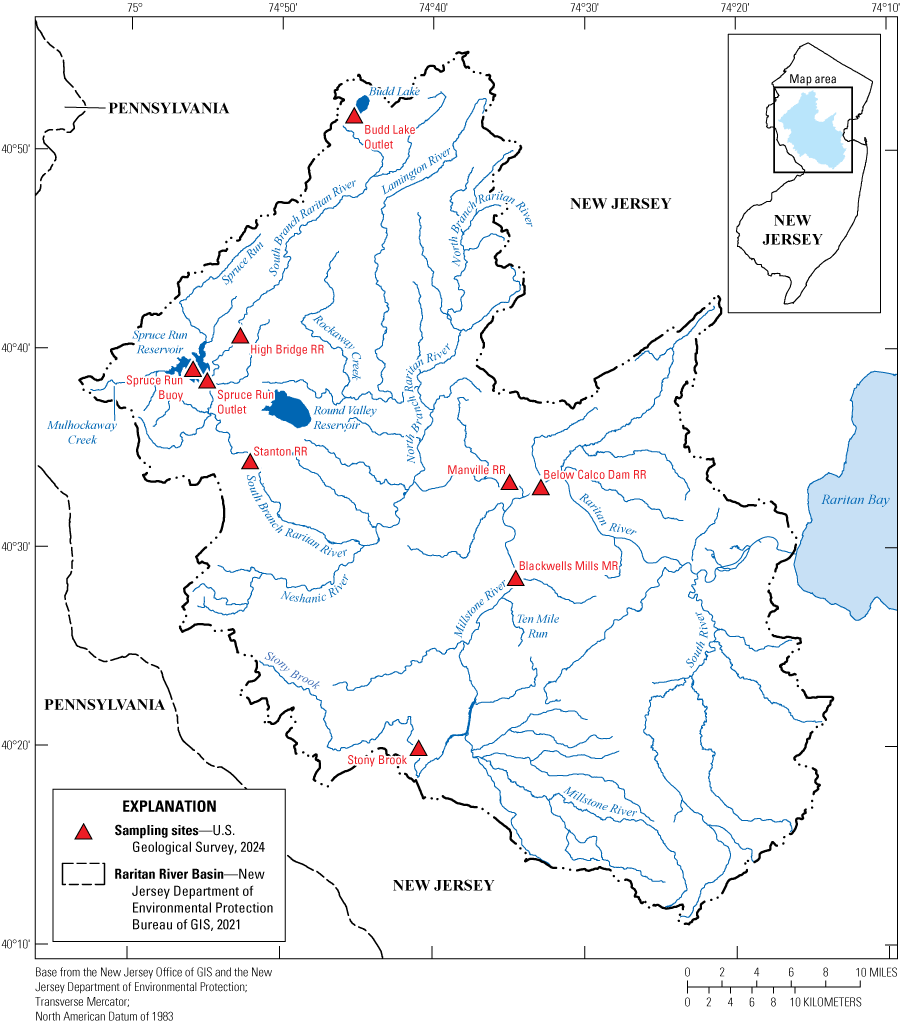
Map of the Raritan Basin Water Supply Complex and sites that were sampled from August 2020 to August 2021. [RR, Raritan River; MR, Millstone River]
Study Area
The Raritan River Basin comprises an area of 1,105 square miles (mi2) in New Jersey (fig. 1). It is the largest river drainage basin entirely within New Jersey and is affected by municipal and industrial point-source discharges (New Jersey Water Supply Authority, 2005). The basin drains all (or parts of) around 100 municipalities in seven counties. The confluence of the mainstem of the Raritan River with the Millstone River (fig. 1) is the location of two drinking-water intakes (New Jersey Water Supply Authority, 2005). Numerous low-flow dams modify river flow, and two wastewater-treatment plants discharge 8.5 mi upstream of the Blackwells Mills MR site and 2 mi upstream of the Below Calco Dam RR site, respectively, which can affect water quality (Clonan, 2026).
The Raritan River Water Supply Complex was selected for this study because it is a source of drinking-water supply and the recurrent cyanoHABs in upstream lakes and reservoirs (New Jersey Water Supply Authority, 2005; Hsu and others, 2024; Clonan, 2026). There are several lake-like portions within the basin, including Budd Lake and Spruce Run Reservoir (fig. 1). Budd Lake1 is a natural lake used for recreation that serves as the headwaters of the South Branch Raritan River. Spruce Run Reservoir2 is a water-supply reservoir fed by Mulhockaway Creek and Spruce Run; it releases water to the South Branch Raritan River further downstream (fig. 1). These waterbodies, as well as others in the watershed, are involved in regulating water flow and supply (Reiser, 2004; New Jersey Water Supply Authority, 2005). From 2018 to 2022, Budd Lake and Spruce Run Reservoir experienced annual cyanoHAB events that led to concerns about the potential transport of cyanotoxins to downstream drinking-water intakes (Hsu and others, 2024). Although cyanoHABs have been documented in lake systems within the basin, limited data have been collected regarding their downstream impacts, including cyanotoxin occurrence.
The surface area of Budd Lake equals (=) 376 acres (New Jersey Department of Environmental Protection, 2025).
The surface area of Spruce Run Reservoir=1,350 acres and has 11 billion gallons of storage capacity (New Jersey Water Supply Authority, 2005).
Methods
This study used a combination of discrete water-quality and SPATT sampler data that were collected on 20 dates from 8 riverine and lake outlet locations in the Raritan River Water Supply Complex (table 3). Additionally, 24 discrete water-quality samples were collected at the Spruce Run Buoy site within Spruce Run Reservoir (fig. 1) to record continuous water-quality data (collected in 15-minute intervals).
Table 3.
Raritan Basin Water Supply Complex sampling locations, site type, latitude, longitude, and type of data collected at each location from August 2020 to August 2021.[Data are from Treviño and others (2025). USGS, U.S. Geological Survey; RR, Raritan River; Rd, road; NJ, New Jersey; G, cyanobacteria genes; S, solid phase adsorption toxin tracking sampler deployment; WQ, water-quality samples; Q, streamflow; ft, feet; NW, northwest; WQM, continuous water-quality monitor; MR, Millstone River]
Discrete Sample Collection
At all riverine and lake outlet sites, discrete water-quality samples were collected about every 2 weeks using a fixed-schedule sampling approach from August 2020 to August 2021 (table 3), except for December 2020 to April 2021, when samples were collected once per month (total number [n]=20 sample events). Each sampling event for the eight sites occurred over two days, with upstream sites (Budd Lake Outlet, High Bridge RR, Spruce Run Outlet, Stony Brook, and Stanton RR) sampled on the first day and downstream sites (Blackwells Mills MR, Manville RR, and Below Calco Dam RR) sampled on the second day.
Three discrete samples were collected in 1-liter (L) polyethylene bottles at the right bank, left bank, and at the center of channel. Samples were collected at approximately 0.5 meters (m) below the water surface by wading and submersing the sample bottle in moderate-to-low-flow conditions or by suspending a Van Dorn sampler from an overhead bridge at applicable sites in high-flow conditions. The filled bottles were then combined into a 4-L polyethylene carboy, mixed by inversion, divided into separate sample bottles, and preserved as required for shipment to laboratories for analysis (Wilde, 2008; Treviño and others, 2025; U.S. Geological Survey, variously dated; Clonan and others, 2026). Samples were analyzed for nutrients, turbidity, chlorophyll a, phytoplankton identification and enumeration, cyanobacteria genes, and cyanotoxins.
At Spruce Run Buoy, samples were collected approximately twice per month from August 2020 to August 2021, except for December 2020 to February 2021, when samples were collected once per month. Samples were analyzed for phytoplankton identification and enumeration and chlorophyll a concentrations. Samples were collected immediately adjacent to the buoy with a Van Dorn sampler at a depth of three feet. During discrete-sample collection, a multiparameter sonde was used to measure water temperature, pH, dissolved oxygen, and specific conductance at each site. The median result of readings from the left bank, center of channel, and right bank was recorded (Treviño and others, 2025). The sample was transferred to a 14-L churn, divided into separate sample bottles, and preserved as required for shipment to laboratories for analysis as described by Wilde (2008), Treviño and others (2025), and U.S. Geological Survey (variously dated).
Nutrients and chlorophyll a
Samples collected for nutrients were analyzed for orthophosphate, nitrate plus nitrite, total nitrogen (TN), total phosphorus (TP), and ammonia. All samples were analyzed within 2 weeks of collection by the Bureau of Marine Water Monitoring Laboratory (Leeds Point, New Jersey) according to the following methods: EPA Method 350.1 for nitrogen and ammonia (O’Dell, 1993), EPA Method 353.4 for nitrate plus nitrite (Zhang and others, 1997), EPA Method 365.5 for orthophosphate (Zimmermann and others, 1997), and USGS method I-4650-03 for TN and TP (Patton and Kryskalla, 2003). Method reporting limits (MRL) were 0.100 milligrams per liter (mg/L) for TN as nitrogen; 0.010 mg/L for ammonia as nitrogen, nitrate plus nitrite as nitrogen, and TP as phosphorus; and 0.005 mg/L for orthophosphate as phosphorus.
Turbidity and chlorophyll a samples were stored on ice and transported to the New Jersey Center for Water Science and Technology (NJCWST) at Montclair State University (Montclair, New Jersey). Turbidity was measured within 48 hours from sample collection using a turbidity meter following the manufacturer’s specifications (Oakton Instruments and Eutech Instruments Pte Ltd., 2006). The median turbidity was computed from three consecutive readings from each sample. Chlorophyll a samples were transported in amber bottles, then filtered at the laboratory on the day of sample collection. After filtration, the filters were stored in a freezer at –20 degrees Celsius (°C) and analyzed within three weeks. Chlorophyll a was analyzed fluorometrically using a modification (nonacidification) of EPA Method 445.0 (Arar and Collins, 1997). Data are available in Treviño and others (2025). For Spruce Run Buoy samples, filters were sent frozen to the USGS National Water Quality Laboratory (Lakewood, Colorado) for chlorophyll a analysis by EPA Method 445.0 (Arar and Collins, 1997); those data are available in U.S. Geological Survey (2024). During discrete-sample collection, a multiparameter sonde was used to measure water temperature, pH, dissolved oxygen, and specific conductance at each site. The median result of readings from the left bank, center of channel, and right bank was recorded (Treviño and others, 2025).
Phytoplankton Identification and Enumeration
Phytoplankton samples were collected in 250-milliliter (mL) amber bottles and preserved with glutaraldehyde to a concentration of 0.25 percent by volume. For sites other than Spruce Run Buoy, samples were analyzed at the NJCWST, where phytoplankton were identified to the genus level whenever possible. If the genus of the phytoplankton could not be determined, the cells were identified to the lowest taxonomic level possible (Wehr and others, 2014; Bellinger and Sigee, 2015) and are summarized here as cellular abundance (cells per milliliter [mL]) within four taxonomic groups of:
-
Cyanophyta (cyanobacteria);
-
Bacillariophyta (diatoms);
-
Chlorophyta, (green algae); and
-
Other (all other taxa not belonging to the previous three groups).
For a full description of the NJCWST cell-counting method, refer to the supplemental material in Clonan (2026).
Samples at Spruce Run Buoy were collected as part of a separate effort; therefore, identification and enumeration were done at a different laboratory than the above (PhycoTech, Inc., Saint Joseph, Minnesota); microscopy was conducted using N-(2-Hydroxypropyl) methacrylamide-mounted slides and fluorescence-enabled microscopes. Phytoplankton were enumerated to the lowest possible taxonomic level, which was at least the genus level for most organisms. To correctly identify and enumerate the taxa present, which may vary by several orders of magnitude in size (0.9 micrometers [µm] to 25 millimeters [mm]), counts were made at multiple magnifications ranging from 200 to 1,000 times (PhycoTech, 2018). Random microscope fields were counted to a minimum of 400 natural units (colonies, filaments, or single cells) of all observed organisms (PhycoTech, 2018). The average cell dimensions were recorded for biovolume calculations, and data are reported here as biovolume (cubic micrometers per milliliter [mm3/mL]) within the same taxonomic groups as the NJCWST data (Cyanophyta, Bacillariophyta, Chlorophyta, and Other). Evaluations of the cyanobacteria assemblage were conducted at the genus level where possible. Sample processing, analysis methods, and quality assurance protocols are detailed in PhycoTech (2018).
It is well known that phytoplankton lab methodologies can differ substantially among labs (Graham and others, 2008; Chorus and Welker, 2021), and it is beyond the scope of this report to harmonize the data from the two labs. For comparison of cell counts to the NJDEP HAB Alert thresholds (table 2), abundance (cells/mL) was utilized for the NJCWST data; however, abundance from PhycoTech Inc. tended to be elevated in comparison to the NJCWST abundance as the higher magnification and alternate methods allowed for more detailed enumeration of taxa, so biovolume (mm3/mL) is reported here instead. All phytoplankton data are available in Treviño and others (2025).
Cyanobacteria Genes
Samples for genetic analysis were collected at all sites and dates in sterilized 1-L high-density polyethylene bottles and shipped to the USGS Ohio Water Microbiology Laboratory (Columbus, Ohio) for analysis. Out of all samples collected (n=160), a subset of 59 samples from five sites (Budd Lake Outlet, High Bridge RR, Spruce Run Outlet, Stanton RR, and Manville RR) from a subset of sample dates (approximately once per month) were selected for genetic analysis. These sites were selected to focus on potential bloom conditions and transport to the Raritan River mainstem from the upstream lake sites instead of the tributary sites in the Millstone River (fig. 1).
Quantitative polymerase chain reaction (qPCR) was used to analyze samples for 16S cyanobacteria rRNA and four cyanotoxin synthetase genes, following the methods of Stelzer and others (2013). The 16S cyanobacteria rRNA assay targeted all taxa in the phylum Cyanobacteria. The cyanotoxin synthetase gene analyses amplified specific targets associated with the occurrence of anatoxins (anaC; Sabart and others, 2015), cylindrospermopsin (cyrA; Al-Tebrineh and others, 2012), microcystin (mcyE; Al-Tebrineh and others, 2012), and saxitoxin (sxtA; Al-Tebrineh and others, 2012). TaqMan Universal PCR Master Mix (Life Technologies Corporation, Carlsbad, California) was employed for most assays, except for anaC and mcyE, which utilized SYBR Green qPCR Master Mix (Life Technologies Corporation, Carlsbad, California). Sample inhibition was determined via matrix spikes—a sample was considered inhibited and diluted if the seeded test sample was more than two threshold cycles higher than the seeded clean-matrix control. Plasmids were used for each assay to establish quantitative standard curves. Plasmids were created by synthesizing each target in a cloning vector (small piece of DNA that can carry and copy a gene) (Integrated DNA Technologies, Coralville, Iowa) and then transforming the vector into Escherichia coli (E. coli) cells. Immediately before sample analysis, the E. coli plasmid for each target was grown to the exponential phase and then extracted. The copy number of the extracted plasmid for each target was determined using the DNA concentration measured by the Qubit dsDNA High Sensitivity Assay kit (Life Technologies Corporation, Carlsbad, California) and the plasmid’s molecular weight. The sample data and detailed information on standard-curve parameters and assay-detection limits for this study are available in Treviño and others (2025).
Cyanotoxins
Discrete cyanotoxin samples were analyzed at NJCWST for total and dissolved microcystin concentrations using enzyme-linked immunosorbent assay (ELISA) testing kits (product number 520011) following EPA Method 546 (Zaffiro and others, 2016) and the protocols outlined in the Gold Standard Diagnostics (Warminster, Pennsylvania) instruction manual (Gold Standard Diagnostics, 2025). For dissolved microcystins, samples were directly filtered using 1.2-µm glass-fiber syringe filters without lysing cyanobacteria cells. For total microcystins, samples were sequentially frozen and thawed three times to lyse cyanobacteria cells and release cyanotoxins, then filtered. The method detection limit (MDL) for the ELISA is 0.15 µg/L, and the MRL is 0.30 µg/L. A value between the MDL and MRL suggests that microcystin is present, but a quantifiable value cannot be reported. Data are available in Treviño and others (2025).
Passive Samplers
Solid phase adsorption toxin tracking (SPATT) samplers were deployed and remained at a site for two to four weeks. The samplers were assembled for this study following the methods of Lane and others (2010). Each sampler contained three grams of DIAION HP20 resin (Mitsubishi Chemical Company, Tokyo, Japan), a porous synthetic adsorbent, encased in 100-µm Nitex nylon mesh. The edges of the sachet were sealed using a heat sealer. Before deployment, SPATT samplers were activated in methanol, rinsed in ultra-pure deionized water, and refrigerated. The SPATT samplers were deployed in duplicate at a single depth at each site, placed in a metal cage for protection from debris, attached to a stationary structure, and then retrieved and (or) replaced approximately every two weeks. Upon retrieval, SPATT samplers were sealed in plastic bags and kept cold on wet ice until placed in a freezer for up to one year.
Although more were collected, a subset of SPATT samplers that corresponded with samples selected for genetic analyses were selected for analysis from five sites (Budd Lake Outlet, High Bridge RR, Spruce Run Outlet, Stanton RR, and Manville RR), and a subset of sample dates (about one date per month). Cyanotoxins were extracted from the SPATT sampler resin using a 50-percent solution of LC-MS-grade methanol and organic-free water (Negrey and others, 2019). Extracts were evaporated to dryness and then reconstituted in a two percent LC-MS-grade methanol/organic-free water solution. The extracts were shipped on ice to the College of Environmental Science and Forestry at State University of New York (Syracuse, New York) for analysis of microcystins, cylindrospermopsin, and anatoxin concentrations. Saxitoxins were not evaluated by LC-MS/MS analyses because of inconsistencies in published methods.
The SPATT extracts were analyzed for microcystins by LC-MS/MS using a Thermo Scientific Quantiva Altis triple-quadrupole mass spectrometer according to the methods described in Birbeck and others (2019), Stouder and others (2024), and Johnston and others (2025). Cylindrospermopsin and anatoxins were analyzed by LC-MS/MS using a modified version of EPA Method 545 (U.S. Environmental Protection Agency, 2015b), incorporating additional congeners (molecular variations of cyanotoxins in the same class) and quantification/confirmation ions (Barnard and others, 2021). For this study, all quantified detections were summed for all congeners to calculate total concentrations for microcystins, anatoxins, and cylindrospermopsin.
The MDL for cyanotoxins analyzed by mass spectrometry was determined for each run, considering factors such as sample volume, extract volume, injection volume, and instrument-reporting limits (Boyer, 2020). Microcystin MDLs were reported as microcystin-LR equivalents. For cylindrospermopsin and anatoxins, a nonstandard data-quality check was implemented, involving the use of one quantification ion and two confirmatory ions. Detections were categorized as confirmed, possible, or suspected based on the presence and ratio of parent and confirmation ions (Boyer, 2020). Data are available in Treviño and others (2025).
Continuous Data
Continuous water-quality data were collected in 15-minute intervals at a buoy installed in Spruce Run Reservoir through monitors installed at a fixed depth of 1 meter (approximately 3 feet) by the USGS; sensors were operated per USGS protocols and guidance (Wagner and others, 2006). The buoy was equipped with a multiparameter sonde that collected measurements of water temperature, pH, dissolved oxygen, turbidity, chlorophyll a, and phycocyanin fluorescence every 15 minutes. Continuous water-quality data were processed, analyzed, and approved following published techniques and methods (Wagner and others, 2006; Foster and others, 2022) and are available in NWIS (U.S. Geological Survey, 2024). Continuous-flow data were used to describe streamflow conditions at all sites other than Spruce Run Buoy and Budd Lake Outlet (table 3). Streamflow data were computed using standard USGS methods (Sauer and Turnipseed, 2010; Turnipseed and Sauer, 2010) and are available through NWIS (U.S. Geological Survey, 2024).
Data Analysis
Water-quality conditions in sites in the Raritan Basin Water Supply Complex were described by site and sample date using discretely collected water-quality data, passive samplers, and continuously measured streamflow data. Flow-duration curves, which represent the relation between the magnitude and frequency of streamflow during a period of time, were used to compare streamflow for each site and to evaluate whether the range in flow conditions was captured by discrete sample collection. Duration curves are cumulative-distribution functions and were constructed using 15-minute intervals to evaluate and compare frequency and magnitude characteristics (Rasmussen and others, 2009). The curves indicate the percentage of time that specified conditions were equaled or exceeded, also known as the frequency of exceedance.
A comprehensive list of cyanobacteria genera detected in the samples was compared to several studies to designate potential toxigenicity (Graham and others, 2008; Wehr and others, 2014; Christensen and Khan, 2020; Graham and others, 2020). A linear model was fit to total cyanobacteria abundance and the concentration of gene copies; results were considered significant when probability (p)-values were below 0.05.
For comparison, cyanotoxin results from SPATT extracts were converted from the total extract concentration (µg/L of cyanotoxin) to a concentration over time deployed (nanograms of cyanotoxin per gram of resin per day [ng/g/day]) using the following conversion: extract concentration as µg/L times (×) 1,000 divided by (÷) grams of resin ÷ number of days deployed.
A comparative qualitative evaluation of consistency among four methodological approaches (indicators) was conducted for cyanotoxin detection by discrete samples and SPATT, potential for cyanotoxin production (qPCR genetic approach), and total abundance of cyanobacteria. Measurements from each sample date were compared as “detected” (detections of mcyE or microcystins were present in the sample), “not detected,” or “not analyzed.” The total abundance of a cyanobacteria indicator was “detected” if the sample exceeded the NJDEP HAB Alert Watch threshold of 20,000 cyanobacteria cells/mL (table 2).
Nonparametric Spearman rank-correlation matrix analysis was used to evaluate the strength of the association between biological-response variables and selected environmental variables. Biological-response variables consisted of discrete chlorophyll a, total abundance of cyanobacteria, cyanobacteria rRNA, gene concentration (mcyE and anaC), discrete total microcystins, and microcystins in SPATT samplers. Environmental variables included water-temperature measurements, TN, TP, and turbidity. The sxtA and cyrA gene data were not included in the correlation analysis because of the small number of detections. Spearman rank-correlation coefficients were considered significant when p-values were less than or equal to 0.05.
Quality Assurance and Quality Control
Quality control measures are an important part of laboratory and field best practices. Approximately 20 percent of the discrete samples collected at each site included concurrent field replicates and field blanks for quality assurance and control purposes. Concurrent replicates were analyzed for most constituents. Concurrent replicates were collected over a range of streamflow conditions and at various times throughout the year. Laboratory and field blanks were used to identify potential sources of contamination related to equipment cleaning and sample-collection procedures.
In this study, there were no detections in field blanks for TN, but there were two dates with detections of TP. One was about half of the ambient TP (0.035 mg/L on May 11, 2021), and the other was much higher than the corresponding field value and flagged by the lab as “estimated” (0.596 mg/L on Oct 6, 2020). The latter detection was related to a contamination issue with the deionized water source used at that time and not an analytical error, so the data were retained. The relative percentage difference (RPD) was utilized to assess the variations in concentration between replicate water samples. The RPD was computed by taking the difference in concentration between two replicates for TN, TP, and chlorophyll a, dividing it by the mean concentration of the replicate pair, and then multiplying the result by 100. This calculation yields a value representing the percentage difference in concentration between the replicate samples (Zar, 1999). All RPDs between replicate pairs had median RPD values of less than 10 percent for field replicates; for TP: median RPD=6.9, n=20 replicate pairs; TN median RPD=2.3, n=20 replicate pairs; and chlorophyll a median RPD=7.7, n=19 replicate pairs. For laboratory replicates, chlorophyll a median RPD=3.6, n=20 replicate pairs.
For the phytoplankton samples analyzed by NJCWST, absolute value logarithmic difference (AVLD) was used to evaluate differences in cyanobacteria between replicate pairs (Francy and others, 2015). The AVLD was calculated as:
whereAVLD was used to evaluate differences for total phytoplankton data instead of RPD calculations because it is less sensitive to rare taxa present in one of the replicate samples, but not the other; replicate pairs with an AVLD value of less than 1.0 were considered acceptable for this study. Only 1 sample pair (from Stony Brook on October 20, 2020, AVLD=1.9) was above this threshold. The environmental sample was retained in this study for comparison to other samples in the context of the overall low abundance of phytoplankton at the site, and in this particular sample, an excess of a few rare taxa caused an elevated AVLD. Excluding that pair, the AVLDs for phytoplankton across all other replicate pairs ranged from less than 0.01 to 0.88 (median AVLD: 0.28, n=19 replicate pairs). All data were considered acceptable quality for the purposes of this report. Replicate samples were not collected at Spruce Run Buoy for analysis at PhycoTech Inc.
For the genetic analyses, all laboratory quality-control blanks (filtration blanks, extraction blanks, and qPCR no-template controls) were negative for all targets. All sample extracts, standards, and blanks were analyzed in duplicate. There were no detections in any lab blanks. For discrete samples analyzed for total microcystins by ELISA, quality-control measures (including percent coefficient of variation between two well replicates, coefficient of determination [R2], usage of laboratory reagent blanks, low-calibration verification, usage of laboratory-fortified blanks, laboratory-fortified sample matrices and duplicate, and quality-control samples) were utilized in accordance with EPA Method 546 to ensure the accuracy and precision of analyses and standard curves (Zaffiro and others, 2016).
As with many environmental studies, field replicates and blanks can be used to ensure data validity and help with SPATT sampler-data interpretation (Jaegge and others, 2026; U.S. Geological Survey, variously dated). Two blank SPATT samplers were activated, stored, extracted, and analyzed in the same manner as the deployed SPATT samplers, and analysis by LC-MS/MS did not detect any cyanotoxins in the extracts. For field replicates, coefficients of variation are an appropriate indication of the range in values in SPATTs (Johnston and others, 2025). The coefficients of variation for microcystin concentrations ranged from 0.4 to 86.9 ng/g/day, with the median=38.3 ng/g/day for 6 replicate pairs. Given the lack of standardized methods for evaluating SPATTs (Jaegge and others, 2026; U.S. Geological Survey, variously dated), all samples were retained for analysis regardless of observed variation in results. SPATT results presented in this report should be considered a semiquantitative indicator of cyanotoxin presence.
Environmental Variable Results
A total of 184 discrete water-quality samples were collected among eight sites, including quality-control samples such as replicates and blanks. Discrete water-quality data were collected over a variety of streamflow conditions at all of the sites, except for the highest 10 percent of flow conditions, as personnel safety would have been a concern (fig. 2). The mean streamflow over the study period was lowest at Spruce Run Outlet but streamflow values were consistently lowest at Stony Brook (table 4; fig. 2) and was not measured at Budd Lake Outlet, which is characterized as an impoundment and generally has low flow or nonflowing conditions.
Over the course of this study, the sites had a substantial range when compared to one another for several water-quality characteristics (table 4). Nutrients (TN and TP) were highest at the furthest downstream mainstem Raritan River and Millstone River sites (Below Calco Dam RR and Blackwells Mills MR, respectively). Spruce Run Outlet also had elevated TP, but not TN. Median chlorophyll a was about 2–8 times higher at lake outlet sites than the riverine locations and was about 2 times higher at Budd Lake Outlet than Spruce Run Outlet. When compared to other sites, turbidity was consistently highest at Budd Lake Outlet. Turbidity was highest at the lake outlet sites in the summer months—concurrent with the periods of highest phytoplankton detections. The two largest riverine sites (Manville RR and Below Calco Dam RR) had relatively elevated median turbidity values compared to the upstream riverine sites, but this was largely driven by a high-flow event around February 16, 2021.
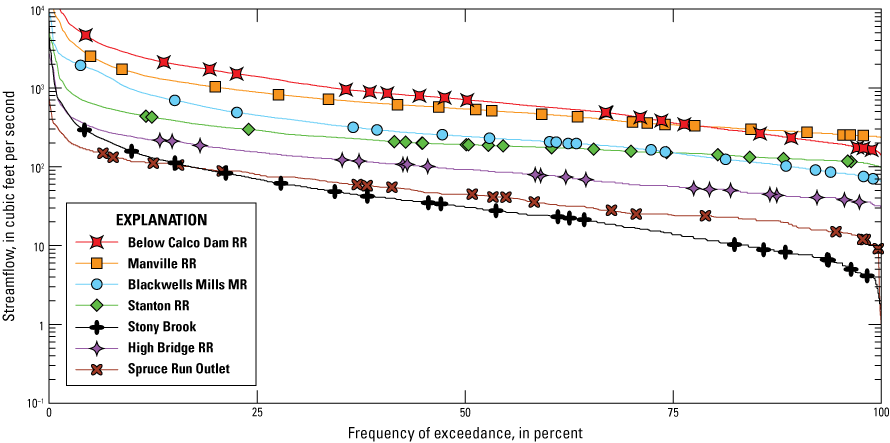
Duration curves for streamflow at study sites in the Raritan River Basin from August 2020 to August 2021. The points show at which streamflow discrete water-quality sample collection occurred. [Data from U.S. Geological Survey, 2024 and Treviño and others, 2025]
Table 4.
Drainage area, mean streamflow at gages, and median and range of water-quality conditions in the Raritan Basin Water Supply Complex study sites sampled from August 11, 2020, to August 5, 2021. Refer to table 3 for U.S. Geological Survey station names and site identification numbers.[Values in parentheses indicate range (minimum–maximum). Data are from Treviño and others (2025) and U.S. Geological Survey (2024). mi2, square miles, ft3/s, cubic feet per second; °C, degrees Celsius; mg/L, milligrams per liter; µg/L, micrograms per liter; NFU, nephelometric formazin units; —, not measured; RR, Raritan River; MR, Millstone River]
Phytoplankton Identification and Enumeration
In this study, there were substantial differences between lake outlet and riverine sites in overall phytoplankton assemblage, total taxa richness, and abundance of cyanobacteria (figs. 3, 4). The most abundant phytoplankton divisions (followed by percent abundance across all sites and dates) were: Cyanobacteria (91 percent), Chlorophyta (5 percent), and Bacillariophyta (3.3 percent). The most common cyanobacteria taxa (followed by percent abundance across all sites and dates) were: Cyanodictyon/Aphanocapsa (70.3 percent), Aphanathece (10.6 percent), Microcystis (3.9 percent), Aphanizomenon (3.8 percent), and Planktothrix (3 percent). Lake outlet sites had higher phytoplankton densities and were more likely to be dominated by potential cyanotoxin-producing and filamentous cyanobacteria taxa. For example, Aphanizomenon was generally the most dominant cyanobacteria taxa at Spruce Run Outlet and was present in every sample collected at that site; however, it was only identified in 6 percent of samples collected at Manville RR. Several common bloom-forming taxa (Microcystis, Merismopedia, Dolichospermum, Leptolyngya, Planktolyngbya, and Planktothrix) were only detected at the two lake sites. Several small, coccoid (round), and likely noncyanotoxin-producing taxa (such as Cyanodictyon/Aphanocapsa, Synechococcus, and Chroococus) were detected at all sites (Treviño and others, 2025). Budd Lake Outlet had the strongest seasonally driven patterns in cyanobacteria concentrations (fig. 4A), with a total abundance of more than 1,000,000 cells/mL in October 2020, which is more than 50 times higher than the lowest abundance of approximately 18,000 cells/mL measured in February 2021.
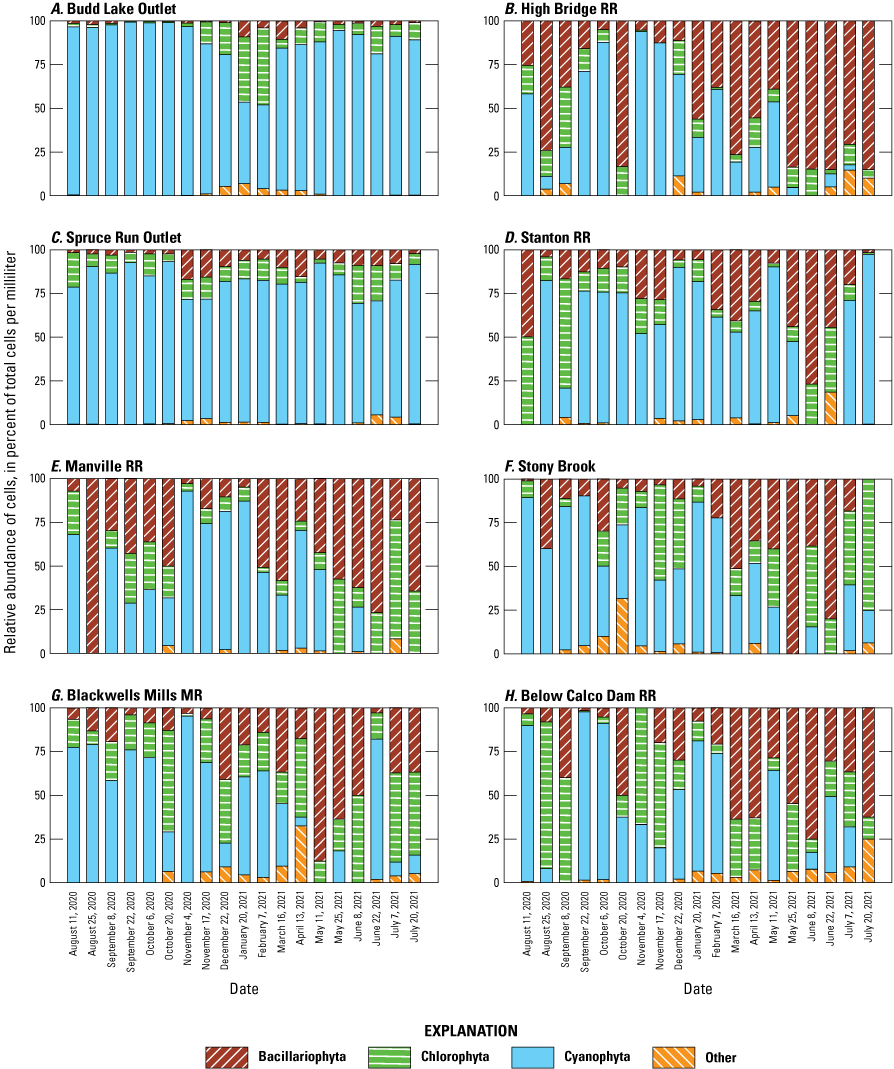
Relative abundance of phytoplankton, shown as percent of total cells per milliliter, by division and sampling event at eight sites in the Raritan Basin Water Supply Complex. [Data from Treviño and others, 2025]
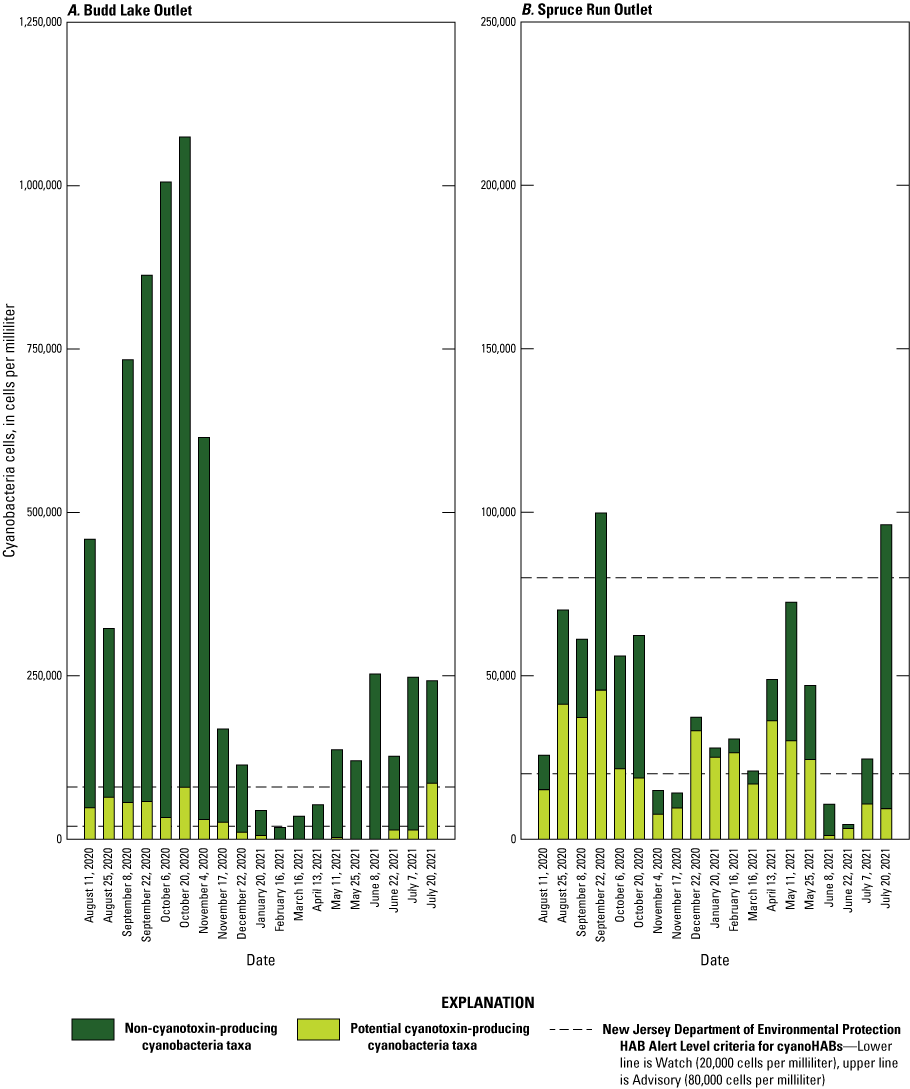
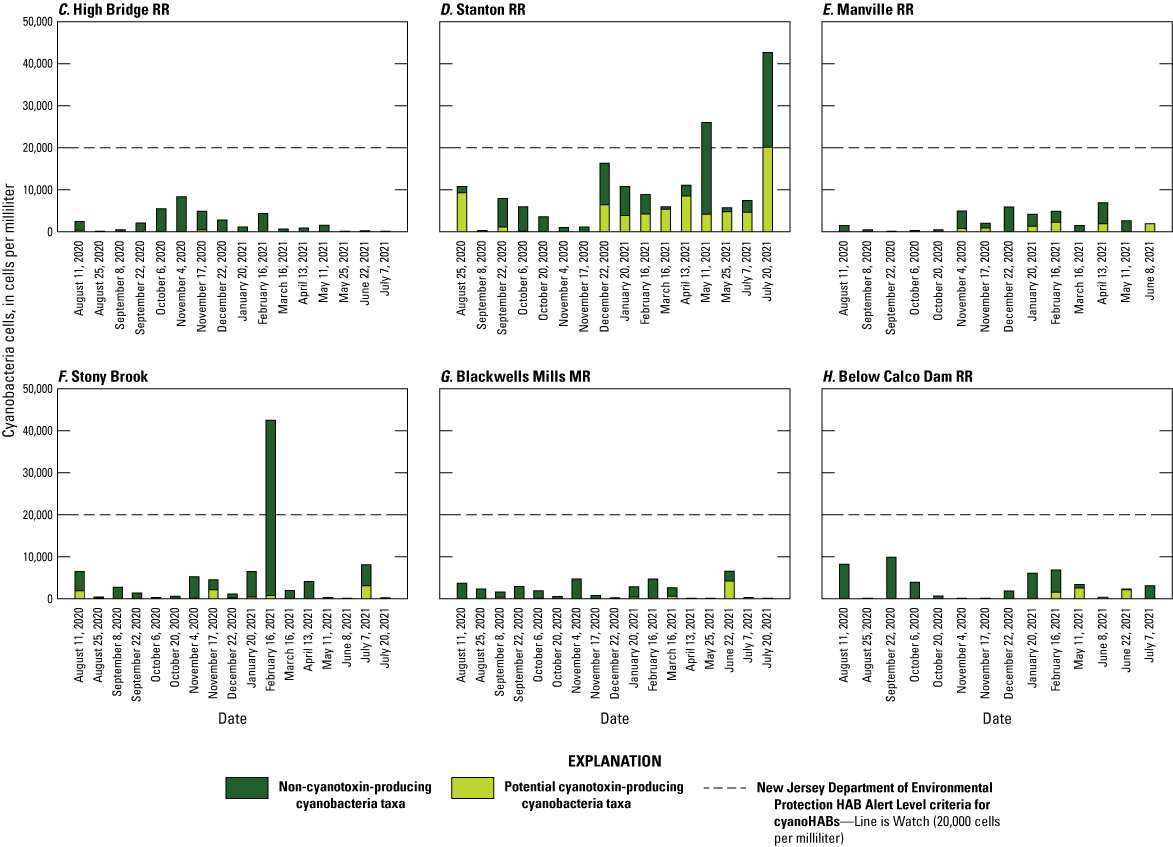
Temporal and spatial variability of cyanobacteria cell densities, in cells per milliliter, of cyanobacteria by potential toxigenicity and sampling event at eight sites in the Raritan Basin Water Supply Complex. A, Budd Lake Outlet; B, Spruce Run Outlet; C, High Bridge Raritan River (RR); D, Stanton RR; E, Manville RR; F, Stony Brook; G, Blackwells Mills Millstone River (MR); and H, Below Calco Dam RR. [Data from Treviño and others, 2025]
The total abundance of cyanobacteria cells in discrete samples exceeded the NJDEP HAB Alert Watch threshold (table 2) in 38 samples out of 160 samples (24 percent of all samples), collected at four sites (Spruce Run Outlet, Budd Lake Outlet, Stanton RR, and Stony Brook). The NJDEP HAB Alert Advisory threshold (table 2) was exceeded in 18 samples (11 percent of all samples) from only the two lake sites (Spruce Run Outlet and Budd Lake Outlet).
At Budd Lake Outlet, the Watch threshold was exceeded in 95 percent of the samples (fig. 4A), and at Spruce Run Outlet, it was exceeded 80 percent of the time for total cyanobacteria (fig. 4B). When only considering potentially toxin-producing cyanobacteria taxa, the exceedance frequencies decline to 50 percent at both Spruce Run Outlet and Budd Lake Outlet. All but four samples at Budd Lake Outlet exceeded the NJDEP HAB Alert Advisory threshold for total cyanobacteria (table 2; fig. 4A); however, most samples were dominated by genera Cyanodictyon and Aphanocapsa, which are not known to produce cyanotoxins. The only dates when the threshold was exceeded by cyanotoxin-producing taxa at Budd Lake Outlet were July 20, 2021, and August 3, 2021, when the samples included Microcystis, Dolichospermum, and other cyanobacteria taxa. At Spruce Run Outlet, two samples exceeded NJDEP HAB Alert Advisory threshold for total cyanobacteria, but neither were dominated by cyanotoxin-producing taxa (fig. 4B).
Exceedances of the NJDEP HAB Alert Watch threshold (table 2) occurred less than 3 percent of the time at the riverine sites (fig. 4C, D, E, F, G, and H). The only date when potentially cyanotoxin-producing taxa were above the threshold was July 20, 2021, at Stanton RR, when the sample was comprised in part of Fischerella (20,136 cells/mL), which was the only sample where that taxa was detected across the whole study period (Treviño and others, 2025). For two other dates when total cyanobacteria cell counts exceeded the NJDEP HAB Alert Watch threshold at riverine sites (May 11, 2021, at Stanton RR and February 16, 2021, at Stony Brook), the composition was dominated by taxa not known to produce cyanotoxins, such as Cyanodictyon, Aphanocapsa, and Aphanothece. No samples in this study exceeded the NJDEP HAB Warning or Danger thresholds (table 2).
At Spruce Run Buoy, samples are presented as biovolume (cubic micrometers per milliliter; µm3/mL) as analyzed by PhycoTech Inc. The most abundant phytoplankton divisions present across all samples on all dates (followed by total percent biovolume) were: Bacillariophyta (54.9 percent), Cyanobacteria (36.9 percent), Chlorophyta (5 percent), and Other (3.3 percent). The most common cyanobacteria taxa present across all samples on all dates (followed by total percent biovolume) were: Aphanizomenon (69.8 percent), Dolichospermum (15.8 percent), Limnoraphis (3 percent), Pseudanabaena (3 percent), Microcystis (2.9 percent), Chrysosporum (1.7 percent), and Woronichinia (1.3 percent). This is consistent with the phytoplankton composition detected at Spruce Run Outlet in the samples analyzed by NJCWST.
A comparison of the continuous-sensor fluorescence data for chlorophyll a, phycocyanin, and discrete chlorophyll a (fig. 5A) from the Spruce Run Buoy reveals some discrepancies with the trends observed in microscopy biovolume. The patterns observed in the sensor data for chlorophyll a and phycocyanin are not always in sync with the total phytoplankton biovolume (fig. 5B) or the cyanobacteria biovolume (fig. 5C) determined from the discrete samples. The chlorophyll a sensor indicated two relative peaks in algal biomass during the study period: from November 2020 to February 2021 and from April 2021 to May 2021 (fig. 5A). Both periods aligned with elevated discrete sample chlorophyll a concentrations, and phytoplankton growth in the April to May 2021 period; however, phytoplankton abundance in the discrete samples was not similarly elevated in the winter period. There was little variability in the phycocyanin data over the entire study period. Both methods indicated a steady rise in algal concentration from March to June 2021, followed by a steep decline beginning on May 25 and continuing to June 8, 2021. The phycocyanin sensor data were consistent throughout the study period and were less sensitive to seasonal patterns of increase or decrease, similar to the other parameters. These findings limit the potential of only using continuous data to determine the occurrence of blooms.
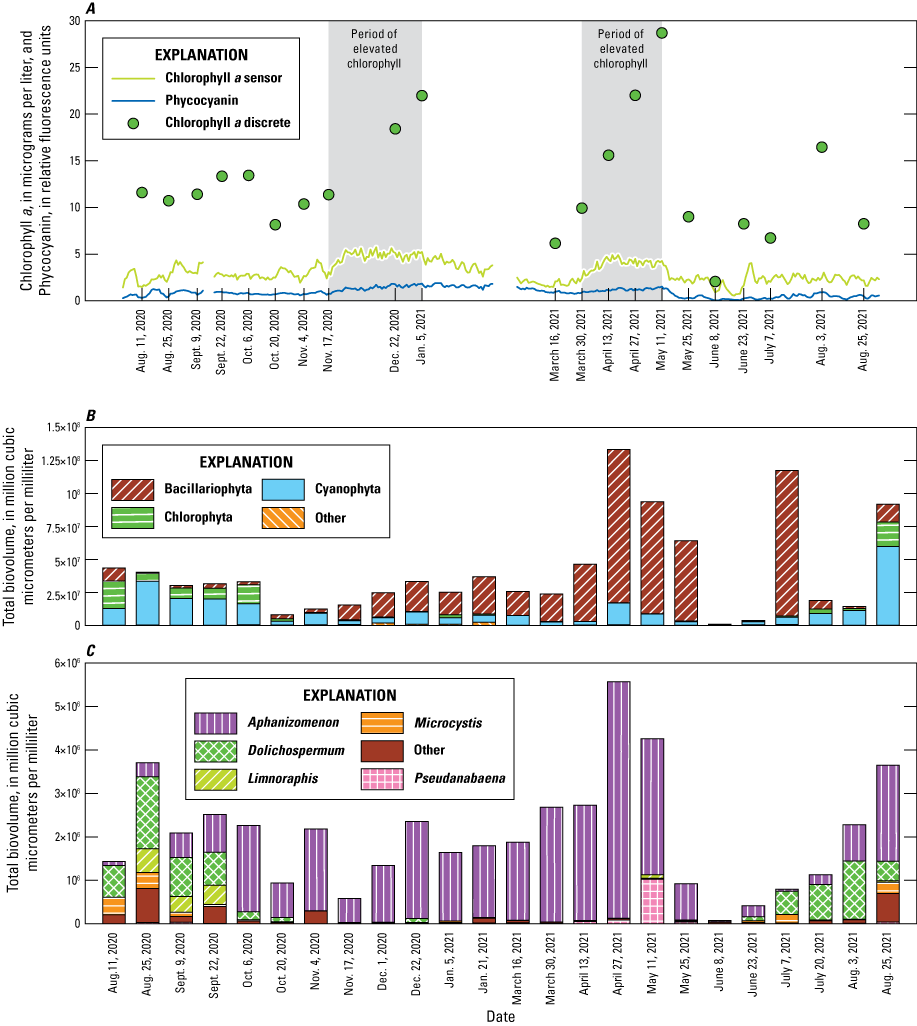
Temporal variability of algal fluorescence, chlorophyll a, and phytoplankton biovolume at the Spruce Run Buoy site in the Raritan Basin Water Supply Complex. A, includes line graph showing continuous (daily mean) sensor-based estimates of chlorophyll a, phycocyanin fluorescence as relative fluorescence units (RFU) measured continuously (lines), and discrete sample chlorophyll a values (points) from August 1, 2020 to August 31, 2021; B, bar graph showing phytoplankton at the phylum level as biovolume in cubic micrometers per milliliter (µm3/mL); and C, shows cyanobacteria grouped by genera as biovolume (µm3/mL). [Data from U.S. Geological Survey, 2024 and Treviño and others, 2025]
Cyanobacteria Genes
16S cyanobacteria genes were detected in all (100 percent) of the 59 analyzed samples from the subset of five sites (Budd Lake Outlet, High Bridge RR, Spruce Run Outlet, Stanton RR, and Manville RR; table 5; fig. 6A), which was higher than the frequency cyanobacteria was found by microscopy (87 percent) in the 97 phytoplankton samples collected from all 8 study sites. The highest abundance of gene copies was at Budd Lake Outlet on October 20, 2020, with 2.2×10⁸ copies per 100 mL. Overall, the 16S cyanobacteria rRNA was strongly positively associated with the abundance of total cyanobacteria (R2=0.62; p>0.001; fig. 7A). On sample dates when no cyanobacteria were detected by microscopy, the cyanobacteria 16S rRNA was still detected (fig. 7A); however, the presence of cyanobacteria 16S rRNA does not provide information regarding the specific taxa or potential for cyanotoxin occurrence.
All four classes of cyanotoxin synthetase genes (mcyE, anaC, sxtA, and cyrA) were detected at least once among all analyzed samples; however, the frequency of detection (percent occurrence) and abundance of gene copies varied substantially by site (table 5, fig. 6B, C, D, E) and over time (fig. 8B, C, D, E). For anaC, 77 percent of riverine samples had detections, whereas 66 percent of samples from lakes had detections. The synthetase gene mcyE was detected in all lake outlet site samples throughout the study. In contrast, 65 percent of riverine samples had detections, which is a lower rate than a previous national study of large rivers that found mcyE in about 90 percent of riverine samples (Zuellig and others, 2021). Compared to the riverine sites (table 3), the lake outlet sites (Spruce Run Outlet and Budd Lake Outlet) had higher median abundance of mcyE and sxtA (fig. 6B, D); but, for anaC, abundance at the riverine sites was higher (fig. 6C), which is consistent with previous studies (Howard and others, 2021; Zuellig and others, 2021). The highest single-sample abundance of sxtA was from Spruce Run Outlet, with 100,000 copies/100 mL detected on September 22, 2020; mcyE, Budd Lake Outlet, with 2,200,000 copies/100 mL detected on July 7, 2021; and cyrA, Budd Lake Outlet, with 5,200 copies/100 mL detected on June 8, 2021. The highest abundance of anaC was at Stanton RR, with 21,000 copies/100 mL on February 16, 2021.
The two lake outlet sites were dissimilar—Spruce Run Outlet had a higher rate of detection and higher mcyE gene concentrations throughout the study (table 5; fig. 6B, 8B). There were seasonal differences in phytoplankton composition, such as a shift to higher concentrations of microcystin-producing taxa. For example, Budd Lake Outlet had summer and fall peaks in mcyE (fig. 8B), which is consistent with seasonal patterns in total cyanobacteria abundance (fig. 4A). These patterns included a consistently high abundance of cyanobacteria at Budd Lake Outlet (fig. 4A), but a low persistence of the assemblage downstream to High Bridge RR (fig. 4C) which was also reflected in the mcyE results (figs. 6B, 8B). A different pattern was observed where the cyanobacteria assemblage from Spruce Run Outlet (fig. 4B) would often persist to Stanton RR (fig. 4D). This is mirrored in the mcyE results from Spruce Run Outlet to Stanton RR, and even further downstream to Manville RR on certain dates, such as May 11–12, 2021 (figs. 6B, 8B).
Table 5.
Summary of relative percentages of occurrence of cyanobacteria genes among all analyzed samples (n=59).[Data are from Treviño and others (2025). Cyano, 16S rRNA for all cyanobacteria; mcyE, microcystin synthetase gene, anaC, anatoxin synthetase gene; sxtA, saxitoxin synthetase gene; cyrA, cylindrospermopsin synthetase gene; RR, Raritan River]
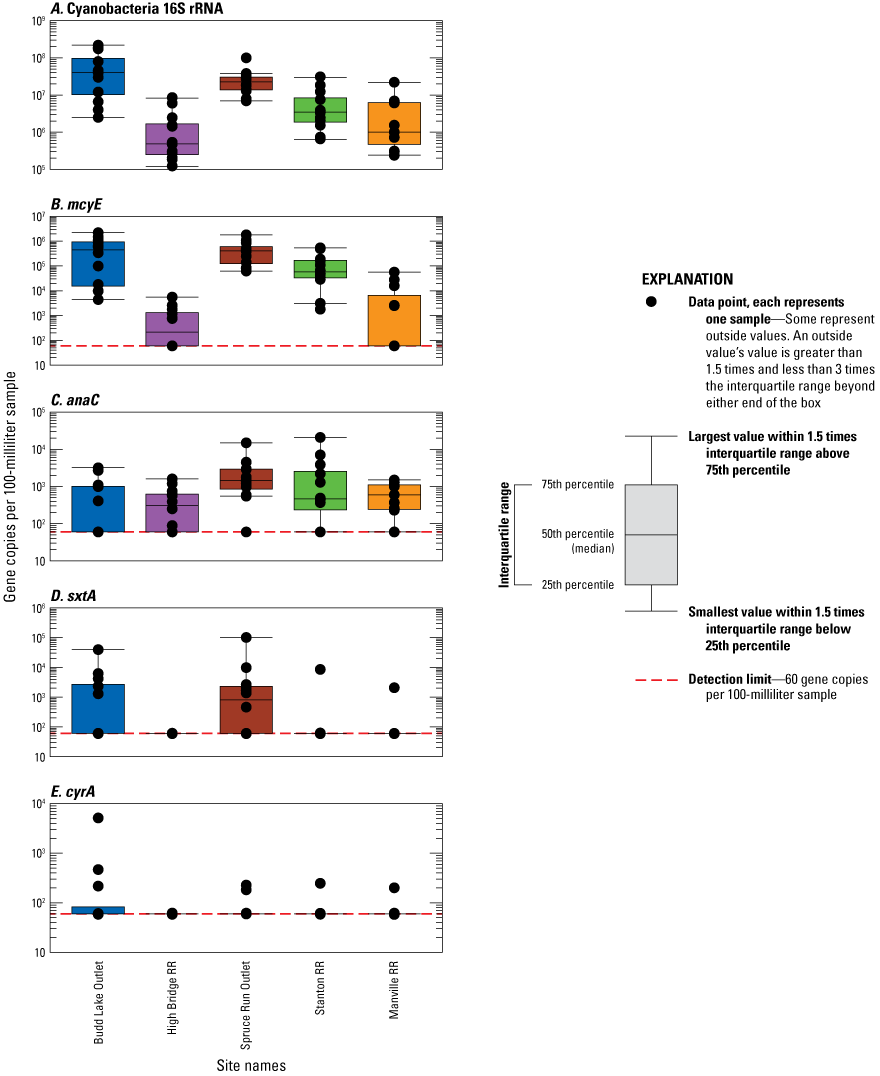
Boxplots of the number of gene copies per sample (copies/100 mL) as determined by quantitative polymerase chain reaction (qPCR) at selected sites in the Raritan Basin Water Supply Complex. Panels from top to bottom are A, Cyanobacteria 16S rRNA; B, microcystin synthetase gene, mcyE; C, anatoxin synthetase gene, anaC; D, saxitoxin synthetase gene, sxtA; and E, cylindrospermopsin synthetase gene, cyrA. For each site, the number of samples was 12, except for Manville RR, which was 11.

[Data are from Treviño and others (2025). RR, Raritan River]
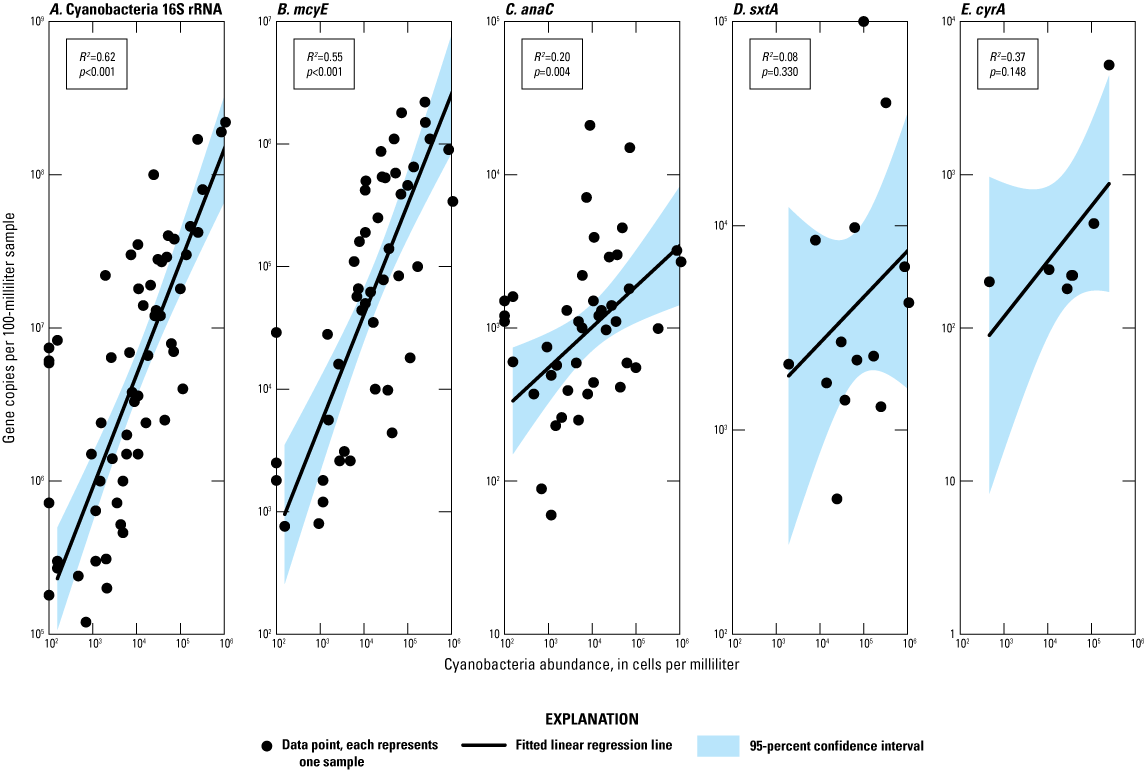
Comparison between cyanobacteria abundance (cells/mL) and gene copies (copies/100 mL sample) across all sites in the Raritan Basin Water Supply Complex by cyanotoxin synthetase gene. A, Cyanobacteria 16S rRNA; B, microcystin synthetase gene, mcyE; C, anatoxin synthetase gene, anaC; D, saxitoxin synthetase gene sxtA; and E, cylindrospermopsin synthetase gene, cyrA.
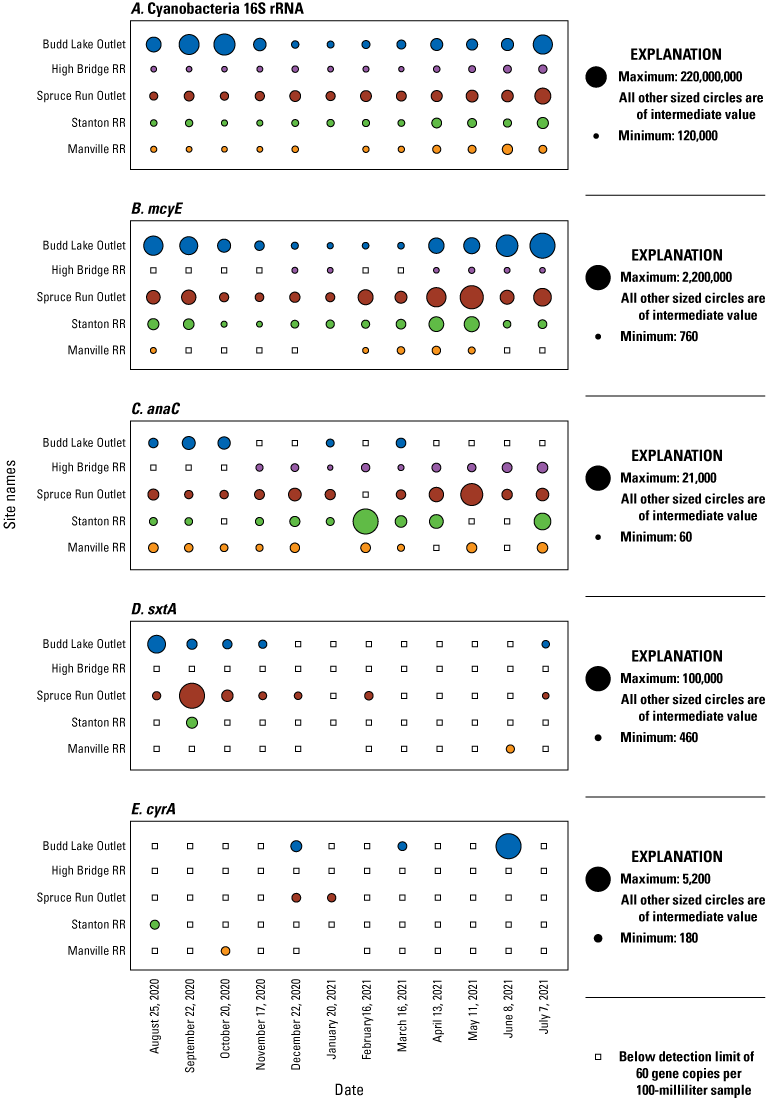
Bubble plots of the number of gene copies (copies/100 mL sample) as determined by quantitative polymerase chain reaction (qPCR) during each sampling event in the Raritan Basin Water Supply Complex. Panels from top to bottom are A, Cyanobacteria 16S rRNA; B, microcystin synthetase gene, mcyE; C, anatoxin synthetase gene, anaC; D, saxitoxin synthetase gene, sxtA; E, cylindrospermopsin synthetase gene, cyrA. Note varying scales among plots. [RR, Raritan River]
Changes in anaC presence can be linked to specific cyanobacteria taxa, and across all sites, the number of gene copies was significantly positively associated with total cyanobacteria density (fig. 4, fig. 7C). At Stanton RR, when there was a peak in anaC concentration on February 16, 2021 (fig. 8C), the cyanobacteria in that sample were comprised of: Aphanothece (40 percent abundance), Aphanizomenon (36.5 percent abundance), Dolichospermum (11.3 percent abundance), and Cyanodictyon/Aphanocapsa (7.8 percent abundance). That sample from Stanton RR was the only time Dolichospermum had appreciable abundance at the site throughout the study. It is noteworthy that the abundance of Dolichospermum at Stanton RR (1,007 cells/mL) on February 16, 2021, was about 2 times higher than at the Spruce Run Outlet on the same date (620 cells/mL; fig. 4) and indicates local growth may have been occurring despite the cold-water temperature on that date (3.5°C). The abundance of anaC at Spruce Run Outlet peaked on May 11, 2021 (fig. 8C), and the associated phytoplankton sample was composed of Jaaginema and Aphanizomenon (53.5 and 41.6 percent of total phytoplankton abundance, respectively), representing one of the lowest percent compositions by Aphanizomenon recorded at the site throughout the study. Aphanizomenon is a known anatoxins producer (Christensen and Khan, 2020), but Jaaginema is not known to produce any cyanotoxins. Cyanotoxin production is strain-specific (Wehr and others, 2014; Christensen and Khan, 2020). It is possible that the Aphanizomenon population had a higher proportion of strains with the anaC gene in May 2021. Alternatively, Jaaginema may have the anaC gene, although it has not yet been identified as a potential anatoxin producer. SxtA and cyrA were detected substantially less frequently than the other two synthetase genes (table 5; figs. 6D, E) and, when compared to the other two genes, were not significantly correlated to total cyanobacteria density (figs. 7D, E); therefore, there was no attempt to correspond increases in gene copies to the occurrence of specific cyanobacteria taxa.
Cyanotoxin Analyses
Of the discrete samples analyzed for total and dissolved microcystins (177 analyzed samples), none had detections for dissolved microcystins above the method reporting limit (0.3 µg/L), although 15 samples were above the MDL (0.15 µg/L). For total microcystins, 11 samples (6 percent) had detections above the MRL, and an additional 20 samples were between the detection and reporting limits (table 6). The samples with detections above the reporting limit were exclusively from the 2 lake outlet sites (8 from Budd Lake Outlet and 3 from Spruce Run Outlet); this suggests that microcystins are present in the lakes, but they are not persisting downstream to the riverine sites. The highest single-sample microcystin detection was 1.4 µg/L on August 3, 2021, at Budd Lake Outlet, which was above the EPA-treated drinking-water thresholds (table 1), but is well below the threshold to determine a NJDEP HAB Alert Warning level (table 2) for recreational activities (New Jersey Department of Environmental Protection, 2022).
Table 6.
Summary of detections of total microcystins in discrete samples analyzed by enzyme-linked immunosorbent assay (ELISA) and detections of microcystins from solid phase adsorption toxin tracking (SPATT) sampler extracts analyzed by liquid chromatography with tandem mass spectrometry (LC-MS/MS) in the Raritan Basin Water Supply Complex.[Data are from Treviño and others (2025). MDL, minimum detection limit; MRL, minimum reporting limit; µg/L, microgram per liter; RR, Raritan River; NA, not applicable; —, not analyzed; MR, Millstone River]
Passive Samplers
The SPATT samplers were retrieved after deployments ranging from 7 to 20 days, with a median value of 14 days across all samplers. Microcystin concentrations in SPATT extracts are semi-quantitative and should not be directly compared to the discrete sample results in water samples, as the SPATT results are representative of a span of time as opposed to an instantaneous measurement, and SPATT samplers were deployed for varying amounts of time (table 6). Anatoxins and cylindrospermopsins were not detected in any of the extracts, so the focus of this section is on the microcystin data only.
Microcystins were detected in 83 percent of SPATT samplers (n=60), which was a substantially higher detection rate than discrete samples analyzed for microcystin by ELISA (table 6), but similar to rates of detection of mcyE (table 5). The only sites with microcystin detections above the MRL in discrete samples (Budd Lake Outlet and Spruce Run Outlet) also had detections in SPATT samplers 100 percent of the time (fig. 9). Although the lake outlet sites had more frequent detections of microcystin, the two highest SPATT-sampler microcystin concentrations across all dates were from Stanton RR and Manville RR. It is important to note that they were from the first samplers deployed at those sites (August 26 to September 9, 2020) (fig. 10) and were not coincident with elevated concentrations of either potentially toxic cyanobacteria or mcyE gene copies at either site (figs. 4D, E, 8B). Though there was a lack of microcystin detections above the MRL in the discrete samples, especially from Stanton RR and Manville RR (table 6), the detections in the SPATT sampler results suggest that transport of microcystin downstream from the lake sites may have occurred. The third-highest single-sample value was from Budd Lake Outlet by the SPATT sampler deployed from June 22 to July 7, 2021, which was coincident with elevated levels of potentially toxic cyanobacteria and mcyE gene copies (figs. 4A and 8B). These samplers were all deployed during peak cyanoHAB season, which is generally July through September in New Jersey (New Jersey Department of Environmental Protection, 2022); SPATT cyanotoxin-accumulation rates were lowest during the winter months (October through April; fig. 10).
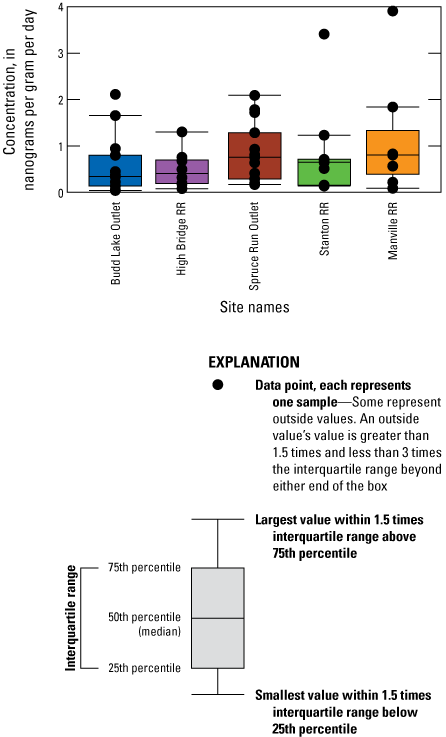
Boxplot of microcystin concentration in solid phase adsorption toxin tracking (SPATT) sampler extracts analyzed by liquid chromatography with tandem mass spectrometry (LC-MS/MS) by study site in the Raritan Basin Water Supply Complex, adjusted to concentration over time deployed (ng/g/day). For number of samples, refer to table 6. [RR, Raritan River]
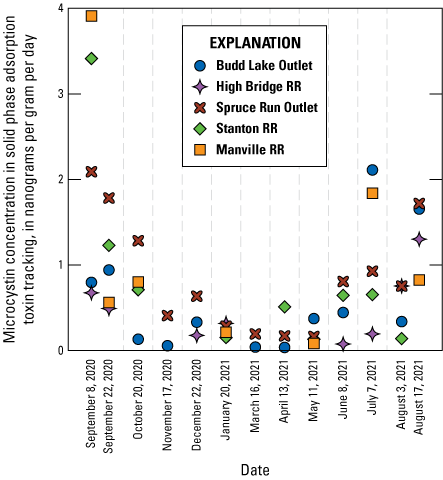
Microcystin concentration over time deployed (ng/g/day) in solid phase adsorption toxin tracking (SPATT) sampler extracts analyzed by liquid chromatography with tandem mass spectrometry (LC-MS/MS) for each sample event over time, shown as date retrieved and colored by study site in the Raritan Basin Water Supply Complex.
Comparative Analysis
Evidence of movement of cyanobacteria and microcystin among sites and over time was evaluated by aligning four indicators: total phytoplankton abundance, detections of mcyE by qPCR, microcystin analysis of discrete samples, and microcystin analysis from SPATT samplers (fig. 11). Detections across all four indicators and agreement among the methods were most common at the two lake outlet sites (Budd Lake and Spruce Run; figs. 11A, C). There were no seasonal trends in detection that suggest downstream transport was more prevalent in the summer or winter months (fig. 11). Clonan (2026) showed that cyanobacteria cells did not often transport downstream in this system; however, this analysis shows that there was some transport of both genetic material and microcystin in sporadic detections by qPCR and SPATT samplers, respectively. The data from Budd Lake and Spruce Run Outlets suggest that these sites were a constant source of cyanobacteria, potential cyanotoxin producers, and cyanotoxins, with several dates where all four cyanoHAB indicators were detected (figs. 11A, C). However, the cyanoHABs did not appear to transport downstream. This was particularly apparent during the summer when cyanoHAB conditions occurred at the lake outlet sites, but were not detected at the riverine sites, such as the period from July 7, 2021, to August 3, 2021 (fig. 11). At the riverine sites, several dates were discordant, wherein cyanotoxins were detected by one indicator and not the others (figs. 11B, D, E). The cyanotoxins and genes that were detected at downstream sites (Stanton RR and Manville RR) were generally not linked to bloom conditions and may have been produced locally or transported from other source areas that were not sampled as part of this study.
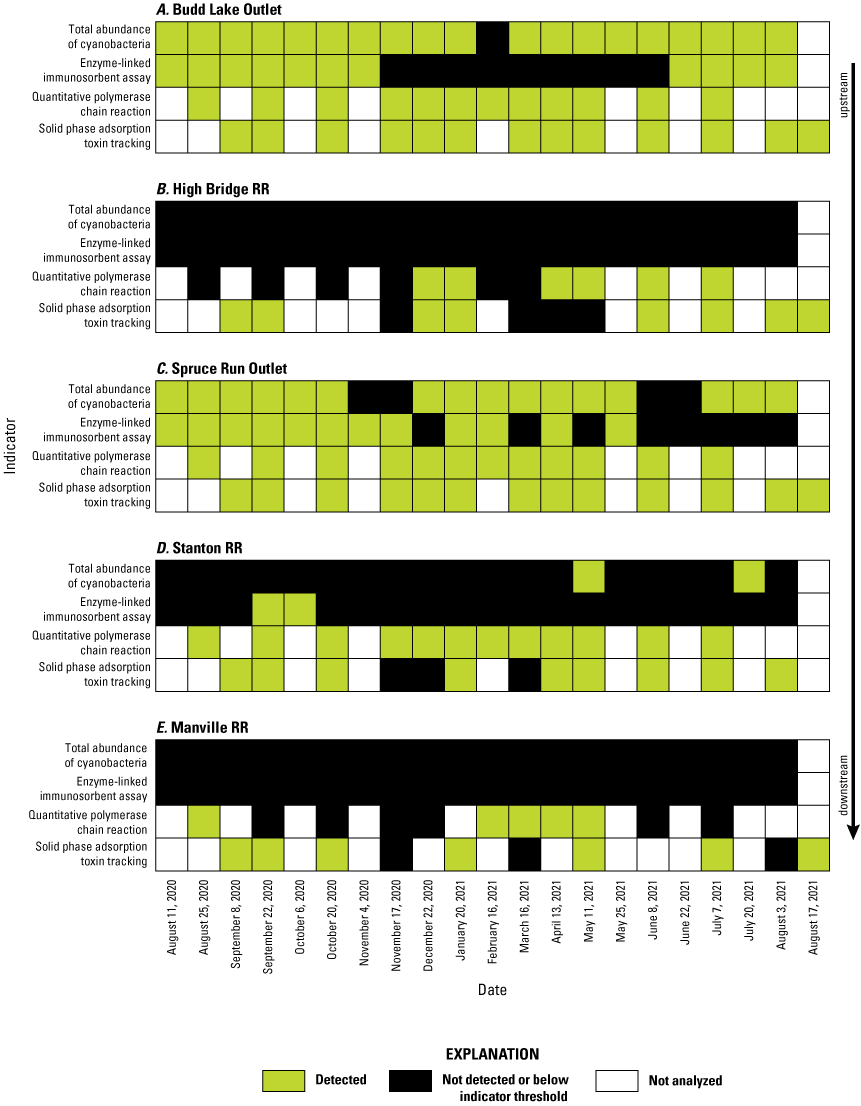
Timeline comparing detections of cyanobacteria and microcystin by four methods. Total abundance of cyanobacteria is indicated as detected if it was above the New Jersey Department of Environmental Protection (NJDEP) harmful algal bloom Alert Watch threshold (20,000 cyanobacteria cells/mL). [Data from U.S. Geological Survey, 2024 and Treviño and others, 2025]
Association Between Biological Response and Environmental Variables
Overall, the strength of significant Spearman-correlation associations between biological response and environmental variables (11 total variables, 55 correlations, fig. 12) was stronger in lake sites than riverine sites (median values=0.41 and 0.15, respectively) and more often positively correlated (87 percent and 56 percent, respectively). Relations were nearly all positive at the lake sites, except for several indicators (TN, anaC, and cyanobacteria 16S rRNA) with SPATT microcystin detections (fig. 12A), which is consistent with the restrictions of relying on SPATT as an environmentally relevant indicator of environmental concentrations (Howard and others, 2021, Jaegge and others, 2026). At the riverine sites, TN and TP were negatively correlated with most of the biological indicators (fig. 12B), which is consistent with other literature on riverine HABs (Wood and others, 2020; Jarvie and others, 2025)23. Further, several specific correlation pairs between the biological indicators were stronger in riverine sites despite less frequent detections, such as total abundance of cyanobacteria with chlorophyll a, cyanobacteria 16S rRNA, and mcyE gene copies (fig. 12B).
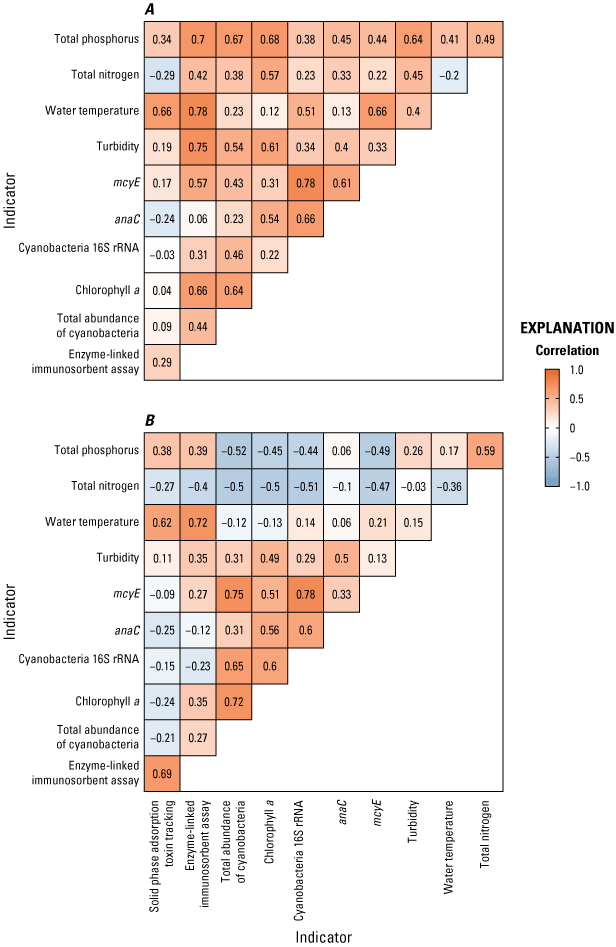
Correlation matrix showing Spearman correlation coefficients between biological response and environmental variables measured at A, lake outlet sites, and B, riverine sites. [Cyanobacteria 16S rRNA gene copies; anaC, anatoxin synthetase gene copies; mcyE, microcystin synthetase gene copies]
Conclusions
The widespread occurrence of cyanobacteria throughout the study area was consistent with genetic findings, suggesting a common presence of cyanobacteria in the Raritan Basin Water Supply Complex. Although discrete sampling during this study did not reveal cyanotoxins above any thresholds to human health (tables 1, 2), the presence of toxigenic cyanobacteria, cyanotoxin-producing genes, and consistent detections of microcystins from the SPATT samplers indicate potential for future concerns related to cyanoHABs within the Raritan Basin Water Supply Complex. The low cyanotoxin concentrations likely do not have human health implications, but they may affect aquatic and terrestrial food webs (Moy and others, 2016; Bukaveckas and others, 2018). When conditions are favorable, particularly during warm temperatures from June through September and (or) during periods of low flow, cyanobacteria could begin to proliferate and lead to more widespread cyanotoxin occurrences. Considering the Raritan Basin Water Supply Complex’s extensive use as a drinking-water supply, these cyanoHAB events could lead to potential risks to human and environmental health (Hsu and others, 2024). Cyanobacteria were typically most abundant in August and September, but cyanoHABs can occur any time of year; therefore, datasets that span year-round, such as this study, can enhance understanding of bloom-formation mechanisms (Chorus and Welker, 2021; Reinl and others, 2023).
These findings are consistent with previous studies, which indicated that cyanobacteria, cyanotoxin synthetase genes, and cyanotoxins have been found at low concentrations in many large rivers across the Nation, with eutrophic (high-nutrient) rivers having the highest phytoplankton biomass, abundance of cyanotoxin synthetase genes, and cyanotoxin occurrences (Graham and others, 2020; Linz and others, 2023). The sporadic detection of microcystins by ELISA compared to the persistent detection of both genes by qPCR (cyanotoxin synthetase genes and 16S rRNA) and microcystins by SPATT suggests there could be sources of cyanobacteria growth elsewhere in the system in addition to Budd Lake and Spruce Run Reservoir.
In this study, detections of cyanobacteria 16S rRNA and cyanotoxin synthetase genes had higher sensitivity to detect cyanobacteria compared to microscopy, which has also been shown in other studies for large rivers in New Jersey (Hsu and others, 2024) and across the United States (Graham and others, 2020). Cyanobacteria abundance and mcyE gene copies across all sites were moderately correlated and significantly positively associated (R2=0.55, p<0.001; fig. 7B). Relative mcyE densities between upstream and downstream sites on each sampling date overlapped with patterns in taxa capable of producing microcystin, as described by Clonan (2026).
Because of their continuous-absorption capacity, SPATT samplers are well-suited for the evaluation of spatial and vertical cyanotoxin dispersal and persistence patterns in flowing-water systems (Kudela, 2011; Wood and others, 2020; Howard and others, 2021). Other studies have advanced the understanding of SPATT use and applicability in a range of system types (Carpenter and Wise, 2023; Johnston and others, 2025; Jaegge and others, 2026). However, there are substantial limitations to extrapolating quantities of cyanotoxins detected in SPATT-sampler extracts to environmentally relevant concentrations. In addition to deployment time, cyanotoxin adsorption by SPATT samplers can be affected by water temperature, turbidity, water chemistry, salinity, hydrodynamics, and concentrations of cyanotoxins (Jaegge and others, 2026). Results from the SPATT deployments in this system show persistent low concentrations of microcystin compared to the discrete samples (figs. 9, 11). At times, cyanotoxins can be detected with SPATT in the absence of any other measures, which indicates they may be transported from upstream locations in low concentrations rather than cyanobacteria growth occurring at each site. SPATT samplers can serve as an early warning tool for source-water reservoirs or downstream-intake points to detect cyanotoxins prior to the occurrence of a bloom event (Howard and others, 2021).
During periods of increased streamflow, greater cyanobacteria biomass can be mobilized and transported downstream, potentially affecting water quality and ecological health. Graham and others (2012) support this notion, demonstrating a correlation between larger reservoir releases and increased cyanobacteria densities in downstream waters. These findings emphasize the importance of considering hydrological factors—such as streamflow and reservoir releases— when assessing the potential for cyanotoxin transport and its effects downstream (Schmadel and others, 2024; Clonan, 2026).
Although continuous water-quality sensors provide valuable data, the findings from the Spruce Run Buoy suggest that, at least at that site, further data collection and analysis could help to: (1) accurately interpret the algal growth trends, and (2) observe indicators of algal blooms in real time. This finding aligns with previous research that highlighted the limitations of fluorescence sensors when detecting cyanoHABs (Foster and others, 2022). This discrepancy may be attributed to changes in algal material following sample preservation (Gifford and others, 2024) as well as differing water-column depths between the sensor location on the buoy and the depth at which discrete water samples are collected. Additionally, the fluorescence sensor measures a biological response affected by factors such as light environment, physiological status of algal communities, and algal morphology (Foster and others, 2022). Potentially, continuous water-quality data collected concurrently can help identify environmental variables that may affect the adsorption of cyanotoxins to SPATT as well as natural materials in the lake and rivers.
Limitations
This study represents a snapshot of conditions from August 2020 to August 2021. To fully understand the complex dynamics of cyanotoxin transport and the effect of environmental factors, long-term monitoring studies may better capture seasonal and interannual variations. Seasonal changes in temperature, nutrient availability, and hydrological conditions can substantially affect the growth, cyanotoxin occurrence, and transport of cyanobacteria. By examining seasonal and interannual patterns, scientists and managers can gain valuable insights into the factors that drive cyanotoxin occurrences and develop more effective strategies for mitigating their effects.
A primary limitation in the ability to assess cyanotoxin transport in this study was the low number of cyanotoxin detections, especially cyanotoxins other than microcystin. This could be attributed to several factors:1. Temporal and spatial sampling resolution: The sampling design aimed to capture potential cyanotoxin-transport events, but the frequency and location of sampling sites may not have been optimal for detecting sporadic or localized occurrences. The timing of the study captured portions of two years (2020 and 2021), but not the full pattern of formation and dissipation of one bloom season.2. Low cyanotoxin concentrations: Cyanotoxins may have been present in the system, but were below MDLs, particularly during periods of low cyanoHAB activity, such as the winter months. The findings of more common detections in the SPATT samplers support this result as they tend to concentrate even low amounts of cyanotoxins (Kudela, 2011).3. Rapid cyanotoxin degradation: Environmental factors such as sunlight, temperature, and microbial activity can rapidly degrade cyanotoxins, limiting their persistence in the water column and reducing the likelihood of detection, especially anatoxins (Christensen and Khan, 2020; Chorus and Welker, 2021). The discrete samples were not analyzed for anatoxins; however, anatoxins and cylindrospermopsin were measured but not detected in the SPATT samples. Although potential producers for these cyanotoxins were present in the system, microcystin is likely the most concerning cyanotoxin in the Raritan Basin Water Supply Complex.4. Complex hydrological and meteorological conditions: Variable hydrological conditions, such as fluctuating flow rates and water levels, can affect cyanotoxin transport and dispersion, making it difficult to predict and track their movement. The study does not fully encompass the scope of interannual variability. For example, during times of drought, discharge from Spruce Run Reservoir makes up a much higher proportion of the Raritan River flow than the portion of discharge the reservoir contributed to the river during this study (New Jersey Water Supply Authority, 2005).
Further research could increase understanding of the factors influencing cyanotoxin transport and support development of more effective monitoring strategies. Future studies could benefit from increased sampling frequency, the use of more sensitive analytical techniques, and the integration of hydrological and meteorological data to refine predictions of cyanotoxin-transport events. To further refine our understanding of cyanotoxin transport and its potential effect on drinking-water sources, future investigations could focus on the following key areas:
-
• High-frequency monitoring at key locations: Implementing continuous or high-frequency monitoring of cyanotoxins and environmental constituents at critical locations can provide valuable insights into the rapid changes in riverine systems that occur during and after storm events (Schmadel and others, 2024) and (or) after large releases from reservoirs, such as Spruce Run Reservoir.
-
• Advanced modeling techniques: Utilizing sophisticated hydrodynamic and water-quality models can help predict the transport and fate of cyanotoxins under various hydrological and meteorological conditions (Schmadel and others, 2024; Jarvie and others, 2025).
-
• Integration of remote sensing: Incorporating satellite imagery and drone-based remote sensing can provide large-scale spatial information on the distribution and occurrence of cyanobacteria blooms and possibly even their potential to produce cyanotoxins (Wood and others, 2020).
-
• Interdisciplinary collaboration: Fostering collaboration between stakeholders and collaborators can facilitate a comprehensive understanding of the complex interactions between physical, chemical, and biological factors that affect cyanotoxin transport. Addressing these can improve the ability to assess risks, develop early warning systems, and implement effective management strategies to protect public health and water resources (Brooks and others, 2016; Chorus and Welker, 2021).
Summary
From August 2020 to August 2021, the U.S. Geological Survey (USGS), in cooperation with New Jersey Water Supply Authority (NJWSA), New Jersey Department of Environmental Protection (NJDEP), and Montclair State University conducted a study to characterize the extent, duration, and potential transport of cyanobacteria and associated cyanotoxins within the Raritan Basin Water Supply Complex to better understand cyanotoxin and cyanobacteria occurrence in this system. The specific objectives of this report are to: (1) characterize findings from discrete water-quality samples, solid phase adsorption toxin tracking (SPATT), and continuous-sensor measurements, and (2) relate those results to cyanobacteria, cyanobacteria genes, cyanotoxins, chlorophyll a, water-quality data, and relevant New Jersey cyanobacteria harmful algal bloom (cyanoHAB) advisory thresholds.
Data were collected on 20 dates from 8 riverine and lake outlet locations in the Raritan River Water Supply Complex. Discrete samples were analyzed for nutrients, turbidity, chlorophyll a, phytoplankton identification and enumeration, cyanobacteria genes, and cyanotoxins. A sonde was used to measure water temperature and pH at each site during discrete-sample collection. SPATT extract samples were analyzed for cyanotoxins.
This study showed substantial assemblage differences between lake outlet and riverine sites in overall phytoplankton composition. Lake outlet sites had higher densities of phytoplankton and were more likely to be dominated by potential cyanotoxin-producing and filamentous cyanobacteria taxa. On several dates, the abundance of cyanobacteria exceeded the NJDEP harmful algal bloom Alert Watch threshold (above 20,000 cells per milliliter [cells/mL]) at the lake sites. Comparatively few exceedances occurred at the riverine sites, which were rarely dominated by potential cyanotoxin-producing taxa. At the Spruce Run Buoy site, the phytoplankton composition was dominated by potential cyanotoxin-producing taxa throughout the year. Continuous-sensor-fluorescence chlorophyll a and phycocyanin data show some discordance with the microscopy biovolume, limiting the potential usage of continuous data to determine if a bloom is occurring using these data alone. All four classes of cyanotoxin synthetase genes (microcystin [mcyE], anatoxins [anaC], saxitoxin [sxtA], and cylindrospermopsin [cyrA]) were detected at least once among all analyzed samples; however, the frequency of detection (percent occurrence) and abundance of gene copies varied substantially by site and over time. Compared to the riverine sites, the lake outlet sites had higher mean detections of mcyE, sxtA, and cyrA, but for anaC, detections at the riverine sites were higher. Three of the genetic indicators (cyanobacteria 16S ribosomal ribonucleic acid [rRNA], mcyE, and anaC) were significantly positively associated with total cyanobacteria abundance.
Of the discrete samples analyzed for microcystins, none had detections above the method reporting limit (0.3 micrograms per liter [µg/L]). Microcystin detections were exclusively from the lake outlet sites and were all below the NJDEP HAB Alert Warning level [20 µg/L]). Microcystins were detected in 83 percent of SPATT samplers, a substantially higher rate than for discrete samples. Evidence of cyanobacteria and microcystin transport among sites was evaluated over time by aligning four indicators: total phytoplankton abundance, detections of mcyE by quantitative polymerase chain reaction (qPCR), microcystin analysis of discrete samples, and microcystin analysis from SPATT samplers. Detections across all indicators were most common at the two lake outlet sites. There were no seasonal trends in the indicators that suggested downstream transport was more prevalent in the summer or winter months. Under the conditions sampled during this study, results suggest the cyanobacteria and cyanotoxins from Budd Lake and Spruce Run Reservoir did not often lead to pronounced cyanobacteria and cyanotoxin presence at Manville RR or further downstream. There was some transport of both genetic material and microcystin shown in sporadic detections by qPCR and SPATT samplers, respectively, but no evidence of proliferation exists at these sites. The results from Budd Lake and Spruce Run Outlets suggested that these sites were a constant source of cyanobacteria, even when a visible cyanoHAB was not present. The strength of associations between biological response and environmental variables were stronger in lake sites than in riverine sites.
The widespread occurrence of cyanobacteria throughout the study area is consistent with the genetic findings, suggesting a common presence of cyanobacteria in the Raritan Basin Water Supply Complex. Although discrete sampling during this study did not reveal cyanotoxins at concentrations of high risk to human health, the presence of toxigenic cyanobacteria, cyanotoxin-producing genes, and consistent detections of microcystins from the SPATT samplers indicate potential for future concerns related to cyanoHABs within the system. Although continuous water-quality sensors provide valuable data, the findings from the Spruce Run Buoy suggest, at least at that site, further analysis could help to: (1) accurately interpret the algal growth trends, and (2) observe indicators of algal blooms in real time. Additional studies of cyanobacteria and cyanoHABs in the Raritan River basin could benefit from increased sampling frequencies, more sensitive analytical techniques, and the integration of hydrological and meteorological data to refine our understanding of cyanotoxin occurrence in riverine systems.
References Cited
Al-Tebrineh, J., Pearson, L.A., Yasar, S.A., and Neilan, B.A., 2012, A multiplex qPCR targeting hepato- and neurotoxigenic cyanobacteria of global significance: Harmful Algae, v. 15, p. 19–25, accessed February 9, 2026 at https://doi.org/10.1016/j.hal.2011.11.001.
Arar, E.J., and Collins, G.B., 1997, Method 445.0 in vitro determination of chlorophyll a and pheophytin a in marine and freshwater algae by fluorescence—Revision 1.2: United States Environmental Protection Agency, Office of Research and Development, National Exposure Research Laboratory, accessed February 24, 2026, at https://nepis.epa.gov/Exe/ZyPURL.cgi?Dockey=P100PH99.txt
Barnard, M.A., Chaffin, J.D., Plaas, H.E., Boyer, G.L., Wei, B., Wilhelm, S.W., Rossignol, K.L., Braddy, J.S., Bullerjahn, G.S., Bridgeman, T.B., Davis, T.W., Wei, J., Bu, M., and Paerl, H.W., 2021, Roles of nutrient limitation on western Lake Erie CyanoHAB toxin production: Toxins, v. 13, no. 1, p. 47, accessed February 9, 2026, at https://doi.org/10.3390/toxins13010047.
Bellinger, E.G., and Sigee, D.C., eds., 2015, A key to the more frequently occurring freshwater algae, chap. 4 of Bellinger, E.G., and Sigee, D.C., eds., 2015, Freshwater algae—Identification, enumeration and use as bioindicators (2d ed.): New York, Wiley, p. 141–252, accessed February 9, 2026, at, https://doi.org/10.1002/9781118917152.ch4.
Birbeck, J.A., Westrick, J.A., O’Neill, G.M., Spies, B., and Szlag, D.C., 2019, Comparative analysis of microcystin prevalence in Michigan lakes by online concentration LC/MS/MS and ELISA: Toxins, v. 11, no. 1, p. 13, accessed February 9, 2026, at https://doi.org/10.3390/toxins11010013.
Boyer, G.L., 2020, LCMS-SOP determination of microcystins in water samples by high performance liquid chromatography (HPLC) with single quadrupole mass spectrometry (MS): Protocols.io website, accessed February 2, 2026, at https://doi.org/10.17504/protocols.io.bck2iuye.
Brooks, B.W., Lazorchak, J.M., Howard, M.D.A., Johnson, M.V.V., Morton, S.L., Perkins, D.A.K., Reavie, E.D., Scott, G.I., Smith, S.A., and Steevens, J.A., 2016, Are harmful algal blooms becoming the greatest inland water quality threat to public health and aquatic ecosystems?: Environmental Toxicology and Chemistry, v. 35, no. 1, p. 6–13, accessed February 2, 2026, at https://doi.org/10.1002/etc.3220.
Bukaveckas, P.A., Franklin, R., Tassone, S., Trache, B., and Egerton, T., 2018, Cyanobacteria and cyanotoxins at the river-estuarine transition: Harmful Algae, v. 76, p. 11–21, accessed July 18, 2025, at https://doi.org/10.1016/j.hal.2018.04.012.
Carpenter, K.D., and Wise, D.R., 2023, Cyanotoxin concentrations in extracts from cyanobacteria colonies, plankton net tows, and solid phase adsorption toxin tracking (SPATT) samplers in western rivers, lakes, and reservoirs, including drinking water sources in the Oregon Cascades—2016–2020: U.S. Geological Survey data release, accessed July 18, 2025, at https://doi.org/10.5066/P96VPGH7.
Chorus, I., and Welker, M., 2021, Toxic cyanobacteria in water—A guide to their public health consequences, monitoring and management (2d ed.): Boca Raton, Fla., CRC Press, 858 p., accessed July 18, 2025, at https://doi.org/10.1201/9781003081449.
Christensen, V.G., and Khan, E., 2020, Freshwater neurotoxins and concerns for human, animal, and ecosystem health—A review of anatoxin-a and saxitoxin: Science of the Total Environment, v. 736, 17 p., accessed February 9, 2026, at https://doi.org/10.1016/j.scitotenv.2020.139515.
Clonan, K.R., Wu, M., Heckathorn, H., Desko, H.A., Ernst, E., Reilly, P., Schuster, B., Newby, R., Hurley, A.C., and Rossi, A., 2026, Downstream persistence of cyanobacteria in New Jersey's Raritan River Basin: Heliyon, v. 12, no. 1, 14 p. [Also available at https://doi.org/10.1016/j.heliyon.2025.e44230.]
Foster, G.M., Graham, J.L., Bergamaschi, B.A., Carpenter, K.D., Downing, B.D., Pellerin, B.A., Rounds, S.A., and Saraceno, J.F., 2022, Field techniques for the determination of algal pigment fluorescence in environmental waters—Principles and guidelines for instrument and sensor selection, operation, quality assurance, and data reporting: U.S. Geological Survey Techniques and Methods, book 1, chap. D10, 34 p., accessed July 18, 2025, at https://doi.org/10.3133/tm1D10.
Francy, D.S., Graham, J.L., Stelzer, E.A., Ecker, C.D., Brady, A.M.G., Struffolino, P., and Loftin, K.A., 2015, Water quality, cyanobacteria, and environmental factors and their relations to microcystin concentrations for use in predictive models at Ohio Lake Erie and inland lake recreational sites, 2013–14: U.S. Geological Survey Scientific Investigations Report 2015–5120, 58 p. [Also available at https://doi.org/10.3133/sir20155120.]
Gifford, S.R., St. Amand, A., Graham, J.L., Foster, G.M., Sauve, C., Clark, D., and Schroeder-Larkins, H., 2024, Comparison of imaging flow cytometry and microscopy for freshwater algal bloom detection: Lake and Reservoir Management, v. 40, no. 3, p. 221–235, accessed July 18, 2025, at https://doi.org/10.1080/10402381.2024.2370828.
Gold Standard Diagnostics, 2025, Microcystin-ADDA SAES ELISA kit, detailed procedure: Warminster, Pa., Gold Standard Diagnostics, 2 p., accessed September 15, 2025, at https://www.goldstandarddiagnostics.com/pub/media/productattachments/files/m/i/microcystins_nodularins-adda-saes-flowchart-520011saes.pdf.
Graham, J.L., Dubrovsky, N.M., Foster, G.M., King, L.R., Loftin, K.A., Rosen, B.H., and Stelzer, E.A., 2020, Cyanotoxin occurrence in large rivers of the United States: Inland Waters, v. 10, no. 1, p. 109–117, accessed July 18, 2025, at https://doi.org/10.1080/20442041.2019.1700749.
Graham, J.L., Loftin, K.A., Ziegler, A.C., and Meyer, M.T., 2008, Chapter A7.5, cyanobacteria in lakes and reservoirs—Toxin and taste-and-odor sampling guidelines: U.S. Geological Survey Techniques of Water-Resources Investigations, book 9, chap. A7.5, accessed July 18, 2025, at https://doi.org/10.3133/twri09A7.5.
Graham, J.L., Ziegler, A.C., Loving, B.L., and Loftin, K.A., 2012, Fate and transport of cyanobacteria and associated toxins and taste-and-odor compounds from upstream reservoir releases in the Kansas River, Kansas, September and October 2011: U.S. Geological Survey Scientific Investigations Report 2012–5129, 65 p., accessed September 15, 2025, at https://doi.org/10.3133/sir20125129.
Howard, M.D.A., Kudela, R.M., Hayashi, K., Tatters, A.O., Caron, D.A., Theroux, S., Oehrle, S., Roethler, M., Donovan, A., Loftin, K., and Laughrey, Z., 2021, Multiple co-occurring and persistently detected cyanotoxins and associated cyanobacteria in adjacent California lakes: Toxicon, v. 192, p. 1–14, accessed February 2, 2026, at https://doi.org/10.1016/j.toxicon.2020.12.019.
Hsu, T.-T.D., Acosta Caraballo, Y., and Wu, M., 2024, An investigation of cyanobacteria, cyanotoxins and environmental variables in selected drinking water treatment plants in New Jersey: Heliyon, v. 10, no. 11, 17 p., accessed September 15, 2025, at https://doi.org/10.1016/j.heliyon.2024.e31350.
Jaegge, A.C., Bouma-Gregson, K., Byl, T.D., Carpenter, K.D., Christensen, V.G., Gorney, R.M., Graham, J.L., Heckathorn, H.A., Olds, H.T., Reilly, P.A., Rosen, J.J., and Stouder, M.D., 2026, Opportunities and challenges in using solid phase adsorption toxin tracking (SPATT) samplers for monitoring cyanotoxins in freshwater and estuarine environments: U.S. Geological Survey Scientific Investigations Report 2025–5093, 39 p., accessed September 15, 2025, at https://doi.org/10.3133.sir20255093.
Jarvie, H.P., Worrall, F., Burt, T.P., and Howden, N.J.K., 2025, A 150-year river water quality record shows reductions in phosphorus loads but not in algal growth potential: Communications Earth & Environment, v. 6, no. 62, 9 p., accessed February 9, 2026, at https://doi.org/10.1038/s43247-024-01978-4.
Johnston, B.D., Stouder, M.D.W., Gorney, R.M., Rosen, J.J., Carpenter, K.D., Wei, B., and Boyer, G.L., 2025, Evaluation of passive samplers for cyanotoxin detection by immunoassay and chromatographic-mass spectrometry: U.S. Geological Survey Scientific Investigations Report 2025–5046, 37 p., accessed August 1, 2025, at https://doi.org/10.3133/sir20255046.
Kudela, R.M., 2011, Characterization and deployment of solid phase adsorption toxin tracking (SPATT) resin for monitoring of microcystins in fresh and saltwater: Harmful Algae, v. 11, p. 117–125, August 1, 2025, at https://doi.org/10.1016/j.hal.2011.08.006.
Lane, J.Q., Roddam, C.M., Langlois, G.W., and Kudela, R.M., 2010, Application of solid phase adsorption toxin tracking (SPATT) for field detection of the hydrophilic phycotoxins domoic acid and saxitoxin in coastal California: Limnology and Oceanography—Methods, v. 8, no. 11, p. 645–660, accessed July 18, 2025, at https://doi.org/10.4319/lom.2010.8.0645.
Linz, D.M., Sienkiewicz, N., Struewing, I., Stelzer, E.A., Graham, J.L., and Lu, J., 2023, Metagenomic mapping of cyanobacteria and potential cyanotoxin producing taxa in large rivers of the United States: Scientific Reports, v. 13, no. 2806, 13 p., accessed February 9, 2026, at https://doi.org/10.1038/s41598-023-29037-6.
Miller, T.R., Beversdorf, L.J., Weirich, C.A., and Bartlett, S.L., 2017, Cyanobacterial toxins of the laurentian Great Lakes, their toxicological effects, and numerical limits in drinking water: Marine Drugs, v. 15, no. 6, 51 p., accessed August 1, 2025, at https://doi.org/10.3390/md15060160.
Moy, N.J., Dodson, J., Tassone, S.J., Bukaveckas, P.A., and Bulluck, L.P., 2016, Biotransport of algal toxins to riparian food webs: Environmental Science & Technology, v. 50, no. 18, p. 10007–10014, accessed August 1, 2025, at https://doi.org/10.1021/acs.est.6b02760.
Negrey, K., Howard, M., Smith, J., Kudela, R., and Caron, D., 2019, Standard operating procedure for solid phase adsorption toxin testing (SPATT) assemblage and extraction of HAB toxins: Protocols.io website, accessed February 9, 2026, at dx.doi.org/10.17504/protocols.io.dm6gpb255lzp/v1.
New Jersey Department of Environmental Protection, 2022, 2021 cyanobacterial harmful algal bloom (HAB)—Freshwater recreational response strategy: New Jersey Department of Environmental Protection, 95 p., accessed July 18, 2025, at https://dep.nj.gov/wp-content/uploads/hab/hab2021strategyfinal.pdf.
New Jersey Department of Environmental Protection, 2024, Public notification guidance for cyanotoxins in finished water: New Jersey Department of Environmental Protection, 2 p., accessed July 18, 2025, at https://www.nj.gov/dep/watersupply/pdf/public-notification-guidance-for-cyanotoxins-in-finished-water.pdf.
New Jersey Department of Environmental Protection, 2025. Places to fish—Ponds, lakes, and reservoirs: New Jersey Department of Environmental Protection website, accessed July 18, 2025, at https://dep.nj.gov/njfw/fishing/freshwater/places-to-fish-ponds-lakes-reservoirs/.
New Jersey Department of Environmental Protection Bureau of GIS, 2021, 11 digit hydrologic unit code delineations for New Jersey: New Jersey Department of Environmental Protection Bureau of GIS database, accessed February 24, 2026, at https://gisdata-njdep.opendata.arcgis.com/datasets/02599a9424254a4ea33e689941559e3c_17/explore?location=40.262924%2C-74.838910%2C9.
New Jersey Water Supply Authority, 2005, Raritan Basin water supply system safe yield evaluation and operation model: New Jersey Water Supply Authority, 47 p., 3 app., accessed July 18, 2025, at https://www.njwsa.org/uploads/1/0/8/0/108064771/raritan_basin_riverware_model.pdf.
Oakton Instruments and Eutech Instruments Pte Ltd., 2006, Instruction manual TN-100/T-100 portable turbidimeter: Oakton Instruments and Eutech Instruments Pte Ltd., 26 p., accessed September 17, 2025, at https://pim-resources.coleparmer.com/instruction-manual/35635-00.pdf.
O’Dell, J.W., 1993, Method 350.1—Determination of ammonia nitrogen by semi-automated colorimetry—Revision 2.0: U.S. Environmental Protection Agency Office of Research and Development, 15 p., accessed July 18, 2025, at https://www.epa.gov/sites/default/files/2015-06/documents/epa-350.1.pdf.
O’Neil, J.M., Davis, T.W., Burford, M.A., and Gobler, C.J., 2012, The rise of harmful cyanobacteria blooms—The potential roles of eutrophication and climate change: Harmful Algae, v. 14, p. 313–334, accessed February 9, 2026, at https://doi.org/10.1016/j.hal.2011.10.027.
Otten, T.G., Crosswell, J.R., Mackey, S., and Dreher, T.W., 2015, Application of molecular tools for microbial source tracking and public health risk assessment of a Microcystis bloom traversing 300km of the Klamath River: Harmful Algae, v. 46, p. 71–81, accessed February 9, 2026, at https://doi.org/10.1016/j.hal.2015.05.007.
Paerl, H.W., and Huisman, J., 2008, Blooms like it hot: Science, v. 320, no. 5872, p. 57–58, accessed February 9, 2026, at https://doi.org/10.1126/science.1155398.
Paerl, H.W., and Otten, T.G., 2013, Harmful cyanobacterial blooms—Causes, consequences, and controls: Microbial Ecology, v. 65, p. 995–1010, accessed August 1, 2025, at https://doi.org/10.1007/s00248-012-0159-y.
Patiño, R., Christensen, V.G., Graham, J.L., Rogosch, J.S., and Rosen, B.H., 2023, Toxic algae in inland waters of the conterminous United States—A review and synthesis: Water, v. 15, no. 2808, 40 p., accessed February 9, 2026, at https://doi.org/10.3390/w15152808.
Patton, C.J., and Kryskalla, J.R., 2003, Methods of analysis by the U.S. Geological Survey National Water Quality Laboratory—Evaluation of alkaline persulfate digestion as an alternative to Kjeldahl digestion for determination of total and dissolved nitrogen and phosphorus in water: U.S. Geological Survey Water-Resources Investigations Report 03–4174, 33 p., accessed February 9, 2026, at https://pubs.usgs.gov/wri/2003/4174/report.pdf.
PhycoTech, 2018, General technical approach: PhycoTech, Inc. accessed July 18, 2025, at https://www.phycotech.com/Portals/0/PDFs/GenTech.pdf.
Rasmussen, P.P., Gray, J.R., Glysson, G.D., and Ziegler, A.C., 2009, Guidelines and procedures for computing time-series suspended-sediment concentrations and loads from in-stream turbidity-sensor and streamflow data: U.S. Geological Survey Techniques and Methods, book 3, chap. C4, 52 p., accessed January 22, 2026, at https://doi.org/10.3133/tm3C4.
Reinl, K.L., Brookes, J.D., Carey, C.C., Harris, T.D., Ibelings, B.W., Morales-Williams, A.M., De Senerpont Domis, L.N., Atkins, K.S., Isles, P.D.F., Mesman, J.P., North, R.L., Rudstam, L.G., Stelzer, J.A.A., Venkiteswaran, J.J., Yokota, K., and Zhan, Q., 2021, Cyanobacterial blooms in oligotrophic lakes—Shifting the high-nutrient paradigm: Freshwater Biology, v. 66, no. 9, p. 1846–1859, accessed February 2, 2026, at https://doi.org/10.1111/fwb.13791.
Reinl, K.L., Harris, T.D., North, R.L., Almela, P., Berger, S.A., Bizic, M., Burnet, S.H., Grossart, H.-P., Ibelings, B.W., Jakobsson, E., Knoll, L.B., Lafrancois, B.M., McElarney, Y., Morales-Williams, A.M., Obertegger, U., Ogashawara, I., Paule-Mercado, M.C., Peierls, B.L., Rusak, J.A., Sarkar, S., Sharma, S., Trout-Haney, J.V., Urrutia-Cordero, P., Venkiteswaran, J.J., Wain, D.J., Warner, K., Weyhenmeyer, G.A., and Yokota, K., 2023, Blooms also like it cold: Limnology and Oceanography Letters, v. 8, no. 4, p. 546–564, accessed February 2, 2026, at https://doi.org/10.1002/lol2.10316.
Reiser, R.G., 2004, Evaluation of streamflow, water quality, and permitted and nonpermitted loads and yields in the Raritan River Basin, New Jersey, water years 1991–98: U.S. Geological Survey Water-Resources Investigations Report 03–4207, 64 p., accessed January 22, 2026, at https://pubs.usgs.gov/wri/wri03-4207/pdf/WRIR03-4207.pdf.
Sabart, M., Crenn, K., Perrière, F., Abila, A., Leremboure, M., Colombet, J., Jousse, C., and Latour, D., 2015, Co-occurrence of microcystin and anatoxin-a in the freshwater lake Aydat (France)—Analytical and molecular approaches during a three-year survey: Harmful Algae, v. 48, p. 12–20, accessed February 2, 2026, at https://doi.org/10.1016/j.hal.2015.06.007.
Sauer, V.B., and Turnipseed, D.P., 2010, Stage measurement at gaging stations: U.S. Geological Survey Techniques and Methods, book 3, chap. A7, 45 p., accessed July 18, 2025, at https://doi.org/10.3133/tm3A7.
Schmadel, N.M., Harvey, J.W., Choi, J., Stackpoole, S.M., Graham, J.L., and Murphy, J.C., 2024, River control points for algal productivity revealed by transport analysis: Geophysical Research Letters, v. 51, no. 5, 9 p., accessed February 2, 2026, at https://doi.org/10.1029/2023GL105137.
Stackpoole, S.M., Zwart, J.A., Graham, J.L., Harvey, J.W., Schmadel, N.M., and Murphy, J.C., 2024, Evaluation of metrics and thresholds for use in national-scale river harmful algal bloom assessments: Ecological Indicators, v. 162, 15 p., accessed February 9, 2026, at https://doi.org/10.1016/j.ecolind.2024.111970.
Stelzer, E.A., Loftin, K.A., and Struffolino, P., 2013, Relations between DNA- and RNA-based molecular methods for cyanobacteria and microcystin concentration at Maumee Bay State Park Lakeside Beach, Oregon, Ohio, 2012: U.S. Geological Survey Scientific Investigations Report 2013–5189, 9 p., accessed January 22, 2026, at https://doi.org/10.3133/sir20135189.
Stouder, M.D.W., Boyer, G., Carpenter, K.D., D’Angelo, E., Gorney, R.M., and Rosen, J.J., 2024, Cyanotoxin concentrations in extracts from solid phase adsorption toxin tracking (SPATT) and diffusive gradients in thin-films (DGT) samplers in Owasco Lake, Seneca Lake, and Skaneateles Lake, Finger Lakes Region, New York, 2019: U.S. Geological Survey data release, accessed February 2, 2026, at https://doi.org/10.5066/P9OZR89E.
Treviño, J., Gorney, R.M., Clonan, K., Heckathorn, H.A., Spitz, F., and Feinson, L., 2025, Cyanobacteria, other water-quality, and discharge data collected from the Raritan River Basin, New Jersey, August 2020 through August 2021: U.S. Geological Survey data release, https://doi.org/10.5066/P1S5DQ6A.
Turnipseed, D.P., and Sauer, V.B., 2010, Discharge measurements at gaging stations: U.S. Geological Survey Techniques and Methods, book 3, chap. A8, 87 p., accessed July 18, 2025, at https://pubs.usgs.gov/tm/tm3-a8/.
U.S. Environmental Protection Agency, 2015a, Drinking water health advisory for the cyanobacterial microcystin toxins: U.S. Environmental Protection Agency Office of Water, 67 p., accessed December 3, 2025, at https://www.epa.gov/sites/default/files/2019-05/documents/hh-rec-criteria-habs-document-2019.pdf.
U.S. Environmental Protection Agency, 2015b, Method 545—Determination of cylindrospermopsin and anatoxin-a in drinking water by liquid chromatography electrospray ionization tandem mass spectrometry (LC/ESI–MS/MS): U.S. Environmental Protection Agency webpage, accessed July 18, 2025, at https://www.epa.gov/esam/method-545-determination-cylindrospermopsin-and-anatoxin-drinking-water-liquid-chromatography.
U.S. Environmental Protection Agency, 2019, Recommended human health recreational ambient water quality criteria or swimming advisories for microcystins and cylindrospermopsin: U.S. Environmental Protection Agency Office of Water, 2 p., accessed July 18, 2025, at https://www.epa.gov/sites/default/files/2019-05/documents/hh-rec-criteria-habs-factsheet-2019.pdf.
U.S. Geological Survey, 2024, USGS water data for the Nation: U.S. Geological Survey National Water Information System database, accessed February 9, 2026, at https://doi.org/10.5066/F7P55KJN.
Wagner, R.J., Boulger, R.W., Jr., Oblinger, C.J., and Smith, B.A., 2006, Guidelines and standard procedures for continuous water-quality monitors—Station operation, record computation, and data reporting: U.S. Geological Survey Techniques and Methods, book 1, chap. D3, [variously paged], accessed July 18, 2025, at https://pubs.usgs.gov/tm/2006/tm1D3/pdf/TM1D3.pdf
Wilde, F.D., 2008, Chapter A6—Field measurements: U.S. Geological Survey Techniques of Water-Resources Investigations, book 9, chap. A6, p. 9, accessed July 18, 2025, at https://doi.org/10.3133/twri09A6.
Wood, S.A., Kelly, L., Bouma-Gregson, K., Humbert, J.F., Laughinghouse, H.D., IV, Lazorchak, J., McAllister, T., McQueen, A., Pokrzywinski, K., Puddick, J., Quiblier, C., Reitz, L.A., Ryan, K., Vadeboncoeur, Y., Zastepa, A., and Davis, T.W., 2020, Toxic benthic freshwater cyanobacterial proliferations—Challenges and solutions for enhancing knowledge and improving monitoring and mitigation: Freshwater Biology, v. 65, no. 10, p. 1824–1842, accessed July 18, 2025, at https://doi.org/10.1111/fwb.13532.
Zaffiro, A., Rosenblum, L., and Wendelken, S.C., 2016, Method 546—Determination of total microcystins and nodularins in drinking water and ambient water by adda enzyme-linked immunosorbent assay: U.S. Environmental Protection Agency Office of Water, 21 p., accessed July 18, 2025, at https://www.epa.gov/sites/default/files/2016-09/documents/method-546-determination-total-microcystins-nodularins-drinking-water-ambient-water-adda-enz yme-linked-immunosorbent-assay.pdf.
Zhang, J.-Z., Ortner, P.B., and Fischer, C.J., 1997, Method 353.4—Determination of nitrate and nitrite in estuarine and coastal waters by gas segmented continuous flow colorimetric analysis: Environmental Protection Agency Office of Water, 20 p., accessed July 18, 2025, at https://nepis.epa.gov/Exe/ZyPURL.cgi?Dockey=P100PDOG.txt.
Zimmermann, C.F., Keefe, C.W., and Arar, E.J., ed., 1997, Method 365.5—Determination of orthophosphate in estuarine and coastal waters by automated colorimetric analysis: U.S. Environmental Protection Agency National Exposure Research Laboratory, 9 p., accessed February 2, 2026, at https://cfpub.epa.gov/si/si_public_file_download.cfm?p_download_id=525247.
Zuellig, R.E., Graham, J.L., Stelzer, E.A., Loftin, K.A., and Rosen, B.H., 2021, Cyanobacteria, cyanotoxin synthetase gene, and cyanotoxin occurrence among selected large river sites of the conterminous United States, 2017–18: U.S. Geological Survey Scientific Investigations Report 2021–5121, 22 p., accessed July 18, 2025, at https://doi.org/10.3133/sir20215121.
Conversion Factors
U.S. customary units to International System of Units
International System of Units to U.S. customary units
Temperature in degrees Celsius (°C) may be converted to degrees Fahrenheit (°F) as follows:
°F = (1.8 × °C) + 32
Temperature in degrees Fahrenheit (°F) may be converted to degrees Celsius (°C) as follows:
°C = (°F – 32) / 1.8.
Supplemental Information
Concentrations of chemical constituents in water are given in either milligrams per liter (mg/L) or micrograms per liter (µg/L).
Abbreviations
AVLD
absolute value logarithmic difference
cyanoHAB
cyanobacteria harmful algal bloom
DNA
deoxyribonucleic acid
ELISA
enzyme-linked immunosorbent assay
EPA
U.S. Environmental Protection Agency
HAB
harmful algal bloom
LC-MS/MS
liquid chromatography with tandem mass spectrometry
MDL
method detection limit
MRL
method reporting limit
mRNA
messenger ribonucleic acid
NJCWST
New Jersey Center for Water Science and Technology
NJDEP
New Jersey Department of Environmental Protection
NWIS
National Water Information System
NJWSA
New Jersey Water Supply Authority
qPCR
quantitative polymerase chain reaction
RPD
relative percent difference
RNA
ribonucleic acid
rRNA
ribosomal ribonucleic acid
SPATT
solid phase adsorption toxin tracking
USGS
U.S. Geological Survey
For more information about this report, contact:
Director, New Jersey Water Science Center
U.S. Geological Survey
3450 Princeton Pike, Suite 110
Lawrenceville, New Jersey 08648
Or visit our website at
https://www.usgs.gov/centers/new-jersey-water-science-center
Publishing support provided by the Baltimore Publishing Service Center
Disclaimers
Any use of trade, firm, or product names is for descriptive purposes only and does not imply endorsement by the U.S. Government.
Although this information product, for the most part, is in the public domain, it also may contain copyrighted materials as noted in the text. Permission to reproduce copyrighted items must be secured from the copyright owner.
Suggested Citation
Gorney, R.M., Heckathorn, H.A., Clonan, K.R., Reilly, P.A., Cahalane, K., and Bjorklund, B.W., 2026, Occurrence of cyanobacteria and associated cyanotoxins in the Raritan Basin Water Supply Complex, New Jersey, August 2020 to August 2021: U.S. Geological Survey Scientific Investigations Report 2026–5128, 30 p., https://doi.org/10.3133/sir20265128.
ISSN: 2328-0328 (online)
Study Area
| Publication type | Report |
|---|---|
| Publication Subtype | USGS Numbered Series |
| Title | Occurrence of cyanobacteria and associated cyanotoxins in the Raritan Basin Water Supply Complex, New Jersey, August 2020 to August 2021 |
| Series title | Scientific Investigations Report |
| Series number | 2026-5128 |
| DOI | 10.3133/sir20265128 |
| Publication Date | April 10, 2026 |
| Year Published | 2026 |
| Language | English |
| Publisher | U.S. Geological Survey |
| Publisher location | Reston, VA |
| Contributing office(s) | New Jersey Water Science Center |
| Description | Report, ix, 30 p.; Data Release |
| Country | United States |
| State | New Jersey |
| Other Geospatial | Raritan Basin Water Supply Complex |
| Online Only (Y/N) | Y |