

Long Term Resource Monitoring Procedures—Aquatic Vegetation Monitoring
Links
- Document: Report (4.0 MB pdf) , HTML , XML
- Figure: Printable versions of figures 2.1 and 7.1
- Companion File: Pocket guide (2.05 MB pdf) - Pocket guide for Long Term Resource Monitoring procedures—Aquatic vegetation monitoring
- Download citation as: RIS | Dublin Core
Acknowledgments
This report was developed with funding provided by the Upper Mississippi River Restoration Program, administered by the U.S. Army Corps of Engineers in cooperation with the U.S. Geological Survey and state partners. We thank Yao Yin, Jennifer Winkelman, and Heidi Langrehr for their work on Long Term Resource Monitoring element report 95–P002–7, which serves as the first version this report.
We thank the many people involved with the Upper Mississippi River Restoration Program Long Term Resource Monitoring element over the past few decades. Their passion and expertise have created a unique and valuable long-term dataset on aquatic plant communities in the Upper Mississippi River System. We appreciate the detailed reviews by J. Sauer, J. Houser, D. Michl, P. Skawinski, B. Schlifer, R. Erickson, B. Gray, and C. Olson, which improved this manual and ensured quality of the vegetation data collected by the Long-Term Resource Monitoring element.
Preface
The Long Term Resource Monitoring element of the U.S. Army Corps of Engineers’ Upper Mississippi River Restoration Program, formerly known as the Environmental Management Program, was authorized under the Water Resources Development Act of 1986 (Public Law 99–662, 100 Stat. 4082). The Long Term Resource Monitoring element is implemented by the U.S. Geological Survey Upper Midwest Environmental Sciences Center in cooperation with the five Upper Mississippi River System States of Illinois, Iowa, Minnesota, Missouri, and Wisconsin. The U.S. Army Corps of Engineers provides guidance and has overall program responsibility, and the U.S. Geological Survey and its partnering States have responsibilities for collecting, analyzing, and disseminating data. The mode of operation and respective roles of the agencies are outlined in a 1988 Memorandum of Agreement.
The Upper Mississippi River System encompasses the commercially navigable reaches of the Upper Mississippi River, the Illinois River and navigable parts of the Kaskaskia, Black, St. Croix, and Minnesota Rivers. Congress declared the Upper Mississippi River System to be both a nationally significant ecosystem and a nationally significant commercial navigation system. The mission of the Long Term Resource Monitoring element is to provide decision makers and river managers with information for maintaining the Upper Mississippi River System as a sustainable large river ecosystem given its multiple-use character. The goals of the Long Term Resource Monitoring element are to understand the large river ecosystem, determine resource status and trends, model ecosystem responses to environmental and management drivers, develop management alternatives, manage information, and develop useful products that support the Upper Mississippi River Restoration Program and management.
Abstract
This standard operating procedure (SOP) manual describes the collection of standardized, long-term data for aquatic vegetation communities in selected study pools of the Upper Mississippi River System in the United States. The primary intent of the data collection is to assess the status and trends that aid in understanding the unique river ecosystem and to guide large-scale ecological restoration of the river and its biological communities, like aquatic plants and their dependent wildlife. This SOP is an update to the version published in 2000 and reflects modifications to sample sizes and additions of new data collection procedures. All long-term monitoring programs and their SOPs must be adapted to changing conditions and be improved through learning, and this SOP clarifies procedures and adds new elements since the initial SOP was written more than 25 years ago. The SOP is intended for multiple audiences, including vegetation specialists through the Upper Mississippi River Restoration Program, data analysts using the publicly available data generated through this SOP, and natural resource managers and restoration practitioners who need data and science to guide some decisions. This SOP may be transferable and adaptable to other ecosystems when the aquatic plant community is the focus.
Monitoring Aquatic Vegetation
This standard operating procedure (SOP) manual describes the collection of standardized, long-term data for aquatic vegetation in selected study pools of the Upper Mississippi River System. The primary intent of collecting the long-term aquatic vegetation data is to assess the status and trends that aid in understanding the unique ecosystem of the Upper Mississippi River System (Houser, 2022; Larson and others, 2022) and to guide large-scale ecological restoration of the river and its aquatic plant communities (Bouska and others, 2018; De Jager and others, 2018; McCain and others, 2018; Larson and others, 2023).
The core Long Term Resource Monitoring (LTRM) aquatic vegetation component consists of multiple staff. The LTRM aquatic vegetation component leader and the LTRM database manager are traditionally employed by and stationed at the U.S. Geological Survey Upper Midwest Environmental Sciences Center. The aquatic vegetation specialists (AVS) are employed by State agencies and housed at their respective field stations year-round, and each AVS monitors the same assigned study pool each year. Each component member’s roles and responsibilities are noted throughout this SOP. Annually, the component has a field calibration meeting on the river to review the SOP, ensure consistency of estimates of areal cover and rake scores, and begin training for LTRM aquatic vegetation assistants (if any). The AVS further train and supervise the assistants throughout the summer field season. The AVS and assistants actively assess the vegetation community and agree on the data values entered.
This SOP is an updated version of the first version of the SOP written by Lubinski and Rasmussen (1988), Rasmussen and Wlosinski (1988), and Yin and others (2000). This SOP update reflects the changes that have been made since the first version, which include modifications to sample sizes and additions of new data collection procedures (for example, plant abundance scoring, herbarium collections, and more). All major changes between the first version (Yin and others, 2000) and this report are described in appendix 6. All long-term monitoring programs and their SOPs must be adapted to changing conditions and improved through learning, and this SOP is an opportunity to clarify procedures and add new elements since the initial SOP was written more than 25 years ago. This report does not contain information from obsolete LTRM aquatic vegetation sampling methods, such as transects sampling designs or photograph interpretation as reported by Rogers and Owens (1995).
The SOP is intended for multiple audiences. First, this SOP serves as a detailed guide for AVS to consistently collect long-term data in the study pools. We include explanations of the basic study design and data collection processes so that data analysts can properly use and interpret the LTRM aquatic plant community dataset. Finally, the SOP may be transferable and adaptable to non-LTRM projects when the aquatic plant community is the focus.
Study Area, Sampling Frame, and the Stratified Random Sampling Design
Study area.—The Upper Mississippi River System Basin covers 500,000 square kilometers in North America (fig. 1A, B). The main stem of the Upper Mississippi River has 29 locks and dams, which have been operating since installations around the 1930s. The locks and dams divide the river into 29 navigation pools that allow barge traffic on the main channel throughout the ice-free seasons but do not control flooding. Each pool consists of a mosaic of aquatic habitat types that can support macrophytes, including main channel borders, side channels, backwater floodplain lakes, and open impoundments above the dams (Wilcox, 1993).
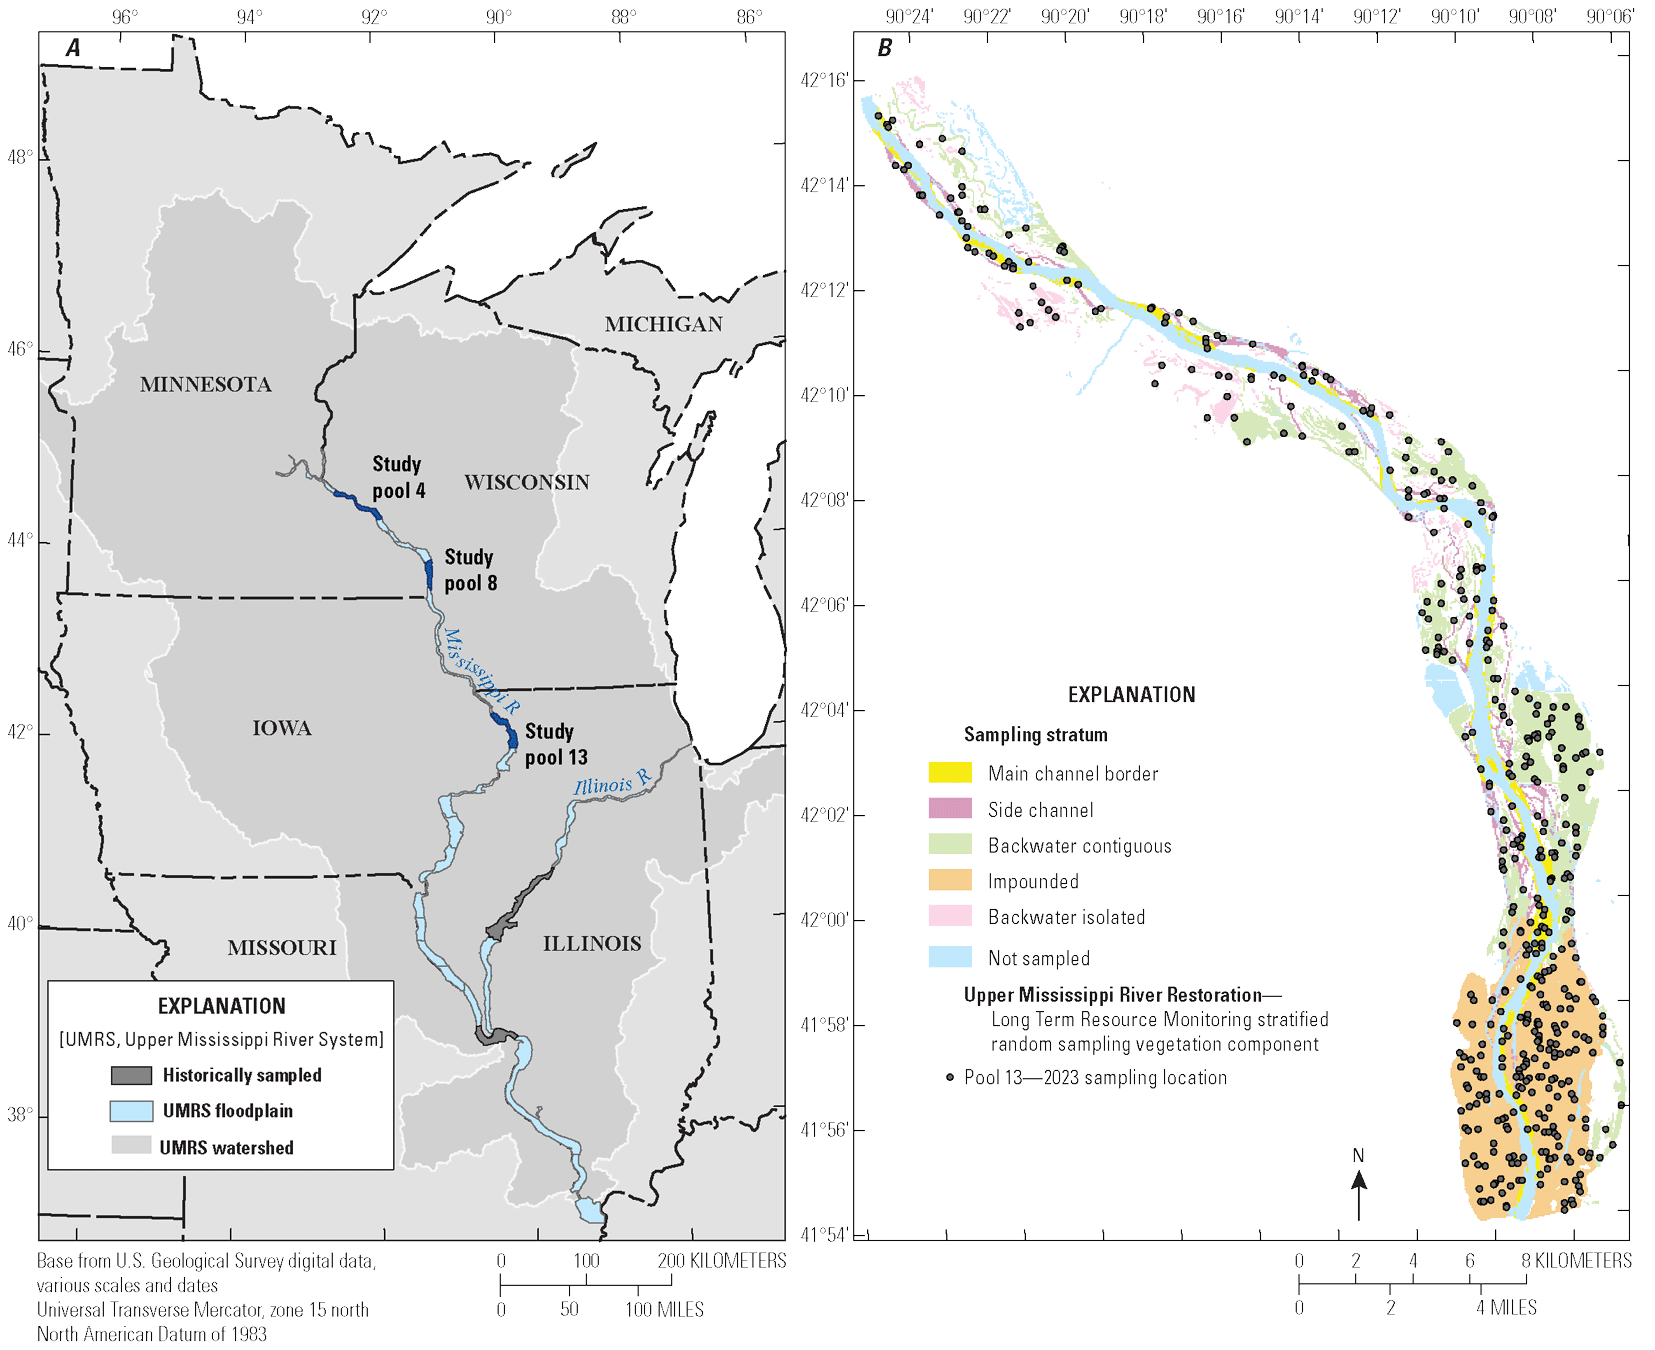
Maps showing (A) the Upper Mississippi River System Basin and the Long Term Resource Monitoring element’s main study pools for aquatic plants, historical study pools, and the main stems of the Mississippi River and Illinois River and (B) an example from pool 13 showing the stratified random sampling design used for aquatic plant collection through the Upper Mississippi River Restoration’s Long Term Resource Monitoring element.
The first SOP (Yin and others, 2000) targeted pools 4, 8, 13, and 26 of the Upper Mississippi River and the La Grange Pool of the Illinois River. These study pools were consistent with the other LTRM monitoring components of fish (Ratcliff and others, 2014) and water quality (Soballe and Fischer, 2004), except the other LTRM elements included a sixth study reach named Open River. After 2004, pool 26 and the La Grange Pool were dropped from routine aquatic vegetation sampling because of insufficient plant presence in the first 6 years of monitoring. Since 1998, LTRM aquatic vegetation monitoring has been done annually in study pools 4, 8, and 13 using the first published version of the SOP by Yin and others (2000).
Sampling frame and sampling units.—Sampling frames were designed for each study pool based on flat pool condition (that is, the lowest controlled pool elevation; Rogala, 1999) in 1997 (before the first field campaign in 1998). The sampling frame represents a square grid laid over the inundated areas as defined from aerial photography in 1997 and restricted to a predicted water depth of less than 2.5 meters (m) at flat pool condition. Grid cells are 50 m by 50 m. The main navigation channel and deepwater areas (greater than [>] 2.5 m deep at flat pool condition) are excluded from the sampling frame because of the difficulty and uncertainty of sampling submersed aquatic vegetation (SAV) at these depths with established sampling gear. The areas near the navigation dams (650 feet above and 200 feet below) and an unexploded ordnance zone (strata code UXO) in pool 13 are excluded from the sampling frame for safety. The sampling frame in each pool has been fixed since 1997 and has not been changed among sampling years. The sampling frame best reflects fully aquatic plant species (described in app. 1, table 1.1) given that inundated areas were intentionally selected for the sampling frame, but occasionally, wetland facultative species and communities, as described in Dieck and others (2015), are captured in sampling.
Sampling units are selected annually from the frame without replacement. This means that all sampling units are available for random selection in subsequent years. sampling units are rarely sampled in multiple years, except by chance (an exception is that sampling units in pool 8 were repeatedly sampled from 2001 to 2004 in the base monitoring site selection to address specific research questions). Occasionally, sampling units are selected from the sampling frame but are inaccessible because of safety concerns or lack of access permits for privately owned sites, and guidance for completing the fields on the aquatic vegetation stratified random sampling data sheet (app. 2, fig. 2.1) for those units is in the “Common Situations” section; such units are treated as missing at random.
Stratified random sampling design.—Aquatic vegetation sampling uses a stratified random sampling design. The strata and actual sampling sites for measuring aquatic vegetation are drawn from the sampling frame and sampling units. The sampling sites are the physical location of plant community sampling on the river. The sampling sites target the centroid of the sampling unit on the map; however, boat drift and Global Positioning System (GPS) inaccuracy allow for the sampling site to be plus or minus (±) 10 m from the sampling unit centroid.
The LTRM data are collected using a stratified random sampling design to permit appropriate inferences at the stratum and pool levels for common plant metrics, like prevalence and relative abundance (common metric calculations are provided in app. 5). The randomly selected sampling sites are nested within strata, and strata are hierarchically nested within study pools (fig. 1A, B). The sampling design was modified prior to resampling in 1999 by splitting each of the strata in pool 4 into lower and upper pool strata. Stratum definitions have remained constant since 1999.
Each stratum is given a discrete sampling effort (table 1, app. 4, table 4.1). Each stratum represents a major aquatic geomorphic feature in the Upper Mississippi River System, like those described in Wilcox (1993). The differences in sampling effort among strata reflect the relative amount of the geomorphic features within each pool. The five primary strata sampled for aquatic vegetation are included in the pool-level calculations (app. 5): main channel borders, side channels, contiguous backwater lakes, impoundments, and isolated backwaters. Pool 4 has a unique stratum named tributary delta lake (Lake Pepin) and does not contain an impounded stratum. The sampling sites are annually chosen at random from the fixed sampling frame and units. Each site is further divided into six subsampling areas for raking SAV, as shown in figure 2. First, we sample a ring of about 2 m around the boat (total area of about 44 square meters [m2]), which includes a visual assessment to note species and the estimates of the areal percentage of cover (ranging from 0 to 100 percent) for emergent, rooted floating, and nonrooted floating-leaved plants. Lastly, we rake for SAV at the six subsampling areas using a double-headed rake, as shown in figure 3A and B, and note all species detected on the rake.
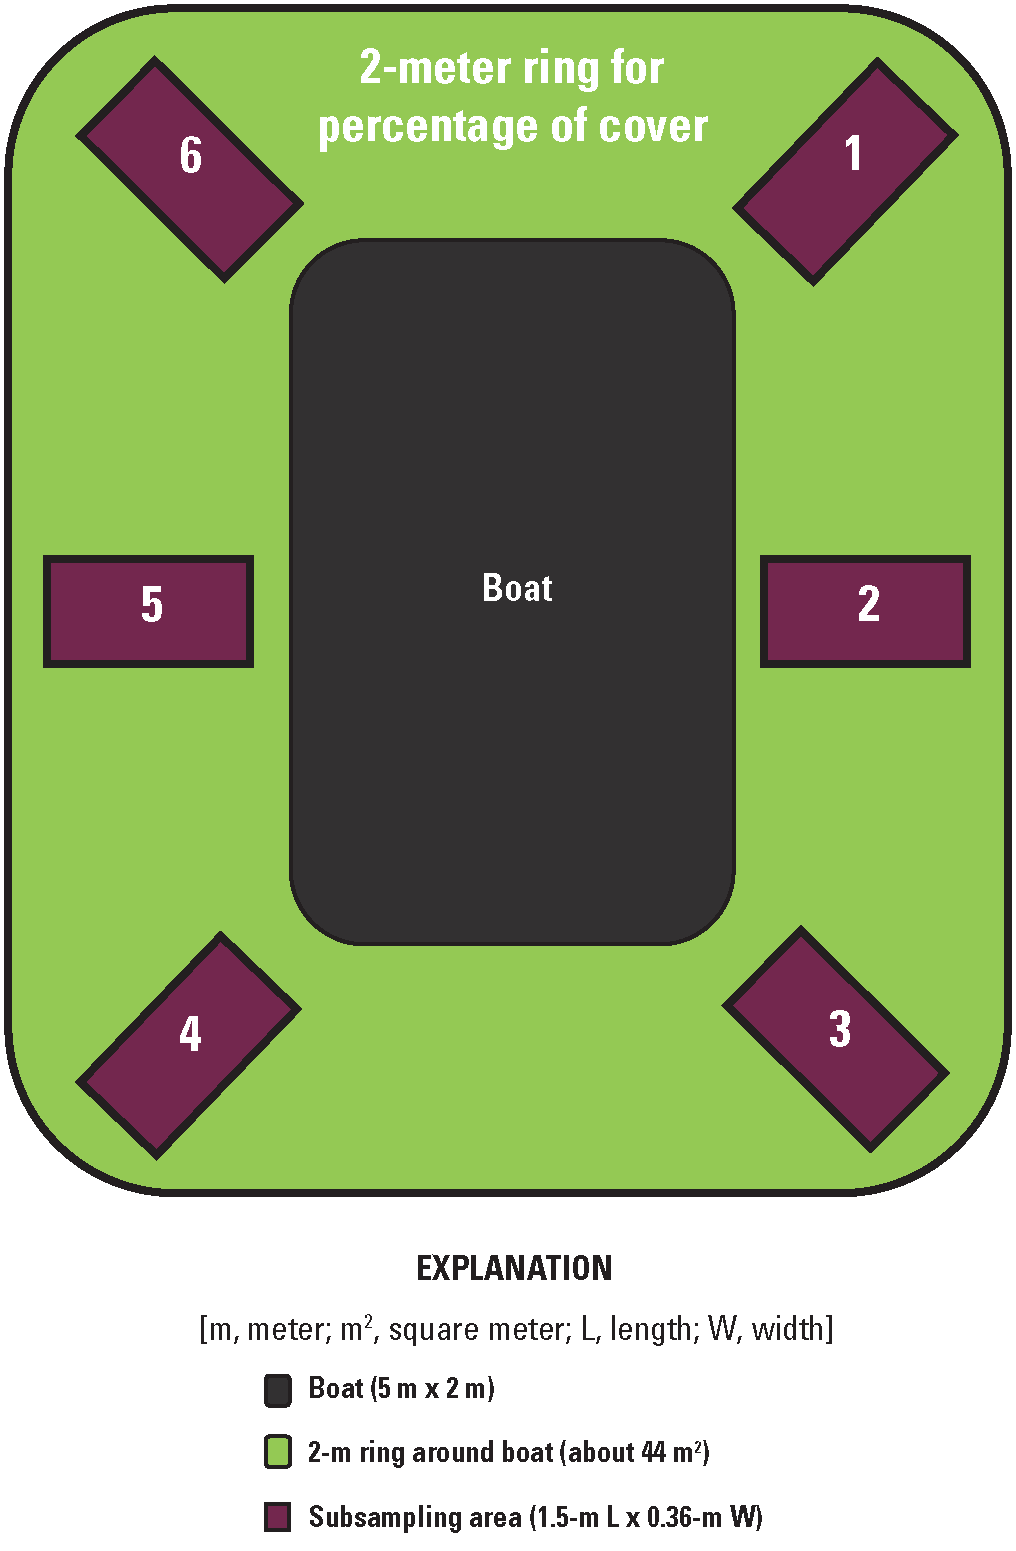
Diagram (not to scale) showing aquatic plant sampling around a boat.
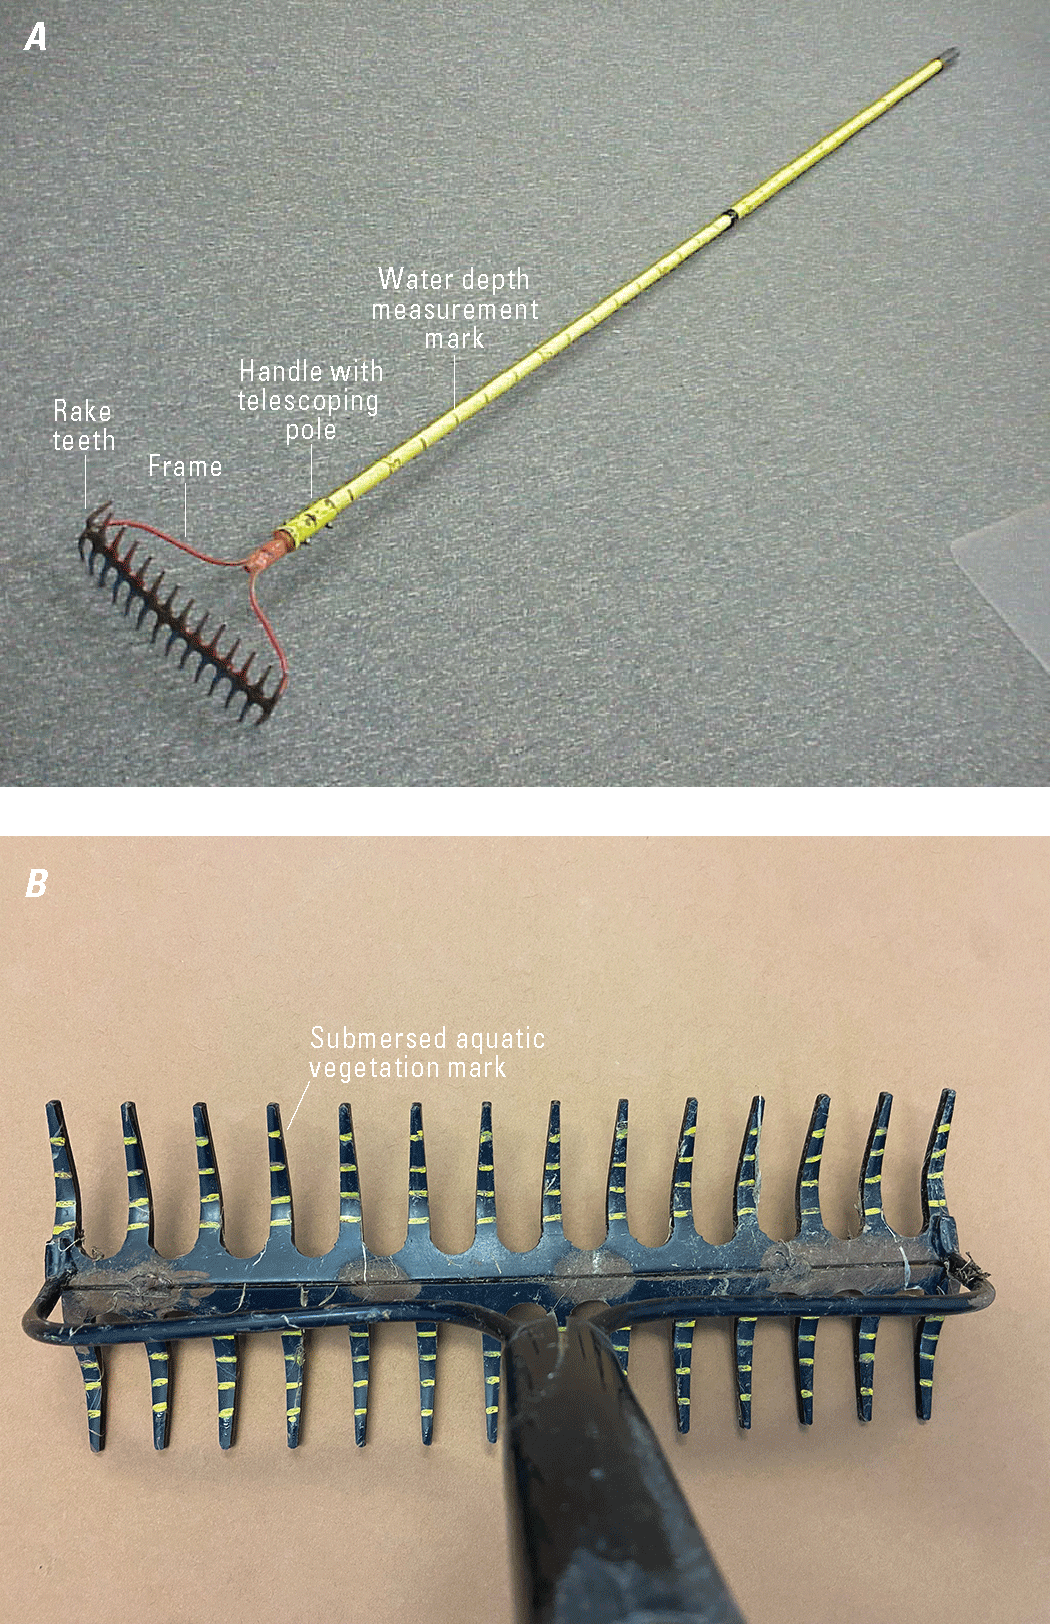
Photographs showing (A) the double-headed aquatic plant rake, including rake teeth, frame, and handle with a telescoping pole and water depth measurement markings along the pole, and (B) a closer view of the double-headed rake with yellow markings to indicate the submersed aquatic vegetation density ratings (refer to table 3).
The LTRM database manager runs analysis scripts that randomly select new sampling sites each year. The GPS coordinates for sampling sites (that is, the sampling unit centroids) are sent to all AVS before the field season for their mapping and logistical sampling plan. The AVS delineate sites before the start of each sampling season into approximate sampling days based on proximity and appropriate vessel type and attempt to randomize the daily site selection within each study pool to minimize latitudinal sampling bias (like an upstream to downstream sampling order of sites). In addition, wind and water levels dictate when certain areas can be safely and efficiently sampled; for example, impounded strata cannot be sampled on windy days, and upper parts of the pools are often sampled in the early season to have sufficient water to access via boat.
Table 1.
Annual sample sizes for each key study pool (pools 4, 8, and 13 of the Upper Mississippi River) since 2005 according to stratum. Aquatic vegetation data are collected according to a stratified random sampling design.[--, no sampling in the pool/stratum combination]
Sampling Effort and Schedule
In each study pool, 450 sites are randomly selected annually. Sampling is done between June 15 and August 15 to obtain the highest species richness detection probabilities. The AVS attempt to sample all 450 sites, but a few sites may be inaccessible or unsafe to sample and are noted in the database as NOSMPL with the reason sampling was not completed. If the site is accessible but water depths are >3 m and preclude raking, please refer to the “Common Situations” section.
In the first years of monitoring, the sampling effort ranged from 400 to 650 sites per pool per year as described in Yin and others (2000). After 2005, the number of sites was reduced and consistent at 450 sites per pool to optimize field sampling efforts while obtaining good parameter estimates for pool-level prevalence of species and life forms. The sample sizes by pool and stratum are listed in table 1.
Equipment and Definitions
Most sampling is done from a boat, and the type of boat depends on the habitats and weather conditions for sampling. The LTRM sampling is primarily done using airboats, jon boats, and mud motors, although paddle craft such as canoes or kayaks can be used to access and sample the site. Most boats are 5–6 m long and approximately 2 m wide. The sampling site is considered the 2-m ring extending out from the perimeter of the boat, which is about 44 m2 (fig. 2). Occasionally, sites are sampled on foot, and procedures mimic those of being in a boat to have the same sampling area (44 m2). For sites requiring walk-in access, chest waders are recommended to avoid the mud, insects, and poisonous and prickly plants. Please refer to the “Common Situations” section for details of sampling on foot and (or) walk-in sites.
The sampling rake (fig. 3A, B) is used to estimate SAV species composition and relative abundance. The rake is long handled and double headed, which is modified from the rake used by Jessen and Lound (1962) and Deppe and Lathrop (1992). The rake is 36 centimeters (cm) wide with 14 teeth, each 5 cm long, on each side. The double-headed rake is not commercially available but is made by welding two square-headed garden rakes together. The rake’s telescoping handle is at least 3 m long. The rake handle is marked at 10-cm increments to also measure water depth. The rake teeth are painted with five equidistant horizontal lines to estimate relative plant abundance. SAV biomass can be estimated from rake scores using models developed by Drake and others (2022), which rely on separate density scores for branched and unbranched (that is, Vallisneria americana Michx.) species—refer to step 9 in the “Technique and Recording” section. The rake teeth can also capture substrate for classification of relative particle size.
The LTRM aquatic vegetation component uses a customized Microsoft Access data form and tables for all data entry. However, an equivalent paper data sheet for data collection is available in appendix 2 (fig. 2.1) and can be adapted for other projects. Additional sampling devices, such as a velocity meter and turbidity meter, are noted in the “Optional Measures” section.
Sampling Procedures
The field crew uses an enlarged field map to navigate to the general area of a site and a GPS unit to find the predetermined and randomly selected site. The boat is anchored at each site when the coordinates shown on the GPS unit are within ±10 m of the target location (that is, the centroid of the selected sampling unit). The habitat type of the site at the time of sampling may or may not seem to match the map stratum indicated on the map. Site location should not be altered because of an apparent mismatch in stratum classification or for any other reason. If a site cannot be accessed within 10 m, record the reason in the comments field (refer to the “Common Situations” section).
The plant sampling techniques use a combination of visual examination of species, visual estimation of areal cover (that is, the percentage of surface water that is obscured by vegetation), rake samples, and subsampling to quantify the species composition and relative abundance of all aquatic plant species detected at each site (fig. 2). A detailed study on SAV sampling efficacy was provided by Yin and Kreiling (2011). Each site has six subsampling areas, each of which is a rectangle 1.5 m long (rake drag) and 0.36 m wide (width of the rake head). One subsampling area is off each corner of the boat, and the other two are off the left and right sides (fig. 2). The subsampling areas are numbered from 1 to 6 clockwise starting at the starboard-bow corner of the boat. The exact locations of the six subsampling areas may vary among the types of boats used (for example, canoe or airboat; also refer to the “Common Situations” section).
The data collection sheet (app. 2, fig. 2.1) and computer data collection application are divided into four sections: “Site Information,” “Subsampling Area Information,” “Species Information,” and “Reminder Information.” The “Reminder Information” section contains the choices of data to be entered in the data fields.
The data field names, and their respective options are detailed in this section and explained further in appendix 3. The sampling procedure consists of multiple steps, beginning with recording data in the “Site Information” section of the data sheet. Steps 1–4 are for collecting species information at the site level. Steps 5–12 are for collecting data for the “Subsampling Area Information” and “Species Information” sections of the data sheet, including SAV and water depth at each subsampling area. Steps 13–16 are for completing the remaining fields in the “Site Information” section of the data sheet, such as substrate and second Universal Transverse Mercator (UTM) coordinates.
Default values are set in the data application at the beginning of each field season. Default settings include the UTM zone, UTM method, AVS code, and assistant code. All AVS and assistants are given a unique three-digit code that is generated by the LTRM database manager. Defaults are changed if the AVS or assistant changes during the season.
-
Step 1. After navigating to within 10 m of a site, anchor the boat securely with two anchors. Select the site identifier (listed as site ID; typically, a number between 1 and 450) from the “Select Site Number” dropdown menu. The software automatically assigns a unique barcode to each site. Use a data sheet (app. 2, fig. 2.1) if the Microsoft Access data entry application is not available. Click the “Get 1st coordinates” button and ensure UTM coordinates and GPS accuracy are automatically entered by the connected GPS in the 1st UTM coordinates fields. Record optional measures (refer to the “Optional Measures” section) as appropriate. Record all site information except the number of rows, substrate, detritus, and vegetation type, which will be recorded later. Record the habitat type on the data sheet (in the “Site Information” section).
-
Step 2. Begin a species list. The AVS walk around the boat and call out all aquatic plant species they detect at the site (fig. 2). The other field assistant records all species in the species code data field, thereby adding one new row (record) to the data sheet for each species detected. The vegetation type field(s) are automatically populated according to the species codes recorded at the site.
-
Step 3. Visually estimate the percentage of areal cover, in 10-percent increments, by life forms of nonrooted floating-leaved, rooted floating-leaved, and emergent life forms in the 2-m ring around the site (table 2). Record the estimated cover ratings for life forms in the appropriate cover field. If the nonrooted floating-leaved species are thought to be transient and not permanently at the site (less than 5-percent cover), record the nonrooted floating-leaved species as absent (score=0). When nonrooted floating-leaved species combined at a site are >5 percent of the assessment area, record the appropriate cover value of the life form. Cover ratings are in table 2. Note: Before 2025, percentage of cover was recorded categorically in 20-percent increments.
-
Step 4. Estimate the percentage of areal cover, in 10-percent increments, for each species observed in the 2-m ring of the site and record in the cover field (in the “Species Information” section). Do not estimate for submersed life form species as those are obscured by water clarity and light reflection. The data entry application has a quality assurance check to ensure that a percentage of cover is entered for every life form if a species categorized in that life form was detected. Cover ratings are in table 2. Note: Before 2025, percentage of cover was recorded in 20-percent increments.
-
Step 5. Visually search the first subsampling area for aquatic species. Record the species code in the species code field (if not already added in step 2) and a “1” in the visual field (V on the data sheet) for filamentous algae and all life forms except nonrooted floating-leaved species observed in the subsampling area (in the “Species Information” section of the data sheet). A value of 1 is automatically recorded in the additional species field for every nonrooted floating-leaved species observed (because we are ignoring nonrooted floating-leaved species in the visuals and rakes within the subsampling area). If the subsampling area is land or exposed rock, refer to the “Common Situations” section.
-
Step 6. Extend the rake outward from the boat and lower it to the bottom of the river, thereby placing the rake at the top of the subsampling area. Drag the rake at a consistent speed with gently applied pressure along the bottom toward the boat for 1.5 m.
-
Step 7. Hold the rake handle vertically with the rake head resting on the bottom and read and record the water depth (to the nearest 0.1 m) in the corresponding “Subsampling Area Information” section of the data sheet.
-
Step 8. Twist the rake 180 degrees and pull the rake and vegetation into the boat. Note: Twisting minimizes the loss of plants from the rake teeth but twisting more than 180 degrees may cause the plants to fall off.
-
Step 9. Fold plants hanging on the left and right side of the metal frame over the top of the rake teeth once (refer to fig. 3A and B). If necessary, sweep the rake head through the water to rinse the vegetation of excessive sediment. Rate the total combined amount of SAV and macroalgae like Chara spp. (but exclude filamentous algae) according to table 3 and record this value in the plant density field. Also record the branched density score (that is, all submersed species except for Vallisneria americana Michx.) according to table 3. The branched density score is the same as the plant density score unless Vallisneria americana Michx. and branched species are both present and have unique density scores. Note: In 2019, the protocol changed to include the branched density field; refer to appendix 6 (table 6.1).
-
Step 10. Estimate the plant density for each SAV species and filamentous algae detected in the rake sample. Rate the density according to table 3 and record the density rating in the rake field (R on the data sheet in the “Species Information” section). Record a “1” in the rake field for every rooted floating-leaved and emergent species to indicate that the species was detected in the rake sample. If a species is unknown (not fitting the app. 1, table 1.1, species list), then refer to the “Common Situations” section for collecting vouchers and verifying species identification.
-
Step 11. Repeat steps 5–10 for subsampling areas 2 through 6 (refer to fig. 2 for subsampling areas).
-
Step 12. Examine, by sight and touch, the sediment brought up from the bottom with the rake. Classify the sediment according to table 4 and record in the substrate field (in the “Site Information” section). If plant detritus was detected visually or on any rake, record a “1” in the detritus field. Plant detritus is defined as dead organic plant matter of any size. If mussel or snail shells were detected visually in the substrate, record a “1” in the shells field. Note: The optional shells field was added in 2024.
-
Step 13. Collect or omit any optional measures (refer to “Optional Measures” section) such as turbidity, velocity, or the 31 map classes (details in app. 3).
-
Step 14. At the end of the sampling, but before boat anchors are retrieved, click “Get 2nd coordinates” to record the UTM coordinates in the 2nd UTM coordinates fields.
-
Step 15. Verify all required data have been entered correctly by clicking the quality assurance button (QA in the software). Fix any errors before leaving the site. Data are saved automatically. The AVS back up the local database at least weekly to the field station computer and data cloud resources.
Table 2.
Areal percentage of cover estimates for all species of nonrooted floating-leaved, rooted floating-leaved, and emergent life forms.Table 3.
Relative submersed aquatic vegetation density or relative abundance rating. The rating is determined by examining the markings on the rake teeth and assigning a density rating. The trace rating was added in 2021 to represent plant presence with low biomass (Drake and others, 2022).[SAV, submersed aquatic vegetation]
Table 4.
Substrate types and data entry codes.Common Situations
No SAV.—If no SAV species are detected in a subsampling area, put “NOSAV” in the species code field and a “1” in the rake field(s), but leave the rest of the fields in the “Species Information” section (visual [V on the data sheet], additional species, cover, quality evaluation [QE on the data sheet], and voucher) blank. Put a “0” in the corresponding plant density field (in the “Subsampling Area Information” section). If other life forms are detected at the site, follow steps 1–15 in the “Techniques and Recording” section for the remaining subsampling areas.
Aquatic vegetation of any life form is absent at the site.—If filamentous algae and aquatic vegetation of all life forms are not observed anywhere within the 2-m site ring or in any of the six subsample areas, put a “U” in the VEG U field in the data app or on the data sheet (all other life form fields should be blank). Continue to measure all possible data fields, such as water depth and site information.
Nonaquatic subsampling area.— Leave the habitat quality assurance (habitat QA on the data sheet) field empty/blank if the subsampling has some water depth and is aquatic. If a subsampling area is on land or exposed rock, put a “T” in the habitat quality assurance field and “0” in the water depth and plant density fields. Land is defined as dry during most of the growing season and lacking wetland obligate plant species (refer to app. 1, table 1.1). Refer to the “No SAV” subsection for recording species information.
Nonaquatic site.—If a site is on an island or dewatered floodplain, put “LND” in the habitat type field, a “U” in the correct life form field, and “0” in all three cover fields (in the “Site Information” section). Refer to the “Nonaquatic subsampling area” subsection for recording subsampling area information. Refer to the “No SAV” subsection for guidance in recording species information. Treat temporarily dewatered aquatic sites the same as regular aquatic sites but put “0” for the water depth.
Inaccessible sites.—If a site cannot be accessed, put “NOSMPL” in the species code field and “1” in each of the six rake fields. Leave the rest of the fields in the “Subsampling Area Information” and “Species Information” sections blank. Record the UTM coordinates of the boat stop location and the reason for not sampling in the comments field.
Unable to rake.—If safety conditions (for example, blue-green algal blooms or wing dams) or physical conditions such as depth (>3 m) and current velocity preclude raking the river bottom for SAV, put “NORAKE” in the species code field and “1” in each of the rake fields that were not raked. Note: The “NORAKE” option was implemented in 2024. Record the reason for not raking in the comments field. Do not code the site as “NOSMPL” when the site was accessible but not raked (for example, during a high-water sampling event) because this can affect prevalence calculations in appendix 5. Rather, collect as much data as safely possible for the site but use “NORAKE” in the species code field if accurate SAV subsampling is not possible.
Species identification is uncertain.—If a species code is available in the master species list (table 1.1 in app. 1), leave the quality evaluation field blank. If an existing species code is not available in table 1.1 in appendix 1, assign a quality evaluation code (table 5) in the quality evaluation field to flag an unknown species. Voucher specimens should be collected for any species that is not in the field station herbarium and when the identity is uncertain and has the quality evaluation flag from table 5. When a voucher is collected for a species, record a “1” (not sent for identification but retained at a field station) or a “2” (sent for external identification) in the voucher field (app. 3). If no voucher is collected, leave the voucher field blank.
Table 5.
Species identification coding upon collection. For species with a quality evaluation other than blank, a voucher must be collected and processed according to instructions outlined in the “Voucher and Herbarium Specimens” section.Walk-in procedures.—If a site must be sampled on foot (or paddle craft), navigate to the site using a handheld GPS. Complete the sampling as if from a full-sized boat when determining the sampling area around a hypothetical boat and the placement of the six subsampling areas. If overly dense wetland vegetation or other circumstances preclude effective, straight-line raking (for example, tree species, debris, and so on), place a “1” in the visual and rake fields for all species within the subsampling area. Additionally, if the subsampling area is land or exposed rock, refer to the information in the “Nonaquatic subsampling area” subsection. If the water depth is >0 m, follow steps 1–14 of the “Techniques and Recording” section, as appropriate. Label the site as “sampled on foot” or “paddle craft” in the vessel type field.
Optional Measures
Several additional metrics may be collected at sites as deemed relevant by the field crew. Commonly recorded metrics at sites include surface velocity and turbidity because of their known association with aquatic plant communities (Larson and others, 2023) and the likelihood that they directly drive species composition and overall suitability for aquatic vegetation.
Measurement of velocity should follow the methods described in the LTRM water quality procedures manual (Soballe and Fischer, 2004). Velocity measurements can be recorded at sites with depths >0.2 m. Velocity measurements should be made using an electromagnetic device following established manufacturer protocols. The sensor should be 20 cm below the surface of the water and oriented in a way that maximizes the observed velocity. Directional measurements of velocity are not necessary.
Measurements of turbidity will also follow the methods established in the LTRM water quality procedures manual (Soballe and Fischer, 2004). Measurements should be made using the nephelometric method (in nephelometric turbidity units; American Public Health Association, 1992). The water should be sampled before raking vegetation to avoid disturbing the sediment and potentially biasing the turbidity sample. Turbidity sampling depths should follow the same depth restrictions as established for velocity (that is, sampled when water depth is >20 cm).
Land cover classifications can be defined by physical characteristics and plant communities at each sampling location. Land cover is classified according to the 31 map classes (app. 3) in the General Wetland Vegetation Classification System (Dieck and others, 2015). We record a separate data field called habitat type, which is the AVS interpretations of the habitat type during the sampling event.
Taxonomy and Species Codes
The AVS are trained to recognize the nearly 70 species (app. 1, table 1.1). Some wetland-obligate species detected in shallow marsh perennial and wet meadow plant communities as described in Dieck and others (2015) are omitted because those species are not typically detected in the LTRM sampling frame. However, the 31 map classes field includes an option to collect wetland plant community information.
This SOP targets aquatic vegetation for multiple life forms. All species are categorized in the life type field (app. 3) according to options of either submergent (S), rooted floating leaved (F), nonrooted floating leaved (N), emergent (E), filamentous algae (A), or unvegetated (U). The nonrooted floating-leaved category consists of Spirodela, Wolffia, Lemnaceae, and Azolla spp. Filamentous algae are not speciated.
Whenever possible, identify aquatic plants to the species level using the following taxonomic keys: Fassett (1957), Winterringer and Lopinot (1966), Voss (1972, 1985), Crow and Hellquist (1982, 1983, 1985), Hellquist and Crow (1980, 1982, 1984), Gleason and Cronquist (1991), and Skawinski (2019). Most aquatic species detected are listed in table 1.1 in appendix 1. Species codes not available in table 1.1 are available in the U.S. Department of Agriculture (USDA) PLANTS Database (https://plants.usda.gov/). Our LTRM database retains the USDA coding convention from taxonomy of the early 1990s when LTRM started; however, the newest species codes and taxonomy can always be cross-referenced by searching these original USDA species codes in table 1.1.
If the genus of a plant is known and the species is unknown, create a new code with the first four letters of the genus name and a question mark inserted between the second and third letters; for example, “PO?TA” for Potamogeton spp. and “MY?RI” for Myriophyllum spp. Also note the quality evaluation code (table 5) for the uncertainty of identification. If the genus is unknown, create a unique code (for example, “UNKN01,” “UNKN02,” and so on) for each unknown taxon. Collect two or more voucher specimens for each uncertainly identified or unknown aquatic plant for follow-up identification in the office or by external taxonomists (refer to procedures in the “Voucher and Herbarium Specimens” section). Upon positive identification, uncertain and unknown species codes will be confirmed or replaced with new codes. Do not create species codes or collect vouchers for terrestrial plant species, like those detected on dewatered islands. The AVS are obligated to confirm every new species code with the LTRM aquatic vegetation component leader.
Voucher and Herbarium Specimens
The AVS should collect at least one voucher specimen in the following scenarios:
-
1. Being uncertain about an aquatic species identification.
-
2. Detecting a new species, rare species, or one that is underrepresented in our existing collection. Underrepresented aquatic species include the following:
-
3. Detecting a notable, morphological variation within a species.
-
4. Detecting a species in a new study pool or that represents a substantial range extension.
-
1. Enter the appropriate status in the voucher and quality evaluation fields.
-
2. Collect two whole specimens where possible when uncertain about species identification or if the sample represents a novel species or location for the Upper Mississippi River System.
-
3. Retain the entire structure as much as possible (including roots, leaves, and flowers).
-
4. Contain loose seeds or fruiting bodies in a glassine envelope.
-
5. Initially place the aquatic specimens in sealable plastic bags.
-
6. Label the bags using the label template in appendix 7 (fig. 7.1).
-
7. Keep specimens out of direct sunlight and cool until they are brought to the field station.
-
8. Press and dry specimens on the same day as collected. If same-day pressing and drying are not possible, most submersed species can be adequately stored for several days in a sealed plastic bag with water if kept in the refrigerator; exceptions include Charophytes, which should be pressed within 24 hours of collection because they degrade quickly.
-
9. Ship the pressed and dried specimens and their labels to the Bell Museum at the University of Minnesota in St. Paul, Minnesota.
All herbarium specimens are permanently preserved and archived at the Bell Museum Herbarium at the University of Minnesota using their SOP. Some voucher specimens are retained at the respective field stations of the AVS for training and outreach education.
Quality Assurance and Quality Control
The data are backed up locally on the field laptops during the sampling season each time the application is closed or manually saved. The AVS move data frequently from their field collection applications to a cloud-based server at their field stations as backup. At the end of the sampling season, the AVS review all data to make sure all required data fields were filled out and data values make logical sense. The data are then exported into comma-separated value (or .csv) files via the data collection application and sent to the LTRM database manager. The LTRM database manager loads the data into temporary data tables in the LTRM relational database. Quality assurance scripts are then run against the data to identify logical inconsistencies, missing required fields, and invalid values for specific fields. Lists of all records that were flagged with the reason(s) for flagging are compiled into a list and sent to the respective AVS who reviews and either states why the record is correct as is or makes corrections to the data if an error is identified. After all quality assurance warnings have been resolved, the data are sent to the LTRM aquatic vegetation component leader for a final check of the annual data. The data are then moved from the temporary database tables to the LTRM publicly available data tables and download page (https://umesc.usgs.gov/data_library/vegetation/srs/veg_srs_1_query.shtml). A script is then run to generate summarized statistics for the sampling year’s data, which are used in the various LTRM vegetation web applications (https://umesc.usgs.gov/data_library/vegetation/graphical/veg_front.html).
Summary
This standard operating procedure (SOP) manual includes descriptions of the processes used to collect standardized, long-term data for aquatic vegetation communities in selected study pools of the Upper Mississippi River System in the United States, but the processes could be transferable to any shallow aquatic ecosystems that can support aquatic macrophytes. The data collection is primarily intended to assess the status and trends that aid in understanding the unique river ecosystem and to guide large-scale ecological restoration of the river and its biological communities, like aquatic plants and their dependent wildlife. This SOP is an update to the version written in 2000 and reflects modifications to sample sizes and additions of new data collection procedures. All long-term monitoring programs and their SOPs must be adapted to changing conditions and be improved through learning, and this SOP clarifies procedures and adds new elements since the initial SOP was written more than 25 years ago. The SOP is intended for multiple audiences, including vegetation specialists through the Upper Mississippi River Restoration Program, data analysts using the publicly available data generated through this SOP, and natural resource managers and restoration practitioners who need data and science to guide some decisions. This SOP may be transferable and adaptable to other ecosystems when the aquatic plant community is the focus.
We provide detailed steps for the standardized data collection specifically for the Upper Mississippi River Restoration Program’s Long Term Resource Monitoring element, which supports ecological understanding and large-scale restoration decisions on this large floodplain river. The appendixes include details such as a species list, printable data sheets, common data computations, and a summary of the major changes since the first version of this report, published in 2000.
References Cited
Bouska, K.L., Houser, J.N., De Jager, N.R., and Hendrickson, J., 2018, Developing a shared understanding of the Upper Mississippi River—The foundation of an ecological resilience assessment: Ecology and Society, v. 23, no. 2, 19 p. [Also available at https://doi.org/10.5751/ES-10014-230206.]
De Jager, N.R., Rogala, J.T., Rohweder, J.J., Van Appledorn, M., Bouska, K.L., Houser, J.N., and Jankowski, K.J., 2018, Indicators of ecosystem structure and function for the Upper Mississippi River System: U.S. Geological Survey Open-File Report 2018–1143, 115 p., including 4 appendixes. [Also available athttps://doi.org/10.3133/ofr20181143.]
Dieck, J.J., Ruhser, J., Hoy, E.E., and Robinson, L.R., 2015, General classification handbook for floodplain vegetation in large river systems: U.S. Geological Survey Techniques and Methods, book 2, chap. A1, 51 p. [Also available at https://doi.org/10.3133/tm2A1.]
Drake, D.C., Lund, E.M., and Kreiling, R.M., 2022, Annual summer submersed macrophyte standing stocks estimated from long-term monitoring data in the Upper Mississippi River: Journal of Fish and Wildlife Management, v. 13, no. 1, p. 205–222. [Also available at https://doi.org/10.3996/JFWM-21-063.]
Houser, J.N., ed., 2022, Ecological status and trends of the Upper Mississippi and Illinois Rivers (ver. 1.1, July 2022): U.S. Geological Survey Open-File Report 2022–1039, 199 p. [Also available at https://doi.org/10.3133/ofr20221039.]
Larson, D.M., Carhart, A.M., and Lund, E.M., 2023, Aquatic vegetation types identified during early and late phases of vegetation recovery in the Upper Mississippi River: Ecosphere, v. 14, no. 3, article e4468, 20 p. [Also available at https://doi.org/10.1002/ecs2.4468.]
Larson, D.M., Lund, E., Carhart, A., Drake, D., Houser, J., Bales, K., Bouska, K., De Jager, N., and Giblin, S., 2022, Aquatic vegetation, chap. F of Houser, J., ed., Status and trends of the Upper Mississippi and Illinois Rivers: U.S. Geological Survey Open-File Report 2022–1039, p. 111–133. [Also available at https://doi.org/10.3133/ofr20221039.]
Lubinski, K.S., and Rasmussen, J.L., 1988, Procedures manual of the Long Term Resource Monitoring program for the Upper Mississippi River System: Onalaska, Wis., U.S. Fish and Wildlife Service, Environmental Management Technical Center, EMTC 88–03, 216 p. [Also available at https://umesc.usgs.gov/reports_publications/ltrmp_rep_list.html#1988.]
Rogala, J.T., 1999, Bathymetry, chap. 2 of Methodologies employed for bathymetric mapping and sediment characterization as part of the Upper Mississippi River System Navigation Feasibility Study: prepared for the U.S. Army Engineer District, Rock Island, U.S. Army Engineer District, St. Louis, and U.S. Army Engineer District, St. Paul, p. 3–17.
Soballe, D.M., and Fischer, J.R., 2004, Long Term Resource Monitoring Program procedures—Water quality monitoring: La Crosse, Wis., U.S. Geological Survey, Upper Midwest Environmental Sciences Center, Technical Report LTRMP 2004–T002–1, 73 p. plus appendixes. [Also available at https://umesc.usgs.gov/reports_publications/ltrmp_rep_list.html#2004.]
Yin, Y., and Kreiling, R.M., 2011, The evaluation of a rake method to quantify submersed vegetation in the Upper Mississippi River: Hydrobiologia, v. 675, no. 1, p. 187–195. [Also available at https://doi.org/10.1007/s10750-011-0817-y.]
Appendix 1. Species List
Table 1.1.
Aquatic macrophyte species detected throughout the Upper Mississippi River. We list 71 aquatic macrophyte species over the period of record (1998–2024) in pools 4, 8, and 13 of the Upper Mississippi River. Species are listed in order from most commonly detected to least commonly detected as of 2024.[Species codes are from U.S. Department of Agriculture Natural Resources Conservation Service (2025), taxonomic authority is from ITIS Organization (2024), and species data are from U.S. Geological Survey (2010). USDA, U.S. Department of Agriculture; S, submersed; OBL, obligate wetland; N, nonrooted floating leaved; A, filamentous algae; F, rooted floating leaved; NN/I, not native/invasive; E, emersed; FACW, facultative wetland; * indicates that the genus Ranunculus was previously parsed into two species, R. longirostris and R. tricophyllus but collapsed into one species as of 2023 according to the ITIS Organization]
References Cited
ITIS Organization, 2024, ITIS—Integrated Taxonomic Information System: ITIS Organization database, accessed December 12, 2024, at https://www.itis.gov/.
U.S. Department of Agriculture Natural Resources Conservation Service, 2025, PLANTS database: Natural Resources Conservation Service digital data, accessed April 30, 2025, at https://plants.usda.gov.
U.S. Geological Survey, 2010, Vegetation Stratified Random Sampling Database Browser: U.S. Geological Survey database, accessed May 31, 2024, at https://umesc.usgs.gov/data_library/vegetation/srs/veg_srs_1_query.shtml.
Appendix 2. Data Sheet
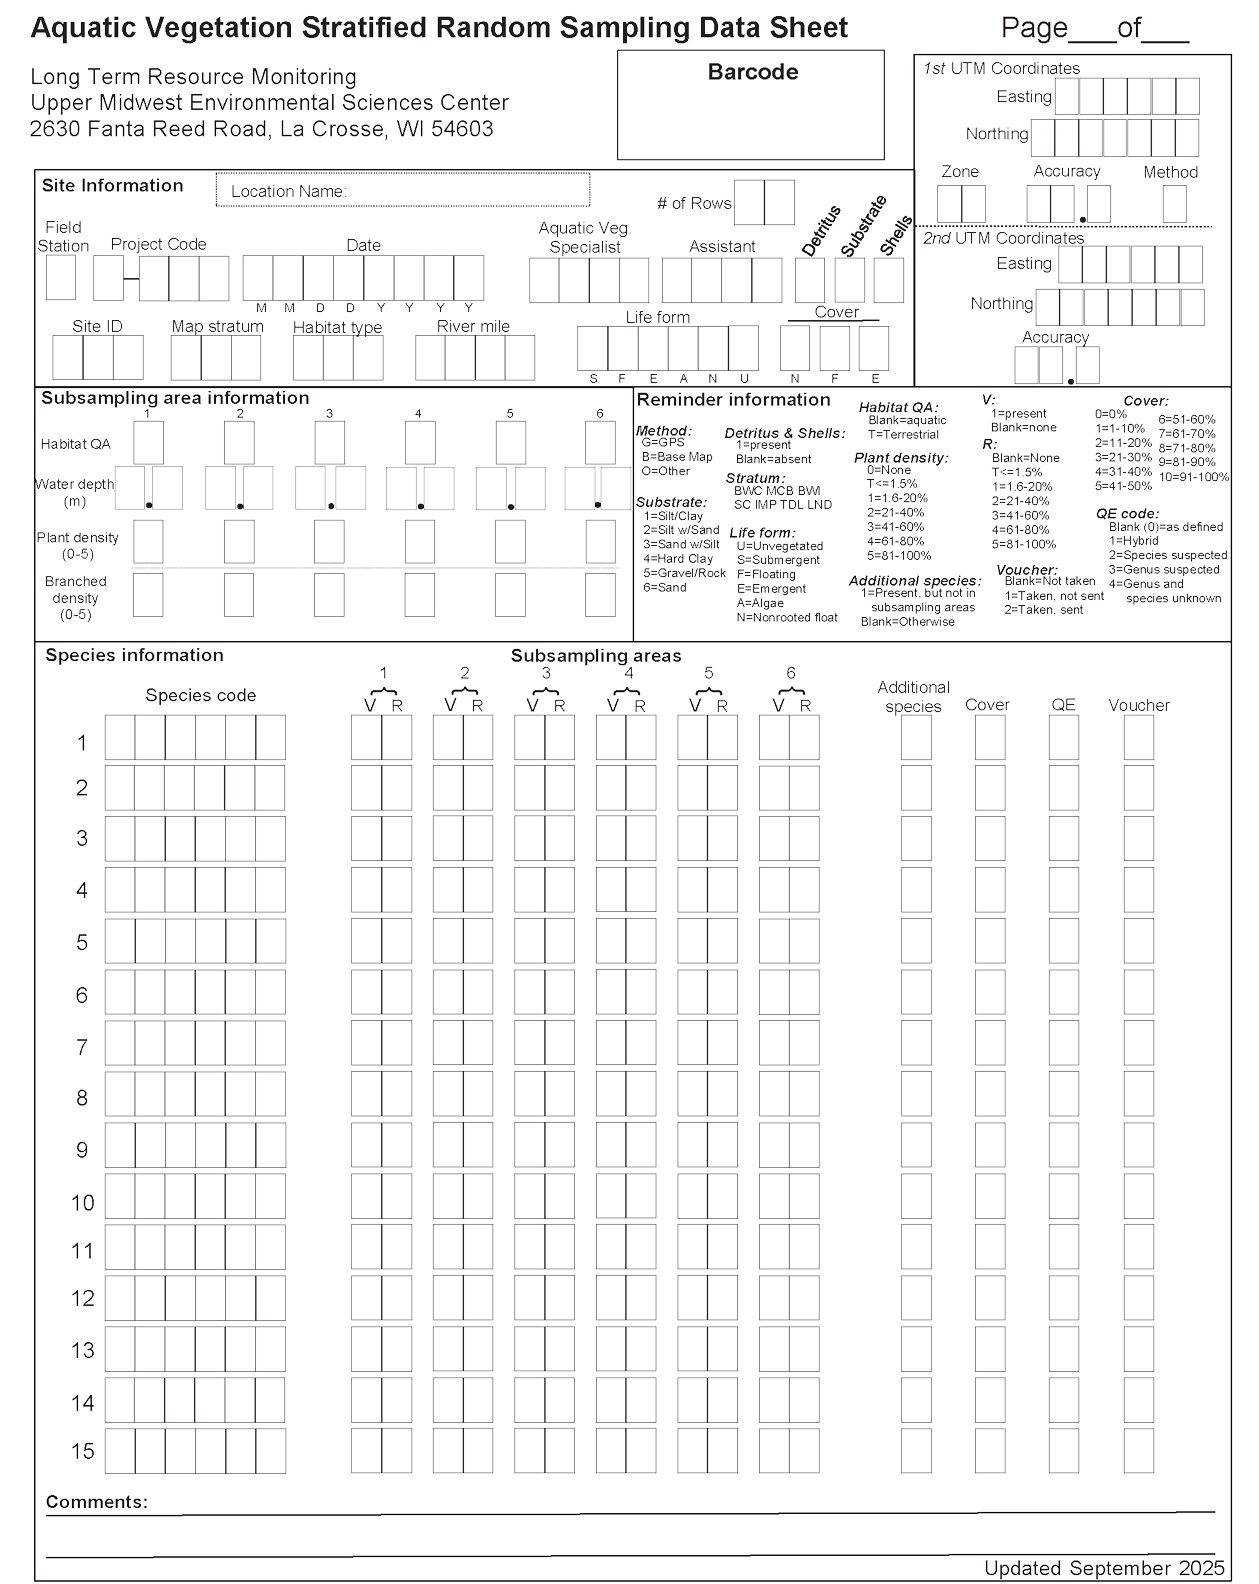
Aquatic vegetation stratified random sampling data sheet. [#, number; veg., vegetation; ID, identifier; UTM, Universal Transverse Mercator; QA, quality assurance; m, meter; V, presence or absence of a species; R, rake; QE, quality evaluation. Stratum options include BWC, backwater contiguous lake; MCB, main channel border; BWI, backwater isolated lake; SC, side channel tributary; IMP, impounded area; TDL, tributary Delta Lake (that is, Lake Pepin); LND, land]
Appendix 3. Explanations of Field Options
-
• Barcode—Each data sheet requires a barcode number. The barcode uniquely identifies each sheet. In the data application, barcodes are automatically generated for each site.
-
• Location name—This information is not entered into the official LTRM database; the field applies to special projects only (not the stratified random sampling in LTRM).
-
• # of rows—The total number of detail records (rows) in the “Species Information” section of the data sheet that contain data.
-
• Field station—The number assigned to each field station within the LTRM.
-
• Project code—The project code is M-98A (which identifies that the project is part of the LTRM). Additional project codes may be generated for special use projects outside of the LTRM.
-
• Date—The month, day, and year (in MMDDYYYY format) during which a site was sampled. All boxes must be filled, so zeros should be entered if a site was not sampled.
-
• Aquatic veg. specialist code—A number that uniquely identifies the aquatic vegetation specialist responsible for certifying that the samples and the data on the form were collected in compliance with current LTRM procedures and are, to the best of their knowledge, complete and free of errors. This code underscores the importance of LTRM methods and is one of the chain-of-custody procedures.
-
• Assistant—A number that uniquely identifies the individual assisting the aquatic vegetation specialist.
-
• Detritus—A “1” is used to identify the presence of coarse, dead aquatic plant organic material in the sediment on one or more rakes or anywhere at the site. The default is a blank space indicating no detritus present.
-
• Substrate—A qualitative code that is assigned to substrate type after tactile and visual examination of sediment at the six subsampling areas. Substrate is rated on a scale of 1–6 according to table 4.
-
• Shells—A “1” is used to identify the presence of invertebrate shells in the sediment on one or more rakes or anywhere at the site. The default is a blank space indicating no shells present.
-
• Site ID—A three-digit number assigned to uniquely identify each site. Accuracy of the site identifier (or ID) is critical because it links field data to be collected with data already available in the database (such as Universal Transverse Mercator [UTM] coordinates and map stratum).
-
• Map stratum—The habitat stratum of the site according to the aquatic area stratum geographic information system coverage. The letter codes are listed in table 1.
-
• Habitat type—Record habitat type using this coding system:
-
• River mile—An alphanumeric code that approximates the location of the site in reference to the navigation river miles used by the U.S. Army Corps of Engineers. A prefix “M” indicates the Mississippi River, and an “I” indicates the Illinois River. Round down to the nearest whole number.
-
• Life form—This letter code is used to identify each type of life form detected at a site. Nelumbo and Ludwigia spp. are considered rooted floating-leaved species. Chara and Nitella are considered submersed species (app. 1, table 1.1).
-
• Cover—This field is used to record the type and percentage of areal cover for each life form.
-
□ N = The percentage of areal cover of all nonrooted floating-leaved species combined at the site (a 2-meter- [m-] wide ring) using the cover ratings described in table 2 in the main report.
-
□ F = The percentage of areal cover of all rooted floating-leaved species combined at the site (a 2-m-wide ring) using the cover ratings.
-
□ E = The percentage of areal cover of all emergent species combined at the site (a 2-m-wide ring) using the cover ratings.
-
-
• Percent (Areal) Cover Ratings are as follows:
-
• 1st UTM coordinates—This information is recorded when the AVS is anchored at the site.
-
□ Easting—The UTM easting coordinate for the site. The coordinate is recorded from the Global Positioning System (GPS) unit when the AVS first arrives at the site.
-
□ Northing—The UTM northing coordinate for the site. The coordinate is recorded from the GPS unit when the AVS first arrives at the site.
-
□ Zone—The number that identifies the correct grid from which the UTM coordinates were taken. All the coordinates provided by the U.S. Geological Survey Upper Midwest Environmental Sciences Center are zone 15 readings, even though part of the La Grange Pool is zone 16.
-
□ Accuracy—The GPS measure of possible error related to the geometry of satellites. This number value is recorded when the UTM coordinates are recorded. The method field indicates whether the scale is percentage dilution of precision (PDOP) or figure of merit (FOM).
-
□ Method—A code that identifies the method used to locate the site and the type of accuracy measurement used by the equipment.
-
-
• 2nd UTM coordinates—This information is recorded after samples are taken and before leaving the site.
-
□ Easting—The UTM easting coordinate for the site. The coordinate is recorded from the GPS unit after sampling is complete, before leaving the site.
-
□ Northing—The UTM northing coordinate for the site. The coordinate is recorded from the GPS unit after sampling is complete, before leaving the site.
-
□ Accuracy—The GPS measure of possible error related to the geometry of satellites. This number value is recorded when the UTM coordinates are recorded. The method field indicates whether the scale is PDOP or FOM.
-
-
• Water depth—The depth of each subsampling area recorded to a tenth of a meter.
-
• Plant density—A rating assigned to the total amount of submersed aquatic vegetation retrieved on a rake drag (table 3 in the main report). The 0–5 rating scale is based on the percentage of the rake teeth covered (in 20-percent increments) by submersed plants and macroalgae. Plant density is recorded separately for the six subsampling areas.
-
• Branched density—A rating assigned to the total amount of submersed aquatic vegetation with a branching morphology that is retrieved on a rake drag. Branching species typically include all submersed species except for Vallisneria americana Michx. The branched density score is the same as the plant density score unless Vallisneria americana Michx. and branched species are both present and have unique density scores. The 0–5 rating scale is based on the percentage of the rake teeth covered (in 20-percent increments) by submersed, branching plants (table 3 in the main report). Branched density is recorded separately for the six subsampling areas.
-
• Species code—The alphanumeric code (as many as six digits) for a species based on the U.S. Department of Agriculture PLANTS Database (https://plants.usda.gov/; U.S. Department of Agriculture Natural Resources Conservation Service, 2025). Most of the species codes are available in table 1.1 in appendix 1. If the genus of a plant is known and the species is unknown, then a new code is created using the first four letters of the genus name and inserting a question mark between the second and third letters; for example, “PO?TA” for Potamogeton sp. and “MY?RI” for Myriophyllum sp. Using the species code of a suspected species is preferable, however, when based on the suggestion of the AVS. The confidence level of species identification will be reflected in the quality evaluation code.
-
• V—A code for the presence or absence information of species. A “1” is recorded for a species that was visually detected in the subsampling area before raking; otherwise, the box is left blank (default). For nonrooted floating-leaved species, the V box is always left blank.
-
• R—Plant density (a categorical index score), according to table 3 in the main report, for each submersed species detected in the rake sample of vegetation. Plant density is reported separately for filamentous algae. A floating-leaved or emergent species receives a “1” regardless of its plant density as long as the species was collected in the rake sample of vegetation. The box is left blank (default) for species not sampled by the rake. For nonrooted floating-leaved species, the R box is always left blank.
-
• Additional species—A “1” is recorded for each species that is present at a site but not in any of the six subsampling areas. Otherwise, the box is left blank (default). A “1” is also used to indicate species of nonrooted floating-leaved plants that are at the site but not recorded by subsampling area.
-
• Cover—The visually estimated percentage of cover for each rooted floating-leaved and emergent species by site (not by subsampling area).
-
• QE—A number (1–4) used to flag the taxonomic identification uncertainty (table 5 in the main report). A blank indicates a species code is available and known according to the U.S. Department of Agriculture PLANTS Database.
-
• Voucher—A code denoting whether a voucher specimen was taken of the species.
-
• Comments—A field for recording any additional observations. Comments should be limited to 80 characters.
-
• Velocity—Maximum water speed measured at sites with depths greater than 20 centimeters (cm) at 20 cm below surface. The value is reported in meters per second to the nearest centimeter (for example, 0.01 meter per second).
-
• Turbidity—Measured at sites with depths greater than 20 cm. Measured to the nearest whole number in nephelometric turbidity units at 20 cm below surface.
-
• Vessel type—A code defining how the sampling site was accessed.
-
• 31 map classes—A code indicating land cover classification using Dieck and others (2015).
-
□ Open water (OW)
-
□ Submersed vegetation (SV)
-
□ Rooted floating aquatics (RFA)
-
□ Deep marsh annual (DMA)
-
□ Deep marsh perennial (DMP)
-
□ Shallow marsh annual (SMA)
-
□ Shallow marsh perennial (SMP)
-
□ Sedge meadow (SM)
-
□ Wet meadow (WM)
-
□ Deep marsh shrub (DMS)
-
□ Shallow marsh shrub (SMS)
-
□ Wet meadow shrub (WMS)
-
□ Scrub shrub (SS)
-
□ Wooded swamp (WS)
-
□ Floodplain forest (FF)
-
□ Populus community (PC)
-
□ Salix community (SC)
-
□ Lowland forest (LF)
-
□ Agriculture (AG)
-
□ Conifer (CN)
-
□ Plantation (PN)
-
□ Upland forest (UF)
-
□ Developed (DV)
-
□ Grassland (GR)
-
□ Levee (LV)
-
□ Pasture (PS)
-
□ Roadside (RD)
-
□ Mudflat (MUD)
-
□ Sand bar (SB)
-
□ Sand (SD)
-
□ No photographic coverage (NPC)
-
References Cited
Dieck, J.J., Ruhser, J., Hoy, E.E., and Robinson, L.R., 2015, General classification handbook for floodplain vegetation in large river systems: U.S. Geological Survey Techniques and Methods, book 2, chap. A1, 51 p. [Also available at https://doi.org/10.3133/tm2A1.]
U.S. Department of Agriculture Natural Resources Conservation Service, 2025, PLANTS database: Natural Resources Conservation Service digital data, accessed April 30, 2025, at https://plants.usda.gov.
Appendix 4. Population Size, Sample Size, and Selection Probabilities
Table 4.1.
A summary of annual population size, sample size, and selection probabilities by pool and stratum for the period of 1998–2025 in the Upper Mississippi River.[Nh, annual population size; nh, sample size; ph selection probability; MCB, main channel border; U, upper pool above the middle of Lake Pepin; L, lower pool including the lower half of Lake Pepin; SC, side channels; BWC, backwaters contiguous to the main channel; TDL, tributary Delta Lake (that is, Lake Pepin); present as of year 2025; --, no data or not applicable; BWI, backwaters isolated from the main channel; IMP, impounded; D, Delta Lake, Pepin, Minnesota]
Appendix 5. Commonly Used Computations
Percent Frequency of Occurrence or Prevalence
The percent frequency of occurrence or prevalence (F) is a measure of how often a species is detected that is calculated by dividing the number of sites where a species is detected by the total number of sites sampled (in a stratum or a study pool) and multiplying by 100. An example is given in equation 5.1:
The frequency value in a pool was computed by averaging the frequency values of the strata, weighted by acreage: whereRelative Frequency
Relative frequency is a comparison of the frequency of one species to all species detected. It is calculated by dividing the number of detections for a single species by the total number of detections for all species. This metric is often displayed as a pie chart to show relative species dominance.
Percentage of Cover (of Rooted Floating-Leaved and Emergent Life Forms)
The areal percentage of cover metric is calculated from the cover rating collected during sampling (table 5.1). The cover ratings are the proportion of a 2-meter circle that is occupied by either rooted floating-leaved species or emergent species. Each site is given a single cover rating score. The percentage cover estimates the proportion of aquatic area within a pool or stratum that had rooted floating-leaved species or emergent species during the year of sampling.
Table 5.1.
Percentage of cover rating and corresponding percentage of cover range within a 2-meter ring.The percentage of cover is calculated using the following formula:
whereC
is the percentage of cover estimate,
m
is the number of terms in the summation/number of Lj values,
Lj
is the cover rating at individual sites,
A
is the midpoint of the corresponding percentage of cover, and
M
is the total number of sites (in either the stratum or pool).
The percentage of cover in a pool is computed as the average of all shallow water strata, weighted by acreage:
whereSurface Maps
Surface maps are available at https://umesc.usgs.gov/data_library/vegetation/graphical/veg_front.html by selecting “surface maps” from the vegetation data metrics list and entering the query parameters. These surface maps indicate the relative probability that a sampling plot was occupied by aquatic vegetation, and data are interpolated to have full coverage of the pool between sampling locations. The dark green represents the highest probability of vegetation, and light blue represents the lowest probability of vegetation detections. Areas that are black are either nonaquatic areas or insufficient samples for precise interpolations.
These annual maps are generated by interpolating among sampling locations using LTRM aquatic vegetation data. The interpolations were halted when hitting stratum boundaries and when distances among sampling points were greater than 150 meters. The value used for interpolation is a probability index, which is the sum of six rakes at each sampling location where submersed aquatic vegetation (or the selected species) was detected.
Community Similarity
Community similarity is a measure of how similar the study pools are based on vegetation species composition. The similarity index is calculated using Jaccard similarity index using the following formula:
whereSpecies Diversity
We chose species richness, Shannon diversity index, and Shannon’s evenness index to display on the LTRM graphical browser, but many other diversity metrics may be calculated using these data. Species richness is the total number of species detected at a location (site, stratum, or study pool). Shannon’s diversity index (H) and evenness (EH) are calculated as follows:
and where The diversity of vegetation species in a pool or stratum depends on the number of species observed (species richness) and their relative abundances. Shannon’s diversity (H) increases as richness and evenness of the community increase. Shannon’s evenness or equitability (EH) refers to Shannon’s diversity divided by the maximum diversity and is standardized to range from 0 to 1. Low evenness (values close to 0) indicates species are not distributed evenly, whereby some species are highly dominant, and some species are rare. High evenness (values close to 1) indicates the plant species detected have similar frequency.Note of Stratum as a Proxy for Habitat Type
The map stratum field is fixed based on the stratified random sampling design, which was determined in 1997 at flat pool condition. We also record a separate data field called habitat type, which is the AVS interpretations of the habitat type during that sampling event. Data analysts may choose to use either stratum or habitat type as a variable for understanding aquatic plant relationships in main channel borders, side channels, and backwater lakes (for example, refer to Delaney and Larson [2023]).
Historically, an apparent mismatch in the map stratum and habitat type fields has been recorded at fewer than 10 percent of sites. It is important to note that a mismatch between the stratum where a site is located and the AVS interpretation of habitat type has no effect on the rigor of the estimates derived from the stratum (Ickes and others 2014). The most common example of “mismatch” is a low-water sampling event that places a site on land (actual stratum = land) when the site was inundated in 1997, and the map stratum is backwater contiguous lake. When calculating pool wide species prevalence, the map stratum is the most appropriate choice based on the stratified random sampling study design. When assessing plant relations with broad habitat types (for example, side channels and isolated backwaters), the habitat type field may be more accurate to associate the habitat classification to the plant community for a given sampling year.
Biomass Conversions
Drake and others (2022) created a model that can convert submersed aquatic vegetation rake density rating in table 3 of the main report to approximate biomass estimates. That study determined that biomass predictions are more accurate when Vallisneria americana Michx., the only species with unbranched morphology, and branched species (all species combined) are estimated separately (Drake and others, 2022). Therefore, in 2019, we added the branched density field, which is the plant density of all species on the rake except for Vallisneria americana Michx.
References Cited
Delaney, J.T., and Larson, D.M., 2023, Using explainable machine learning methods to evaluate vulnerability and restoration potential of ecosystem state transitions: Conservation Biology, v. 38, no. 3, article 14203, 13 p. [Also available at https://doi.org/10.1111/cobi.14203].
Drake, D.C., Lund, E.M., and Kreiling, R.M., 2022, Annual summer submersed macrophyte standing stocks estimated from long-term monitoring data in the Upper Mississippi River: Journal of Fish and Wildlife Management, v. 13, no. 1, p. 205–222. [Also available at https://doi.org/10.3996/JFWM-21-063.]
Ickes, B. S., Sauer, J.S., and Rogala, J.T., 2014, Monitoring rationale, strategy, issues, and methods: UMRR–EMP LTRMP Fish Component, prepared for the U.S. Army Corps of Engineers’ Upper Mississippi River Restoration Environmental Management Program, Program Report 2014–P001a, 29 p. [Also available at https://umesc.usgs.gov/reports_publications/ltrmp_rep_list.html#2014.]
Appendix 6. Standard Operating Procedure Manual Updates
Table 6.1.
Primary changes to the standard operating procedure manual from the first version (Yin and others, 2000).[SOP, standard operating procedure; --, no data or not applicable; LTRM, Long Term Resource Monitoring element; QAQC, quality assurance and quality control; SAV, submersed aquatic vegetation; m, meter]
| Update | Description | Justifications or publications in support of the change | Location in this SOP (page no. unless otherwise noted) |
|---|---|---|---|
| “Monitoring Aquatic Vegetation” section | Includes data intent and study design | Helps orient users to the context of this SOP | 1 |
| Study area and design map | Map of key study pools and stratified random sampling design | Helps orient users to study location and sampling design | Figure 1 |
| Conventional naming of core staff in the LTRM component and their locations | Paragraph in “Monitoring Aquatic Vegetation” section | Gives a clear title to key personnel; their title is used throughout the SOP to define roles and responsible persons for tasks | 1 |
| Clarifications on species included or excluded from data frame | Better description of species included (app. 1) and excluded | Based on LTRM database and habitats detected (as described in Dieck and others [2015]). We clarify that the sampling frame includes facultative and wetland-obligate species. | 2 |
| Voucher and herbarium specimens | Now collecting plant specimens | Now part of LTRM protocol to verify species identification, archive samples, and share herbarium specimens with the public. Added appendix 7, which includes standardized specimen labels. | 10, appendix 7 |
| Velocity readings (optional) | Collecting velocity at a site (optional) | Can be used for site-level analysis of plants and velocity | 9 |
| QAQC | Added a one-paragraph description of the QAQC processes implemented since LTRM’s inception. | Informational for LTRM aquatic vegetation specialists and potential data users. The QAQC workflow has not changed since inception of LTRM, but some technologies (like programs for analysis scripts) have changed. |
10 |
| Trace score, SAV density rating | Added trace score for relative abundance of SAV from raking | Drake and Lund (2021) | Table 3 |
| New plant density rating, branched density | Branched plant density may differ from total branched density if Vallisneria americana Michx. is present | Drake and others (2022) note that biomass and ecosystem structure differ with branched and unbranched SAV morphology | 7 |
| New substrate category | Added category for when substrate is unobtainable | Substrate may not be obtainable because of depth and velocity conditions | Table 4 |
| New shells checkbox | Shells or mussels absent = blank Shells or mussels present = 1 |
Having shells and mussels in substrate is increasingly common | 7 |
| New optional measure, vessel type | Added option to record type of boat or walk-in procedure used | Helps interpret communities that may be in wadable or moist soils | 8 |
| New optional measure, turbidity | Added option to measure and record turbidity | Added benefit to data analysts interested in plant and water clarity | 9 |
| New optional measure, 31 map classes | Land cover is classified according to the 31 map classes (app. 3) in the General Wetland Vegetation Classification System (Dieck and others, 2015). | Land cover classifications can be defined by physical characteristics and plant communities at each sampling location; added benefit to data analysts | 9, appendix 3 |
| Number of sites per stratum and study pool per year | Pools initially had 400–650 sites per pool per year until 2005; after 2005, pools have 450 sites per pool per year. Also, the sample sizes per stratum changed in 2005. | Early program development determined sound parameter estimates for pool wide prevalence at 450 sites using the stratified random sampling design | 4–5, table 1, appendix 4 |
| Species code NOAQVG | Changed species code NOAQVG to NOSAV | Means no SAV is detected, but other life forms (aquatic vegetation) may be present. This confused many data users. | 7 |
| Percentage of cover (emergent and floating-leaved species) | Change from 20-percent increment to 10-percent increment | More precise to estimate at 10-percent intervals | 6 |
| Schematic of plant sampling | Updated schematic to show the general ideas of sampling aquatic plants around the boat | Updated with color and 2-m ring around boat | Figure 2 |
| Apparent stratum mismatch | Clarified how to interpret the map stratum and habitat type data fields | The map stratum field affects the sampling design and inferences of pool wide calculations. Some analysts choose to use the actual stratum field to record associated vegetation with habitat types like floodplain lakes and side channels. | 6 |
| Section renaming | Section renamed from “Uncommon Situations” to “Common Situations” | The situations are regular | 7 |
| ZIAQ to ZI?ZA species code usage | Species identity has been uncertain within the past decade. | After 2024, we will record wild rice (Zizania spp.) as species code ZI?ZA to reflect species uncertainty | Appendix 1 |
| References | “References Cited” section listing full citations | Increase in publications cited since version 1 (Yin and others, 2000) | 11–12 |
| Abundance index (from graphical browser) | Complex computation of an aquatic plant abundance index | Confusion by graphical browser users on interpretation of the index; overly complex computation with errors in the formula | Appendix 5 |
References Cited
Dieck, J.J., Ruhser, J., Hoy, E.E., and Robinson, L.R., 2015, General classification handbook for floodplain vegetation in large river systems: U.S. Geological Survey Techniques and Methods, book 2, chap. A1, 51 p. [Also available at https://doi.org/10.3133/tm2A1.]
Drake, D.C., and Lund, E., 2021, Evaluation of a “trace” plant density score in LTRM vegetation monitoring: U.S. Army Corps of Engineers Upper Mississippi River Restoration Program, Long Term Resource Monitoring Report LTRM–2018BI03a, prepared by the U.S. Geological Survey, 32 p. [Also available at https://umesc.usgs.gov/reports_publications/ltrmp_rep_list.html#2021.]
Drake, D.C., Lund, E.M., and Kreiling, R.M., 2022, Annual summer submersed macrophyte standing stocks estimated from long-term monitoring data in the Upper Mississippi River: Journal of Fish and Wildlife Management, v. 13, no. 1, p. 205–222. [Also available at https://doi.org/10.3996/JFWM-21-063.]
Appendix 7. Herbarium Label
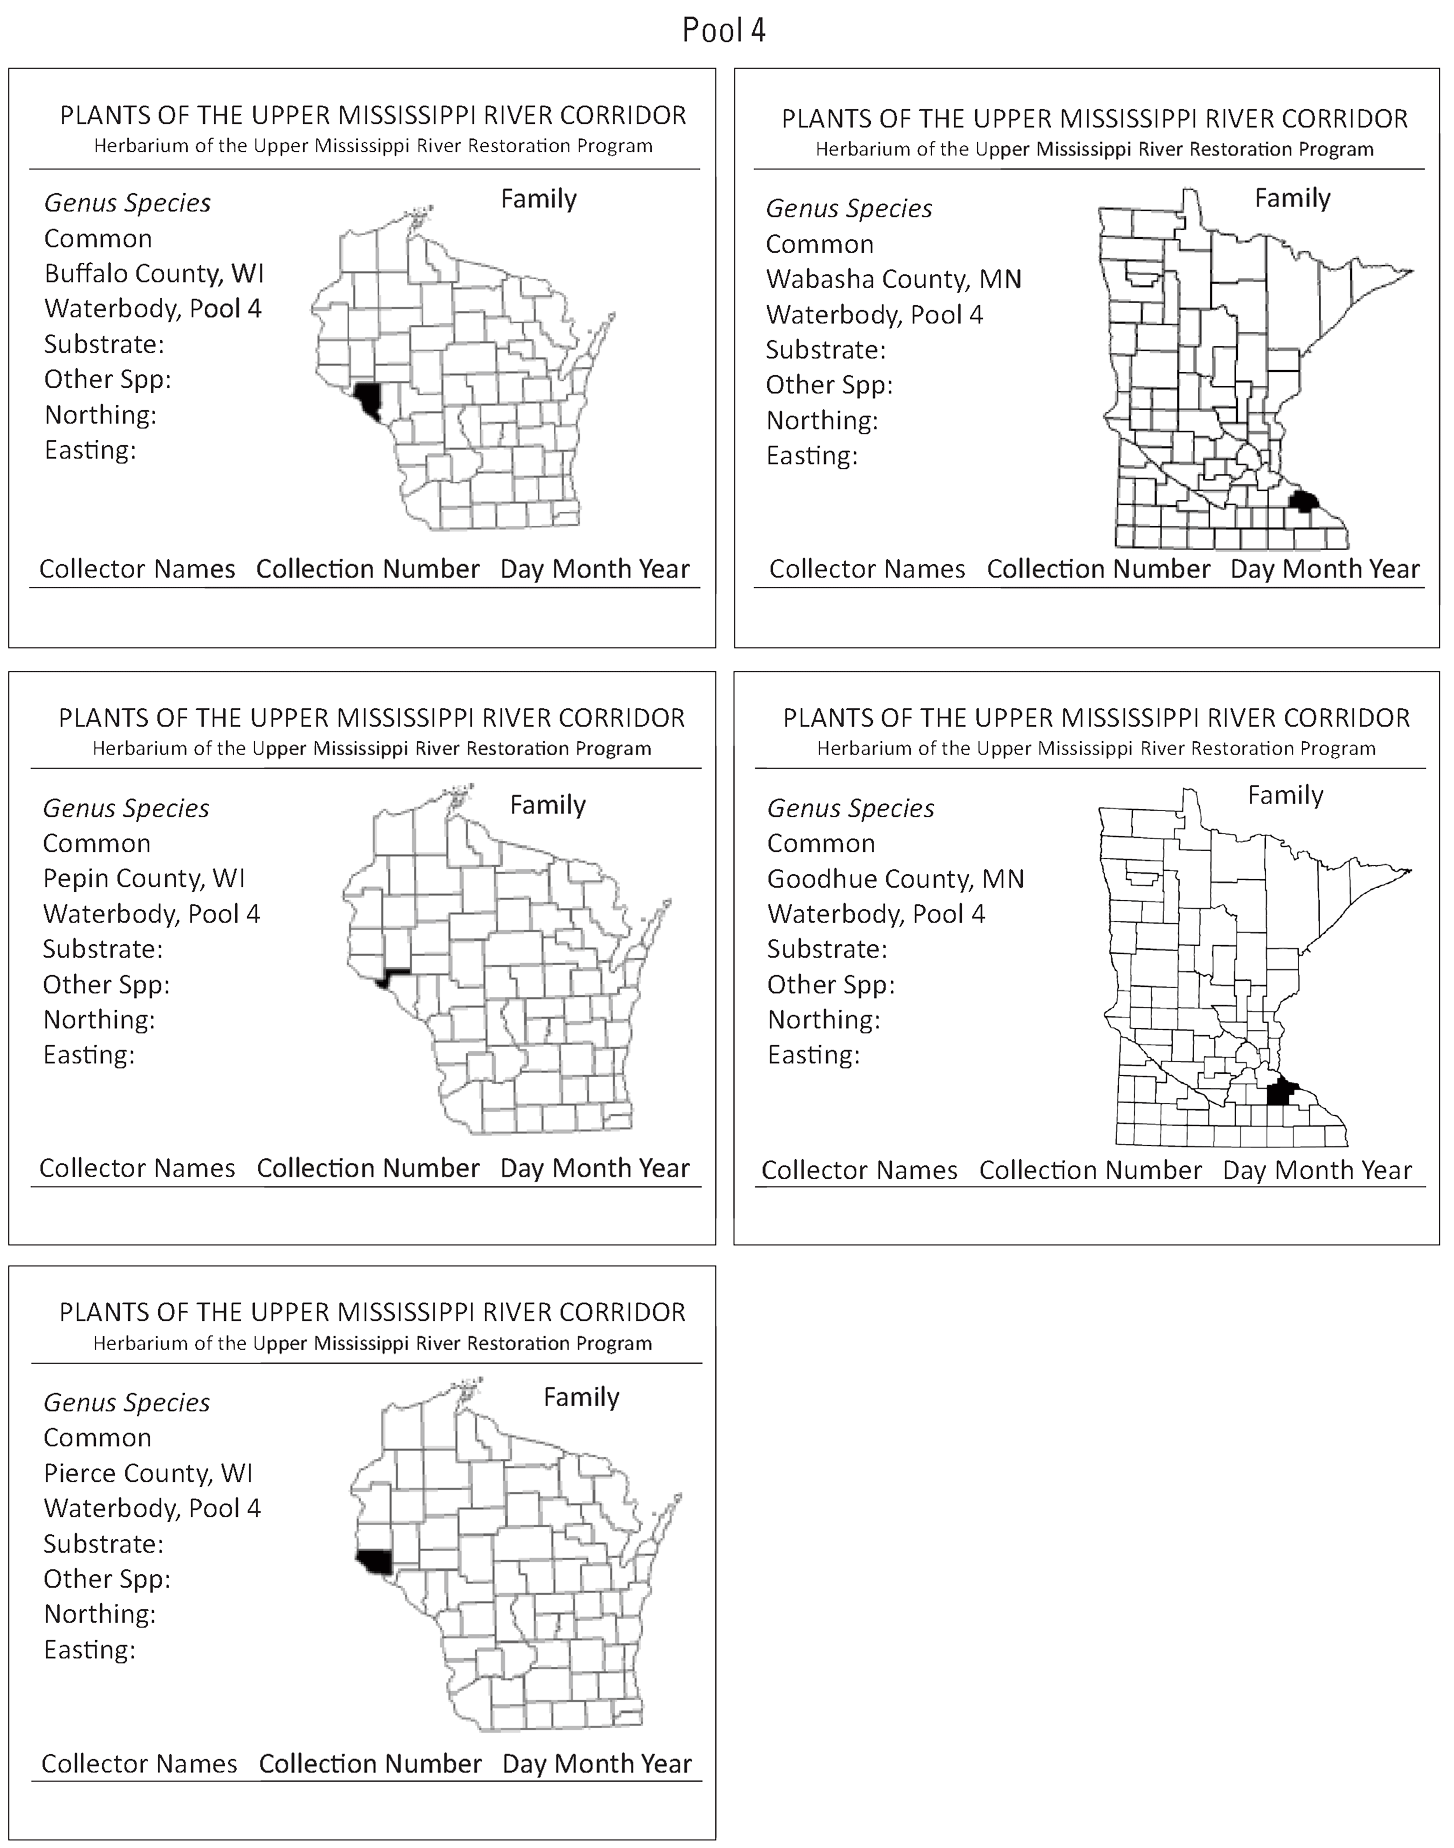
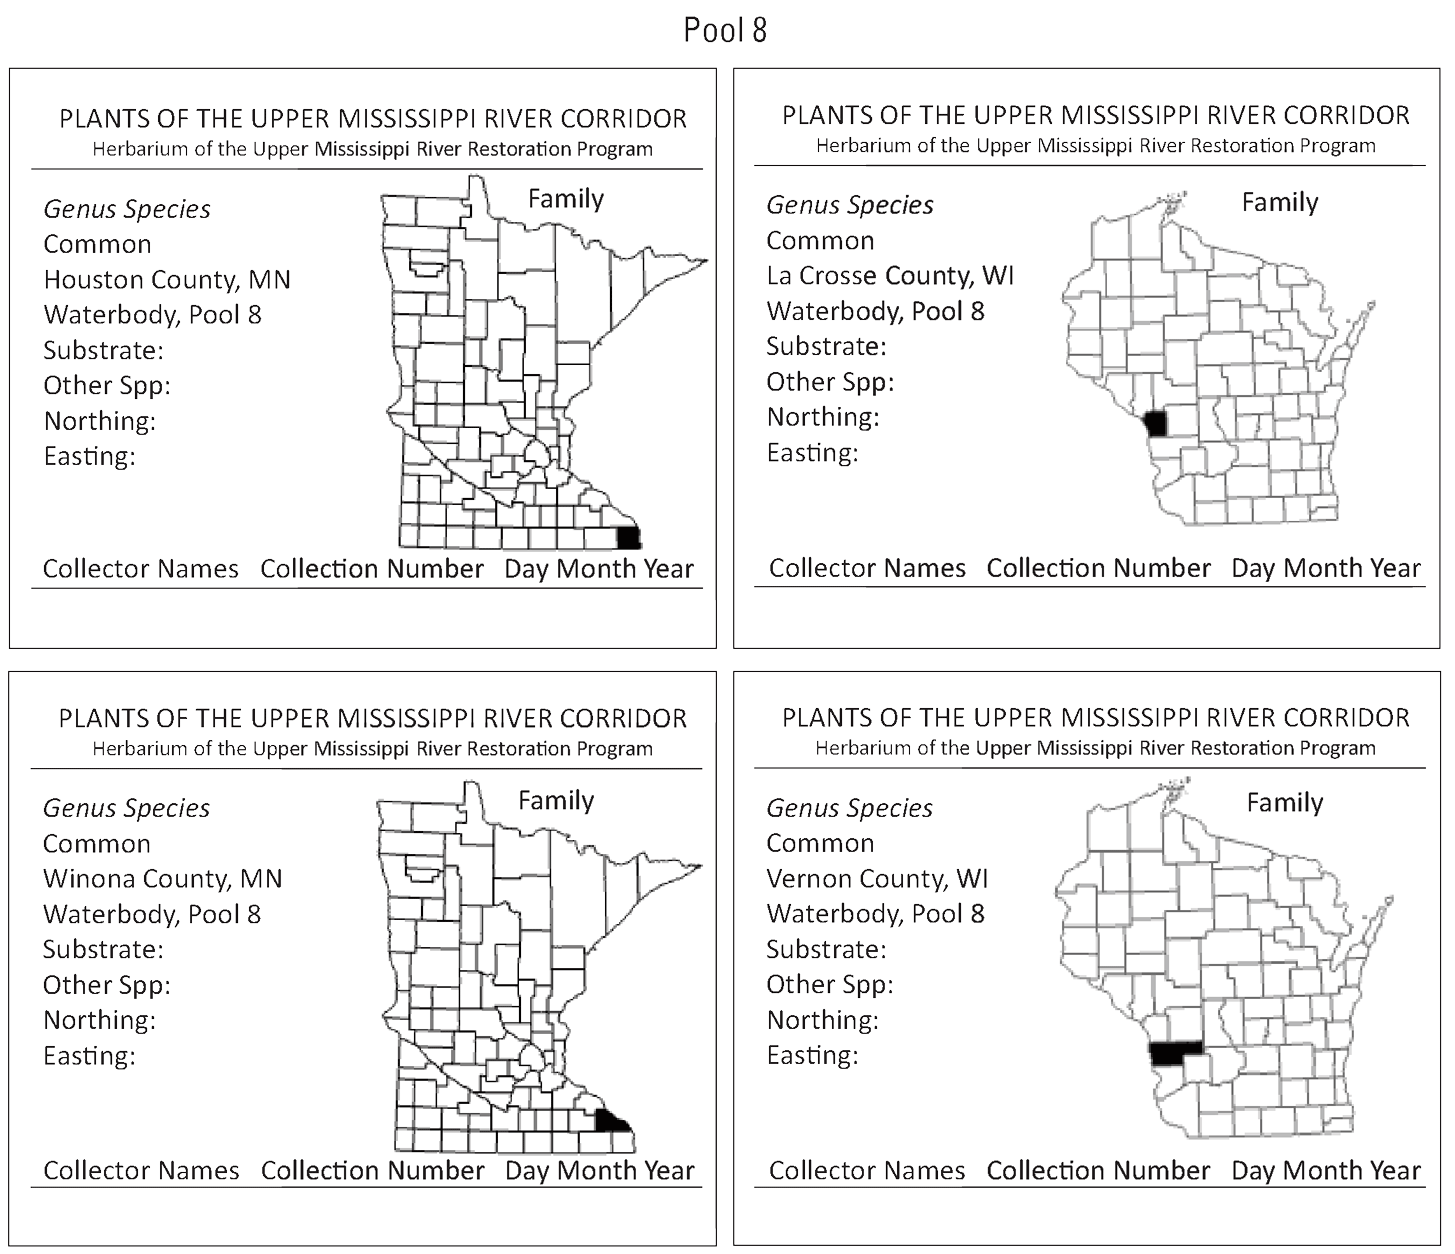
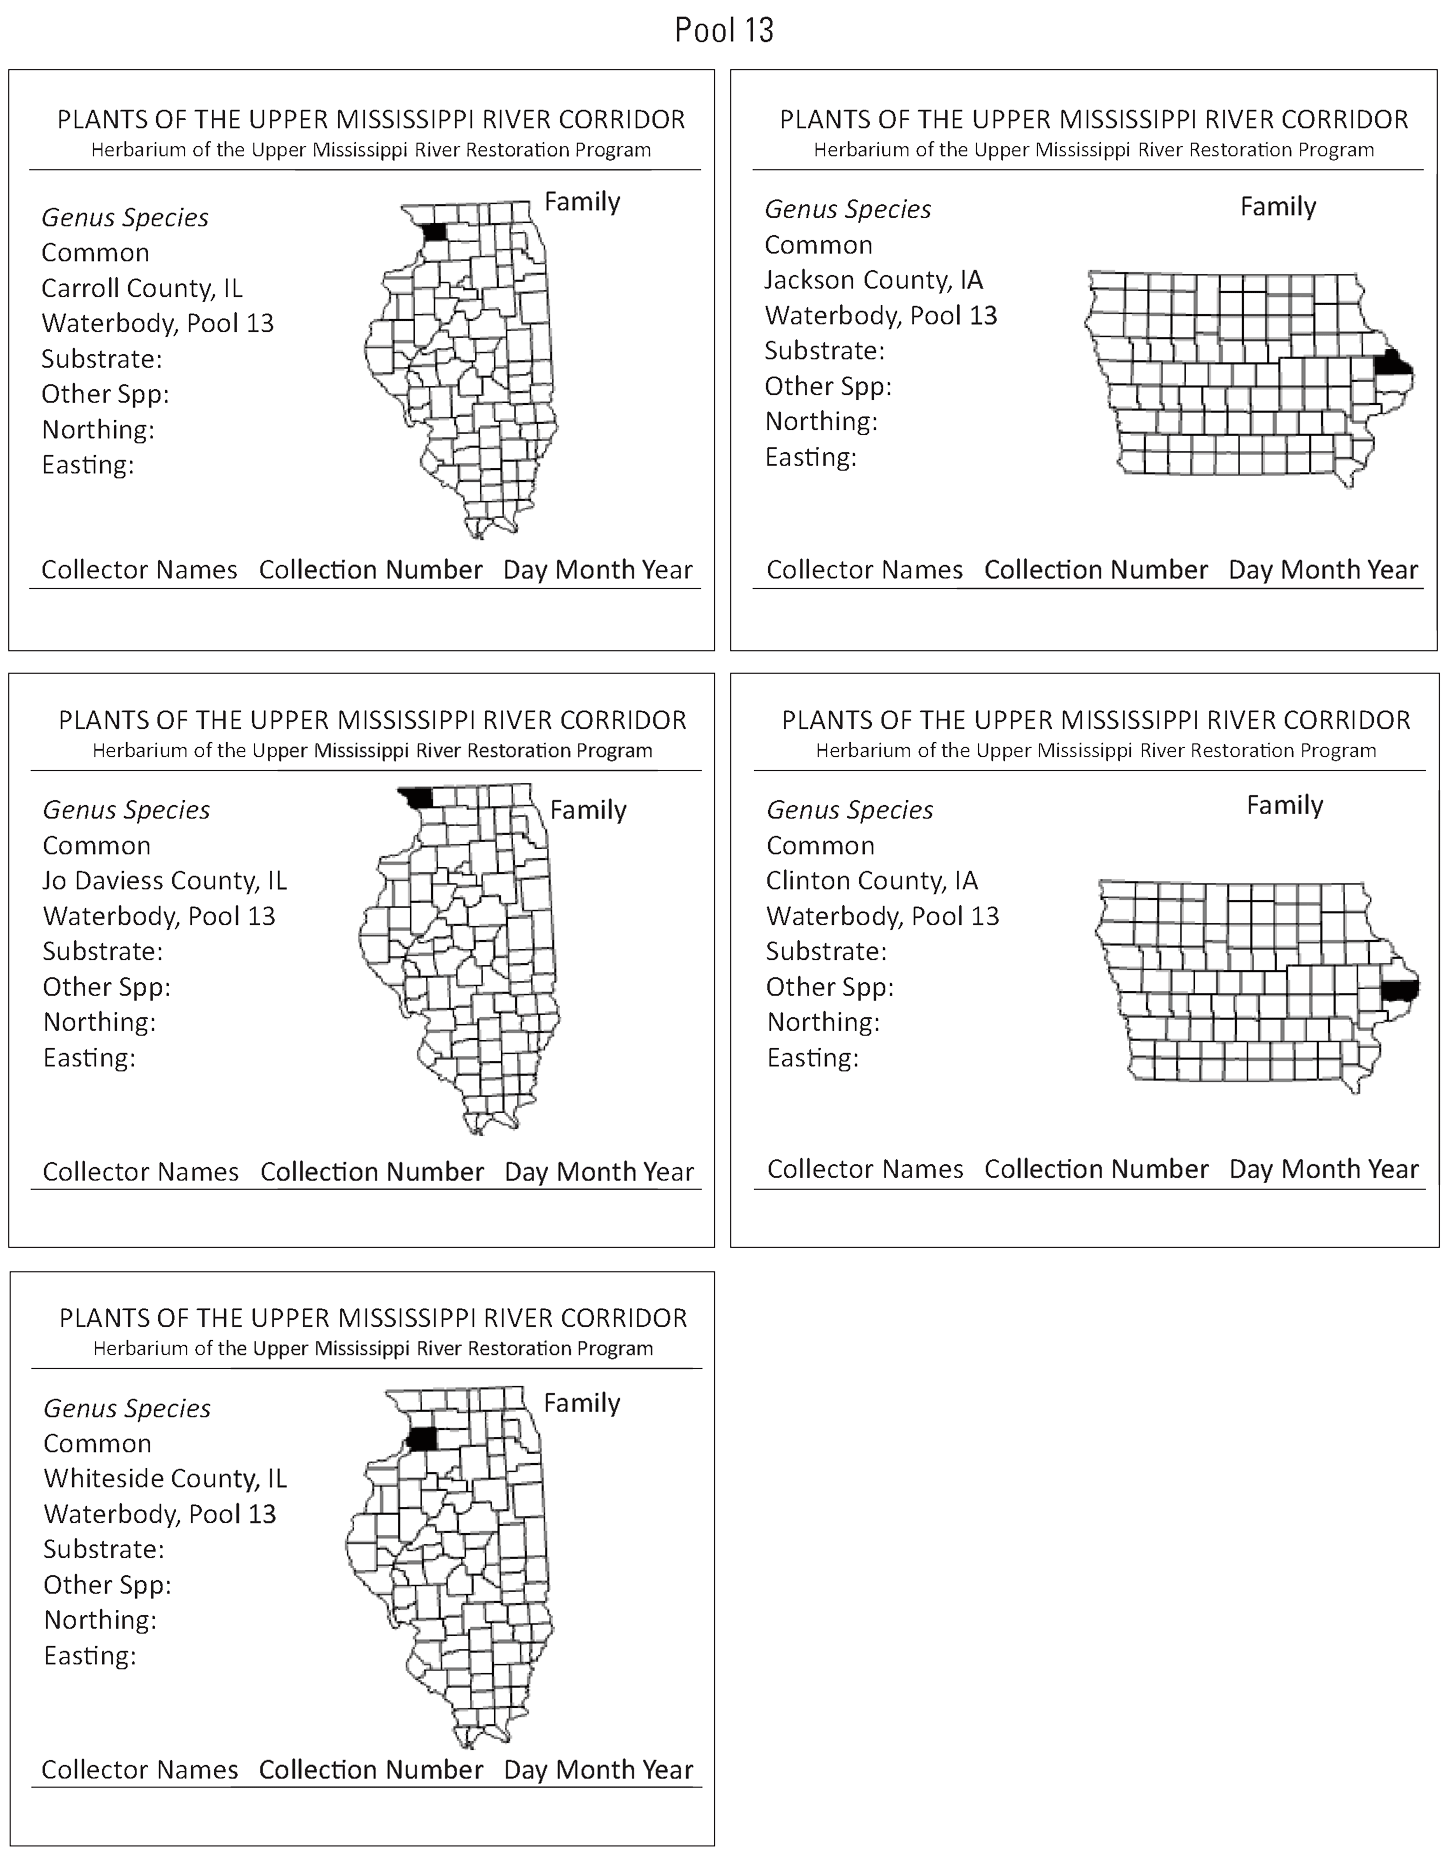
Label template to be used on sealable plastic bags containing aquatic specimens.
Conversion Factors
International System of Units to U.S. customary units
Abbreviations
>
greater than
±
plus or minus
AVS
aquatic vegetation specialist
FOM
figure of merit
GPS
Global Positioning System
LTRM
Long Term Resource Monitoring
PDOP
percentage dilution of precision
SAV
submersed aquatic vegetation
SOP
standard operating procedure
USDA
U.S. Department of Agriculture
UTM
Universal Transverse Mercator
For more information about this publication, contact:
Director, USGS Upper Midwest Environmental Sciences Center
2630 Fanta Reed Road
La Crosse, Wisconsin 54603
608–783–6451
For additional information, visit: https://www.usgs.gov/centers/umesc
Publishing support provided by the
USGS Science Publishing Network,
Rolla Publishing Service Center
Disclaimers
Any use of trade, firm, or product names is for descriptive purposes only and does not imply endorsement by the U.S. Government.
Although this information product, for the most part, is in the public domain, it also may contain copyrighted materials as noted in the text. Permission to reproduce copyrighted items must be secured from the copyright owner.
Suggested Citation
Larson, D.M., Lund, E., Carhart, A.M., Fopma, S., and Szura, S., 2025, Long Term Resource Monitoring procedures—Aquatic vegetation monitoring: U.S. Geological Survey Techniques and Methods, book 2, chap. A22, 40 p., https://doi.org/10.3133/tm2A22.
ISSN: 2328-7055 (online)
Study Area
| Publication type | Report |
|---|---|
| Publication Subtype | USGS Numbered Series |
| Title | Long Term Resource Monitoring procedures—Aquatic vegetation monitoring |
| Series title | Techniques and Methods |
| Series number | 2-A22 |
| DOI | 10.3133/tm2A22 |
| Publication Date | September 30, 2025 |
| Year Published | 2025 |
| Language | English |
| Publisher | U.S. Geological Survey |
| Publisher location | Reston, VA |
| Contributing office(s) | Upper Midwest Environmental Sciences Center |
| Description | Report: vi, 40 p.; 2 Linked Figures; Pocket Guide |
| Country | United States |
| State | Illinois, Iowa, Minnesota, Missouri, Wisconsin |
| Other Geospatial | Illinois River, Upper Mississippi River |
| Online Only (Y/N) | Y |
| Additional Online Files (Y/N) | Y |