

An Apparent Dip Calculator for Spreadsheets
Links
- Document: Report (625 KB pdf) , HTML , XML
- Companion File: Software (98.0 KB) - Apparent Dip Calculator v. 1.0
- Download citation as: RIS | Dublin Core
Abstract
This report and spreadsheet calculator contain Microsoft Excel-based equations that are useful in structural geology to calculate plunge or apparent dip when measuring lineations on a plane. The spreadsheet allows users to measure the trend or the plunge of a lineation and calculate the corresponding unknown value of trend or plunge.
The spreadsheet provides the user with two options:
-
Option 1: Calculates the plunge of a lineation from the measured strike and dip of a plane and the measured trend of a lineation.
-
Option 2: Calculates two potential trends of a lineation from the measured strike and dip of a plane and a measured plunge of a lineation. The user can decide which trend is appropriate for their data.
Methods
This report and spreadsheet calculator (Apparent_Dip_Calculator_v.1.0.xls at https://doi.org/10.3133/tm7C28) contain Microsoft Excel-based equations that are useful in structural geology to calculate plunge or apparent dip when measuring lineations on a plane. The spreadsheet (tables 1 and 2) allows users to measure either the trend or the plunge of a lineation and calculate the corresponding unknown value of trend or plunge. The spreadsheet uses measurements in right-hand-rule and the following apparent dip equation (eq. 1) (Fisher, 1937; Gabriel and Miller, 1952):
whereΨ
is angle of an apparent dip,
α
is angle of a true dip, and
θ
is angle between the direction of an apparent dip and a true dip.
An alternative of the same equation (eq. 2) calculates the apparent dip by relating it to the angle between the trend of the apparent dip and the strike (Addie, 1968):
whereΨ
is angle of an apparent dip,
α
is angle of a true dip, and
δ
is angle between the direction of an apparent dip and the strike.
In the spreadsheet tables 1 and 2, the latter equation is used because the strike value is a commonly measured parameter by the field geologist.
In structural geology, it is more accurate to measure the strike and dip of a plane that contains a lineation, and then measure either the trend or the plunge of the lineation and calculate the corresponding unknown value of trend or plunge. Geologists who attempt to accurately measure all four values of strike and dip of a plane plus the trend and plunge of a lineation often produce results that are geometrically imprecise as shown in the example on the stereonet, data table, and map symbols in figure 1. Rowland and others (2021, problem 1.3) use an example of this challenge as a student exercise to check the feasibility of measured lineations. With the spreadsheet (table 1), the user can enter the three measured values (strike, dip, and trend) to calculate the fourth unknown value (plunge). The table 1 calculator thus eliminates errors encountered when trying to measure all four values. It also allows structural geologists to independently check the accuracy of their measurements while in the field on the outcrop, or check data shown on a geologic map.
The spreadsheet provides the user with two options:
-
Option 1 (table 1): Calculates the plunge of a lineation from the measured strike and dip of a plane and the measured trend of a lineation.
-
Option 2 (table 2): Calculates two potential trends of a lineation from the measured strike and dip of a plane and a measured plunge of a lineation. The user can decide which trend is appropriate for their data.
Option 1, calculates the plunge of a lineation from the measured strike and dip of a plane and the measured trend of a lineation. See file Apparent _Dip_Calculator_v.1.0.xls at https://doi.org/10.3133/tm7C28.
Option 2, calculates two potential trends of a lineation from the measured strike and dip of a plane and a measured plunge of a lineation. See file Apparent _Dip_Calculator_v.1.0.xls at https://doi.org/10.3133/tm7C28.
Currently, various online tools exist that enable users to calculate apparent dip, however, they require internet access. The tool presented here is especially helpful when working in remote areas without access to online tools. The spreadsheet calculator is stand-alone and operates offline on multiple platforms, giving the user greater flexibility. It has been successfully tested on mobile Windows, Android, and Apple devices. The instructions and user notes are located within the spreadsheet (Apparent_Dip_Calculator_v.1.0.xls).
The spreadsheet uses mathematical formulas to quantify values in a digital format and differs from traditional analog tools such as the ZipADip® protractor (Travis, 1964), a paper stereonet, or a Biemsderfer plotter (Wise, 2005).
The spreadsheet was successfully tested on the following platforms:
-
• Microsoft Excel for Microsoft 365
-
• Numbers for Mac OS
-
• Numbers for Apple iOS
-
• Google Sheets for Android
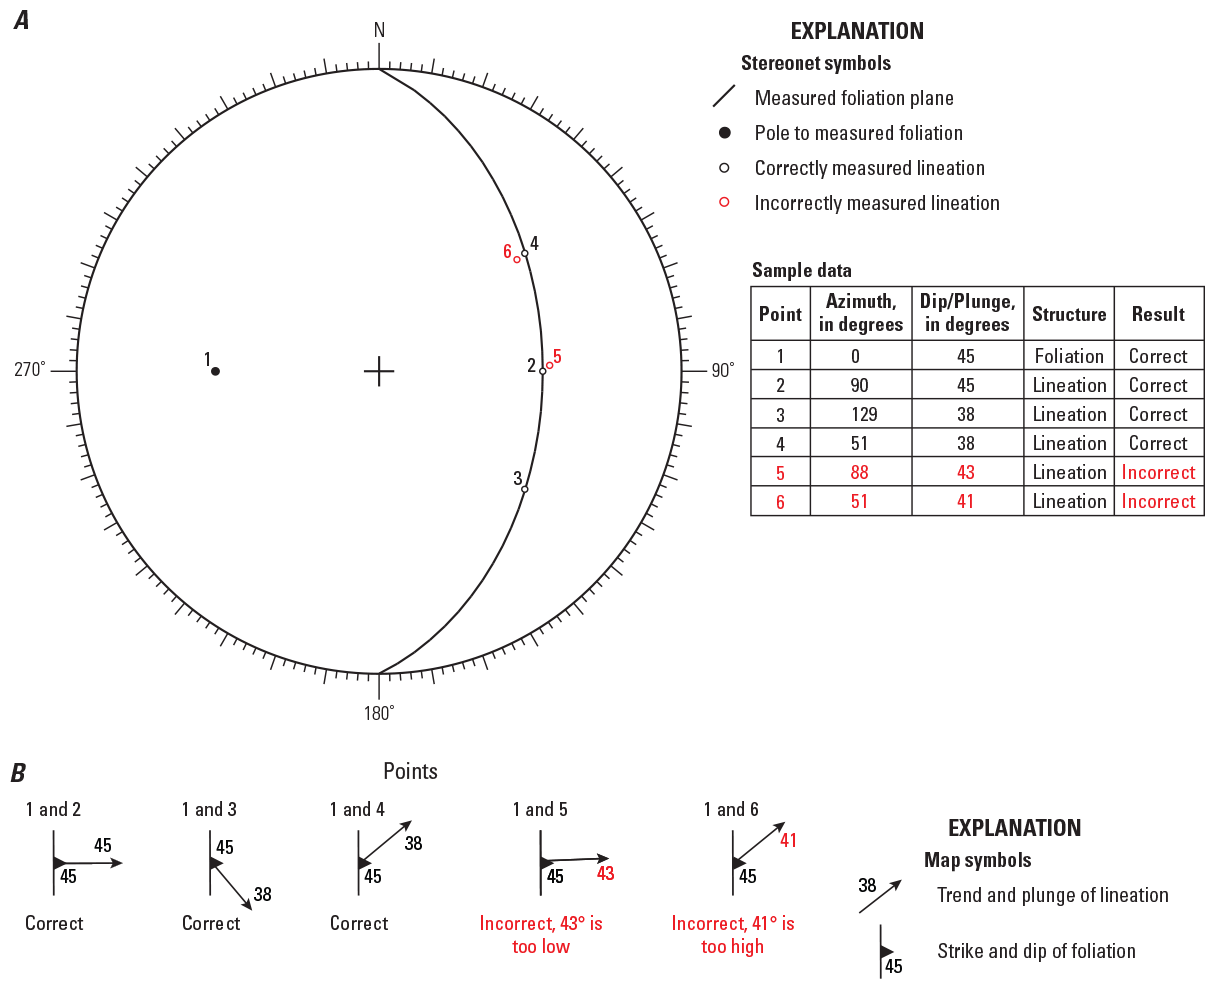
Stereonet (part A) and map symbols (part B) showing fictitious, measured sample data for the strike and dip of a foliation plane (point 1) with five lineations (points 2–6). Sample data (in degrees) are shown in right-hand-rule. Two lineations (red open circles, points 5 and 6) yield incorrect measurements that do not plot on the foliation plane. Map symbols in part B show strike and dip of foliation and trend and plunge of lineation for points on the stereonet in part A. The stereonet was plotted with the Structural Data Integrated System Analyser software (DAISY 3, ver. 5.14a) by Salvini and others (1999) and Salvini (2016).
References Cited
Addie, G., 1968, A new true thickness formula based on the apparent dip: Economic Geology and the Bulletin of the Society of Economic Geologists, v. 63, no. 2, p. 188. [Also available at https://doi.org/10.2113/gsecongeo.63.2.188.]
Fisher, D.J., 1937, Some dip problems: Bulletin of the American Association of Petroleum Geologists, v. 21, no. 3, p. 340–351. [Also available at https://doi.org/10.1306/3D932EB6-16B1-11D7-8645000102C1865D.]
Gabriel, V.G., and Miller, R.J., 1952, Apparent dip—True dip formula using a unit hemisphere: Transactions - American Geophysical Union, v. 33, no. 5, p. 734–738, accessed February 1, 2022, at https://doi.org/10.1029/TR033i005p00734.
Salvini, F., Billi, A., and Wise, D.U., 1999, Strike-slip fault-propagation cleavage in carbonate rocks—The Mattinata fault zone, Southern Apennines, Italy: Journal of Structural Geology, v. 21, no. 12, p. 1731–1749. [Also available at https://doi.org/10.1016/S0191-8141(99)00120-0.]
Salvini, F., 2016, DAISY 3—The Structural Data Integrated System Analyser (ver. 5.08-9): Rome, Italy, Roma Tre University, Department of Geological Sciences. [Software available at http://host.uniroma3.it/progetti/fralab/Downloads/Programs/.]
Travis, R.B., 1964, Apparent dip calculator: Bulletin of the American Association of Petroleum Geologists, v. 48, no. 4, p. 503–504. [Also available at https://doi.org/10.1306/BC743C0D-16BE-11D7-8645000102C1865D.]
Wise, D.U., 2005, Biemsderfer plotter for field recording of structural measurements on equal area nets: Journal of Structural Geology, v. 27, no. 5, p. 823–826, accessed February 1, 2022, at https://doi.org/10.1016/j.jsg.2004.10.015.
Disclaimers
Any use of trade, firm, or product names is for descriptive purposes only and does not imply endorsement by the U.S. Government.
Although this information product, for the most part, is in the public domain, it also may contain copyrighted materials as noted in the text. Permission to reproduce copyrighted items must be secured from the copyright owner.
Suggested Citation
Walsh, G.J., 2022, An apparent dip calculator for spreadsheets: U.S. Geological Survey Techniques and Methods, book 7, chap. C28, 3 p., https://doi.org/10.3133/tm7C28.
ISSN: 2328-7055 (online)
| Publication type | Report |
|---|---|
| Publication Subtype | USGS Numbered Series |
| Title | An apparent dip calculator for spreadsheets |
| Series title | Techniques and Methods |
| Series number | 7-C28 |
| DOI | 10.3133/tm7C28 |
| Publication Date | February 25, 2022 |
| Year Published | 2022 |
| Language | English |
| Publisher | U.S. Geological Survey |
| Publisher location | Reston, VA |
| Contributing office(s) | Florence Bascom Geoscience Center |
| Description | Report: iii, 3 p.; Software |
| Larger Work Type | Report |
| Larger Work Subtype | USGS Numbered Series |
| Larger Work Title | Section C: Computer programs in Book 7: Automated data processing and computations |
| Online Only (Y/N) | Y |
| Additional Online Files (Y/N) | Y |