Scientific Investigations Report 2006–5099
U.S. GEOLOGICAL SURVEY
Scientific Investigations Report 2006–5099
The relation of streamflow to geologic units was studied to assess the potential for ground water in each geologic unit to be affected by ground-water withdrawals from the adjacent valleys and consequently, the potential for affecting surface-water resources within Great Basin National Park. This relation was determined by developing geologic profiles along selected streams. Changes in streamflow were correlated to the geology along each stream based on synoptic-discharge, specific-conductance, and water-temperature measurements completed during snowmelt runoff in June and July 2003, and during a period of low flow in October 2003.
The headwaters of Strawberry Creek originate from runoff
on the older undifferentiated rocks (![]() ;
table 1) on the north side of Bald Mountain and the
west side of Windy Peak (fig. 1). The rocks are predominantly
quartzite, argillite, and shale that generally transmit small quantities of
ground water along fractures (table 1). The rocks
are mantled by a thin layer of alluvial and glacial deposits (
;
table 1) on the north side of Bald Mountain and the
west side of Windy Peak (fig. 1). The rocks are predominantly
quartzite, argillite, and shale that generally transmit small quantities of
ground water along fractures (table 1). The rocks
are mantled by a thin layer of alluvial and glacial deposits (![]() ;
table 1) except near the confluence with Blue Canyon
tributary, where the alluvial and glacial deposits are extensive and relatively
thick. The uppermost synoptic measurement site (St1) is just downstream of the
confluence of Blue Canyon with Strawberry Creek (fig.
3). At site St1, Strawberry Creek is perennial and flows over quartzite
that is mantled by alluvial and glacial deposits (Miller and others, 1995a).
;
table 1) except near the confluence with Blue Canyon
tributary, where the alluvial and glacial deposits are extensive and relatively
thick. The uppermost synoptic measurement site (St1) is just downstream of the
confluence of Blue Canyon with Strawberry Creek (fig.
3). At site St1, Strawberry Creek is perennial and flows over quartzite
that is mantled by alluvial and glacial deposits (Miller and others, 1995a).
Stream discharge measured in June 2003 indicates increased discharge between sites St1 and St2, decreased discharge between sites St2 and St3, increased discharge between sites St3 and St4, and a net decrease in discharge on the alluvial slope downstream of site St4 (fig. 16). Surface-water inflows from tributaries were not observed between sites St1 and St4 during the synoptic measurements. Measured stream discharges for Strawberry Creek during low flow in October 2003 indicate increasing discharge between sites St1 and St2 and a gradual decrease in discharge from site St2 within the mountain section to site St5 on the alluvial slope.
Specific conductance measured during October 2003 doubled between sites St1 and St3 from 73 to 147 µS/cm with most of the increase occurring between St1 and St2 (table 4). Specific conductance remained nearly constant downstream of site St3. Specific conductance measurements in June 2003 were less than those in October 2003, but the pattern was similar with an increase in conductance between sites St1 and St3 and nearly constant specific conductance downstream (fig. 16). The specific conductance measurements likely were lower in June 2003 because flow was predominantly from snowmelt, whereas October 2003 measurements likely had a large ground-water component, and thus had a higher dissolved-solids concentration (Hem, 1985, p. 39).
Water- and air-temperature measurements followed similar trends in June and October 2003. The net increase in water temperature between sites St1 and St6 for June and October generally appears to coincide with an increase in air temperature. Water and air temperatures were lower in June 2003 than October 2003. The higher temperatures in October may simply be caused by normal solar heating of water that occurred throughout the day rather than by ground-water contribution, because the synoptic measurements on Strawberry Creek were made during the morning in June and during the afternoon in October (fig. 16). Regardless of when water temperature is measured, it can be a poor indicator of ground-water contributions to a stream, because many natural factors in addition to ground water can affect the water temperature of a stream. These factors can include solar and longwave radiation, air temperature, evaporation, heat conduction, snowmelt, and precipitation (Constantz and others, 1994).
The increased flow between sites St1 and St2 indicates that ground water adds flow to this stream reach all year. This is supported by an increase in specific conductance, because ground water generally has a higher concentration of dissolved solids than surface runoff. Assuming that all ground water that enters the stream between sites St1 and St2 has a constant specific conductance that is unaffected by chemical reactions in the stream, the specific conductance of ground water entering the stream was estimated using the following equation:
 , (1)
, (1)
where
![]() ,
,
![]() ,
and
,
and ![]() are the specific conductance of ground water, and stream water at sites St1
and St2, respectively, in microsiemens per centimeter; and
are the specific conductance of ground water, and stream water at sites St1
and St2, respectively, in microsiemens per centimeter; and
![]() and
and ![]() are stream discharges at sites St1 and St2, respectively, in cubic feet per
second.
are stream discharges at sites St1 and St2, respectively, in cubic feet per
second.
The estimated specific conductance of ground water
for June 2003 was about 110 µS/cm, whereas it increased to 150 µS/cm in October
2003. The source area for much of the ground-water discharge is the alluvial
and glacial deposits ![]() present on the south side of Strawberry Creek. The lower slope of these deposits
is densely vegetated with phreatophytes. Lesser quantities of ground water also
may discharge from water stored in the alluvium along the creek and possibly
from the intrusive rocks
present on the south side of Strawberry Creek. The lower slope of these deposits
is densely vegetated with phreatophytes. Lesser quantities of ground water also
may discharge from water stored in the alluvium along the creek and possibly
from the intrusive rocks ![]() .
.
The measured loss in stream discharge between sites
St2 and St3 is consistent from spring to autumn although the loss of flow was
greater during spring snowmelt in June 2003 than during low flow in October
2003. The increase in specific conductance between sites St2 and St3 during
June and October indicates that ground water may contribute some flow to sections
of Strawberry Creek downstream of site St2 even though there is a net loss of
flow (fig. 16). The likely source of ground-water
discharge is the alluvial and glacial deposits ![]() that are present downstream of site St2. The increase in specific conductance
cannot be explained by ET losses along the channel because ET rates for June
and October were estimated to range from 0.001 to 0.01 ft3/s (ET
losses are discussed in section “Miscellaneous Measurements”). The loss in stream
discharge between sites St2 and St3 probably occurred along the lower part of
the reach as a result of stream water infiltrating a thin veneer of alluvium
between the end of the alluvial and glacial deposits and site St3 (fig.
3). During snowmelt in June 2003, much of the loss in stream discharge between
sites St2 and St3 was returned to the stream near the fault contact of the intrusive
rocks
that are present downstream of site St2. The increase in specific conductance
cannot be explained by ET losses along the channel because ET rates for June
and October were estimated to range from 0.001 to 0.01 ft3/s (ET
losses are discussed in section “Miscellaneous Measurements”). The loss in stream
discharge between sites St2 and St3 probably occurred along the lower part of
the reach as a result of stream water infiltrating a thin veneer of alluvium
between the end of the alluvial and glacial deposits and site St3 (fig.
3). During snowmelt in June 2003, much of the loss in stream discharge between
sites St2 and St3 was returned to the stream near the fault contact of the intrusive
rocks ![]() and the alluvial slope just downstream of site St4, where there are several
small springs and seeps. The small springs and seeps may result from the thinning
of alluvium associated with the stream near the fault contact. Ground-water
discharge to the stream near the fault contact was insufficient in October 2003
to increase streamflow downstream of site St3.
and the alluvial slope just downstream of site St4, where there are several
small springs and seeps. The small springs and seeps may result from the thinning
of alluvium associated with the stream near the fault contact. Ground-water
discharge to the stream near the fault contact was insufficient in October 2003
to increase streamflow downstream of site St3.
Effects of ground-water withdrawals in Snake Valley
to stream discharge along Strawberry Creek likely will be limited to the area
outside of the park, downstream of the fault contact between the intrusive rocks
![]() and the Tertiary rocks (
and the Tertiary rocks (![]() ;
fig. 16). The intrusive rocks, such as those in
the southern Snake Range, generally act as barriers to ground-water flow (Harrill
and Prudic, 1998). Because shallow alluvium is continuous across the fault,
the effects of ground-water withdrawals in Snake Valley could propagate a short
distance upstream of the fault contact.
;
fig. 16). The intrusive rocks, such as those in
the southern Snake Range, generally act as barriers to ground-water flow (Harrill
and Prudic, 1998). Because shallow alluvium is continuous across the fault,
the effects of ground-water withdrawals in Snake Valley could propagate a short
distance upstream of the fault contact.
The headwaters of Shingle Creek are on the west side
of Wheeler Peak in older undifferentiated rocks ![]() that consist of quartzite, argillite, and shale (table
1). Most of the stream profile has a thin layer of alluvium overlying older
undifferentiated rocks and intrusive rocks (
that consist of quartzite, argillite, and shale (table
1). Most of the stream profile has a thin layer of alluvium overlying older
undifferentiated rocks and intrusive rocks (![]() ;
fig. 17). The stream is perennial along the channel
profile and enters a pipeline at the western end. The pipeline conveys water
down the alluvial slope for irrigation on the valley floor. The alluvial and
glacial deposits (
;
fig. 17). The stream is perennial along the channel
profile and enters a pipeline at the western end. The pipeline conveys water
down the alluvial slope for irrigation on the valley floor. The alluvial and
glacial deposits (![]() ;
fig. 17) are depicted as being thin at least down
to the pipeline because measurements of stream discharge indicate little loss
of flow on the alluvial slope upstream of the pipeline. This implies that the
range-bounding fault is west of the profile. Alternatively, the range-bounding
fault may exist between sites Sh3 and Sh4 and, if so, would substantially increase
the thickness of the alluvial and glacial deposits similar to that at Strawberry
Creek. If a range-bounding fault exists between sites Sh3 and Sh4, then the
alluvial and glacial deposits on the west side of the fault are poorly permeable,
otherwise there would be a noticeable loss in streamflow. The east end of the
pipeline extends only to the edge of the profile indicating that much of the
loss in stream discharge is farther west, thus the range-bounding fault probably
is west of the profile.
;
fig. 17) are depicted as being thin at least down
to the pipeline because measurements of stream discharge indicate little loss
of flow on the alluvial slope upstream of the pipeline. This implies that the
range-bounding fault is west of the profile. Alternatively, the range-bounding
fault may exist between sites Sh3 and Sh4 and, if so, would substantially increase
the thickness of the alluvial and glacial deposits similar to that at Strawberry
Creek. If a range-bounding fault exists between sites Sh3 and Sh4, then the
alluvial and glacial deposits on the west side of the fault are poorly permeable,
otherwise there would be a noticeable loss in streamflow. The east end of the
pipeline extends only to the edge of the profile indicating that much of the
loss in stream discharge is farther west, thus the range-bounding fault probably
is west of the profile.
Stream discharge measured during snowmelt in June 2003 indicated only a slight loss between sites Sh1 and Sh4 (from 2.02 to 1.83 ft3/s, respectively; fig. 17, table 4). A similar loss was measured during low flow in October 2003 between sites Sh1 and Sh4 (from 0.77 to 0.59 ft3/s, respectively), even though measured discharges were only one-third of that in June. The downstream decrease in measured flow on both dates is consistent with a shallow water table within the thin alluvium overlying rocks that transmit only small quantities of water. The specific-conductance values measured in June and October in Shingle Creek are similar to those measured at the uppermost site on Strawberry Creek. Specific conductance was nearly constant between sites Sh1 and Sh4 in June and October although specific conductance was higher in October (fig. 17, table 4).
The synoptic measurements for Shingle Creek were made during the afternoon in June 2003 and in the morning for October 2003. Water and air temperatures were higher in June than in October. Water temperature generally increased 5°C between sites Sh1 and Sh4 in June and 2°C in October. The increases in water temperature between sites Sh1 and Sh4 in June and October correspond to net increases in air temperature.
Streamflow along Shingle Creek would be affected only
by ground-water withdrawals in Spring Valley along the section of the creek
outside of the park boundary, downstream of the intrusive rocks ![]() and upstream of the pipeline (fig. 17). The intrusive
rocks in the middle of the profile act as a barrier to flow. Any increased loss
in stream discharge between the intrusive rocks and the pipeline likely would
lag behind withdrawals in the valley, because ground-water level declines would
take time to propagate through the older undifferentiated rocks
and upstream of the pipeline (fig. 17). The intrusive
rocks in the middle of the profile act as a barrier to flow. Any increased loss
in stream discharge between the intrusive rocks and the pipeline likely would
lag behind withdrawals in the valley, because ground-water level declines would
take time to propagate through the older undifferentiated rocks ![]() beneath the creek.
beneath the creek.
Lehman Creek headwaters begin in glacial deposits that
mantle older undifferentiated rocks ![]() of quartzite, argillite, and shale (table 1). In the
reach upstream of the upper Lehman Creek campground (fig.
5), the stream flows over alluvial and glacial deposits
of quartzite, argillite, and shale (table 1). In the
reach upstream of the upper Lehman Creek campground (fig.
5), the stream flows over alluvial and glacial deposits ![]() that overlie mostly Prospect Mountain Quartzite
that overlie mostly Prospect Mountain Quartzite ![]() .
Intrusive rocks
.
Intrusive rocks ![]() are exposed on either side of Lehman Creek at the base of the mountain near
Lehman Caves, and presumably are continuous beneath the alluvial and glacial
deposits.
are exposed on either side of Lehman Creek at the base of the mountain near
Lehman Caves, and presumably are continuous beneath the alluvial and glacial
deposits.
Undifferentiated sedimentary rocks ![]() of Middle Cambrian Age, mostly the Pole Canyon Limestone (table
1), underlie the alluvial and glacial deposits
of Middle Cambrian Age, mostly the Pole Canyon Limestone (table
1), underlie the alluvial and glacial deposits ![]() downstream of the intrusive rocks; Lehman Caves are in the Pole Canyon Limestone.
The limestone generally dips eastward toward Snake Valley, and is about 1,800
ft thick (Miller and others, 1995b). Farther downstream, Tertiary rocks
downstream of the intrusive rocks; Lehman Caves are in the Pole Canyon Limestone.
The limestone generally dips eastward toward Snake Valley, and is about 1,800
ft thick (Miller and others, 1995b). Farther downstream, Tertiary rocks ![]() crop out on both sides of Lehman Creek and may overlie the Pole Canyon Limestone
beneath Lehman Creek in areas where it has not been completely eroded away.
The thin layer of Tertiary rocks, shown in figure 18,
is based on a conglomerate found at a depth of about 100 ft and a limestone
found at a depth of about 140 ft during the drilling of a test hole for the
Baker Improvement District between sites L3 and L4 (fig.
5; S.J. Billin, Rothberg, Tamburini, and Winsor, Inc., Elko, Nev., written
commun., 2004). Farther east, the alluvial and glacial deposits and Tertiary
rocks thicken (Saltus and Jachens, 1995). Location of the range-bounding fault
is not known precisely but probably is east of site L7.
crop out on both sides of Lehman Creek and may overlie the Pole Canyon Limestone
beneath Lehman Creek in areas where it has not been completely eroded away.
The thin layer of Tertiary rocks, shown in figure 18,
is based on a conglomerate found at a depth of about 100 ft and a limestone
found at a depth of about 140 ft during the drilling of a test hole for the
Baker Improvement District between sites L3 and L4 (fig.
5; S.J. Billin, Rothberg, Tamburini, and Winsor, Inc., Elko, Nev., written
commun., 2004). Farther east, the alluvial and glacial deposits and Tertiary
rocks thicken (Saltus and Jachens, 1995). Location of the range-bounding fault
is not known precisely but probably is east of site L7.
Synoptic-discharge measurements were made at seven
sites along Lehman Creek starting near the contact of the older undifferentiated
rocks ![]() with the alluvial slope, and ending just upstream of the confluence with Baker
Creek (fig. 5). Synoptic measurements were made during
the afternoon in July 2003 and during the morning in October 2003 (table
4). Net increases of 5°C and 2°C in air temperature, and 6°C and 3°C in
water temperature were measured between sites L1 and L7 during July and October,
respectively. The higher water temperatures measured in July may simply be caused
by solar heating of water throughout the day.
with the alluvial slope, and ending just upstream of the confluence with Baker
Creek (fig. 5). Synoptic measurements were made during
the afternoon in July 2003 and during the morning in October 2003 (table
4). Net increases of 5°C and 2°C in air temperature, and 6°C and 3°C in
water temperature were measured between sites L1 and L7 during July and October,
respectively. The higher water temperatures measured in July may simply be caused
by solar heating of water throughout the day.
No measurable difference in stream discharge was observed between sites L1 and L2 during snowmelt in July 2003 or during low-flow conditions in October 2003 (fig. 18). Stream discharge increased slightly in September 1992 over this same reach. Specific-conductance values between sites L1 and L2 were unchanged and considered low in July 2003 (30 µS/cm), and were slightly higher in October 2003 (39 µS/cm) and September 1992 (37 µS/cm). Specific-conductance values indicate low concentrations of dissolved solids, which could mean the rocks upstream of site L1 are resistant to weathering, or that ground water has had a minimal residence time, or both.
Cave Springs, on the south side of Lehman Creek between sites
L1 and L2 (fig. 18), is the water supply for the
park’s operational facilities. The springs discharge about 0.10 ft3/s
(Gretchen Baker, National Park Service, Great Basin National Park, written commun.,
2004) from moraine deposits south of Lehman Creek at about the same altitude
as the creek. The alluvial and glacial deposits ![]() obscure bedrock but the springs are near an outcrop of the Prospect Mountain
Quartzite
obscure bedrock but the springs are near an outcrop of the Prospect Mountain
Quartzite ![]() .
One possibility for the origin of the springs is that the moraine deposits from
which Cave Springs discharge may be resting on older alluvial and glacial deposits
that are less permeable (Menzies, 1995). Alternatively, the springs may represent
a place where the water table intersects land surface near the change in slope
between the mountain and alluvial fan or slope (Theis, 1940).
.
One possibility for the origin of the springs is that the moraine deposits from
which Cave Springs discharge may be resting on older alluvial and glacial deposits
that are less permeable (Menzies, 1995). Alternatively, the springs may represent
a place where the water table intersects land surface near the change in slope
between the mountain and alluvial fan or slope (Theis, 1940).
The specific conductance of water discharging from
Cave Springs is three to four times higher than the specific conductance of
water in Lehman Creek at site L1, and from a nearby spring northwest of site
B2 on Baker Creek (fig. 5; table
4). Specific-conductance measurements at Cave Springs ranged from 116 µS/cm
in July 2003 to 132 µS/cm in October 2004, whereas specific conductance of the
spring near site B2 was 38 µS/cm in May 2004 (Gretchen Baker, National Park
Service, Great Basin National Park, written commun., 2004). Specific-conductance
measurements at site L1 on Lehman Creek ranged from 30 µS/cm in July 2003 to
39 µS/cm in October 2003. One possible explanation for the higher specific conductance
of water discharging from Cave Springs is that the Pole Canyon Limestone ![]() overlies the Prospect Mountain Quartzite
overlies the Prospect Mountain Quartzite ![]() ,
but is buried beneath alluvial and glacial deposits
,
but is buried beneath alluvial and glacial deposits ![]() near the spring (fig. 18). Cave Springs may be present
because intrusive rocks exposed on either side of Lehman Creek may disrupt the
Pole Canyon Limestone downstream of Cave Springs.
near the spring (fig. 18). Cave Springs may be present
because intrusive rocks exposed on either side of Lehman Creek may disrupt the
Pole Canyon Limestone downstream of Cave Springs.
Downstream of site L2, Lehman Creek merges with flow
from Rowland Spring through a series of tributary channels east of the park
boundary (fig. 5). Rowland Spring, at the eastern
edge of the park, is a much larger spring than Cave Springs. The spring discharges
from alluvial and glacial deposits ![]() south of Lehman Creek at an altitude that is about 15 ft higher than the creek.
In July 2003, measured discharge at Rowland Spring was 3.49 ft3/s
and specific conductance was 116 µS/cm, whereas in October 2003, discharge was
2.67 ft3/s and specific conductance was 152 µS/cm.
south of Lehman Creek at an altitude that is about 15 ft higher than the creek.
In July 2003, measured discharge at Rowland Spring was 3.49 ft3/s
and specific conductance was 116 µS/cm, whereas in October 2003, discharge was
2.67 ft3/s and specific conductance was 152 µS/cm.
Rowland Spring is sustained by deeper ground-water flow through
carbonate rocks because discharge at the spring is too large to be explained
by shallow flow through the alluvial and glacial deposits ![]() .
Additionally, water temperatures at Rowland Spring (site L3) were 10°C in July
2003 and 9°C in October 2003 (table 4), which is consistent
with discharge of deeper ground water through carbonate rocks. However, the
source of water for Rowland Spring is uncertain. The alluvial and glacial deposits
in the Lehman Creek drainage consist of clasts from the Prospect Mountain Quartzite
.
Additionally, water temperatures at Rowland Spring (site L3) were 10°C in July
2003 and 9°C in October 2003 (table 4), which is consistent
with discharge of deeper ground water through carbonate rocks. However, the
source of water for Rowland Spring is uncertain. The alluvial and glacial deposits
in the Lehman Creek drainage consist of clasts from the Prospect Mountain Quartzite
![]() .
Because Lehman Creek above Rowland Spring has a low specific conductance, the
much higher specific conductance of the spring cannot be explained by flow through
the alluvial and glacial deposits alone. Two possible sources for the water
discharging at Rowland Spring are eastward ground-water flow through cavernous
carbonate rocks, Pole Canyon Limestone
.
Because Lehman Creek above Rowland Spring has a low specific conductance, the
much higher specific conductance of the spring cannot be explained by flow through
the alluvial and glacial deposits alone. Two possible sources for the water
discharging at Rowland Spring are eastward ground-water flow through cavernous
carbonate rocks, Pole Canyon Limestone ![]() ,
in the Lehman Creek drainage and northeastward ground-water flow through cavernous
carbonate rocks from the Baker Creek drainage (fig. 5).
Such flow from Baker Creek is possible because (1) the Pole Canyon Limestone
between Baker Creek and Rowland Spring has a northeasterly dip, (2) intrusive
rocks exposed along Baker Creek near its confluence with the Pole Canyon tributary
may restrict eastward ground-water flow down Baker Creek, and (3) the elevation
of Baker Creek upstream of site B3 is higher than the altitude of Rowland Spring
(fig. 5). The carbonates become capped east of Rowland
Spring by a cemented conglomerate at the top of the Tertiary rocks
,
in the Lehman Creek drainage and northeastward ground-water flow through cavernous
carbonate rocks from the Baker Creek drainage (fig. 5).
Such flow from Baker Creek is possible because (1) the Pole Canyon Limestone
between Baker Creek and Rowland Spring has a northeasterly dip, (2) intrusive
rocks exposed along Baker Creek near its confluence with the Pole Canyon tributary
may restrict eastward ground-water flow down Baker Creek, and (3) the elevation
of Baker Creek upstream of site B3 is higher than the altitude of Rowland Spring
(fig. 5). The carbonates become capped east of Rowland
Spring by a cemented conglomerate at the top of the Tertiary rocks ![]() (fig. 18), which may confine ground water in the
lower part of the Tertiary rocks and in the carbonate rocks. Excess flow in
the carbonates may discharge upward through the alluvial and glacial deposits
at Rowland Spring.
(fig. 18), which may confine ground water in the
lower part of the Tertiary rocks and in the carbonate rocks. Excess flow in
the carbonates may discharge upward through the alluvial and glacial deposits
at Rowland Spring.
Stream discharge increased between sites L2 and L4 along Lehman Creek (fig. 18) with flow from Rowland Spring accounting for most of the increase. Specific conductance also increased (fig. 18), but was lower at site L4 in July 2003 than in October 2003 because of the higher discharge from snowmelt runoff. About 40 percent of flow from Rowland Spring continued in a separate, parallel channel south of Lehman Creek downstream of site L4 (fig. 5). In 2003, the entire flow of Rowland Spring and Lehman Creek was measured in two channels in July at site L6, and in three channels in October that included one channel at site L5 and two channels at site L6 (fig. 5). No apparent gain or loss in flow was measured between sites L2 and L6 after accounting for Rowland Spring. Although Lehman Creek was split into multiple channels at site L6, specific-conductance measurements were the same for each channel, indicating that all discharge from Rowland Spring had entered Lehman Creek upstream of site L6 (fig. 5).
Trends in stream discharge and specific conductance were similar in September 1992 to those in October 2003 even though only single measurements were made in 1992. Although stream discharge in Lehman Creek generally was higher in September 1992 than in October 2003, the increase in discharge downstream of the park boundary was nearly the same, 2.54 ft3/s compared with 2.58 ft3/s, respectively. The large increase in water temperature in 1992 just upstream of the confluence of Lehman and Baker Creeks (site L7) probably was the result of solar heating (table 3). The water temperature at site L7 was measured in the afternoon as compared to the two upstream measurements that were measured in the morning.
The mean discharge in July 2003 at site L7 (11.7 ft3/s)
was greater than the combined discharge at site L2 on Lehman Creek and Rowland
Spring (9.64 ft3/s; fig. 18, table
4). Because no tributary inflow was observed, the increased flow was from
ground-water discharge to the channel, indicating that the water table intersected
land surface adjacent to the creek between sites L4 and L7. The mean discharge
at site L7 in October 2003 (5.16 ft3/s) was about the same as the
combined mean discharges at site L2 on Lehman Creek and Rowland Spring (5.25
ft3/s; fig. 18,
table 4), indicating no measurable net gain or loss of flow between sites
L2 and L7. The lack of a gain or loss between the sites may indicate that the
water table was slightly lower during the low-flow period but remained near
land surface along the creek. The water table near land surface indicates that
the range-bounding fault that would increase the thickness of the alluvial and
glacial deposits ![]() and Tertiary rocks
and Tertiary rocks ![]() is downstream of site L7.
is downstream of site L7.
The degree to which surface-water resources in the
park could be affected in the Lehman Creek drainage basin is dependent on the
location and quantity of ground water withdrawn. Pumping of ground water near
the park from the Tertiary rocks ![]() or in the Pole Canyon Limestone
or in the Pole Canyon Limestone ![]() would affect flow through the cavernous limestone in the park. Depending on
the quantity of water withdrawn, discharge in Rowland Spring could decrease.
Pumping of ground water in the alluvial and glacial deposits
would affect flow through the cavernous limestone in the park. Depending on
the quantity of water withdrawn, discharge in Rowland Spring could decrease.
Pumping of ground water in the alluvial and glacial deposits ![]() or Tertiary rocks beneath Snake Valley could lower the water table upstream
of site L7 and, depending on the proximity of the pumping and its quantity,
decrease flow along Lehman Creek and the discharges of Rowland Spring and Cave
Springs. Because cavernous carbonate rocks underlie the alluvial and glacial
deposits on the alluvial slope below Lehman Caves, the area downstream of the
intrusive rocks
or Tertiary rocks beneath Snake Valley could lower the water table upstream
of site L7 and, depending on the proximity of the pumping and its quantity,
decrease flow along Lehman Creek and the discharges of Rowland Spring and Cave
Springs. Because cavernous carbonate rocks underlie the alluvial and glacial
deposits on the alluvial slope below Lehman Caves, the area downstream of the
intrusive rocks ![]() could be affected by the withdrawal of large quantities of ground water in the
valley. The intrusive rocks exposed on either side of Lehman Creek likely would
restrict the effects of ground-water withdrawals from extending farther up Lehman
Creek. However, because the alluvial and glacial deposits are continuous across
the intrusive rocks, the effects might extend upstream of the intrusive rocks.
could be affected by the withdrawal of large quantities of ground water in the
valley. The intrusive rocks exposed on either side of Lehman Creek likely would
restrict the effects of ground-water withdrawals from extending farther up Lehman
Creek. However, because the alluvial and glacial deposits are continuous across
the intrusive rocks, the effects might extend upstream of the intrusive rocks.
Baker Creek originates in alluvial and glacial deposits
(QTs) that mantle older undifferentiated rocks ![]() of quartzite, argillite, and shale (table 1; fig.
5). The older undifferentiated rocks are predominantly Prospect Mountain
Quartzite, similar to rocks in the Lehman Creek drainage. The stream crosses
near an outcrop of intrusive rocks
of quartzite, argillite, and shale (table 1; fig.
5). The older undifferentiated rocks are predominantly Prospect Mountain
Quartzite, similar to rocks in the Lehman Creek drainage. The stream crosses
near an outcrop of intrusive rocks ![]() to the north at site B2, and flows over Middle Cambrian undifferentiated sedimentary
rocks
to the north at site B2, and flows over Middle Cambrian undifferentiated sedimentary
rocks ![]() that consist of the Pole Canyon Limestone at the Narrows near site B3. The Pole
Canyon Limestone and the underlying Prospect Mountain Quartzite generally dip
to the east, northeast (Whitebread, 1969; McGrew and others, 1995). The Baker
Creek cave system, similar to Lehman Caves, is located in the Pole Canyon Limestone.
It is the largest known cave system in Nevada (Bridgemon, 1965). Intrusive rocks
just downstream of the confluence of Pole Canyon tributary with Baker Creek
may disrupt the continuity of the Pole Canyon Limestone (fig.
19). Upstream of site B6, Baker Creek is diverted into a ditch that flows
across Tertiary rocks
that consist of the Pole Canyon Limestone at the Narrows near site B3. The Pole
Canyon Limestone and the underlying Prospect Mountain Quartzite generally dip
to the east, northeast (Whitebread, 1969; McGrew and others, 1995). The Baker
Creek cave system, similar to Lehman Caves, is located in the Pole Canyon Limestone.
It is the largest known cave system in Nevada (Bridgemon, 1965). Intrusive rocks
just downstream of the confluence of Pole Canyon tributary with Baker Creek
may disrupt the continuity of the Pole Canyon Limestone (fig.
19). Upstream of site B6, Baker Creek is diverted into a ditch that flows
across Tertiary rocks ![]() ,
and alluvial and glacial deposits that overlie the Tertiary rocks and the Pole
Canyon Limestone. Periodically, high flows overflow the ditch and some flow
continues down the natural drainage channel. Flow in the ditch joins Lehman
Creek just upstream of the concrete-lined channel (fig.
5).
,
and alluvial and glacial deposits that overlie the Tertiary rocks and the Pole
Canyon Limestone. Periodically, high flows overflow the ditch and some flow
continues down the natural drainage channel. Flow in the ditch joins Lehman
Creek just upstream of the concrete-lined channel (fig.
5).
Baker Creek is perennial from the cirque basins at
an altitude of about 11,000 ft to the confluence with Lehman Creek. Synoptic-discharge
measurements were made at seven sites along Baker Creek starting within the
older undifferentiated rocks ![]() and ending just upstream of the confluence with Lehman Creek. The stream flows
over alluvial and glacial deposits
and ending just upstream of the confluence with Lehman Creek. The stream flows
over alluvial and glacial deposits ![]() except between sites B3 and B5, where the deposits thin over an outcrop of Pole
Canyon Limestone
except between sites B3 and B5, where the deposits thin over an outcrop of Pole
Canyon Limestone ![]() ,
and near site B6 where the stream was diverted over Tertiary rocks
,
and near site B6 where the stream was diverted over Tertiary rocks ![]() .
.
Stream discharge increased between sites B1 and B2
in July and October 2003 primarily from the discharge of ground water from recessional
moraines, and discharge of ground water near the contact of the Prospect Mountain
Quartzite ![]() with the intrusive rocks (
with the intrusive rocks (![]() ;
fig. 19). Stream discharge also increased over this
same reach in September 1992. Specific-conductance values for sites B1 and B2
were about the same during snowmelt in July 2003, were slightly higher during
low flow in October 2003, and increased slightly in September 1992 (tables
3 and 4). Specific-conductance values are similar
to those measured at the first two sites (L1 and L2) on Lehman Creek. The low
values indicate water in the stream has had minimal ground-water residence time,
or that the Prospect Mountain Quartzite is resistant to weathering, or both.
;
fig. 19). Stream discharge also increased over this
same reach in September 1992. Specific-conductance values for sites B1 and B2
were about the same during snowmelt in July 2003, were slightly higher during
low flow in October 2003, and increased slightly in September 1992 (tables
3 and 4). Specific-conductance values are similar
to those measured at the first two sites (L1 and L2) on Lehman Creek. The low
values indicate water in the stream has had minimal ground-water residence time,
or that the Prospect Mountain Quartzite is resistant to weathering, or both.
Stream discharge in Baker Creek decreased between sites
B2 and B5 in July and October 2003, and in September 1992 (fig.
19). Most of the loss in flow between sites B2 and B5 in September 1992
occurred along a reach that started midway between sites B2 and B3 and ended
just downstream of site B3 (fig. 5). Flow is lost
directly to the Baker Creek cave system where the Pole Canyon Limestone ![]() crops out along the channel just downstream of site B3. An unnamed tributary
upstream of site B5 contributed a small amount of discharge to Baker Creek in
July 2003. The tributary originates from a seasonal spring upstream of site
B4. Stream discharge measured in the tributary at site B4 in July 2003 was 0.15
ft3/s (table 4). No flow was observed in
the tributary in October 2003, and no discharge measurement was made on the
tributary in September 1992.
crops out along the channel just downstream of site B3. An unnamed tributary
upstream of site B5 contributed a small amount of discharge to Baker Creek in
July 2003. The tributary originates from a seasonal spring upstream of site
B4. Stream discharge measured in the tributary at site B4 in July 2003 was 0.15
ft3/s (table 4). No flow was observed in
the tributary in October 2003, and no discharge measurement was made on the
tributary in September 1992.
Specific-conductance values increased between sites B2 and B5 from 30 to 37 µS/cm during snowmelt runoff in July 2003, but were nearly the same during low flow in October 2003 (39–41 µS/cm; table 4) and in September 1992 (34–35 µS/cm). The slight increase in specific conductance in July may have been from the seasonal spring, which had a specific conductance of 107 µS/cm. Water temperature between sites B2 and B5 increased in July 2003 and September 1992, but remained steady in October 2003 (fig. 19). Although water discharging from the seasonal spring was 3°C cooler than the creek in July 2003, discharge from the spring was insufficient to decrease the stream temperature at site B5 (table 4).
Stream discharge between sites B5 and B6 indicated no measurable change in July and October 2003, but increased slightly in September 1992. The lack of a net increase or decrease in flow during July and October indicates that the ground-water table may have been at or near the water level in the stream channel between the two sites. However, specific conductance increased from 37 to 63 µS/cm in July, from 41 to 63 µS/cm in October (fig. 19, table 4), and from 35 to 72 µS/cm in September 1992 indicating interaction with ground water between the two sites. The increase in specific conductance cannot be explained by ET losses along the channel, which were estimated to be less than 0.01 ft3/s in July and October (ET losses are discussed in section “Miscellaneous Measurements”).
Stream discharge on Baker Creek, downstream of the
park boundary and upstream of the concrete-lined diversion channel, was similar
to discharge along the lower reach of Lehman Creek. Stream discharge increased
slightly between sites B6 and B7 during snowmelt in July 2003 and in September
1992, but decreased slightly during low flow in October 2003. This pattern indicates
that the water table in the alluvial and glacial deposits ![]() and Tertiary rocks
and Tertiary rocks ![]() is seasonally near the water level of the creek. Specific-conductance values
increased between sites B6 and B7 during all three measurement periods (fig.
19), which indicates that shallow ground water is mixing with water in Baker
Creek along this reach. The continued increase in stream discharge and specific
conductance between sites B6 and B7 provides further evidence that the range-bounding
fault is east of the confluence of Lehman and Baker Creeks.
is seasonally near the water level of the creek. Specific-conductance values
increased between sites B6 and B7 during all three measurement periods (fig.
19), which indicates that shallow ground water is mixing with water in Baker
Creek along this reach. The continued increase in stream discharge and specific
conductance between sites B6 and B7 provides further evidence that the range-bounding
fault is east of the confluence of Lehman and Baker Creeks.
The degree to which surface-water resources in the
park could be affected in the Baker Creek drainage basin is dependent on the
location and quantity of ground water withdrawn. Pumping ground water near the
park from the Tertiary rocks ![]() or in the Pole Canyon Limestone
or in the Pole Canyon Limestone ![]() ,
likely would affect flow through the Baker Creek cave system in the park. Depending
on the quantity of water withdrawn, flow in Baker Creek could decrease. Large-scale
withdrawals of ground water in alluvial and glacial deposits
,
likely would affect flow through the Baker Creek cave system in the park. Depending
on the quantity of water withdrawn, flow in Baker Creek could decrease. Large-scale
withdrawals of ground water in alluvial and glacial deposits ![]() or in the Tertiary rocks beneath Snake Valley could lower the water table upstream
of the confluence of Baker and Lehman Creeks, which would decrease flow along
Baker Creek upstream of the park boundary. Intrusive rocks
or in the Tertiary rocks beneath Snake Valley could lower the water table upstream
of the confluence of Baker and Lehman Creeks, which would decrease flow along
Baker Creek upstream of the park boundary. Intrusive rocks ![]() that crop out along Baker Creek near the confluence with Pole Canyon tributary
will restrict the effects of ground-water withdrawals in the valley to surface-water
resources downstream of the outcrop. However, if the Pole Canyon Limestone upstream
of the Pole Canyon tributary is continuous northward to the Lehman Creek drainage,
effects from ground-water withdrawals could propagate south from Lehman Creek
and decrease flow along Baker Creek upstream of the intrusive rocks.
that crop out along Baker Creek near the confluence with Pole Canyon tributary
will restrict the effects of ground-water withdrawals in the valley to surface-water
resources downstream of the outcrop. However, if the Pole Canyon Limestone upstream
of the Pole Canyon tributary is continuous northward to the Lehman Creek drainage,
effects from ground-water withdrawals could propagate south from Lehman Creek
and decrease flow along Baker Creek upstream of the intrusive rocks.
Snake Creek and its tributaries originate in Late Proterozoic
and Early Cambrian Age older undifferentiated rocks ![]() that consist mostly of Prospect Mountain Quartzite (table
1) and have been intruded by intrusive rocks
that consist mostly of Prospect Mountain Quartzite (table
1) and have been intruded by intrusive rocks ![]() ,
all of which have been capped by alluvial and glacial deposits (
,
all of which have been capped by alluvial and glacial deposits (![]() ;
fig. 20). Snake Creek flows over the southern Snake
Range décollement (SSRD) within the upper part of its drainage. The SSRD thinned
the Paleozoic section (Hose and Blake, 1976), and younger rocks lie in fault
contact over older rocks across the décollement. Local metamorphism is limited
to rocks in the lower plate (Hose and Blake, 1976). Upstream of the SSRD, the
creek flows over alluvial and glacial deposits that overlie lower-plate rocks.
The lower-plate rocks in the Snake Creek drainage primarily are Middle Cambrian
;
fig. 20). Snake Creek flows over the southern Snake
Range décollement (SSRD) within the upper part of its drainage. The SSRD thinned
the Paleozoic section (Hose and Blake, 1976), and younger rocks lie in fault
contact over older rocks across the décollement. Local metamorphism is limited
to rocks in the lower plate (Hose and Blake, 1976). Upstream of the SSRD, the
creek flows over alluvial and glacial deposits that overlie lower-plate rocks.
The lower-plate rocks in the Snake Creek drainage primarily are Middle Cambrian
![]() and older undifferentiated rocks (
and older undifferentiated rocks (![]() ;
fig. 20) that consist mostly of Pole Canyon Limestone
and Prospect Mountain Quartzite, respectively. The rocks in the lower plate
generally dip southeast (Whitebread, 1969; McGrew and others, 1995). Downstream
of the SSRD, the alluvial and glacial deposits overlie complexly faulted rocks
of mostly Middle Cambrian or younger age, although a section of Prospect Mountain
Quartzite is in the upper plate where Snake Creek crosses the SSRD (fig.
20). Faulting continues onto the alluvial slope where a narrow section of
younger undifferentiated rocks
;
fig. 20) that consist mostly of Pole Canyon Limestone
and Prospect Mountain Quartzite, respectively. The rocks in the lower plate
generally dip southeast (Whitebread, 1969; McGrew and others, 1995). Downstream
of the SSRD, the alluvial and glacial deposits overlie complexly faulted rocks
of mostly Middle Cambrian or younger age, although a section of Prospect Mountain
Quartzite is in the upper plate where Snake Creek crosses the SSRD (fig.
20). Faulting continues onto the alluvial slope where a narrow section of
younger undifferentiated rocks ![]() ,
consisting mostly of limestone and dolomite of the Guilmette Formation (Whitebread,
1969), is exposed adjacent to the channel at site Sn7 (fig.
20).
,
consisting mostly of limestone and dolomite of the Guilmette Formation (Whitebread,
1969), is exposed adjacent to the channel at site Sn7 (fig.
20).
A pipeline was constructed to divert flow in Snake
Creek at the contact of the intrusive rocks ![]() and the lower-plate rocks (fig. 20). The pipeline
continues across the SSRD and ends near the contact of Prospect Mountain Quartzite
and the lower-plate rocks (fig. 20). The pipeline
continues across the SSRD and ends near the contact of Prospect Mountain Quartzite
![]() with the younger undifferentiated rocks
with the younger undifferentiated rocks ![]() .
The pipeline is designed to divert about 3 ft3/s of water (Gretchen
Baker, National Park Service, Great Basin National Park, oral commun., 2005).
The location of the pipeline indicates that considerable flow is lost along
Snake Creek where it traverses the Pole Canyon Limestone
.
The pipeline is designed to divert about 3 ft3/s of water (Gretchen
Baker, National Park Service, Great Basin National Park, oral commun., 2005).
The location of the pipeline indicates that considerable flow is lost along
Snake Creek where it traverses the Pole Canyon Limestone ![]() and Prospect Mountain Quartzite
and Prospect Mountain Quartzite ![]() of the lower-plate rocks.
of the lower-plate rocks.
During the synoptic measurements in June 2003, stream
discharge upstream of the pipeline exceeded the flow capacity of the pipe and
excess flow continued down the natural channel. Stream discharge between sites
Sn1 and Sn2, upstream and downstream of the pipeline, decreased from 15.5 to
12.9 ft3/s, which indicates that considerable flow was lost along
the natural channel adjacent to the pipeline (fig. 20).
During low flow in October 2003, all stream discharge at site Sn1 (1.05 ft3/s)
was diverted into the pipeline. Additional flow from seeps and small springs
was observed entering the channel just upstream of the end of the pipeline and
site Sn2. The seeps and small springs discharge from the Prospect Mountain Quartzite
![]() .
The combined discharge of the pipeline and flow from the seeps and springs resulted
in a slight increase in stream discharge of 0.09 ft3/s at site Sn2
in October 2003 (table 4). The measured increase at
site Sn2 is similar to the measured increase of 0.16 ft3/s in September
1992 (fig. 20).
.
The combined discharge of the pipeline and flow from the seeps and springs resulted
in a slight increase in stream discharge of 0.09 ft3/s at site Sn2
in October 2003 (table 4). The measured increase at
site Sn2 is similar to the measured increase of 0.16 ft3/s in September
1992 (fig. 20).
Specific conductance measured in September 1992 immediately
downstream of the lower end of the pipeline (142 µS/cm) was higher than water
that entered the pipeline (115 µS/cm), and water that was discharging from the
springs and seeps in the quartzite above the lower end of the pipeline (99 µS/cm;
table 3 and fig. 20).
The specific conductance of the seeps and springs is consistent with lower conductance
of water discharging from quartzite. However, the specific conductance was higher
than the conductance of water discharging from quartzite in Strawberry, Shingle,
Baker, and Lehman Creeks (table 4). This may be caused
by greater ET of precipitation prior to recharge, because the quartzite in the
Snake Creek drainage is at a lower altitude. The increase in specific conductance
downstream of the lower end of the pipeline corresponds to a slight increase
in stream discharge, and likely is caused by ground-water discharge from the
Pioche Shale near its contact with the Prospect Mountain Quartzite ![]() .
.
The lower 1.5 mi of the pipeline may be unnecessary
because the underlying outcrops of Prospect Mountain Quartzite (![]() ;
Whitebread, 1969) are not very permeable. One possibility for why the pipeline
was extended is that increased fractures are present in the quartzite in the
upper plate. However, the quartzite in the upper plate is limited and underlain
by Pioche Shale (
;
Whitebread, 1969) are not very permeable. One possibility for why the pipeline
was extended is that increased fractures are present in the quartzite in the
upper plate. However, the quartzite in the upper plate is limited and underlain
by Pioche Shale (![]() ;
Whitebread, 1969) that generally is a barrier to ground-water flow. Additionally,
discharge at seeps and small springs near the contact of the Prospect Mountain
Quartzite with the Pioche Shale at the end of the pipeline indicates that much
of the water in the quartzite and shale does not leave the Snake Creek drainage
as ground-water flow, but rather, is discharged back to the creek.
;
Whitebread, 1969) that generally is a barrier to ground-water flow. Additionally,
discharge at seeps and small springs near the contact of the Prospect Mountain
Quartzite with the Pioche Shale at the end of the pipeline indicates that much
of the water in the quartzite and shale does not leave the Snake Creek drainage
as ground-water flow, but rather, is discharged back to the creek.
Flow in Snake Creek that is lost to the Pole Canyon
Limestone ![]() ,
may not return to Snake Creek within the drainage area. The general southeast
dip of rocks in the lower plate indicates that water lost to the Pole Canyon
Limestone may flow out of the upper part of the Snake Creek drainage as ground
water. Two possible areas where this ground-water flow may discharge are Big
Springs at the southeast corner of the southern Snake Range, or as ET on the
valley floor adjacent to Big Springs and Lake Creeks southeast of the Snake
Creek drainage (pl. 1).
,
may not return to Snake Creek within the drainage area. The general southeast
dip of rocks in the lower plate indicates that water lost to the Pole Canyon
Limestone may flow out of the upper part of the Snake Creek drainage as ground
water. Two possible areas where this ground-water flow may discharge are Big
Springs at the southeast corner of the southern Snake Range, or as ET on the
valley floor adjacent to Big Springs and Lake Creeks southeast of the Snake
Creek drainage (pl. 1).
Stream discharge increased between sites Sn2 and Sn3 from 12.9
to 13.9 ft3/s in June 2003, but decreased from 1.14 to 0.92 ft3/s
in October 2003 (fig. 20, table
4). Much of the streamflow at site Sn3 in October was ground-water discharge
from younger undifferentiated rocks ![]() consisting predominantly of faulted and fractured limestone of the Pogonip Group.
This is supported by a marked increase in specific conductance between sites
Sn2 and Sn3 from 162 to 258 µS/cm in October. Specific conductance only increased
from 113 to 124 µS/cm along this same reach in June 2003, indicating most of
the flow was from snowmelt runoff (fig. 20, table
4).
consisting predominantly of faulted and fractured limestone of the Pogonip Group.
This is supported by a marked increase in specific conductance between sites
Sn2 and Sn3 from 162 to 258 µS/cm in October. Specific conductance only increased
from 113 to 124 µS/cm along this same reach in June 2003, indicating most of
the flow was from snowmelt runoff (fig. 20, table
4).
An increase in specific conductance between sites Sn2 and Sn3 also was measured in September 1992; however, an additional measurement was made midway between sites Sn2 and Sn3 that indicates the increase in specific conductance occurred within the lower part of the reach (fig. 20). The increase measured in September 1992 is consistent with stream discharge whereby flow decreased along the upper part of the reach between sites Sn2 and Sn3 and increased along the lower part of the reach (fig. 20).
The channel of Snake Creek crosses a fault just downstream
of site Sn3. The Eureka Quartzite ![]() forms the base of the southwest dipping block of the fault on the upstream side
of the creek (fig. 20). Although the fault block
that includes the Eureka Quartzite is highly fractured, the quartzite forms
a sufficient barrier to ground-water flow and causes ground water to be close
to the level of the stream upstream of the fault. Lush vegetation along the
channel upstream of site Sn3 indicates that measured gains during June 2003
were real. Downstream of the fault, the younger undifferentiated rocks
forms the base of the southwest dipping block of the fault on the upstream side
of the creek (fig. 20). Although the fault block
that includes the Eureka Quartzite is highly fractured, the quartzite forms
a sufficient barrier to ground-water flow and causes ground water to be close
to the level of the stream upstream of the fault. Lush vegetation along the
channel upstream of site Sn3 indicates that measured gains during June 2003
were real. Downstream of the fault, the younger undifferentiated rocks ![]() consist of highly fractured rocks of the Cambrian and Ordovician Pogonip Group
(fig. 20; Whitebread, 1969; McGrew and others, 1995).
At the park boundary, a slight decrease in stream discharge was observed between
sites Sn3 and Sn4 in June 2003 (0.2 ft3/s); whereas, stream discharge
decreased by 0.92 ft3/s in October 2003 (fig.
20) indicating that the ground-water level is closer to the water level
in the stream during the spring and summer than in the autumn. No flow was observed
in the channel at site Sn4 in October 2003.
consist of highly fractured rocks of the Cambrian and Ordovician Pogonip Group
(fig. 20; Whitebread, 1969; McGrew and others, 1995).
At the park boundary, a slight decrease in stream discharge was observed between
sites Sn3 and Sn4 in June 2003 (0.2 ft3/s); whereas, stream discharge
decreased by 0.92 ft3/s in October 2003 (fig.
20) indicating that the ground-water level is closer to the water level
in the stream during the spring and summer than in the autumn. No flow was observed
in the channel at site Sn4 in October 2003.
Spring Creek originates from a spring discharging at
the fault contact of the Laketown and Fish Haven Dolomites ![]() with the alluvial and glacial deposits
with the alluvial and glacial deposits ![]() and Tertiary rocks (
and Tertiary rocks (![]() ;
fig. 20). Spring Creek enters Snake Creek downstream
of the Spring Creek Rearing Station. The rearing station diverts most of Spring
Creek water and some of Snake Creek water into fish-rearing ponds before returning
the flow to Snake Creek downstream of the ponds. Discharge of Snake Creek between
sites Sn4 and Sn6, downstream of the Spring Creek Rearing Station, increased
during June and October 2003 and in September 1992.
;
fig. 20). Spring Creek enters Snake Creek downstream
of the Spring Creek Rearing Station. The rearing station diverts most of Spring
Creek water and some of Snake Creek water into fish-rearing ponds before returning
the flow to Snake Creek downstream of the ponds. Discharge of Snake Creek between
sites Sn4 and Sn6, downstream of the Spring Creek Rearing Station, increased
during June and October 2003 and in September 1992.
Discharge of Spring Creek just upstream of the fish-rearing ponds was 2.02 ft3/s in June 2003 and 1.78 ft3/s in October 2003, which indicates that discharge of Spring Creek did not change substantially during the year. Subtracting the discharge of Spring Creek from the discharge measured at site Sn6 provides an estimate of the discharge of Snake Creek immediately upstream of the Spring Creek Rearing Station (fig. 20). The estimated stream discharge upstream of the rearing station in June 2003 indicates that the stream continued to lose flow downstream of site Sn4, whereas the estimated stream discharge upstream of the rearing station in October 2003 indicates that the stream gained flow downstream of site Sn4 (fig. 20). Although there was no flow at site Sn4 during the October 2003 measurements, Snake Creek began flowing about 1 mi downstream of site Sn4 because of ground-water discharge to the creek. The estimated gain in flow upstream of the rearing station is supported by measured increases in discharge between sites Sn4 and Sn6 in September 1992 (fig. 20).
Snake Creek gains flow near the fault contact between
the younger undifferentiated rocks ![]() and the Tertiary rocks
and the Tertiary rocks ![]() upstream of site Sn6 (fig. 20). Stream discharge
was nearly the same over the Tertiary rocks indicating that ground-water exchange
with Snake Creek from the wedge of Tertiary rocks is minor compared with ground-water
exchange with the limestone and dolomites in the younger undifferentiated rocks
(table 4, fig. 20). The
source of ground water that discharges into Snake and Spring Creeks probably
is from the younger undifferentiated rocks within the upper plate, and includes
most of the water lost to the younger undifferentiated rocks along Snake Creek
in the upper part of the reach between sites Sn3 and Sn6 (fig.
20). Increased specific conductance in Snake Creek measured at site Sn6,
corroborates a ground-water source to the creek (table
4).
upstream of site Sn6 (fig. 20). Stream discharge
was nearly the same over the Tertiary rocks indicating that ground-water exchange
with Snake Creek from the wedge of Tertiary rocks is minor compared with ground-water
exchange with the limestone and dolomites in the younger undifferentiated rocks
(table 4, fig. 20). The
source of ground water that discharges into Snake and Spring Creeks probably
is from the younger undifferentiated rocks within the upper plate, and includes
most of the water lost to the younger undifferentiated rocks along Snake Creek
in the upper part of the reach between sites Sn3 and Sn6 (fig.
20). Increased specific conductance in Snake Creek measured at site Sn6,
corroborates a ground-water source to the creek (table
4).
In addition to snowmelt runoff, stream discharge in
Snake Creek upstream of the confluence with Spring Creek during June 2003 includes
some ground water that was discharged to the creek from limestone and dolomites
in the younger undifferentiated rocks ![]() near the fault contact with the Tertiary rocks (
near the fault contact with the Tertiary rocks (![]() ;
fig. 20). The quantity of this discharge was estimated
using the measured flows and specific conductances at sites Sn4, Sn5, and Sn6
(table 4), and the following equation:
;
fig. 20). The quantity of this discharge was estimated
using the measured flows and specific conductances at sites Sn4, Sn5, and Sn6
(table 4), and the following equation:
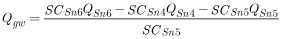 , (2)
, (2)
where ![]() ,
,
![]() ,
and
,
and ![]() are the specific conductance of stream water, at sites Sn4, Sn5, and Sn6, respectively,
in microsiemens per centimeter; and
are the specific conductance of stream water, at sites Sn4, Sn5, and Sn6, respectively,
in microsiemens per centimeter; and ![]() ,
,
![]() ,
, ![]() ,
and
,
and ![]() are stream discharges at sites Sn4, Sn5, and Sn6 and from ground water between
sites Sn4 and Sn6, respectively, in cubic feet per second.
are stream discharges at sites Sn4, Sn5, and Sn6 and from ground water between
sites Sn4 and Sn6, respectively, in cubic feet per second.
Specific conductance of the ground water discharging to Snake Creek between sites Sn4 and Sn6 was assumed to be the same as that measured in Spring Creek upstream of the rearing station, 329 µS/cm at site Sn5 (table 4). Assuming there is no change in specific conductance resulting from chemical reactions in the stream and in the fish-rearing ponds, the calculated discharge of ground water to Snake Creek upstream of the contact of the Tertiary rocks (site Sn4) was 0.9 ft3/s in June 2003, or about 40 percent greater than estimated ground-water discharge for October 2003 (0.6 ft3/s). This indicates that ground-water discharge to Snake Creek upstream of the Tertiary rock contact has a similar variation as the discharge of Spring Creek (2.02 ft3/s in June 2003 and 1.78 ft3/s in October 2003 at site Sn5; table 4).
Stream discharge did not change downstream of site Sn6, however slight decreases were observed between sites Sn7 and Sn8 during low flow in October 2003 and September 1992 (fig. 20). Specific conductance was nearly constant between sites Sn7 and Sn8 during June and October 2003, but decreased slightly during low flow in September 1992. This may indicate that ground-water levels along Snake Creek are close to the water level in the creek.
Ground-water withdrawals in Snake Valley potentially
could affect surface-water resources along Snake Creek depending on the proximity
of wells and the quantity of water pumped. Large quantities of ground-water
withdrawals near the Snake Creek drainage in the alluvial and glacial deposits
![]() ,
the Tertiary rocks
,
the Tertiary rocks ![]() ,
or in the limestone and dolomites in the younger undifferentiated rocks
,
or in the limestone and dolomites in the younger undifferentiated rocks ![]() ,
likely would affect stream discharge along Snake Creek including the spring
that forms Spring Creek. If the Eureka Quartzite
,
likely would affect stream discharge along Snake Creek including the spring
that forms Spring Creek. If the Eureka Quartzite ![]() is an effective barrier to ground-water flow, then the effects of ground-water
withdrawals would be limited to the upper plate downstream of site Sn3. However,
if the Eureka Quartzite is only a partial barrier to flow, the effects potentially
could extend at least to site Sn2 where the Pioche Shale
is an effective barrier to ground-water flow, then the effects of ground-water
withdrawals would be limited to the upper plate downstream of site Sn3. However,
if the Eureka Quartzite is only a partial barrier to flow, the effects potentially
could extend at least to site Sn2 where the Pioche Shale ![]() probably is a barrier to ground-water flow. Even if the Eureka Quartzite is
an effective barrier to ground-water flow, effects of large-scale ground-water
withdrawals from wells drilled on the valley floor and into the limestone southeast
of the Snake Creek drainage could decrease ground-water levels in the Pole Canyon
Limestone
probably is a barrier to ground-water flow. Even if the Eureka Quartzite is
an effective barrier to ground-water flow, effects of large-scale ground-water
withdrawals from wells drilled on the valley floor and into the limestone southeast
of the Snake Creek drainage could decrease ground-water levels in the Pole Canyon
Limestone ![]() in the area where much of the flow in Snake Creek is diverted into a pipeline.
Thus, depending on the effectiveness of the Eureka Quartzite as a barrier to
ground-water flow, either a small part or a substantial part of Snake Creek
within the park potentially could be affected by ground-water withdrawals.
in the area where much of the flow in Snake Creek is diverted into a pipeline.
Thus, depending on the effectiveness of the Eureka Quartzite as a barrier to
ground-water flow, either a small part or a substantial part of Snake Creek
within the park potentially could be affected by ground-water withdrawals.
The headwaters of South Fork Big Wash begin in the
upper plate of the SSRD within Devonian to Middle Cambrian rocks (fig.
6, table 1; Whitebread, 1969). The younger undifferentiated
rocks (![]() ;
fig. 21) consist mostly of the Notch Peak Limestone
and limestones of the Pogonip Group; whereas, the Middle Cambrian undifferentiated
sedimentary rocks
;
fig. 21) consist mostly of the Notch Peak Limestone
and limestones of the Pogonip Group; whereas, the Middle Cambrian undifferentiated
sedimentary rocks ![]() consist mostly of the Lincoln Peak Formation and Johns Wash Limestone (Whitebread,
1969). The upper plate rocks are highly faulted and fractured (Hose and Blake,
1976; McGrew, 1993). The Pole Canyon Limestone, in the Middle Cambrian undifferentiated
sedimentary rocks
consist mostly of the Lincoln Peak Formation and Johns Wash Limestone (Whitebread,
1969). The upper plate rocks are highly faulted and fractured (Hose and Blake,
1976; McGrew, 1993). The Pole Canyon Limestone, in the Middle Cambrian undifferentiated
sedimentary rocks ![]() ,
outcrops along the channel at a break or ‘window’ in the upper plate. Downstream
of the window and upstream of the confluence with North Fork Big Wash, the South
Fork crosses onto the upper-plate rocks that include the Middle Cambrian Lincoln
Peak Formation and the undivided Laketown and Fish Haven Dolomites, Sevy Dolomite,
and Guilmette Formation (
,
outcrops along the channel at a break or ‘window’ in the upper plate. Downstream
of the window and upstream of the confluence with North Fork Big Wash, the South
Fork crosses onto the upper-plate rocks that include the Middle Cambrian Lincoln
Peak Formation and the undivided Laketown and Fish Haven Dolomites, Sevy Dolomite,
and Guilmette Formation (![]() ;
fig. 21, table 1; Whitebread,
1969; McGrew and others, 1995).
;
fig. 21, table 1; Whitebread,
1969; McGrew and others, 1995).
North Fork Big Wash originates in the lower plate of
the SSRD, east of Mount Washington (fig. 1). The
rocks of the lower plate mostly are of Middle Cambrian Pole Canyon and Lincoln
Peak Limestones ![]() although higher in the drainage, the channel crosses over outcrops of Lower
Cambrian Pioche Shale and Prospect Mountain Quartzite (
although higher in the drainage, the channel crosses over outcrops of Lower
Cambrian Pioche Shale and Prospect Mountain Quartzite (![]() ;
fig. 6). Near the confluence with South Fork, the
North Fork crosses onto the upper plate of the SSRD where it continues over
highly faulted and fractured limestone and dolomite of the younger undifferentiated
rocks (
;
fig. 6). Near the confluence with South Fork, the
North Fork crosses onto the upper plate of the SSRD where it continues over
highly faulted and fractured limestone and dolomite of the younger undifferentiated
rocks (![]() ;
table 1). No evidence of flow was observed in North
Fork near the confluence with South Fork during the study, which indicates that
the Middle Cambrian Pole Canyon and Lincoln Peak Limestones are permeable.
;
table 1). No evidence of flow was observed in North
Fork near the confluence with South Fork during the study, which indicates that
the Middle Cambrian Pole Canyon and Lincoln Peak Limestones are permeable.
Downstream of the confluence of the two forks, the
channel of Big Wash enters a valley that is about 500 ft wide and has been incised
into Tertiary rocks ![]() overlain by alluvium (fig. 6). Tertiary conglomerates
form cliffs along the sides of the valley. Younger undifferentiated rocks
overlain by alluvium (fig. 6). Tertiary conglomerates
form cliffs along the sides of the valley. Younger undifferentiated rocks ![]() consisting of Notch Peak Limestone, Eureka Quartzite, and limestones of the
Pogonip Group (Whitebread, 1969) outcrop along the north side of the valley
immediately downstream of the Humboldt National Forest boundary (fig.
6). Farther downstream, the channel crosses over Tertiary rocks covered
by a thin layer of alluvium.
consisting of Notch Peak Limestone, Eureka Quartzite, and limestones of the
Pogonip Group (Whitebread, 1969) outcrop along the north side of the valley
immediately downstream of the Humboldt National Forest boundary (fig.
6). Farther downstream, the channel crosses over Tertiary rocks covered
by a thin layer of alluvium.
The uppermost measurement site (BW1) on South Fork
Big Wash is near the contact between the Lincoln Peak Formation (![]() ;
fig. 21) and the undivided Laketown and Fish Haven
Dolomites
;
fig. 21) and the undivided Laketown and Fish Haven
Dolomites ![]() ,
in which bedding generally is poorly developed or obscured by fractures (Whitebread,
1969). The site is upstream of an unnamed spring (site BW2) that provides perennial
flow to South Fork between sites BW1 and BW3 (fig. 21).
South Fork is intermittent where the Pole Canyon Limestone
,
in which bedding generally is poorly developed or obscured by fractures (Whitebread,
1969). The site is upstream of an unnamed spring (site BW2) that provides perennial
flow to South Fork between sites BW1 and BW3 (fig. 21).
South Fork is intermittent where the Pole Canyon Limestone ![]() is exposed upstream of the confluence with the unnamed spring tributary.
is exposed upstream of the confluence with the unnamed spring tributary.
Stream discharge at site BW1 on South Fork was 3.02
ft3/s during snowmelt in June 2003, and the channel was dry during
low flow in October 2003 (fig. 21, table
4). Discharge from the unnamed spring near site BW1 was 1.49 ft3/s
during snowmelt in June and decreased to 0.30 ft3/s during low flow
in October (site BW2). Specific conductance of the unnamed spring was 370 µS/cm
in June, whereas it increased to 456 µS/cm in October. The specific conductance
of the unnamed spring was similar to that of Spring Creek. Both springs discharge
from the younger undifferentiated rocks ![]() ,
and have higher specific conductances than Rowland Spring and Cave Springs in
the Lehman Creek drainage. The unnamed spring, however, had seasonal variations
in discharge and water temperature, whereas Spring Creek had less variability
in discharge and water temperature (table 4). Seasonal
variations in spring discharge and water temperature are indicative of water
that has rapidly moved through permeable rocks, whereas water that has remained
in the rocks longer exhibits constant discharge and temperature (Mazor, 2004,
p. 54).
,
and have higher specific conductances than Rowland Spring and Cave Springs in
the Lehman Creek drainage. The unnamed spring, however, had seasonal variations
in discharge and water temperature, whereas Spring Creek had less variability
in discharge and water temperature (table 4). Seasonal
variations in spring discharge and water temperature are indicative of water
that has rapidly moved through permeable rocks, whereas water that has remained
in the rocks longer exhibits constant discharge and temperature (Mazor, 2004,
p. 54).
Ground-water levels are close to the water level of the stream, at least seasonally, between sites BW1 and BW3, which allows for much of the reach to be perennial. Stream discharge at site BW3, upstream of the park boundary, was 4.51 ft3/s during snowmelt in June 2003 and 0.06 ft3/s during low flow in October 2003. The flow at site BW3 in June was the same as the sum of discharges measured at sites BW1 and BW2; whereas, flow in October was a fraction of that measured from spring discharge at site BW2 (fig. 21).
Stream discharge was about the same from sites BW3 to BW4 during snowmelt in June 2003; however, South Fork ceased flowing less than 0.2 mi downstream of site BW3 during low flow in October 2003. Specific conductance remained nearly constant between sites BW3 and BW4 in June (table 4, fig. 21), which is consistent for a reach that is either not gaining flow or is steadily losing flow.
Most of Big Wash between its confluence with the two forks and the border of Nevada and Utah is intermittent, except for three short reaches in which springs and seeps discharge water to the channel and flow is perennial. Within the upper two reaches, flow is perennial immediately upstream and downstream of two major constrictions in the valley floor. The first constriction is a large alluvial fan that enters the valley from the north between sites BW4 and BW5 (figs. 6 and 21). Cottonwoods populate the valley floor upstream of the alluvial fan where several springs and seeps discharge into a large meadow. No flow was observed in the channel at site BW4 in October 2003, and the measured stream discharge at site BW5 downstream of the alluvial fan was 0.14 ft3/s. During snowmelt runoff in June 2003, flow remained constant between sites BW4 and BW5. However, specific conductance increased (fig. 21) indicating ground water in the meadow was contributing to the overall discharge in the stream at site BW5.
A second constriction occurs immediately upstream of
site BW6 where large landslide blocks within the Tertiary rocks ![]() are exposed along the valley walls and on the valley floor (fig.
21). The landslide blocks consist of Notch Peak Limestone from the younger
undifferentiated rocks (
are exposed along the valley walls and on the valley floor (fig.
21). The landslide blocks consist of Notch Peak Limestone from the younger
undifferentiated rocks (![]() ;
table 1; Whitebread, 1969; McGrew and others, 1995),
and probably were placed during deposition of the Tertiary rocks. The blocks
are monolithologic (McGrew and others, 1995), and do not exhibit fracturing
or bedding typical of in-place limestone within the southern Snake Range. Similar
to the first constriction, a large meadow is present immediately upstream of
the landslide blocks. The channel is not incised in the large meadow or where
the blocks are exposed along the walls of the valley. Springs and seeps in the
meadow contribute flow to the channel.
;
table 1; Whitebread, 1969; McGrew and others, 1995),
and probably were placed during deposition of the Tertiary rocks. The blocks
are monolithologic (McGrew and others, 1995), and do not exhibit fracturing
or bedding typical of in-place limestone within the southern Snake Range. Similar
to the first constriction, a large meadow is present immediately upstream of
the landslide blocks. The channel is not incised in the large meadow or where
the blocks are exposed along the walls of the valley. Springs and seeps in the
meadow contribute flow to the channel.
Stream discharge between sites BW5 and BW6 increased about 0.6 ft3/s in June 2003 during snowmelt runoff and 0.4 ft3/s during low flow in October 2003 (fig. 21). The increase in stream discharge correlates with an increase in specific conductance on both dates. The specific conductance of ground water for June and October was estimated using equation 1, but values from sites BW5 and BW6 were substituted in place of the sites on Strawberry Creek. The estimated specific conductance of ground water was about 700 µS/cm in June, whereas it was 500 µS/cm in October. The greater value in June indicates that either ground water discharging in the meadow has higher salt concentrations during the summer, that more salts are added to the channel by dissolution of the streambed, or that some streamflow was lost downstream of site BW5 and upstream of the meadow that is just upstream of site BW6. The estimated evaporation directly from the stream channel was too small to account for the increase in specific conductance. Assuming the specific conductance of ground water did not change between June and October, the estimated loss upstream of the meadow and additional ground-water discharge in the meadow was estimated using the following equation:
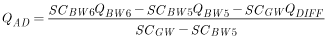 ,
(3)
,
(3)
where ![]() ,
,
![]() ,
and
,
and ![]() are the specific conductances of stream water at sites BW5, BW6, and ground
water from October 2003, respectively, in microsiemens per centimeter; and
are the specific conductances of stream water at sites BW5, BW6, and ground
water from October 2003, respectively, in microsiemens per centimeter; and ![]() ,
,
![]() ,
,
![]() ,
and
,
and ![]() are stream discharges at sites BW5 and BW6, the difference in discharge between
BW5 and BW6, and additional ground-water exchange between sites BW5 and BW6,
respectively, in cubic feet per second.
are stream discharges at sites BW5 and BW6, the difference in discharge between
BW5 and BW6, and additional ground-water exchange between sites BW5 and BW6,
respectively, in cubic feet per second.
The loss downstream of site BW5 and upstream of the meadow, and the additional ground-water discharge in the meadow was about 1 ft3/s. Thus, the change in specific conductance measured at site BW6 can be explained by a loss of 1 ft3/s in streamflow downstream of site BW5, and an overall gain in streamflow from ground-water discharge in the meadow of about 1.6 ft3/s.
The decrease in water temperature between sites BW5
and BW6 during October 2003 indicates that ground water discharging in the meadow
upstream of the slide blocks is colder than water in the stream at site BW5.
The source of ground water in the meadow is unknown but the higher specific
conductance, when compared with other stream drainages, indicates that it may
have considerable residence time in the alluvium, Tertiary rocks ![]() ,
or possibly in the underlying carbonate rocks.
,
or possibly in the underlying carbonate rocks.
Downstream of site BW6, the last measurement site,
the channel becomes deeply incised, about 20 ft deep by 30 ft wide, and flow
in this section is intermittent. The channel becomes perennial upstream of where
limestone and quartzite ![]() outcrop along the north side of the valley (fig. 6),
and the channel is no longer deeply incised. Farther downstream, the channel
becomes incised again and flow is intermittent.
outcrop along the north side of the valley (fig. 6),
and the channel is no longer deeply incised. Farther downstream, the channel
becomes incised again and flow is intermittent.
Ground-water withdrawals from the alluvial and glacial
deposits ![]() or the Tertiary rocks
or the Tertiary rocks ![]() in the Big Wash drainage could potentially affect surface-water resources along
perennial reaches downstream of the park boundary depending on the proximity
of wells and the quantity of water pumped. Pumping large quantities of ground
water in Snake Valley would have little effect on flow in the Big Wash drainage,
except for perhaps the three short perennial reaches downstream of the park
boundary. Perennial sections of Big Wash seem to be controlled by local constrictions
within the Tertiary rocks, or from structurally controlled spring discharge
within the highly faulted and fractured upper plate rocks within the park boundary.
Such localized discharges likely would be unaffected by the lowering of ground-water
levels in the continuous and less disrupted limestone rocks in the lower plate
of the SSRD. The short perennial reach at Hidden Canyon Ranch (fig.
6) may be ground-water discharge from the limestone and dolomites in the
younger undifferentiated rocks
in the Big Wash drainage could potentially affect surface-water resources along
perennial reaches downstream of the park boundary depending on the proximity
of wells and the quantity of water pumped. Pumping large quantities of ground
water in Snake Valley would have little effect on flow in the Big Wash drainage,
except for perhaps the three short perennial reaches downstream of the park
boundary. Perennial sections of Big Wash seem to be controlled by local constrictions
within the Tertiary rocks, or from structurally controlled spring discharge
within the highly faulted and fractured upper plate rocks within the park boundary.
Such localized discharges likely would be unaffected by the lowering of ground-water
levels in the continuous and less disrupted limestone rocks in the lower plate
of the SSRD. The short perennial reach at Hidden Canyon Ranch (fig.
6) may be ground-water discharge from the limestone and dolomites in the
younger undifferentiated rocks ![]() that crop out along the north side of the ranch. Ground-water withdrawals likely
would affect this perennial reach in a manner similar to Spring Creek in the
adjacent Snake Creek drainage.
that crop out along the north side of the ranch. Ground-water withdrawals likely
would affect this perennial reach in a manner similar to Spring Creek in the
adjacent Snake Creek drainage.
The North Fork Big Wash marks the transition from low-permeability rocks to generally high-permeability rocks in the southern Snake Range. Low-permeability rocks result in greater stream discharge in drainages to the north (Weaver, Strawberry, Lehman, Baker, Snake, Shingle, Pine, and Ridge Creeks and Williams Canyon fig. 1, pl. 1); whereas, high-permeability rocks result in little to no stream discharge in drainages to the south (South Fork Big Wash, Lexington Creek, Big Spring Wash, Decathon Canyon, Johns Wash, and Murphy Wash) and west (Lincoln Canyon).
Streams, springs, and seeps north of North Fork Big
Wash that are likely or potentially susceptible to ground-water withdrawals
are limited to areas underlain by alluvial and glacial deposits ![]() ,
Tertiary rocks
,
Tertiary rocks ![]() ,
limestones and dolomites within the Devonian and Upper Cambrian younger undifferentiated
rocks
,
limestones and dolomites within the Devonian and Upper Cambrian younger undifferentiated
rocks ![]() ,
and limestones within the Middle Cambrian undifferentiated sedimentary rocks
(
,
and limestones within the Middle Cambrian undifferentiated sedimentary rocks
(![]() ;
pl. 1). These areas include the lower
Snake Creek drainage, which was divided into a likely susceptible area downstream
of where the Eureka Quartzite
;
pl. 1). These areas include the lower
Snake Creek drainage, which was divided into a likely susceptible area downstream
of where the Eureka Quartzite ![]() crosses Snake Creek, and an area that potentially is susceptible upstream of
the Eureka Quartzite. A third and smaller area that potentially is susceptible
to ground-water withdrawals is where Snake Creek crosses the Middle Cambrian
Pole Canyon Limestone
crosses Snake Creek, and an area that potentially is susceptible upstream of
the Eureka Quartzite. A third and smaller area that potentially is susceptible
to ground-water withdrawals is where Snake Creek crosses the Middle Cambrian
Pole Canyon Limestone ![]() .
This reach of Snake Creek was diverted into a pipeline prior to the establishment
of Great Basin National Park, because considerable discharge is lost as the
stream flows over the limestone. Stream discharge in June 2003 exceeded the
capacity of the pipe and flow continued down the natural channel. More than
15 percent of the total flow, including flow diverted into the pipeline, was
lost throughout this reach. This section of Snake Creek potentially is susceptible
to ground-water withdrawals if the ground-water level in the Pole Canyon Limestone
is close to the altitude of the stream. Lowering of the ground-water level might
induce additional losses.
.
This reach of Snake Creek was diverted into a pipeline prior to the establishment
of Great Basin National Park, because considerable discharge is lost as the
stream flows over the limestone. Stream discharge in June 2003 exceeded the
capacity of the pipe and flow continued down the natural channel. More than
15 percent of the total flow, including flow diverted into the pipeline, was
lost throughout this reach. This section of Snake Creek potentially is susceptible
to ground-water withdrawals if the ground-water level in the Pole Canyon Limestone
is close to the altitude of the stream. Lowering of the ground-water level might
induce additional losses.
Important surface-water resources within the park boundary
in the Lehman and Baker Creeks drainages likely are susceptible to ground-water
withdrawals, including Rowland Spring and Cave Springs. The susceptible areas
generally are limited to the alluvial and glacial deposits ![]() and limestones
and limestones ![]() ,
including the Lehman and Baker Creeks cave systems, downstream of the intrusive
rocks
,
including the Lehman and Baker Creeks cave systems, downstream of the intrusive
rocks ![]() and the Cambrian and Proterozoic older undifferentiated rocks
and the Cambrian and Proterozoic older undifferentiated rocks ![]() .
In areas where the Prospect Mountain Quartzite
.
In areas where the Prospect Mountain Quartzite ![]() is in direct contact with the Middle Cambrian Pole Canyon Limestone
is in direct contact with the Middle Cambrian Pole Canyon Limestone ![]() and where the intrusive rocks are well below the ground-water table, water-level
declines from ground-water withdrawals in Snake Valley could propagate farther
upstream than delineated because the Prospect Mountain Quartzite has some permeability
(pl. 1).
and where the intrusive rocks are well below the ground-water table, water-level
declines from ground-water withdrawals in Snake Valley could propagate farther
upstream than delineated because the Prospect Mountain Quartzite has some permeability
(pl. 1).
Surface-water resources along Strawberry Creek and
streams on the northeast side of the park, including Weaver Creek, likewise
are susceptible to large-scale ground-water withdrawals in Snake Valley. The
susceptible areas, however, are outside of the park boundary, downstream of
intrusive rocks ![]() ,
and on the alluvial slopes. On the west side of the southern Snake Range, likely
susceptible areas also are outside of the park boundary, and limited to streams
on the alluvial slopes between the mountain front and where water is diverted
into pipelines including Shingle, Pine, and Ridge Creeks and Williams Canyon.
,
and on the alluvial slopes. On the west side of the southern Snake Range, likely
susceptible areas also are outside of the park boundary, and limited to streams
on the alluvial slopes between the mountain front and where water is diverted
into pipelines including Shingle, Pine, and Ridge Creeks and Williams Canyon.
Surface water in the park south and west of North Fork
Big Wash is limited to areas where low-permeability rocks are exposed, for example,
intrusive rocks ![]() along Lexington Creek or where springs discharge from blocks of carbonate rocks
in the upper plate of the décollement that structurally have been isolated from
the carbonate rocks in the lower plate (pl.
1). Consequently, any additional ground-water level declines beneath and
adjacent to the park south and west of North Fork Big Wash probably would not
affect the surface-water resources in this area. However, a large percentage
of ground-water flow beneath the south end of the park discharges at Big Springs
on the southeast side of the southern Snake Range, and at numerous springs at
the change in slope between the valley floor of Spring Valley and the alluvial
slope on the west side of the southern Snake Range.
along Lexington Creek or where springs discharge from blocks of carbonate rocks
in the upper plate of the décollement that structurally have been isolated from
the carbonate rocks in the lower plate (pl.
1). Consequently, any additional ground-water level declines beneath and
adjacent to the park south and west of North Fork Big Wash probably would not
affect the surface-water resources in this area. However, a large percentage
of ground-water flow beneath the south end of the park discharges at Big Springs
on the southeast side of the southern Snake Range, and at numerous springs at
the change in slope between the valley floor of Spring Valley and the alluvial
slope on the west side of the southern Snake Range.
Large-scale ground-water withdrawals in the valleys likely would affect the discharge of the springs on the southeast and west sides of the southern Snake Range, and streamflow along Big Springs Creek and Lake Creek. These areas, although not studied in detail, probably represent areas that drain ground water as described by Theis (1940). Thus, the spring-discharge areas, Big Springs Creek, Lake Creek, and Pruess Lake were included as areas where surface-water resources likely are susceptible to ground-water withdrawals in Snake and Spring Valleys (pl. 1). Big Springs and the numerous springs at the base of the alluvial slopes on the west side of the southern Snake Range could be affected by ground-water withdrawals similar to springs in Pahrump and Las Vegas Valleys. Large-scale ground-water withdrawals from aquifers in the valleys lowered hydraulic heads and caused springs to stop flowing (Malmberg, 1965, p. 59; Harrill, 1976, p. 43; Harrill, 1986, p. 22).
For more information about USGS activities in Nevada, visit the USGS Nevada Water Science Center home page.

![]() U.S.
Department of the Interior | U.S. Geological
Survey
U.S.
Department of the Interior | U.S. Geological
Survey
Persistent URL: https://pubs.water.usgs.gov/sir20065099
Page Contact Information: Publications
Team
Page Last Modified:
Thursday, 01-Dec-2016 19:06:03 EST
