Scientific Investigations Report 2009–5078
ResultsHydrologic Conditions During 2004–07Spring runoff in the lower Yakima River was notably low during 2004, and exceptionally low during 2005 compared to historical conditions (fig. 5) because of below-average snowpack in the Cascade Range during these years. Compared with the long-term (1906–2007) mean that contained 84 years of record, daily streamflows for March 1 through June 30 in 2004, 2005, 2006, and 2007 were 57, 27, 98, and 113 percent of mean, respectively, and for July 1 through September 30 were 113, 60, 74, and 80 percent of mean, respectively. Reach Delineation According to Aquatic Plant Conditions, Geomorphology, and HabitatThe results from the June 2004 longitudinal assessment (fig. 6; table 3) were used to delineate three distinct reaches of the lower Yakima River based on geomorphology and habitat, hydrology, and aquatic plant conditions (table 4). The Zillah reach (a combination of pools and runs, with abundant periphyton growth and sparse macrophyte growth) extended from the upstream edge of the study area at RM 116 to RM 72 upstream of Satus Creek. The Mabton reach (comprising two long pools, with sparse periphyton and macrophyte growth) extended from RM 72 to Prosser Dam (RM 47). The Kiona reach (comprising mostly runs, with abundant macrophyte and epiphytic algae growth) extended from RM 47 to RM 4 where the river is influenced by backwater from the Columbia River. Longitudinal Patterns in Nutrient, Chlorophyll a, and Suspended Sediment Conditions, 2004The lowest nutrient concentrations measured during the 2004 synoptic survey were in the Naches River and in the Zillah reach upstream of the major agricultural returns (Granger Drain, Satus Creek, South Drain, and Sulphur Creek Wasteway) that start at about RM 83 (fig. 7). The concentrations of all nutrients except dissolved ammonia increased through the Mabton reach, which contained the major agricultural returns, and remained unchanged or decreased slightly in the Kiona reach. All but one of the Chl a concentrations in the water column were below the nuisance threshold. The exeption was at RM 55 in the Mabton reach. Suspended sediment concentrations generally were low throughout the lower Yakima River during the 2004 synoptic survey (less than 15 mg/L), except for a concentration of 53 mg/L that was measured at RM 61. The four highest loads of total nitrogen and total phosphorus during the 2004 synoptic survey were measured upstream of the two major irrigation diversions at Parker (RM 104), in the Mabton reach, and at Kiona, whereas the lowest loads were measured in the Zillah reach downstream of the diversions near Parker (fig. 8; appendix E (PDF, 224 KB)). The largest contributor of total nitrogen and total phosphorus load to the Zillah reach was the Yakima River itself, which delivers nutrients from the Kittitas and Selah valleys. The next largest contributor of total nitrogen load to the Zillah reach was tributary inflow followed by the city of Yakima wastewater treatment plant and the return for Roza Canal. The remainder of the total phosphorus load was contributed almost equally by the city of Yakima wastewater treatment plant, tributaries, and the return for the Roza Canal. The load of total nitrogen was reduced by 83 percent and the load of total phosphorus was reduced by 74 percent, however, near Parker because of an 80 percent reduction in streamflow due to the diversion of water for irrigation needs. About equal amounts of the loads of total nitrogen and total phosphorus in the Mabton reach came from upstream and from nutrient-rich agricultural return drains (mostly from Sulphur Creek Wasteway) and tributary inputs. Almost all loads of total nitrogen and total phosphorus in the Kiona reach entered from upstream. Description of Aquatic Plant Occurrence and Biomass 2004–07Periphytic algae (primarily diatoms, green algae, and blue-green algae) and several species of rooted macrophytes were observed throughout lower Yakima River during the 2004 qualitative assessment, but the patterns in abundance of algal and macrophyte growth differed considerably between the three reaches (table 3). AlgaeThe Zillah reach was dominated by periphytic algae, including colonial stalked and other types of attached diatoms (Cymbella, Gomphonema, and many others). Filamentous blue-green algae (Oscillatoria) and filamentous green algae (Cladophora, Stigeoclonium, Spirogyra, and Ulothrix), which developed during spring and summer in laminar flow habitats, riffles, and shallow runs, also were present. Periphytic algae were especially abundant in shallow riffles of the Zillah reach, where the Chl a values ranged from 29 to 340 mg/m2 (table 5). The median Chl a in the Zillah reach was 80 mg/m2—about two times greater than the median for the Naches River (44 mg/m2; range 20–70 mg/m2). The median AFDM also was higher in the Zillah reach (24 g/m2, range 11–147 g/m2) than in the Naches River (15 g/m2, range 9–23 g/m2). Thirty-nine percent of the samples obtained from the Zillah reach during 2005–07 exceeded the nuisance threshold of 100 mg/m2 for Chl a, but all the samples that exceeded 100 mg/m2 were collected in 2006 and no samples collected in the Zillah reach between July and September 2007 exceeded 100 mg/m2. The median Chl a and AFDM levels in the Zillah reach in 2006 were significantly greater than the median levels in the Zillah reach and Naches River in 2007, but the median levels in the Zillah reach and Naches River in 2007 were not significantly different from each other (fig. 9). Algal biomass measured on the cobble and gravel substrates in the Zillah reach and Naches River were positively related to near-bed water velocity (relation not shown). The median Chl a of 14 samples collected where the near-bed velocity was less than 0.7 ft/s was 162 mg/m2, compared to 47 mg/m2 for 6 samples collected where the near-bed velocity was greater than 0.7 ft/s. The median AFDM of 14 samples collected where the near-bed velocity was less than 0.7 ft/s was 31 g/m2, compared to 17 g/m2 for 6 samples collected where the near-bed velocity was greater than 0.7 ft/s. Phytoplankton was the dominant type of aquatic plant in the Mabton reach, but some sparse patches of periphyton also were observed. Concentrations of water-column Chl a in the Mabton reach were consistently higher than concentrations in the other reaches. The median water-column Chl a concentration in the Mabton reach was 13.1 µg/L, compared to median concentrations of 4.6 and 4.4 µg/L in the Zillah and Kiona reaches, respectively (table 6). Algal abundance in the Kiona reach during the 2004 qualitative assessment was moderate to high and was dominated by diatoms and filamentous green algae. Several types of periphyton also were observed attached to macrophytes at that time. 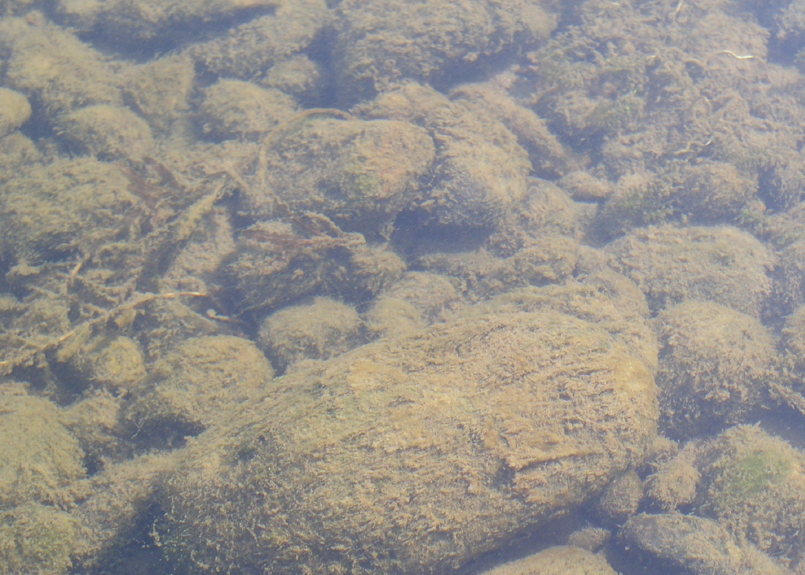
Periphytic algae in the Yakima River near Zillah, Washington. (Phoograph by Marie Zuroske, South Yakima Conservation District, August 2007.) MacrophytesMacrophyte growth was moderate-to-abundant in the Kiona reach and dominated by water stargrass (Heteranthera dubia), which extended across the entire river in many places in 2004 and 2005. In the Zillah reach, macrophyte growth generally was sparse-to-moderate and dominated by curlyleaf pondweed (Potomogeton crispus), but other species were present—common waterweed (Elodea sp.), sago pondweed (Potamogeton pectinatus), American pondweed (Potamogeton nodosus), and coontail (Ceratophyllum demersum). Macrophytes were less abundant in the Mabton reach than in the other two reaches—generally sparse and only present near the river’s edge. In late August 2005, the median dry weight of macrophyte biomass measured in the Kiona reach was 1,020 g/m2. Although some macrophyte growth was measured in the Mabton and Zillah reaches during the sampling in 2005, the median values for both reaches were equal to zerobecause most of the quadrats contained no macrophytes. The concentrations of total nitrogen and total phosphorus content measured in a limited number of the macrophyte tissue samples obtained from the Zillah and Kiona reaches in 2005 (table 7) were above the critical concentrations of 1.6 percent for nitrogen and 0.14 percent for phosphorus (Madsen, 1988), indicating that macrophyte growth was not limited by either of these nutrients in these reaches. Macrophyte abundance was substantially greater in the Kiona reach in 2005 than in 2006 and 2007, with median biomass values of 1,020, 32, and 84 g/m2 in 2005, 2006, and 2007, respectively (table 8). A comparison of the 95 percent confidence intervals for median biomass showed that the median biomass was significantly greater in 2005 compared to 2006 and 2007, but that the medians in 2006 and 2007 were not significantly different. Although there was no strong linear relation between macrophyte biomass and either water depth or water velocity in the Kiona reach at the locations sampled in 2005–07, macrophyte biomass was consistently lower and less variable where depths were greater than 8 ft and velocities were greater than about 1.8 ft/s (fig. 10).
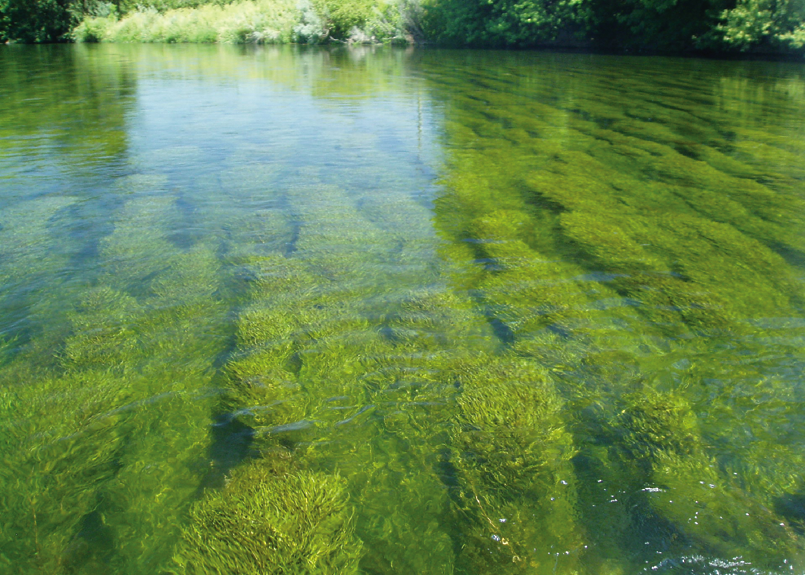
Water stargrass beds in the Yakima River near Kiona, Washington, when water turbidity was about 0 FNU. (Photograph by Kurt Carpenter, U.S. Geological Survey, July 2005.)
Effects of Aquatic Plant Growth on Dissolved Oxygen and pH ConditionsThe diverse aquatic-plant and heterotrophic assemblages in lower Yakima River had pronounced effects on water quality by causing large daily fluctuations in dissolved oxygen concentrations and pH. These effects on dissolved oxygen and pH conditions were observed during the growing season in all three reaches of the lower Yakima River, but they varied between seasons, between years, and between reaches. Periphyton likely was the aquatic plant most responsible for the daily swings in dissolved oxygen and pH in the Zillah reach, because the macrophyte growth was sparse and the relatively low summer concentrations of Chl a in the water column (fig. 11C) indicated that phytoplankton production was minimal in this reach. The median daily ranges in dissolved oxygen concentration and pH in the Zillah reach were 4.6 mg/L and 1.5 units between March 1 and June 30, 2005, and the median daily ranges in dissolved oxygen concentration and pH between March 1 and June 30, 2006 were 1.7 mg/L and 0.6 units. The difference between 2005 and 2006 apparently was due to the combined effects of dilution from higher streamflow and deeper and more turbid water that reduced light available for algal photosynthesis. In contrast to spring conditions, the median daily range in dissolved oxygen concentration and pH in the Zillah reach between July 1 and September 30, 2005 was exactly the same as the median daily range between July 1 and September 30, 2006 (4.4 mg/L and 1.4 pH units). Although macrophyte and algal abundance in the Mabton reach was less than in the Zillah and Kiona reaches, signs of productivity occurred nearly continuously from March through September 2005—the median daily ranges in dissolved oxygen concentration and pH were 3 mg/L and 0.6 units respectively, with numerous cycles of growth and productivity in 2005 that likely were associated with phytoplankton growth (fig. 11B). The large increase in the daily median total chlorophyll concentration (9–28 µg/L) in the Mabton reach in late May and early June 2005 (compared to 3–6 µg/L in early May and mid-June), along with supersaturated dissolved oxygen conditions (220 percent saturation) and pH as high as 9.2 units (fig. 11B) indicated that an algal bloom could have occurred in this reach. During this time the total chlorophyll values measured at the monitor installed upstream in the Zillah reach were not elevated, which also indicated that a phytoplankton bloom (rather than periphyton sloughing) had occurred in the Mabton reach. Signs of plant productivity occurred nearly continuously in the Kiona reach between March 1 and September 30 in 2004 and 2005 (fig. 11A), which was consistent with the abundant macrophyte growth observed during the low to extremely low spring streamflows in those years. The effects of plant productivity were suppressed, however, during the average snowmelt periods that occurred between March and June in 2006 and 2007. The median daily ranges in dissolved oxygen concentrations between March 1 and June 30 in 2004–07 were 4.8, 5.7, 0.9, and 1.0 mg/L, respectively, and the median daily ranges in pH were 1.1, 0.9, 0.2, and 0.3 units. In contrast to the spring results, no significant differences were noted between the median daily ranges between July 1 and September 30, 2004–07 in dissolved oxygen concentrations (6.1, 6.7, 6.9, and 7.0 mg/L, respectively) and pH (1.0, 1.1, 1.0, and 1.1 units, respectively). Water Temperature, Dissolved Oxygen, pH, and Turbidity ConditionsYakima and Naches Rivers, 2004The daily maximum water temperature during 2004 was greater than the Washington State standard of 21°C during each monitor deployment in the Zillah and Mabton reaches from late June through late August, and in the Kiona reach from early June through early September (fig. 12A). The water was generally clear during the 2004 irrigation season throughout the lower Yakima River and in the Naches River (fig. 13)—the daily median turbidity was less than 10 FNU during almost all monitor deployments. The turbidity generally was greatest in the Mabton reach and lowest in the Kiona reach. During 2004, the dissolved oxygen concentrations were greater than the Washington State standard of 8 mg/L every day during each monitor deployment in April (fig. 12B), but beginning in mid-May the daily minimum dissolved oxygen concentrations throughout the lower Yakima River were less than 8 mg/L, and the concentrations were less than 6 mg/L between late June and late August from RM 87 to RM 8. In September 2004, the daily minimum dissolved oxygen concentrations were less than 8 mg/L only in the Kiona reach. The daily maximum pH levels were greater than the Washington State standard of 8.5 at all the stations, including the Naches River, during some periods in April through October 2004 (fig. 12C). Elevated pH levels in the Yakima River at the upstream edge of the study area (where the late season maximum values were above 9.0) and in the Naches River in August indicated that flow from upstream drainages contributed high-pH water to the lower Yakima River. The high pH at these locations also was partly due to the low alkalinity of the water. Kiona, Mabton, and Zillah Reaches, 2004–07The water temperature, dissolved oxygen concentrations, and pH levels in all three reaches of the lower Yakima River exceeded the Washington State standards throughout the irrigation seasons of 2004–07, but generally were most severe during the low-flow period between July 1 and September 30 of each year (table 9). Kiona ReachThe daily maximum water temperatures at Kiona consistently were greater than the Washington State standard of 21°C from mid-June through early September during all 4 years (fig. 14A). The daily median turbidity values consistently were less than 5 FNU starting in mid-May 2004, March 2005, and early July 2006 and 2007 and the highest daily median turbidity values generally occurred during periods with the greatest streamflow. The water also was clearer at Kiona during summer (July 1– September 30) in 2004 and 2005 compared to 2006 and 2007—the median turbidity during summer 2004 and 2005 was 0.7 FNU, compared to 2.5 FNU in 2006 and 2007. This result likely was partly due to the substantial differences in macrophyte abundance between years, because suspended particles are removed when water flows through macrophyte beds. The daily minimum dissolved oxygen concentrations at Kiona were less than the Washington State standard of 8 mg/L starting in early May 2004, early April 2005, late June 2006, and mid-June 2007, and generally remained below 8 mg/L through September in all 4 years (fig. 14B). The dissolved oxygen concentrations were less than 4 mg/L in 2004 and 2005 (starting in late June and late May, respectively), but were never less than 4 mg/L in 2006 and were less than 4 mg/L on only one day in 2007. In 2004 and 2005, the daily maximum pH levels at Kiona were almost always greater than the Washington State standard of 8.5, whereas in 2006 and 2007 there were extended periods in the spring when the maximum daily pH levels were less than 8.5 (fig. 14C). The dissolved oxygen concentration at Kiona was less than 8 mg/L on more than 40 percent of the days during October 2004 and 2005, but was never less than 8 mg/L between November and February during 2005–07 (table 10). The pH level at Kiona was greater than 8.5 on 21 to 57 percent of days in February during 2005–07 and 17 to 53 percent of days in November during 2004–06. December and January were the only months in which the pH level was not greater than 8.5 during any year. Zillah and Mabton ReachesThe daily maximum water temperature was consistently above the Washington State standard of 21°C from mid-June through early September at Mabton and Zillah in 2005 and above 21°C from early July through late August at Zillah in 2006 (fig. 15A). The patterns in daily median turbidity for Zillah and Mabton were similar to those for Kiona—consistently low turbidity at both sites in 2005 and elevated turbidity values during 2006 at Zillah during periods of high flow. Some differences were noted between the three reaches, however, within the lower range of the turbidity values measured between March 1 and September 30, 2005. Although the median daily turbidity values were similar at Zillah and Kiona, the values at Mabton were greater—the median for that period at Mabton was 4.9 FNU, compared to 1.5 at Zillah and 0.7 at Kiona. Although the daily minimum dissolved oxygen concentrations in 2005 and 2006 at Mabton and Zillah were not as low as those measured at Kiona, the values still were generally below the Washington State standard of 8 mg/L from early June through mid-August at Mabton in 2005, mid-April through September at Zillah in 2005, and early July through September at Zillah in 2006 (fig. 15B). The daily maximum pH levels at Zillah generally exceeded the Washington State standard of 8.5 during the entire irrigation season of 2005, but were generally below 8.5 between April and late June in 2006, after which the levels were consistently above 8.5 through September (fig. 15C). The daily maximum pH levels at Mabton in 2005 frequently exceeded 8.5 starting in early March, were greatest in late May (as high as 9.0), and consistently exceeded 8.5 from mid July through late September. Summer Results for All Reaches, 2004–07The mean daily maximum water temperature at Kiona and Mabton during summer (July 1–August 31) was not significantly different between years, but the mean daily maximum value was significantly less at Zillah in 2005 and 2006 than at Mabton in 2005 and at Kiona in all years (fig. 16A).Summer dissolved oxygen conditions generally were most severe at Kiona and least severe at Mabton (fig. 16B). The mean daily minimum dissolved oxygen concentration at Kiona during summer in 2004, 2005, and 2007 was significantly less than the mean daily minimum values at Zillah and Mabton during any year. The pattern in the summer pH conditions was similar to the pattern for dissolved oxygen—most severe at Kiona and least severe at Mabton (fig. 16C). The mean daily maximum pH level was not significantly different at Kiona in 2006 and 2007, between Kiona in 2006 and Zillah in 2006 and 2007, or between Kiona in 2004 and Mabton in 2005. The mean daily minimum dissolved oxygen concentrations measured at Kiona during summer were negatively related to the level of macrophyte biomass—the lowest mean daily minimum values occurred in 2004 and 2005 when macrophyte biomass was high and the highest daily minimum mean daily values occurred in 2006 and 2007 when macrophyte biomass was low. In contrast, the mean daily maximum summer pH levels at Kiona were not related to the level of macrophyte biomass. Although the highest mean daily maximum pH level was in 2005 when macrophyte biomass was high, the lowest mean daily maximum pH level was in 2004 when macrophyte growth was also quite substantial (45 percent of locations surveyed in the Kiona reach during early summer 2004 were described as having abundant macrophyte growth). It is not known what caused the mean daily maximum summer pH value at Kiona in 2004 to be significantly lower than the mean daily maximum values in 2006 and 2007 and not significantly different from the mean daily maximum value at Mabton in 2005 (where there was generally sparse algal and macrophyte growth). Results from Reach-Scale Assessments, 2005–07Nutrient Conditions in Zillah Reach and Naches River, 2006 and 2007, and their Relation to Periphyton BiomassThe concentrations of DIN and SRP measured in the Zillah reach between July and October 2006 and 2007 were significantly greater than the concentrations measured in the Naches River (which were close to the method detection limits for these nutrients) (fig. 17), and measurements made in the Zillah reach during 2005–07 showed that the nutrients in the river were being supplemented by ground water inflow at certain locations. Of the 14 sites in the Zillah reach where the pore water from the hyporheic zone (area below the streambed) was sampled during 2005–07, higher nitrite plus nitrate concentrations in the pore water than in the surface water were detected at 10 sites (fig. 18A) and higher SRP concentrations in the pore water than in the surface water were detected at 12 sites (fig. 18B). Of the seven sites where the pressure difference between the surface water and pore water also was measured in the Zillah reach in 2006 and 2007, three sites showed a positive pressure difference (upwelling) and four sites showed a negative pressure difference (downwelling). Periphyton biomass in the Zillah reach in 2006 and 2007 was not positively related to surface-water nutrient concentrations—greater biomass generally corresponded to lower nutrient concentrations (figs. 19 and 20). Although the summer nutrient concentrations in the lower Naches River generally were lower than those in the Zillah reach in 2007, the median algal biomass in the two reaches was not significantly different (fig. 9). Nutrient Uptake in the Kiona and Zillah Reaches, 2005–07Sampling results from this study did not show that surface-water nutrients were removed by aquatic plants in the Kiona reach. The differences between nutrient concentrations at the upstream and downstream boundaries of a 2 mi section of the Kiona reach in July and August 2005, when the macrophyte canopy cover was estimated to be 90 percent, were less than the analytical reporting levels for the parameters that were measured. These results were not consistent with those from research in the Potomac River at the border between Maryland and Virginia, where researchers determined a 10–60 percent reduction in the water-column nitrate load over a 2 mi reach with 40–100 percent macrophyte canopy cover (primarilywater stargrass)(Nancy Rybicki, U.S. Geological Survey, written commun., 2008). Sampling results from this study showed that surface-water nutrients likely were being removed by periphyton in the Zillah reach. Despite multiple nutrient sources in the Zillah reach, the concentrations of DIN and SRP during summer in 2006 and 2007 decreased between RM 103 and RM 87 (fig. 21). Additionally, in 5 out of 10 sets of samples, the decreases in the concentrations of DIN and SRP between the upstream and downstream sites were in proportion to the Redfield ratio (7:1). These two observations, combined with the nuisance-level periphyton growth, indicated that the longitudinal decrease in nutrients measured in the Zillah reach was due to uptake by periphyton. These results also indicated, however, that the 1.5 mi of the Zillah reach sampled in July and August in 2005 might not have been long enough to measure longitudinal nutrient uptake. As was the case in the Kiona reach, the differences between nutrient concentrations at the upstream and downstream monitoring stations were less than the analytical reporting levels for the parameters that were measured. Periphytometer Experiments in the Zillah Reach and Naches River, 2006–07The periphytometer results from 2006 and 2007 indicated that the Zillah reach was nutrient limited during 2 of the 11 periphytometer deployments. During July and August 2006 periphyton productivity was limited by nitrogen at RM 89. At this site, the mean control accrual rate was significantly less than the mean nitrogen-addition accrual rate (fig. 22A). The mean control accrual rate at RM 89 also was significantly less than the mean control accrual rate at RM 92. No remaining sites showed any significant difference between treatments during July and August 2006. No N plus P addition treatment was available during July and August 2006. In contrast to the July and August periphytometer deployments, the September and October 2006 deployments did not indicate any trend towards single nutrient limitation (fig. 22B). Although mean accrual rates were similar for all treatments at any one site, the mean accrual rate was slightly greater under the addition of N and P at RM 103, indicating possible colimitation of periphyton productivity by N and P. The mean control accrual rates during September and October 2006 increased downstream, with a significant increase between RM 103 and RM 87. The results from 2006 also indicated a strong seasonal production cycle for periphyton. At two of the four sites studied in 2006 the mean control accrual rates during September and October were significantly less than the mean control rates during July and August; the mean control accrual rates at the other two sites also were less (but not significantly). The mean control accrual rates measured in the Yakima River during August and September 2007 generally were between the maximum and minimum mean control accrual rates measured in 2006 (fig. 22C). The exception was at RM 103, where the mean control accrual rate during August and September 2007 was significantly less than the mean control accrual rates at all but one of the other sites during 2006 and 2007. Mean control accrual rates in the Zillah reach increased significantly between RM 103 and RM 87 during August and September 2007, and periphyton productivity was limited by nitrogen at RM 103. The maximum mean control accrual rate in 2007 was measured at the Kiona site (RM 30). Replicate periphytometer deployments done at RM 87 during August and September 2007 showed no significant difference in mean control accrual rates between screened and unscreened experiments, indicating that the effect of grazing was not significant. The mean control accrual rate for all of the Yakima River periphytometer deployments in 2006 and 2007 was 16 mg/m2/day Chl a with grazers excluded, which compared favorably with published rates for the Columbia River that ranged from 6 to 11 mg/m2/day Chl a with grazers present (Cushing, 1967) and other published estimates of periphyton accrual rates (1 to 100 mg/m2/day Chl a) (Grimm and Fisher, 1986; Flipo and others, 2007). During July and August 2007, all mean control accrual rates in the Naches River were significantly greater than the mean control accrual rate in the Zillah reach at RM 103, but not significantly different than the mean control accrual rate at RM 87, and were almost always significantly greater than the mean control accrual rates in the Zillah reach during September and October 2006 (fig. 22D). The lower Naches River also exhibited strong N limitation that was not observed in the Zillah reach in 2007. Comparison of the control accrual rates with the accrual rates from the N addition indicated that control productivity in the Naches River was at 50 percent to 60 percent of nutrient-saturated productivity. The pattern of increasing downstream periphyton productivity in the Zillah reach in 2007 was supported by the results from the continuous water-quality monitoring conducted during the periphytometer experiments. The ranges in dissolved oxygen concentrations and pH (indicators of plant productivity) measured at RM 87 during the July and August, 2007 and August and September, 2007 monitor deployments were greater than the ranges measured at RM 103 (fig. 23B, C). The water temperature, dissolved oxygen concentration, and pH in the Zillah reach varied longitudinally during the periphytometer experiments in July and August 2006 and 2007 and generally exceeded the Washington State standards more often at the downstream locations compared with the upstream locations (table 11). Gross Primary Productivity in the Kiona and Zillah Reaches, 2005–07The median spring (March 1–June 30) GPP value at Kiona in 2005 was significantly greater by 4 times than the median values in 2006 and 2007 (fig. 24A). Spring 2005 was a period of extremely low streamflow for the Yakima River compared to historical conditions, whereas spring 2006 and 2007 were periods of average streamflow compared to historical conditions. The differences between spring GPP in the Kiona reach between years was consistent with the pattern in macrophyte biomass measured in late summer (1,020 g/m2 in 2005, 32 g/m2 in 2006, and 84 g/m2 in 2007). The median summer (July 1–August 31) GPP value at Kiona in 2005 was significantly greater than the median summer GPP values at Zillah in 2005 and at Kiona in 2006 and 2007 (fig. 24B). In contrast to the spring GPP values for Kiona, however, the difference between the median summer GPP value at Kiona in 2005 (21.7 g/m2/d) and the median values in 2006 and 2007 (19.6 and 18.0 g/m2/d, respectively) were not consistent with the large differences between macrophyte biomass measured during those years. The net summer primary productivity (see text box on primary productivity) at Kiona and Zillah was consistently around zero in 2005, meaning that there was generally a balance between the formation and consumption of organic matter in those reaches (the carbon produced by the autrophic organisms during daytime photosynthesis was in balance with carbon consumed by the heterotrophic organisms during respiration). In contrast, the net summer primary productivity at Kiona was consistently positive in 2006 and 2007, meaning that there was generally a net gain of organic matter in that reach (the autotrophic organisms were producing more carbon than was being consumed by the heterotrophic organisms). Evaluation of Light Availability in the Kiona Reach, 2005–07Sufficient light was available for macrophyte growth in the Kiona reach during most of the spring and summer during 2005, but only during the summer during 2006 and 2007. Between late April and late August 2005 and between late June and late August 2006 and 2007, the maximum depths of plant colonization were equal to or greater than the water depth at the Kiona gaging station (fig. 25), which represented the mean depth of much of the reach—indicating that there was sufficient light for macrophyte growth in the reach. In contrast, between early April and mid-June 2006, the maximum depths of plant colonization were less than the water depths at the Kiona gaging station—indicating that light was not sufficient for macrophyte growth in the reach. Only one estimate of the maximum depth of plant colonization was made during the spring runoff period in early June 2007 and this value also was less than the water depth at the Kiona gaging station at that time. A comparison between the maximum depth of plant colonization and turbidity indicated that a turbidity threshold may have existed above which macrophyte growth was suppressed because of a lack of adequate light. When the turbidity was less than 10 FNU the corresponding maximum depth of plant colonization varied greatly (ranging from 2 to 22 ft), but when the turbidity was greater than 15 FNU the maximum depth of plant colonization was always less than 6 ft (fig. 26).
|
For additional information contact: Part or all of this report is presented in Portable Document Format (PDF); the latest version of Adobe Reader or similar software is required to view it. Download the latest version of Adobe Reader, free of charge. |

![]() U.S. Department of the Interior | U.S. Geological Survey
U.S. Department of the Interior | U.S. Geological Survey
URL: http://
pubsdata.usgs.gov
/pubs/sir/2009/5078/section4.html
Page Contact Information: Contact USGS
Page Last Modified:
Thursday, 10-Jan-2013 19:30:33 EST
