 |
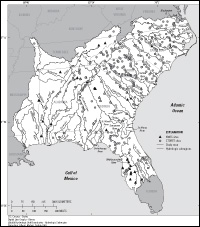
Figure 1. The South Atlantic–Gulf and Tennessee study area hydrologic subregions and study sites from NWIS and STORET databases used in trend analysis. |
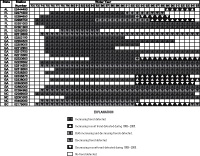 |
Figure 2. Trends in pH at selected National Water Information System sites in the Southeast. Only sites with detected trends are shown. The uncensored seasonal Kendall test was used in all cases. |
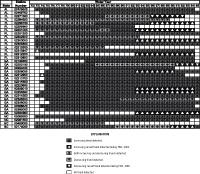 |
Figure 3. Trends in specific conductance at selected National Water Information System sites in the Southeast. Only sites with detected trends are shown. The uncensored seasonal Kendall test was used in all cases. |
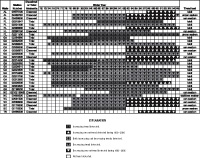 |
Figure 4. Trends in dissolved and total ammonia concentration at selected National Water Information System sites in the Southeast. Only sites with detected trends are shown. [tobit, Tobit regression; cen seaken, seasonal Kendall test for censored data; uncen seaken, seasonal Kendall test for uncensored data.] |
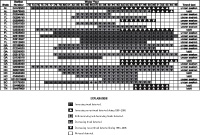 |
Figure 5. Trends in total ammonia plus organic nitrogen concentration at selected National Water Information System sites in the Southeast. Only sites with detected trends are shown. [tobit, Tobit regression; cen seaken, seasonal Kendall test for censored data; uncen seaken, seasonal Kendall test for uncensored data.] |
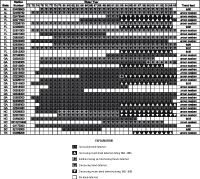 |
Figure 6. Trends in nitrite plus nitrate concentration at selected National Water Information System sites in the Southeast. Only sites with detected trends are shown. [tobit, Tobit regression; cen seaken, seasonal Kendall test for censored data; uncen seaken, seasonal Kendall test for uncensored data.] |
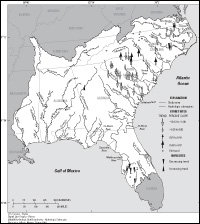 |
Figure 7. Long-term (1973–2005) trends in total nitrogen concentration at sites from the National Water Information System (NWIS) and Storage and Retrieval (STORET) databases. |
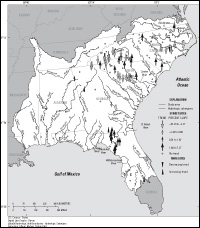 |
Figure 8. Recent (1993–2005) trends in total nitrogen concentration at sites from the National Water Information System (NWIS) and Storage and Retrieval (STORET) databases. |
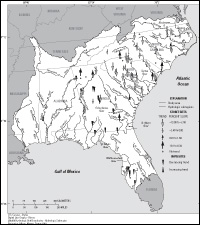 |
Figure 9. Long-term (1973–2005) trends in total phosphorous concentration at sites from the National Water Information System (NWIS) and Storage and Retrieval (STORET) databases. |
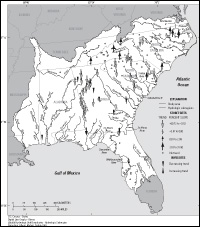 |
Figure 10. Recent (1993–2005) trends in total phosphorous concentration at sites from the National Water Information System (NWIS) and Storage and Retrieval (STORET) databases. |


