U.S. Geological Survey Scientific Investigations Report 2009-5268
Trends in Water Quality in the Southeastern United States, 1973–2005
|
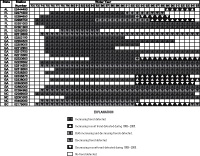
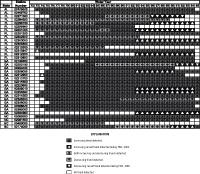
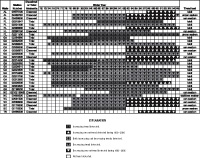
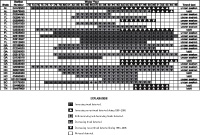
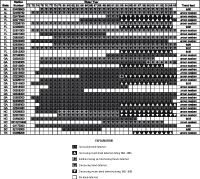
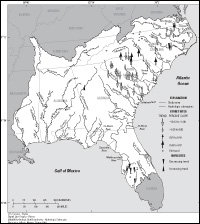
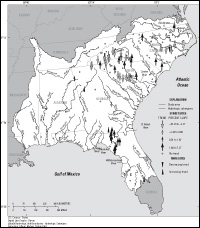
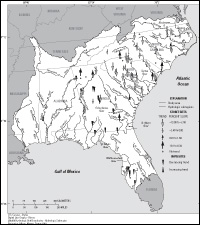
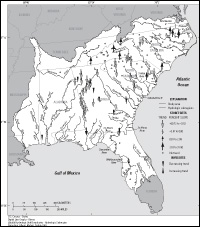
Water-Quality Trends in the SoutheastWater-quality data from 44 USGS NWIS sites in the Southeast were examined for trends in specific conductance, pH, alkalinity, dissolved oxygen, total hardness, dissolved calcium, dissolved sodium, dissolved potassium, dissolved sulfate, dissolved chloride, dissolved silica, dissolved solids, nutrients, dissolved organic carbon, and suspended sediment (table 1). The nutrient constituents that were reviewed included dissolved nitrate, dissolved nitrite plus nitrate, total ammonia, total ammonia plus organic nitrogen, total nitrogen, total phosphorus, dissolved phosphorus, and dissolved orthophosphate concentrations. These sites were examined for trends over multiple periods within 1973–2005. Results for long-term trends for periods of 25 years or longer and recent trends occurring during 1993–2005 are discussed in this report. Sites with statistically significant increasing or decreasing long-term trends will not necessarily show statistically significant recent trends because of the reduced power of the test with a smaller observation count (N), or because the trend is nonmonotonic. The varying time periods used in the trend testing resulted in different counts of sites tested because although there were 44 NWIS sites tested for all constituents, the amount of record available for any one constituent may be less than that required for the test. The site count for the long-term trend tests is different from the site count for the recent trend test because recent data were not available at all of the 44 sites for all constituents. For a complete list of all trend tests attempted for each site see Staub and others (2009). An additional 290 STORET sites were tested for trends in total nitrogen and total phosphorus during the 1975–2004 (long term) and 1993–2004 (recent) periods. A complete listing of the trend-test results is presented in Staub and others (2009). pH TrendsLong-term (25 years or longer during 1973–2005) increasing trends in pH were detected at 11 of 35 NWIS sites (31 percent, fig. 2) with 4 sites (11 percent) having decreasing long-term trends. Recent (occurring during the period of 1993–2005) increasing pH trends were detected at 4 of 39 NWIS sites (10 percent) tested. Decreasing recent trends were observed at four sites (10 percent). Trends in pH were matched with similar trends in alkalinity. Five sites with increasing trends in pH also showed increasing alkalinity. Two sites with decreasing alkalinity also had decreasing pH. Sulfate trends appeared to have a distinct connection with pH trends. Five sites with increasing sulfate trends had decreasing pH, and five sites with decreasing sulfate trends had increasing pH. Complete trend- test results for alkalinity and sulfate are reported in Staub and others (2009). Specific Conductance TrendsLong-term increasing trends in specific conductance were detected in the data from 21 of 34 NWIS sites (62 percent, fig. 3). Only one site had a decreasing long-term trend (3 percent). Recent increasing specific conductance trends were evident at 9 of 41 NWIS sites tested (22 percent). One of the 41 sites (2 percent) had recent decreasing trends. Long-term and recent trends observed in specific conductance generally were reflected by similar trends in alkalinity, calcium, chloride, sodium, dissolved solids, and hardness. These constituents are interrelated; specific conductance is an indicator of the amount of dissolved ions in water. Complete trend- test results for alkalinity, calcium, chloride, sodium, dissolved solids, and hardness are reported in Staub and others (2009). Nitrogen TrendsNutrient data for the NWIS sites were examined for trends. In particular, ammonia nitrogen, ammonia plus organic nitrogen, and nitrite plus nitrate data were examined. Total nitrogen, which combines ammonia, organic, nitrate, and nitrite, was examined for trends at both the NWIS and the STORET sites. The general pattern of ammonia-nitrogen concentration trends in the Southeast is decreases or increases early (1973–85) and later decreases over the last 30 years (fig. 4). The seasonal Kendall test without flow adjustment was used for many of the sites because of the number of censored values that exceeded 5 percent of the total. Some of the detected trends shown in figure 4 may be a result of trends in flow. Long-term decreasing trends in ammonia- nitrogen concentrations were detected at 9 of 30 (27 percent) NWIS sites. Trend results at five sites demonstrated a long-term pattern of increasing ammonia- nitrogen concentrations through the mid-1980s followed by decreasing trends. Two NWIS sites had long-term increasing trends. Recent decreasing trends were detected at 11 of 33 (33 percent) NWIS sites. Recent increasing trends were found at two NWIS sites (6 percent). No overall regional pattern in trends of total ammonia plus organic nitrogen concentrations is evident (fig. 5), in part because total ammonia plus organic nitrogen data are less available in recent years. Long-term decreasing trends in total ammonia plus organic nitrogen concentrations were detected at 5 of 35 (14 percent) NWIS sites. Four sites (11 percent) had increasing long-term trends. Recent increasing trends in total ammonia plus organic nitrogen concentrations were detected at 7 of 35 (20 percent) NWIS sites. Decreasing recent trends were detected at two sites (6 percent). Care must be taken when mixing results of the test with results of trend tests using flow adjustment (seasonal Kendall test and Tobit regression) because the seasonal Kendall test for censored data has no flow adjustment. Long-term increasing trends in nitrite plus nitrate concentration were detected for 11 of 38 (29 percent) of the NWIS sites (fig. 6). Ten of the 12 sites were in Georgia. Decreasing long-term trends in nitrite plus nitrate concentrations were detected at 10 (26 percent) of the NWIS sites. Most of the NWIS sites in Alabama, Florida, and North Carolina had decreasing trends. Recent increasing trends in nitrite plus nitrate concentrations were detected at 6 of 38 (16 percent) of the NWIS sites. Recent decreasing trends were detected at five (13 percent) of the sites. Trend results for total nitrogen were determined for data for both NWIS and STORET sites. STORET sites were tested for the period 1975–2004. NWIS sites were tested for many periods; long-term results for periods greater than 25 years were combined with the STORET fixed-period results in the following discussion. Long-term decreasing trends in total nitrogen concentrations were detected for 39 of 79 (49 percent) NWIS and STORET sites tested. The median trend- slope decline for the STORET sites was –2.1 percent per year. NWIS trend slopes are not reported because of the varying time periods used. Eight sites (10 percent) had long-term increasing trends in total nitrogen concentrations. The median trend-slope increase in total nitrogen concentration was 1.9 percent per year. Recent decreasing trends were detected at 27 of 157 (17 percent) sites tested. The median trend slope decline was –4.5 percent per year. Increasing recent trends were observed at 27 sites (17 percent) as well. The median trend slope increase was 4.5 percent per year. Long-term total nitrogen concentration results for both the NWIS and STORET sites are shown in figure 7. The results are limited primarily to North Carolina, South Carolina, and a small area of Florida. Most long-term trends in total nitrogen are decreasing; however, several increasing trends were present at sites near the border of North Carolina and South Carolina in the Catawba and Pee Dee River basins. Recent-period (1993–2005) trend results for total nitrogen at NWIS and STORET sites (fig. 8) indicate that most of the sites with data suitable for trend testing were located in North Carolina, South Carolina, Florida, and Georgia. A cluster of recent increasing trends in total nitrogen is evident for sites in the Suwannee River basin in Florida. Decreasing trends in total nitrogen concentration were observed in the Blue Ridge Mountains of western North Carolina and in the central Coastal Plain of North Carolina. In South Carolina, several increasing trends are evident for sites on the Catawba River as are decreasing trends for sites on the Saluda River. Overall, the results for total nitrogen indicated regional clusters of increasing and decreasing trends. Phosphorus TrendsTrend results for total phosphorus concentrations were obtained for sites from both NWIS and STORET databases. The STORET sites were tested for the period of 1975–2004. The NWIS sites were tested for many periods; long-term results for periods greater than 25 years have been combined with the STORET fixed-period results in the following discussion. Long-term decreasing trends in total phosphorus concentrations were detected for 58 of 103 (56 percent) of the sites tested. The median slope decline for the STORET sites was –2.49 percent per year. Eight sites (8 percent) had long-term increasing trends in total phosphorus concentrations. The median slope increase at the STORET sites was 1.60 percent per year. Recent decreasing trends in total phosphorus concentrations were observed for 44 of 191 (23 percent) NWIS and STORET sites. The median slope decline for the STORET sites was –3.51 percent per year. Recent decreasing trends in total phosphorus were detected at 11 of 191 sites (6 percent); the median decreasing slope for the STORET sites was –3.51 percent per year. Long-term trends in total phosphorus concentrations at both NWIS and STORET sites in the Southeast are shown in figure 9. Although areal coverage in the Southeast is greater for total phosphorus trends than the distribution of sites for total nitrogen, coverage in Florida, Alabama, Mississippi, and Virginia is poor. The trend results indicate a widespread long-term decline in total phosphorus concentrations in the Southeast. Most trend sites in North Carolina, South Carolina, Georgia, and Florida had decreases during the 1973–2005 period. Recent-period trends in total phosphorus concentrations at the NWIS and STORET sites in the Southeast (fig. 10) form a more complex regional picture than the long-term trends (fig. 9). A string of decreasing trends line the Chattahoochee River in Georgia. Most recent trends in total phosphorus concentration in Georgia and South Carolina are decreasing. Areas along the North Carolina Blue Ridge Mountains and northeastern Coastal Plain, and the South Carolina Coastal Plain had increasing trends. Suspended-Sediment TrendsTrends in suspended-sediment concentrations were detected at 5 of 14 (36 percent) NWIS sites. Decreasing long-term trends were detected for the Alabama River in Alabama and the Neuse River and Contentnea Creek in North Carolina. An increasing long-term trend was detected for the Edisto River in South Carolina. No sites had significant trends during 1993–2005. |

![]() U.S. Department of the Interior |
U.S. Geological Survey
U.S. Department of the Interior |
U.S. Geological Survey
URL: http://
pubsdata.usgs.gov
/pubs/sir/2009/5268/trends.html
Page Contact Information: USGS Publications Team
Page Last Modified: Thursday, 10-Jan-2013 19:43:35 EST