


The purpose of these interpretive discussions is to provide a perspective on regional- and national-scale variations in element and mineral distributions in soils and their likely causes. The significant spatial variations shown by most elements and minerals can commonly be attributed to geologic sources in underlying parent materials, but other spatial variations seem clearly related to additional factors such as climate, the age of soils, transported source material, and anthropogenic influences. We attempt to distinguish the influence of these various factors on a regional and national scale. Numerous more local features might similarly be related to these same factors, but these features also have some probability of being an artifact of a random sampling of variable compositions, so that there is some probability of samples with similar compositions occurring in clusters of two or more adjacent sites by chance. Distinguishing such random occurrences from true variability is beyond the scope of the data from which these maps are constructed. Some caution, therefore, is advisable in interpreting the significance of these more local features unless some unique sources or processes can clearly be related to them.
Potassium (K) is a metallic element. Most of the world's K production is used in fertilizers. Compounds of K are also used in the manufacture of glass and soap, and pharmaceuticals. Potassium is essential to life and is a component of all cells. It is generally considered to be nontoxic.
The distribution of K in soil is controlled by a diverse set of factors, including the mineralogy of the soil parent material, climate controls on weathering, and human and biologic activity. The average abundance of K in the Earth's upper continental crust is approximately 2.32 weight percent (wt. %) (Rudnick and Gao, 2003). Potassium in geologic materials is contained in K feldspar and in sheet silicates, such as micas (for example, muscovite and biotite) and mica–like minerals (for example, illite). These structurally related minerals have a common basal spacing of 10 Å (1Å (angstrom) = 10–10 meters (m)). Potassium feldspar and micas are common minerals in felsic rocks such as granite and rhyolite. The concentration of K in felsic rocks is approximately 3.3 wt. %. Potassium feldspar and 10 Å clay minerals can also be important components in sedimentary rocks, such as shale, mudstone, and sandstone. The average K concentration in shale is approximately 2.7 wt. %. Other common rock types have lower K concentrations with mafic rocks such as basalt and gabbro containing about 0.8 wt. %, limestone 0.3 wt. %, and sandstone 1.1 wt. %. Potassium feldspar and 10 Å clay minerals are also present in unconsolidated materials, including alluvial, eolian, and glacial deposits.
In soil, K feldspar and biotite are susceptible to weathering (biotite more easily than K feldspar). Muscovite is more resistant to weathering than either K feldspar or biotite, and muscovite can persist in weathered soil profiles. Potassium released by weathering of K feldspar can be incorporated into secondary clay, such as illite, or removed from soil by plant uptake. Potassium chloride minerals, such as sylvite (KCl), form by evaporation of seawater or in terrestrial salt lakes, and represent a major source of commercial potash, a water–soluble form of K that is added to soil as a plant nutrient. The distribution of mineral resource deposits with K as a commodity (major or minor) in the United States, extracted from the U.S. Geological Survey (USGS) Mineral Resource Data System (MRDS) website, can be seen by hovering the mouse here. Statistics and information on the worldwide supply of, demand for, and flow of K (potash) are available through the USGS National Minerals Information Center (NMIC) website.
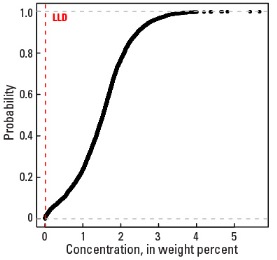
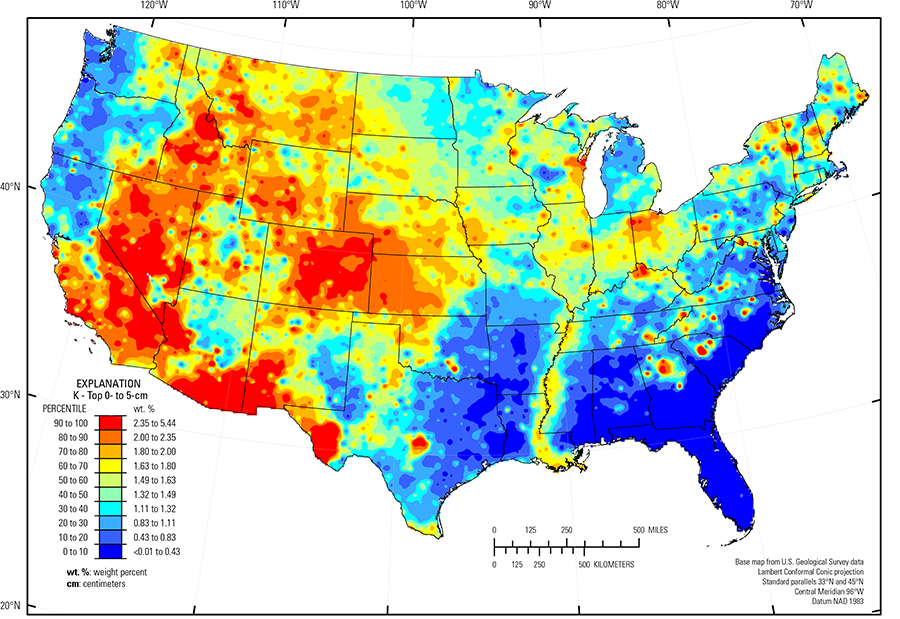
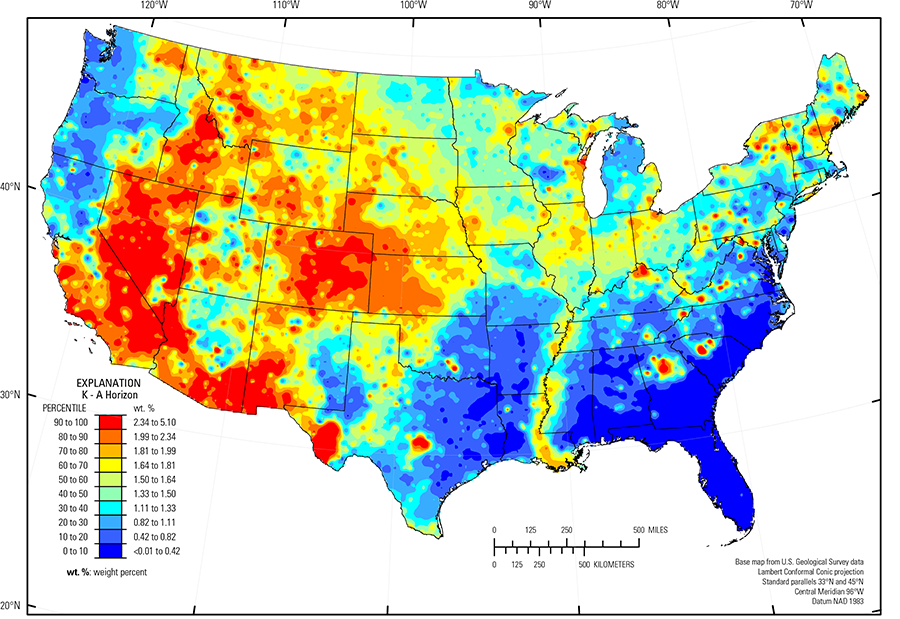
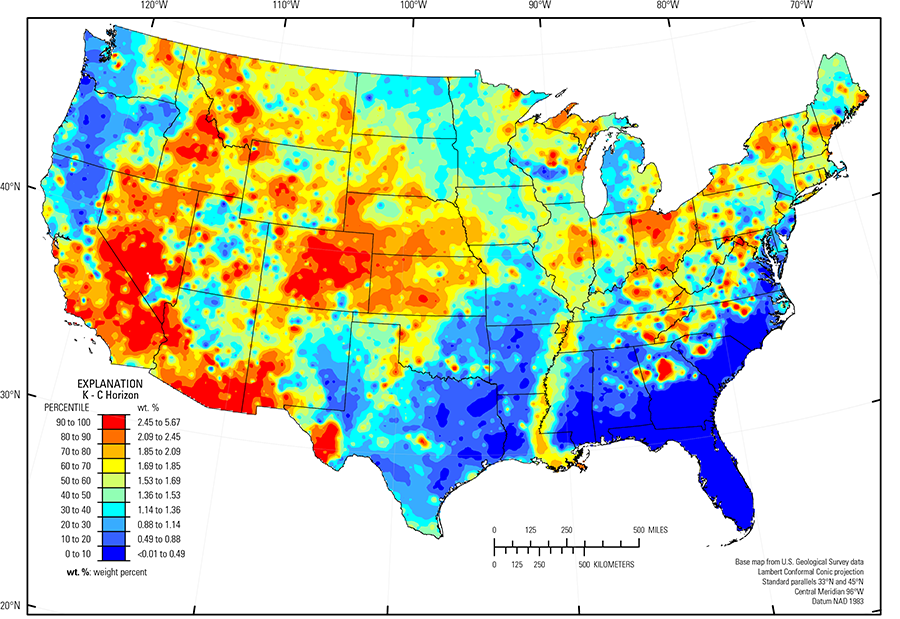
In our data, the median concentration of K is 1.53 wt. % in the soil C horizon, 1.50 wt. % in the soil A horizon, and 1.49 wt. % in the top 0- to 5-cm layer (see the summary statistics [open in new window]). More than 99 percent of all the samples have K concentrations above the 0.01-wt. % lower limit of determination (LLD). The map patterns for K among the three sample types (top 0- to 5-cm layer, soil A horizon, and soil C horizon) are broadly similar to one another, but in the relatively humid eastern United States, concentrations in topsoils (soil A horizon and top 0- to 5-cm layer) are lower than concentrations in the soil C horizon, likely due to the susceptibility of K feldspar to weathering. For many of the sites in the East, the K map pattern is a complex interplay between the distribution of K feldspar and 10 Å clays in the soil profile.
High K concentrations occur in soil developed on K feldspar– or mica–bearing granite and rhyolite, or on sedimentary rocks, as well as on more recent alluvial and eolian deposits derived from similar rock types. Examples of such areas include:
- Parts of the Central Rocky Mountains and the Southern Rocky Mountains (USDA, 2006) (variety of rock types, including granite);
- Basin and Range (Fenneman and Johnson, 1946) (felsic volcanic rocks and related alluvium);
- Sierra Nevada Mountains and the Central California Coast Range (USDA, 2006) (variety of rock types, including granite);
- Trans–Pecos volcanics (Schruben and others, 1997) (rhyolite, alkali basalt, and related alluvium); and
- Llano Basin (Precambrian granitic rocks).
High soil K concentrations in the Colorado Piedmont (Fenneman and Johnson, 1946) reflect the presence of K feldspar originally sourced from the eroding Rocky Mountains to the west and subsequently deposited in eastern Colorado as sandstone or shale and more recent unconsolidated alluvial and eolian sediments. In contrast, in western Kansas and parts of southwest and southern Nebraska (for example, Mixed Sandy and Silty Tableland and Badlands, Central High Tableland, Central Nebraska Loess Hills, Rolling Plains and Breaks, Central Loess Plains (USDA, 2006)) the relative proportions of K feldspar and 10 Å clay in loess suggest that the K concentrations in soil for these areas are controlled by the presence of 10 Å clays (such as mica or illite) rather than feldspar. Soil in the Nebraska Sand Hills (USDA, 2006), an area of unconsolidated sand dunes and sand sheets in north-central Nebraska, is dominated by quartz with plagioclase feldspar greater than K feldspar, and little silt–sized material. Thus, soil in this area has low K concentrations compared to K concentrations in the rest of the State.
Other regions with elevated K concentrations include those where shale and other fine–grained sedimentary rocks constitute the soil parent materials: eastern Montana, western South Dakota, southern Ohio, northern Kentucky, and through the Appalachian Plateaus (Fenneman and Johnson, 1946).
Soil throughout the Piedmont (Fenneman and Johnson, 1946) is old and has undergone long–term, intense weathering in a humid to semi–humid environment, and most primary minerals have broken down. However, in some parts of the Piedmont, soil developed on granite or metamorphosed felsic rocks has retained some K feldspar, resulting in sporadic occurrence of elevated K. In other areas of the Piedmont where soil formed on shale or sandstone, it is likely that any original K–bearing minerals have dissolved, with K substitution into newly formed clay minerals or leached from the soil profile.
Other large areas of the conterminous United States with low concentrations of K in soil had little to no K feldspar or mica in the soil parent materials. These areas include:
- Pacific Northwest and northern California (mafic rocks);
- Texas carbonate terrane (limestone, chalk, and dolostone, or unconsolidated deposits derived from carbonate bedrock); and
- Gulf and Atlantic Coastal Plain (Fenneman and Johnson, 1946) (quartz–rich sedimentary rocks and unconsolidated sediments).
The Gulf and Atlantic Coastal Plain is bisected by the Southern Mississippi River Alluvium and the Southern Mississippi Valley Loess (USDA, 2006). Alluvial sediments have deposited in the Mississippi River valley as the river flooded in recent geologic time. When these sediments dried, winds picked up the fine material and deposited it in thick loess sheets, mainly along the east side of the river valley. The youngest loess sheets are about 10,000 years old. A pattern of higher K concentrations in soil developed on these young sediments reflects long–range transport of material from areas containing K feldspar and 10 Å clays from the upper part of the Mississippi River drainage basin.
Statistics - 0 TO 5 CM
| Number of samples | 4,841 |
| LLD | 0.01 wt. % |
| Number below LLD | 24 |
| Minimum | <0.01 wt. % |
| 5 percentile | 0.14 wt. % |
| 25 percentile | 0.99 wt. % |
| 50 percentile | 1.49 wt. % |
| 75 percentile | 1.88 wt. % |
| 95 percentile | 2.68 wt. % |
| Maximum | 5.44 wt. % |
| MAD | 0.652 wt. % |
| Robust CV | 43.8% |
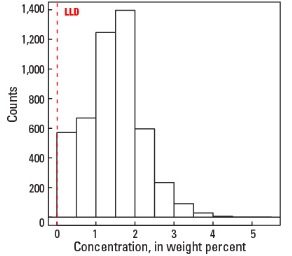
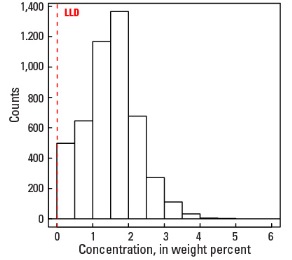
Histogram
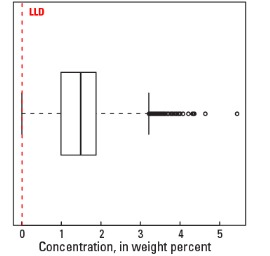
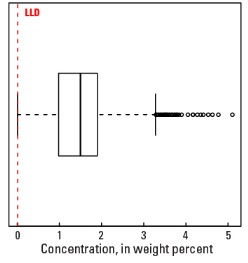
Boxplot
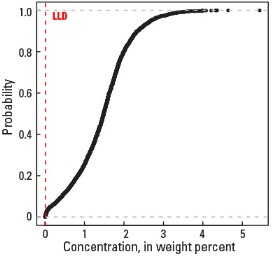
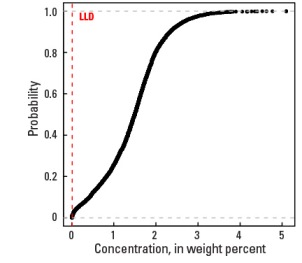
Empirical cumulative distribution function
Statistics - A Horizon
| Number of samples | 4,813 |
| LLD | 0.01 wt. % |
| Number below LLD | 26 |
| Minimum | <0.01 wt. % |
| 5 percentile | 0.14 wt. % |
| 25 percentile | 0.98 wt. % |
| 50 percentile | 1.50 wt. % |
| 75 percentile | 1.90 wt. % |
| 95 percentile | 2.67 wt. % |
| Maximum | 5.1 wt. % |
| MAD | 0.652 wt. % |
| Robust CV | 43.5 % |
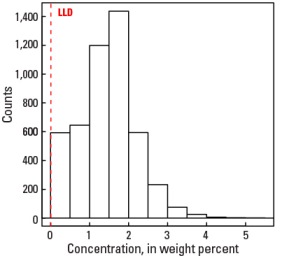
Histogram
Boxplot
Empirical cumulative distribution function
Statistics - C Horizon
| Number of samples | 4,780 |
| LLD | 0.01 wt. % |
| Number below LLD | 34 |
| Minimum | <0.01 wt. % |
| 5 percentile | 0.17 wt. % |
| 25 percentile | 1.04 wt. % |
| 50 percentile | 1.53 wt. % |
| 75 percentile | 1.96 wt. % |
| 95 percentile | 2.78 wt. % |
| Maximum | 5.67 wt. % |
| MAD | 0.682 wt. % |
| Robust CV | 44.6 % |
Histogram

Boxplot