


The purpose of these interpretive discussions is to provide a perspective on regional- and national-scale variations in element and mineral distributions in soils and their likely causes. The significant spatial variations shown by most elements and minerals can commonly be attributed to geologic sources in underlying parent materials, but other spatial variations seem clearly related to additional factors such as climate, the age of soils, transported source material, and anthropogenic influences. We attempt to distinguish the influence of these various factors on a regional and national scale. Numerous more local features might similarly be related to these same factors, but these features also have some probability of being an artifact of a random sampling of variable compositions, so that there is some probability of samples with similar compositions occurring in clusters of two or more adjacent sites by chance. Distinguishing such random occurrences from true variability is beyond the scope of the data from which these maps are constructed. Some caution, therefore, is advisable in interpreting the significance of these more local features unless some unique sources or processes can clearly be related to them.
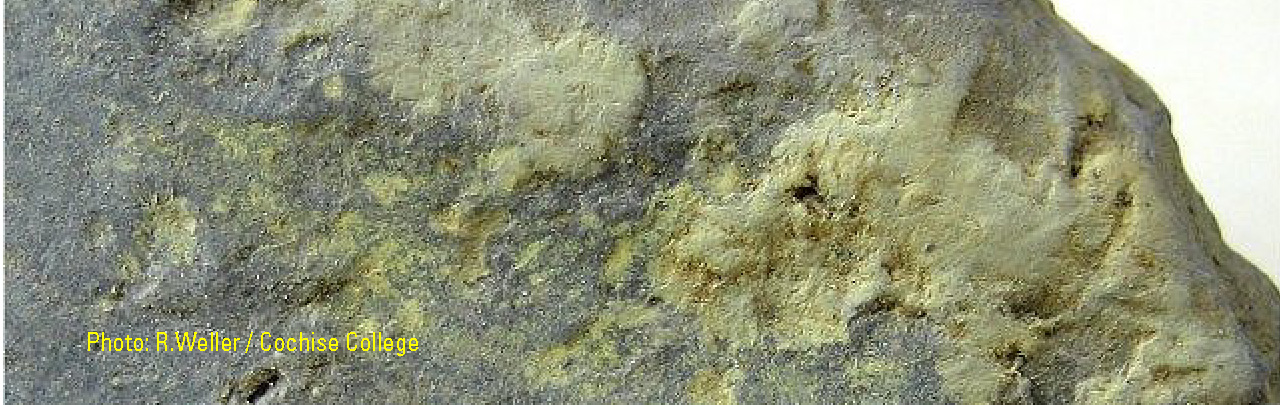
A group of minerals including clays and micas are characterized by an interatomic spacing of 10 Å (1 Å (angstrom) = 10–10 meters (m)) across their principal platy parting direction. These include illite ((K,H3O)y (Al4,Fe4,Mg4,Mg6) (Si8-y,Aly)O20(OH)4), with y less than 2 and frequently 1 to 1.5; muscovite (KAl2(Al,Si3)O10(OH)2); and biotite (K(Mg,Fe+2)3(Al,Fe+3)Si3O10(OH)2). These minerals have crystal structures that allow them to be differentiated by X–ray examination, but only by the use of methods that are more precise than methods we have used. For this reason, we have grouped them as a single class. These are all potassium (K) aluminosilicate minerals with variable amounts of iron (Fe) and magnesium (Mg), so their presence exerts similar influences on soil chemistry. Muscovite and biotite form in igneous and metamorphic rocks at elevated temperatures, but they also persist as clastic particles in sedimentary rocks. Illite, on the other hand, can form in soils as a product of lower temperature alteration of feldspars and muscovite.
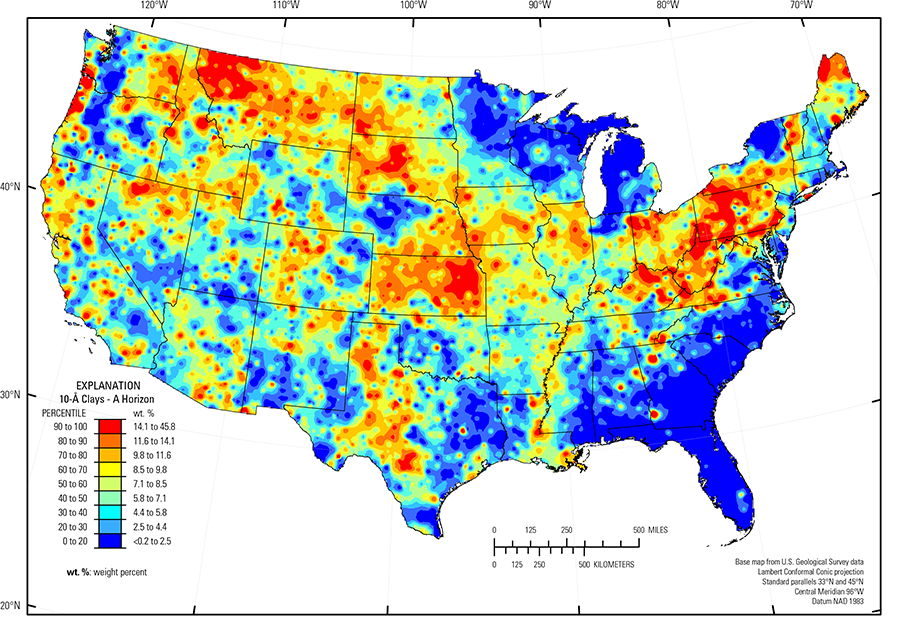
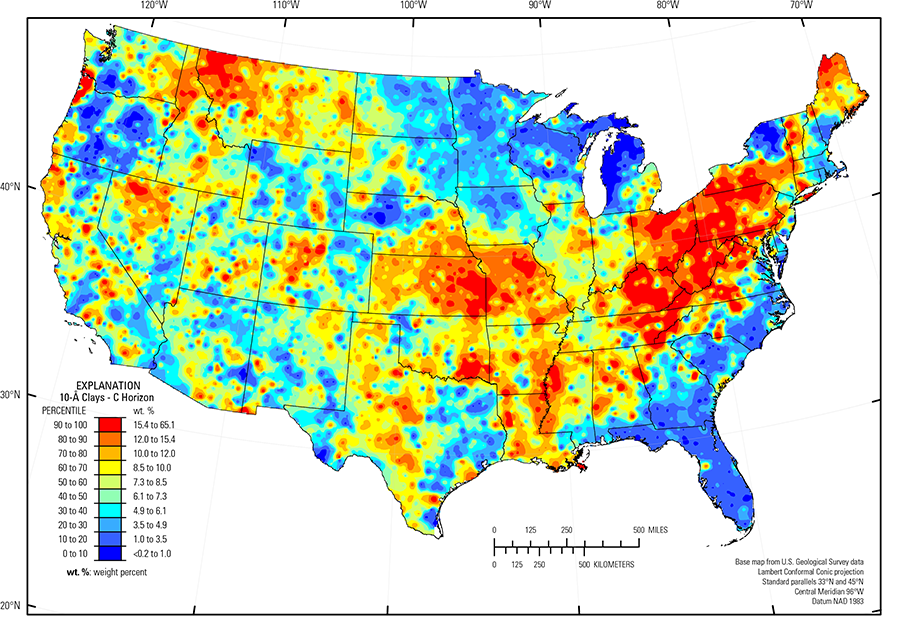
In our data, the median concentration of 10 Å clay minerals is similar in both the soil A and C horizons (7.1 weight percent (wt. %) and 7.3 wt. %, respectively), but locally the maximum concentration is 65 wt. %, in the soil C horizon and 46 wt. % in the soil A horizon (see the summary statistics [open in new window]). For both horizons, about 10 percent of the sites had no detectable 10 Å clay minerals.
Most of the distribution pattern of 10 Å clay minerals in soils corresponds closely to the character of underlying bedrock or glacial deposits from which soils formed. A large area of notably high concentrations of 10 Å clay minerals is in the eastern United States in the soil C horizon in the Central Allegheny Plateau (USDA, 2006), the Valley and Ridge and Blue Ridge provinces (Fenneman and Johnson, 1946), as well as the Kentucky Bluegrass and the Northern Piedmont regions (USDA, 2006). High concentrations of 10 Å clay extend into glaciated areas of New York, Pennsylvania, and Ohio. Most bedrock in these areas is Paleozoic clastic sedimentary rocks in which these clay minerals could be either clastic material derived from older crystalline terranes, or formed in situ by chemical alteration during soil development. In the southern part of this region, soil A horizon samples have distinctly less 10 Å clays than the soil C horizon. This is apparently caused by chemical alteration of them to form kaolinite. The Northern Rocky Mountains (Fenneman and Johnson, 1946) also have high concentrations of 10 Å clay minerals in areas underlain largely by clastic sedimentary rocks. Many soils in this area are also influenced by volcanic ash deposited from the eruption of Mt. Mazama approximately 7,700 years ago (Bacon and Lanphere, 2006), which may be an additional source of 10 Å clays. Another large area rich in 10 Å clay minerals is in part of eastern Kansas and northern Missouri. Bedrock there is largely clastic sedimentary rocks and, in the north, soils are formed largely on clay–rich glacial deposits and Pleistocene loess. Other smaller areas of high concentration also occur where bedrock is largely clastic sedimentary rocks or river alluvium, such as along the Mississippi Alluvial Plain (Fenneman and Johnson, 1946).
Several large areas have soils that contain only small amounts of 10 Å clays. One such area is the north-central region of the United States. There, soils are developed on Wisconsinan glacial deposits (Soller and others, 2012) that were derived either from carbonate rocks, as reflected in the carbonate mineral concentration or from rocks of granitic composition as reflected in the quartz and potassium feldspar concentration. This is especially evident in western Michigan, northern Wisconsin, and northern Minnesota. The Atlantic and Gulf of Mexico Coastal Plains (Fenneman and Johnson, 1946) also have low concentrations of 10 Å clays. Soils there have formed from quartz–rich Mesozoic and Cenozoic sedimentary rocks that contain little of these minerals. Other areas of low concentrations overlie mafic igneous rocks of the Pacific Northwest and the windblown sands of the Nebraska Sand Hills (USDA, 2006). A small area where concentrations of 10 Å clay minerals are especially low is the Adirondack highlands (Fenneman and Johnson, 1946), northern New York. Bedrock there formed at especially high temperatures, beyond the stability range of 10 Å clay minerals, so there is no bedrock source for them, and the relatively young glacial soils have not had sufficient time to generate clays by soil–forming processes.
Statistics - 0 TO 5 CM
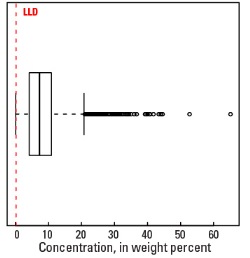
Statistics - A Horizon
| Number of samples | 4,802 |
| LLD | 0.2 wt. % |
| Number below LLD | 563 |
| Minimum | <0.2 wt. % |
| 5 percentile | <0.2 wt. % |
| 25 percentile | 3.6 wt. % |
| 50 percentile | 7.1 wt. % |
| 75 percentile | 10.7 wt. % |
| 95 percentile | 16.6 wt. % |
| Maximum | 45.8 wt. % |
| MAD | |
| Robust CV |
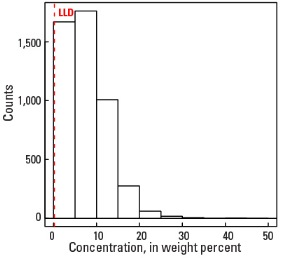
Histogram
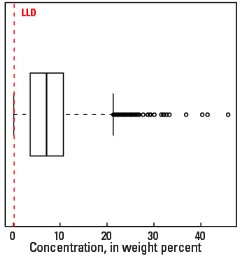
Boxplot
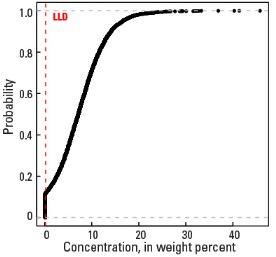
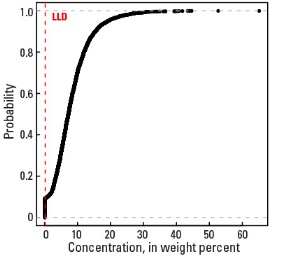
Empirical cumulative distribution function
Statistics - C Horizon
| Number of samples | 4,773 |
| LLD | 0.2 wt. % |
| Number below LLD | 436 |
| Minimum | <0.2 wt. % |
| 5 percentile | <0.2 wt. % |
| 25 percentile | 4.2 wt. % |
| 50 percentile | 7.3 wt. % |
| 75 percentile | 10.9 wt. % |
| 95 percentile | 19.2 wt. % |
| Maximum | 65.1 wt. % |
| MAD | |
| Robust CV |
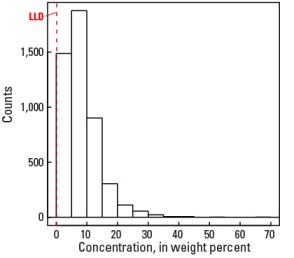
Histogram
Boxplot