


The purpose of these interpretive discussions is to provide a perspective on regional- and national-scale variations in element and mineral distributions in soils and their likely causes. The significant spatial variations shown by most elements and minerals can commonly be attributed to geologic sources in underlying parent materials, but other spatial variations seem clearly related to additional factors such as climate, the age of soils, transported source material, and anthropogenic influences. We attempt to distinguish the influence of these various factors on a regional and national scale. Numerous more local features might similarly be related to these same factors, but these features also have some probability of being an artifact of a random sampling of variable compositions, so that there is some probability of samples with similar compositions occurring in clusters of two or more adjacent sites by chance. Distinguishing such random occurrences from true variability is beyond the scope of the data from which these maps are constructed. Some caution, therefore, is advisable in interpreting the significance of these more local features unless some unique sources or processes can clearly be related to them.
Selenium (Se) is a nonmetallic trace element that has chemical affinities for sulfur (S) and organic carbon (Corg) compounds. It occurs in generally low concentrations in most natural materials including soils. Selenium is an essential micronutrient for most organisms, including humans, but can have toxic effects at high levels of uptake. More information about Se toxicity and its potential negative human health impacts can be found at the Agency for Toxic Substances and Disease Registry (ATSDR) website, or click to download a fact sheet about Se.
Selenium has limited uses and is produced mostly as a byproduct of copper (Cu) refining. Its uses include as a human dietary supplement, a dietary supplement for livestock, and as a fertilizer additive to enrich Se–poor soils. Selenium is concentrated in some phosphorites, the raw material for phosphate fertilizers, and in some coal, so Se may be dispersed widely in the environment incidentally through application of fertilizers and coal combustion.
The abundance of Se in the Earth's upper continental crust is estimated to be about 0.09 milligrams per kilogram (mg/kg) (Rudnick and Gao, 2003). It is generally most concentrated in shales, whose average Se concentration is about 0.3 mg/kg. Other common rock types have lower Se concentrations with mafic rocks averaging about 0.12 mg/kg, granites and limestones about 0.025 mg/kg, and sandstones about 0.01 mg/kg. Coal can have very elevated Se concentrations with values up to a few mg/kg.
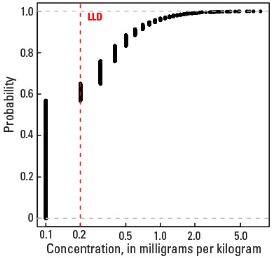
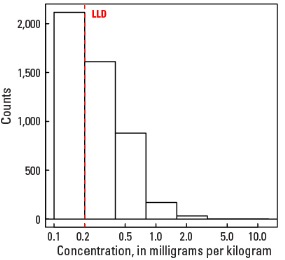
For our data, the median Se concentration is equal to the 0.2-mg/kg lower limit of determination (LLD) (soil A horizon and top 0- to 5-cm layer) or below the LLD (soil C horizon); Se was not detected at about 45 percent of our sample sites (see the summary statistics [open in new window]). Because of the limited number of sites with detectable Se, the maps are classified in 5 or 6 concentration ranges rather than the 10 classes used for most other maps.
The distribution of mineral resource deposits with Se as a commodity (major or minor) in the United States, extracted from the U.S.Geological Survey (USGS) Mineral Resource Data System (MRDS) website, can be seen by hovering the mouse here. Statistics and information on the worldwide supply of, demand for, and flow of Se are available through the USGS National Minerals Information Center (NMIC) website.
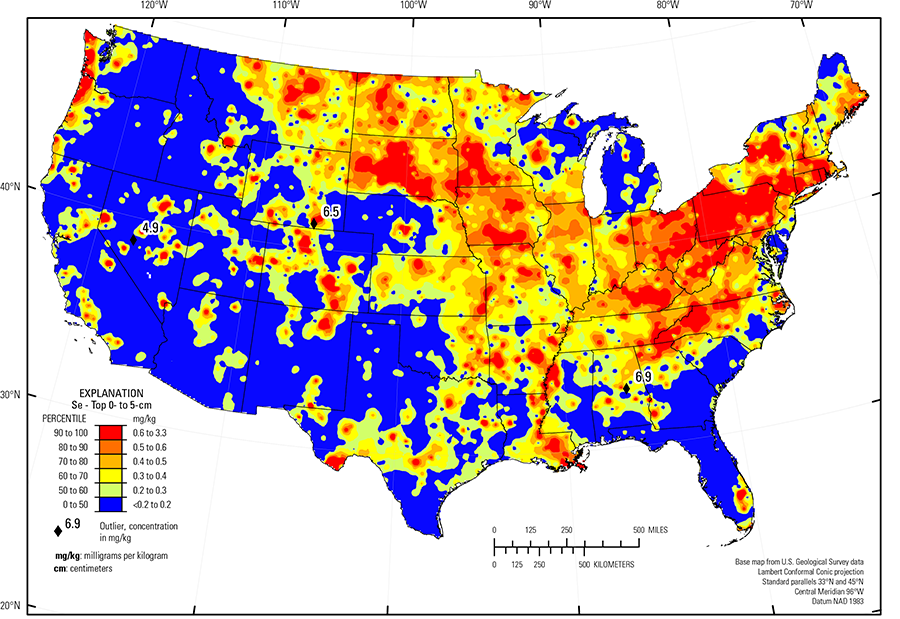
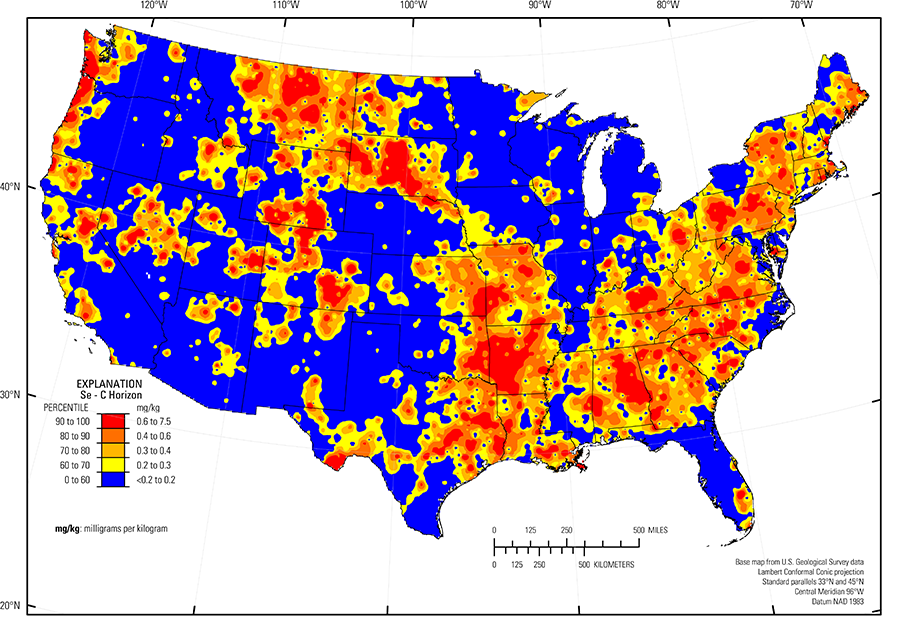
The Se distribution in the soil C horizon reflects underlying bedrock lithology in many parts of the country. Se–rich soils in eastern Montana, western North Dakota, much of South Dakota, Wyoming, Colorado, and Utah, are underlain by a mixture of rock types, but shale is abundant in these areas. Particularly high concentrations of Se occur in soils overlying the Northern Rolling Pierre Shale Plains (USDA, 2006) in central South Dakota. This area contains abundant pyritic black shale enriched in Se. A second area of Se–rich soil covers most of Missouri and Arkansas, and eastern Kansas and Oklahoma. This area, too, has abundant shale in underlying bedrock and is bounded by areas where coarser–grained or carbonate bedrock predominate. The large area of detectable Se in the eastern United States occurs over a variety of parent material types and a connection to a specific parent material is not evident. One unusual aspect of the Se distribution is its high concentration in the soil C horizon in parts of the Gulf and Atlantic Coastal Plain (Fenneman and Johnson, 1946), where many other trace elements occur in low concentrations. A prominent area of Se–rich soils is along the Pacific coast in Washington, Oregon, and northern California. A bedrock source for Se is not evident and the Se may have been derived from marine aerosols that are known to carry traces of Se. This area of very high rainfall (PRISM climate group) supports temperate rainforest vegetation in large part, which may play a part in sequestering Se in soil organic matter.
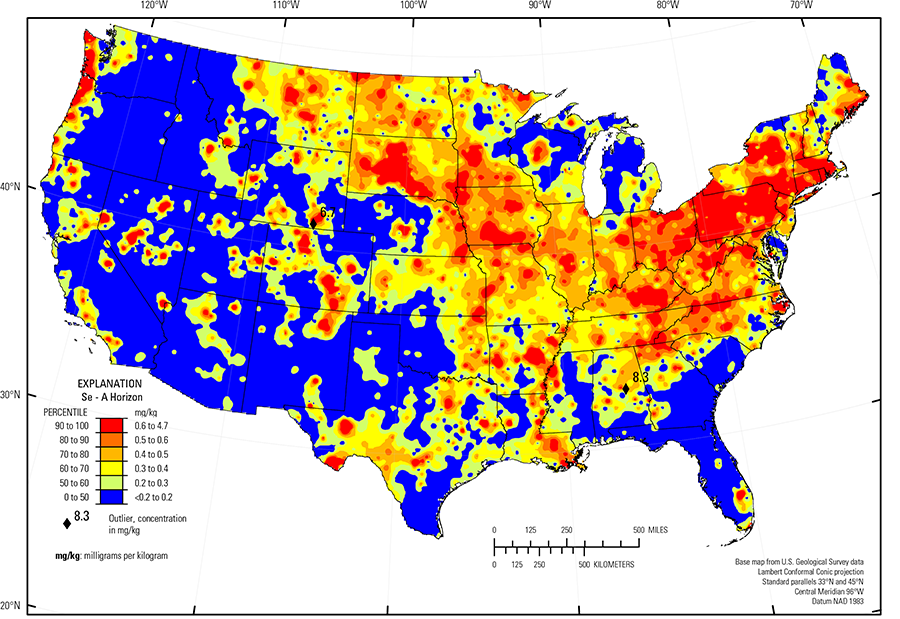
Selenium is somewhat unusual in that the pattern of distribution in the soil A horizon and top 0- to 5-cm layer is substantially different from the pattern in the soil C horizon. The area of soils with detectable Se is significantly larger for the nearer–surface soils. This is especially true for parts of the Upper Midwest where both the soil A horizon and the top 0- to 5-cm layer have detectable and, in places, relatively enriched Se concentrations, but concentrations in the soil C horizon are below the LLD. This area corresponds very closely with an area of intense agriculture, especially corn production (known as the Corn Belt), suggesting a link between such agriculture and Se enrichment in surface soils. Possible causes of this include: (1) uptake of Se from deeper soils by corn, much of which is returned to the shallower soils after harvesting; or (2) application of phosphate fertilizer that contains trace amounts of Se.
An additional area of high Se concentrations in surface soils includes much of Pennsylvania. There is neither an obvious geological source (abundant shale) nor intense agriculture in that region. The general region contains many coal–fired power plants with large generating capacity. Selenium is a common trace element in coal and can be released during combustion in gaseous form. Pollution control during modern coal combustion may recover much of volatilized Se, but perhaps there is a legacy of past practices reflected in the elevated Se in soils of this region.
Statistics - 0 TO 5 CM
| Number of samples | 4,841 |
| LLD | 0.2 mg/kg |
| Number below LLD | 2,154 |
| Minimum | <0.2 mg/kg |
| 5 percentile | <0.2 mg/kg |
| 25 percentile | <0.2 mg/kg |
| 50 percentile | 0.2 mg/kg |
| 75 percentile | 0.4 mg/kg |
| 95 percentile | 0.8 mg/kg |
| Maximum | 6.9 mg/kg |
| MAD | ND |
| Robust CV | ND |
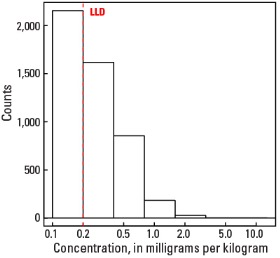
Histogram
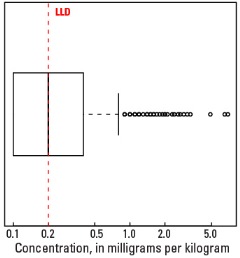
Boxplot
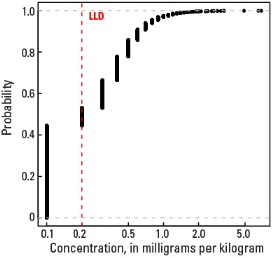
Empirical cumulative distribution function
Statistics - A Horizon
| Number of samples | 4,813 |
| LLD | 0.2 mg/kg |
| Number below LLD | 2,116 |
| Minimum | <0.2 mg/kg |
| 5 percentile | <0.2 mg/kg |
| 25 percentile | <0.2 mg/kg |
| 50 percentile | 0.2 mg/kg |
| 75 percentile | 0.4 mg/kg |
| 95 percentile | 0.8 mg/kg |
| Maximum | 8.3 mg/kg |
| MAD | ND |
| Robust CV | ND |
Histogram

Boxplot

Empirical cumulative distribution function
Statistics - C Horizon
| Number of samples | 4,780 |
| LLD | 0.2 mg/kg |
| Number below LLD | 2,718 |
| Minimum | <0.2 mg/kg |
| 5 percentile | <0.2 mg/kg |
| 25 percentile | <0.2 mg/kg |
| 50 percentile | <0.2 mg/kg |
| 75 percentile | 0.3 mg/kg |
| 95 percentile | 0.9 mg/kg |
| Maximum | 7.5 mg/kg |
| MAD | ND |
| Robust CV | ND |
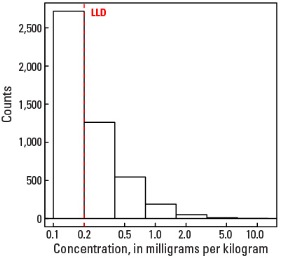
Histogram
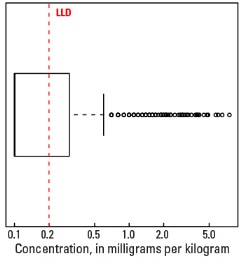
Boxplot