


The purpose of these interpretive discussions is to provide a perspective on regional- and national-scale variations in element and mineral distributions in soils and their likely causes. The significant spatial variations shown by most elements and minerals can commonly be attributed to geologic sources in underlying parent materials, but other spatial variations seem clearly related to additional factors such as climate, the age of soils, transported source material, and anthropogenic influences. We attempt to distinguish the influence of these various factors on a regional and national scale. Numerous more local features might similarly be related to these same factors, but these features also have some probability of being an artifact of a random sampling of variable compositions, so that there is some probability of samples with similar compositions occurring in clusters of two or more adjacent sites by chance. Distinguishing such random occurrences from true variability is beyond the scope of the data from which these maps are constructed. Some caution, therefore, is advisable in interpreting the significance of these more local features unless some unique sources or processes can clearly be related to them.
Copper (Cu) is a metallic trace element used extensively in electrical applications, construction, coinage, and cookware. Small amounts of Cu are essential for human health and are present in a variety of enzymes and proteins. However, elevated levels of Cu can be harmful. More information about the toxicity of Cu (or other elements and substances) and its potential negative human health impacts can be found at the Agency for Toxic Substances and Disease Registry (ATSDR) website, or click to download a fact sheet about Cu.
Copper is one of the few metals to occur in nature in its pure metallic state (native copper). It has a high affinity for sulfur (S) and forms many sulfide minerals, such as chalcopyrite (CuFeS2), chalcocite (Cu2S), bornite (Cu5FeS4), covellite (CuS), and digenite (Cu9S5). Copper is frequently incorporated into ferromagnesian minerals such as olivine, pyroxene, amphibole, and biotite. In soils, Cu is frequently associated with iron (Fe) oxides and hydroxides and readily sorbs onto organic matter.
The average abundance of Cu in the Earth's upper continental crust is estimated to be 27 milligrams per kilogram (mg/kg) (Hu and Gao, 2008). Mafic rocks, such as basalt and gabbro, and ultramafic rocks, such as serpentinite and peridotite, are elevated in Cu with concentrations generally ranging between 30 and 160 mg/kg. Among the other common rock types, shale has elevated Cu with concentrations averaging about 45 mg/kg and ranging from about 18 to 120 mg/kg. Granite averages about 12 mg/kg, limestone about 6 mg/kg, and sandstone about 2 mg/kg.
The distribution of mineral resource deposits with Cu as a commodity (major or minor) in the United States, extracted from the U.S. Geological Survey (USGS) Mineral Resource Data System (MRDS) website, can be seen by hovering the mouse here. Statistics and information on the worldwide supply of, demand for, and flow of Cu–bearing materials are available through the USGS National Minerals Information Center (NMIC) website.
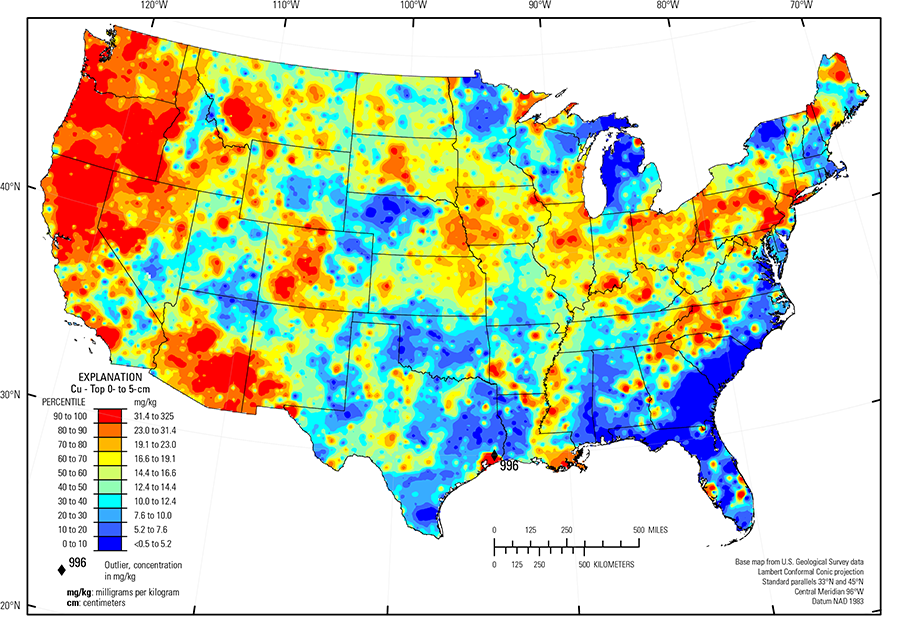
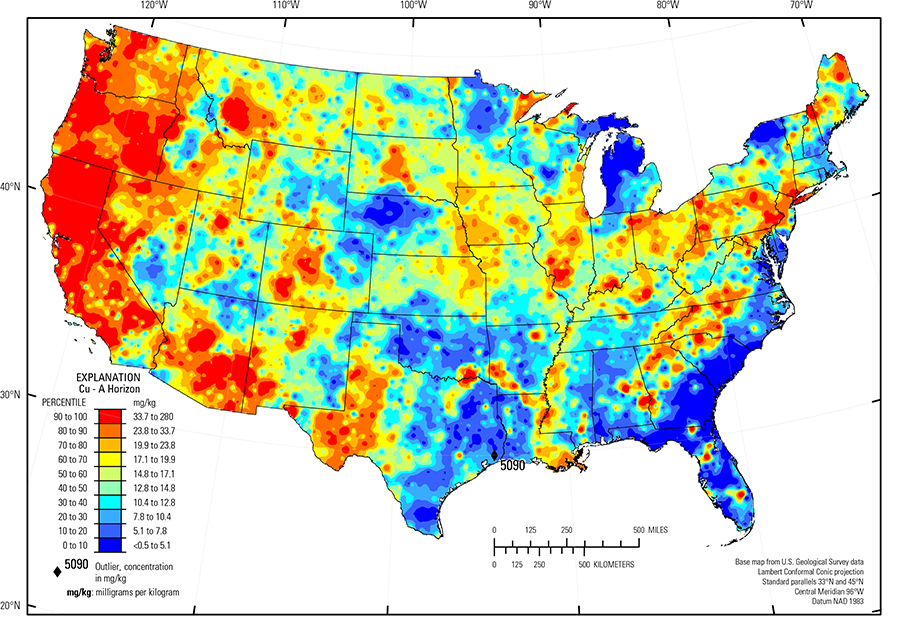
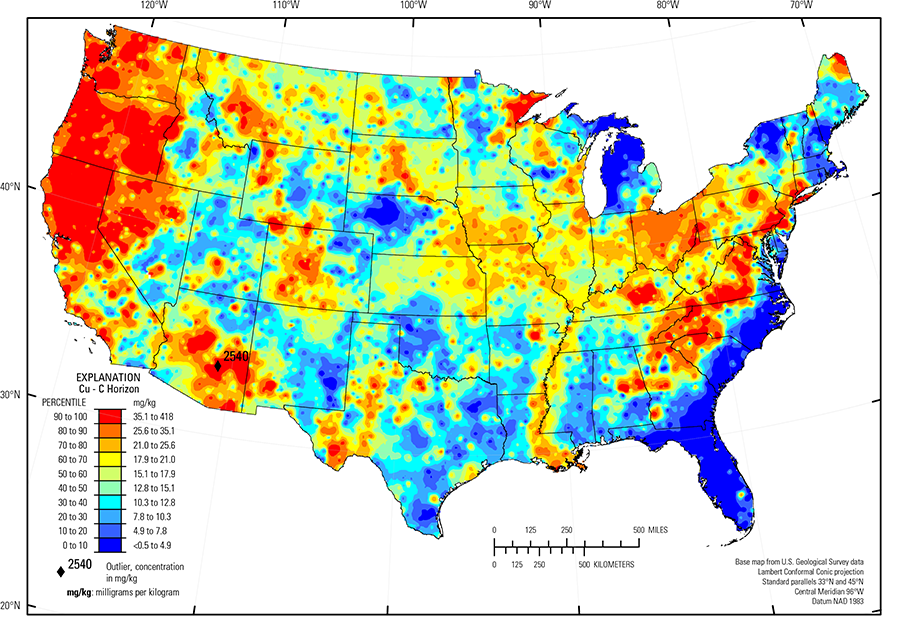
In our data, there is little variation in the median Cu concentration with depth in the soil profile. The median Cu concentration for samples collected from the top 0- to 5-cm layer and the soil A horizon is 14.4 and 14.8 mg/kg, respectively (see the summary statistics [open in new window]). The median Cu concentration for the soil C horizon is 15.1 mg/kg. The geochemical maps for each sample type show very similar patterns of Cu distribution.
The distribution of Cu in soils of the conterminous United States is primarily controlled by the composition of underlying soil parent materials. Areas of elevated Cu concentrations in soils are seen in:
- Northern California, Oregon, western Washington, northeastern Minnesota, extreme southeastern Pennsylvania, central Maryland, central and western Virginia, western North Carolina, western South Carolina, and central Arizona, where parent materials are, at least in part, ultramafic or mafic rocks or glacial deposits derived from these rock types;
- Eastern Montana, North Dakota, South Dakota, Iowa, eastern Nebraska, eastern Kansas, northern Missouri, Illinois, Indiana, Kentucky, Ohio, and Pennsylvania, where parent materials are dominantly shale, clayey till or glacial deposits containing a significant amount of shale; and
- Northern Idaho, western Montana, southeastern Arizona, and west-central Colorado where Cu is present as a major or minor constituent of ore in areas of historical or current mining activities. Soils in these areas may be formed on mineralized bedrock containing elevated concentrations of Cu. In areas of extensive mining and mineral processing, it is also possible that there may be a component of Cu contamination from these activities superimposed on elevated background concentrations
The Gulf and Atlantic Coastal Plain (Fenneman and Johnson, 1946) is bisected by the Southern Mississippi River Alluvium and the Southern Mississippi Valley Loess(USDA, 2006). Alluvial sediments have deposited in the Mississippi River valley as the river flooded in recent geologic time. When these sediments dried, winds picked up the fine material and deposited it in thick loess sheets, mainly along the east side of the river valley. The youngest loess sheets are about 10,000 years old. A pattern of higher Cu concentrations in soils developed on these young sediments reflects long–range transport of Cu–bearing materials from the upper part of the Mississippi River drainage basin.
Areas of low Cu concentrations in soils include:
- Atlantic Coastal Plain (Fenneman and Johnson, 1946) where parent materials are dominantly quartz–rich sedimentary rocks and unconsolidated sediments;
- Nebraska Sand Hills (USDA, 2006), where parent materials are quartz– and plagioclase–rich, unconsolidated sand dunes and sand sheets; and
- Northern and western Michigan where parent materials comprise quartz–rich glacial deposits.
Statistics - 0 TO 5 CM
| Number of samples | 4,841 |
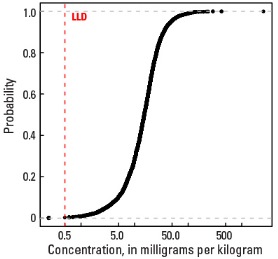
| LLD | 0.5 mg/kg |
| Number below LLD | 2 |
| Minimum | <0.5 mg/kg |
| 5 percentile | 3.8 mg/kg |
| 25 percentile | 8.8 mg/kg |
| 50 percentile | 14.4 mg/kg |
| 75 percentile | 20.9 mg/kg |
| 95 percentile | 43.3 mg/kg |
| Maximum | 996 mg/kg |
| MAD | 8.75 mg/kg |
| Robust CV | 60.7% |
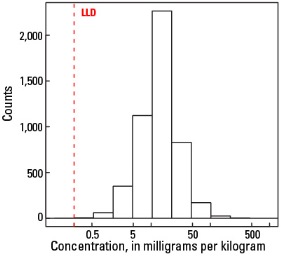
Histogram
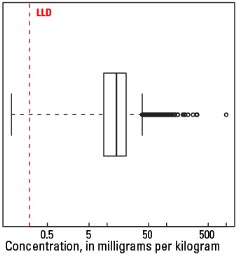
Boxplot
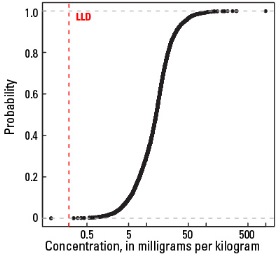
Empirical cumulative distribution function
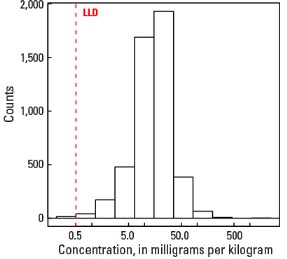
Statistics - A Horizon
| Number of samples | 4,813 |
| LLD | 0.5 mg/kg |
| Number below LLD | 4 |
| Minimum | <0.5 mg/kg |
| 5 percentile | 3.6 mg/kg |
| 25 percentile | 9.1 mg/kg |
| 50 percentile | 14.8 mg/kg |
| 75 percentile | 21.8 mg/kg |
| 95 percentile | 47.7 mg/kg |
| Maximum | 5,090 mg/kg |
| MAD | 9.19 mg/kg |
| Robust CV | 62.1 % |
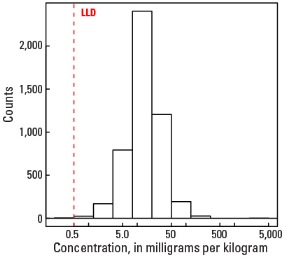
Histogram
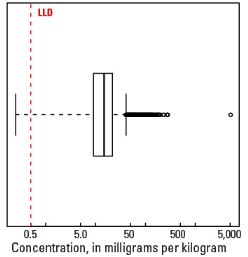
Boxplot
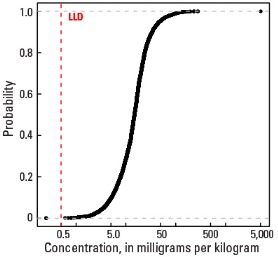
Empirical cumulative distribution function
Statistics - C Horizon
| Number of samples | 4,780 |
| LLD | 0.5 mg/kg |
| Number below LLD | 14 |
| Minimum | <0.5 mg/kg |
| 5 percentile | 2.9 mg/kg |
| 25 percentile | 9.2 mg/kg |
| 50 percentile | 15.1 mg/kg |
| 75 percentile | 23.0 mg/kg |
| 95 percentile | 47.7 mg/kg |
| Maximum | 2,540 mg/kg |
| MAD | 9.93 mg/kg |
| Robust CV | 65.8 % |
Histogram
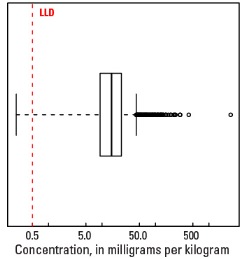
Boxplot