


The purpose of these interpretive discussions is to provide a perspective on regional- and national-scale variations in element and mineral distributions in soils and their likely causes. The significant spatial variations shown by most elements and minerals can commonly be attributed to geologic sources in underlying parent materials, but other spatial variations seem clearly related to additional factors such as climate, the age of soils, transported source material, and anthropogenic influences. We attempt to distinguish the influence of these various factors on a regional and national scale. Numerous more local features might similarly be related to these same factors, but these features also have some probability of being an artifact of a random sampling of variable compositions, so that there is some probability of samples with similar compositions occurring in clusters of two or more adjacent sites by chance. Distinguishing such random occurrences from true variability is beyond the scope of the data from which these maps are constructed. Some caution, therefore, is advisable in interpreting the significance of these more local features unless some unique sources or processes can clearly be related to them.
Sulfur (S) is a nonmetallic element whose primary use is in the manufacture of sulfuric acid (H2SO4). Large amounts of sulfuric acid are used annually in the manufacture of fertilizers, lead (Pb)–acid batteries, and numerous other industrial processes. Sulfur is also used in the vulcanization of black rubber, as a fungicide, and in black gunpowder. Most sulfur is produced as a byproduct from the processing of fossil fuels. Sulfur is essential to all organisms, including humans, and is considered to be nontoxic. Some sulfur compounds, however, such as carbon disulfide (CS2), hydrogen sulfide (H2S), and sulfur dioxide (SO2), are toxic.
Sulfur is reported here as total S, with no distinction among S species. The abundance of S in the Earth's upper continental crust has most recently been estimated to be 0.0062 weight percent (wt. %) (Rudnick and Gao, 2003). However, other estimates put the average upper crustal abundance near 0.03 wt. % (Taylor and McLennan, 1995; Gao and others, 1998) and 0.095 wt. % (Wedepohl, 1995). Sulfur in soil can be within primary sulfide or sulfate minerals, such as pyrite (FeS2) or gypsum (CaSO4•2H2O), respectively. Sulfur, likely as pyrite or other sulfide minerals, occurs in a number of rock types; the average S concentration is about 0.06 wt. % to 0.09 wt. % in ultramafic and mafic rocks, about 0.11 wt. % in shale, and notably about 2.0 wt. % in coal. Detectable pyrite is exceedingly rare in the mineral soils collected for this study, as would be expected in an oxidized soil environment. Gypsum is more common, both as a primary and secondary mineral. Sulfur in soil also can bind to an organic matrix or, as sulfate (SO42–), be absorbed onto iron (Fe) or aluminum (Al) hydroxides (Johnson, 1984). Sulfur is an essential plant nutrient and sulfur cycling in soil is complex. The distribution of S through the soil profile can be highly variable because of complex reactions among possible S species. Fluctuating accumulation and dissolution of pedogenic gypsum under changing climate conditions strongly influences S concentrations. Sulfur from the atmosphere can be added to soils by precipitation, and where deposition exceeds plant uptake, excess S can accumulate as organic S. Sulfur also has been used in agricultural amendments in areas with soil S deficiencies. Sulfur can also be lost from soils by leaching or by volatilization to the atmosphere.
The distribution of mineral resource deposits with S as a commodity (major or minor) in the United States, extracted from the U.S. Geological Survey (USGS) Mineral Resource Data System (MRDS) website, can be seen by hovering the mouse here. Statistics and information on the worldwide supply of, demand for, and flow of S are available through the USGS National Minerals Information Center (NMIC) website.
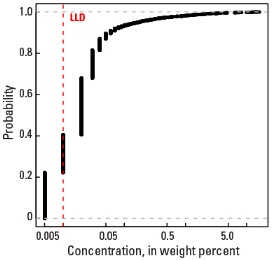
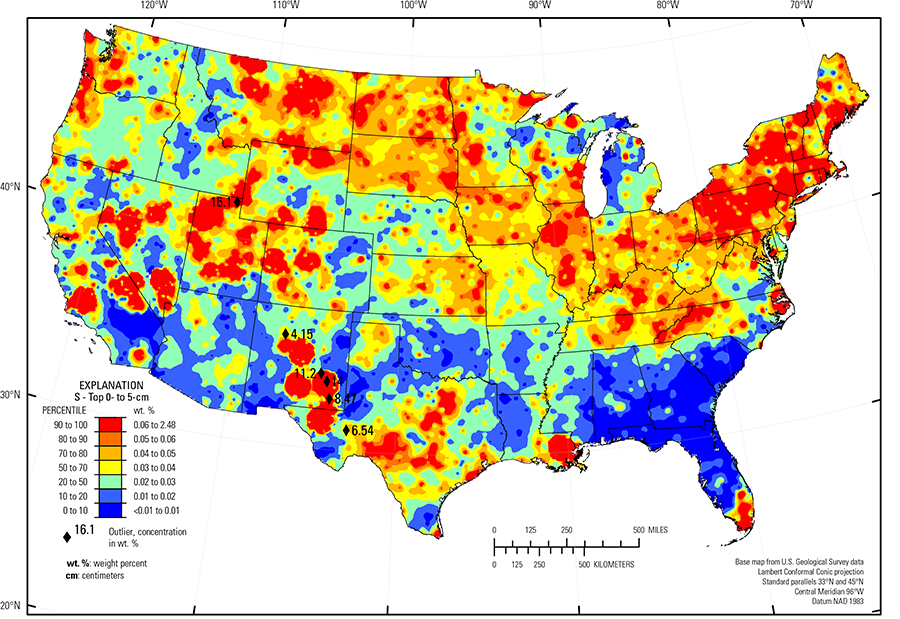
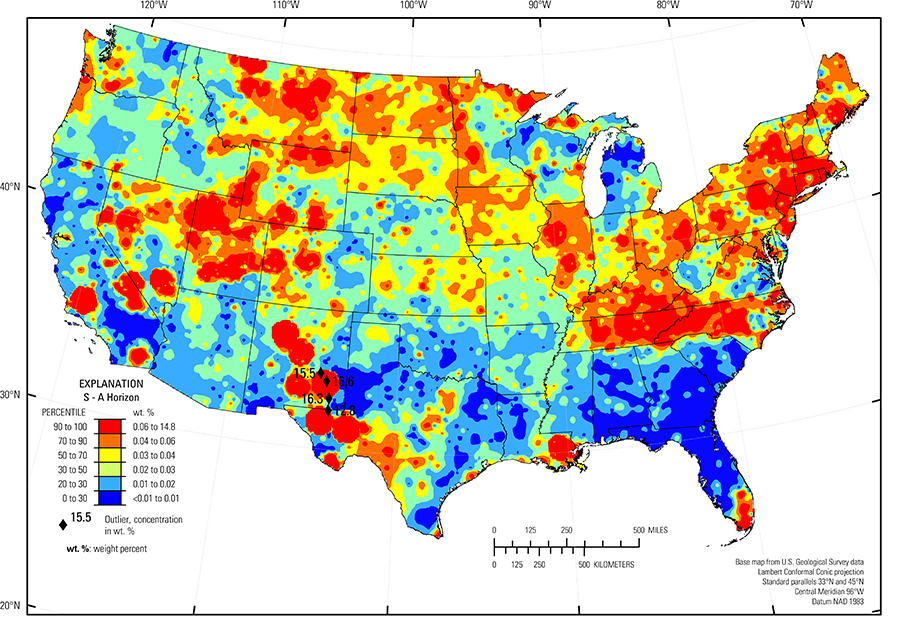
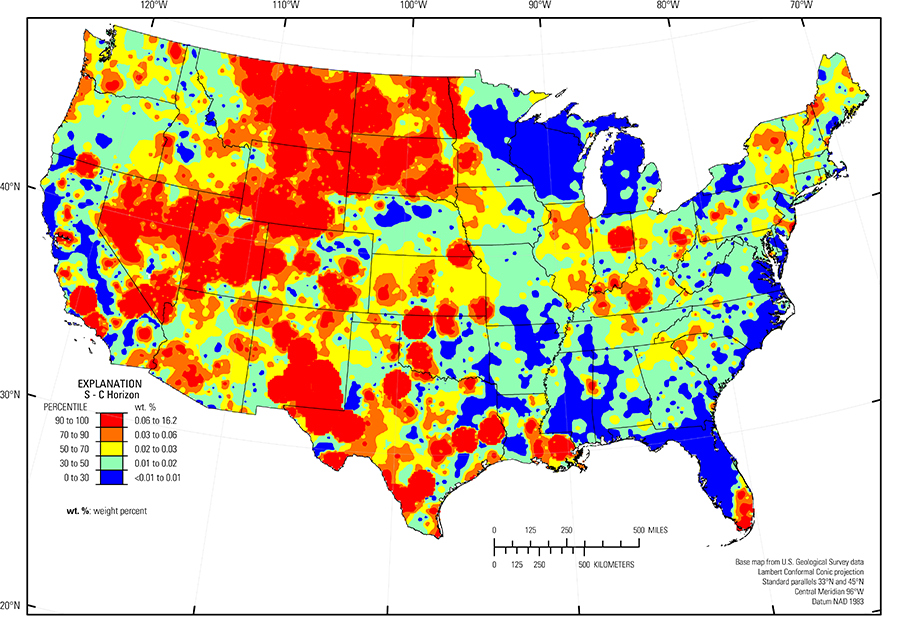
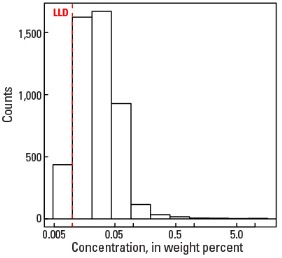
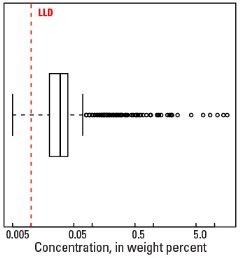
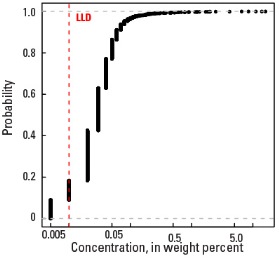
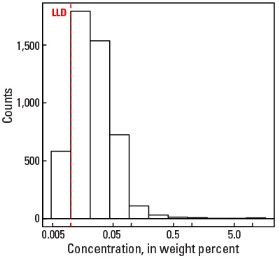
In our data, the median S concentration is 0.02 wt. % in the soil C horizon, and 0.03 wt. % in both the soil A horizon and the top 0- to 5-cm layer (see the summary statistics [open in new window]). All median values are relatively close to the lower limit of determination (LLD) of 0.01 wt. %. Slightly more than 88 percent of all samples have S concentrations below the LLD. In the interpolated maps, all samples with values below the LLD are grouped together in a single class for color coding. Thus, the map for S in the soil C horizon has five classes, the map for S in the soil A horizon has six classes, and the map for S in the top 0- to 5-cm layer has seven classes. Anomalously high S values in the soil A horizon (four sites), and the top 0- to 5-cm layer (six sites) were removed prior to constructing the interpolated maps and are shown as diamond symbols on the maps.
For all soils, the highest S concentrations are typically related to the occurrence of gypsum in soils formed on weathered sedimentary rocks, within restricted basins, or on alluvium or eolian deposits derived from weathered sandstone, shale, limestone, or evaporitic deposits, and often in arid climates. High S concentrations in gypsum–bearing (and often calcareous) soils are prevalent in the Southern Desertic Basins, Plains, and Mountains (USDA, 2006) in New Mexico and Texas, the Warm Central Desertic Basins and Plateaus (USDA, 2006) in Utah and Colorado, as well as the Cool Central Desertic Basins and Plateaus and Northern Intermountain Desertic Basins (USDA, 2006) in Wyoming, and the Great Salt Lake Area (USDA, 2006). Where soils developed on shale or alluvium derived from shale, such as the Pierre Shale Plains (USDA, 2006) in western South Dakota, northeastern Wyoming, and eastern Montana, elevated S concentrations likely result from the formation of gypsum following pyrite weathering. High S concentrations in soils also occur more locally in western Oklahoma, southern California, south central New Mexico, and eastern Texas, where parent materials contain either shale or gypsum. Soils collected from highly organic subsoils in Indiana and Louisiana contain gypsum, and consequently have elevated S concentrations. Soils developed in shallow freshwater biogenic marl formed on limestone bedrock within the Everglades (USDA, 2006) also contains significant S concentrations.
Areas with low S concentrations or concentrations below the LLD in the soil C horizon, for example, in central Minnesota, Wisconsin, western Michigan, and much of northern and central Florida, typically have sandy soil, with no original source of S.
In the soil A horizon, all sites containing gypsum have commensurate high S concentrations. Surface soil lacking S–bearing minerals can have elevated S concentrations related to somewhat elevated organic carbon concentrations. The effect of organic carbon on soil chemistry is demonstrated by an apparent break in S concentration in both the soil A horizon and the top 0- to 5-cm layer across the state borders of Tennessee and North Carolina with Alabama, Georgia, and South Carolina. Among these States, choices made by sampling crews, including landscape setting (for example, forested sites versus agricultural sites) and the criteria used to define the base of the soil A horizon both influence the organic carbon concentrations of topsoils. Thus, those elements that bind with organic carbon, such as S, have patterns that closely reflect the organic carbon patterns. This relationship between organic carbon and S likely controls the distribution of S along the west coasts of Washington and northern Oregon, where S deposited by the high precipitation of Pacific frontal storms binds to the organic soils of the region. In the agricultural fields in the Midwest (for example, in Illinois, Indiana, and Ohio) higher S concentrations in the soil A horizon than in the soil C horizon may reflect inputs from soil amendments or plant residues.
Statistics - 0 TO 5 CM
| Number of samples | 4,841 |
| LLD | 0.01 wt. % |
| Number below LLD | 436 |
| Minimum | <0.01 wt. % |
| 5 percentile | <0.01 wt. % |
| 25 percentile | 0.02 wt. % |
| 50 percentile | 0.03 wt. % |
| 75 percentile | 0.04 wt. % |
| 95 percentile | 0.08 wt. % |
| Maximum | 16.1 wt. % |
| MAD | ND |
| Robust CV | ND |
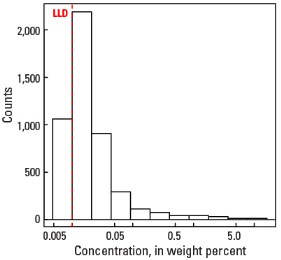
Histogram
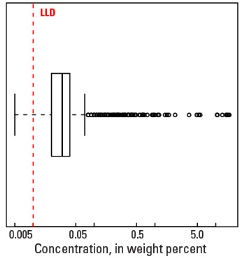
Boxplot
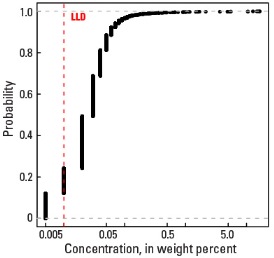
Empirical cumulative distribution function
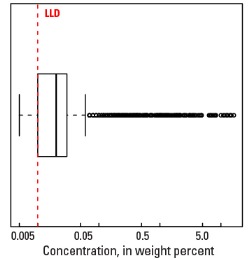
Statistics - A Horizon
| Number of samples | 4,813 |
| LLD | 0.01 wt. % |
| Number below LLD | 583 |
| Minimum | <0.01 wt. % |
| 5 percentile | <0.01 wt. % |
| 25 percentile | 0.02 wt. % |
| 50 percentile | 0.03 wt. % |
| 75 percentile | 0.04 wt. % |
| 95 percentile | 0.08 wt. % |
| Maximum | 16.6 wt. % |
| MAD | ND |
| Robust CV | ND |
Histogram
Boxplot
Empirical cumulative distribution function
Statistics - C Horizon
| Number of samples | 4,780 |
| LLD | 0.01 wt. % |
| Number below LLD | 1,061 |
| Minimum | <0.01 wt. % |
| 5 percentile | <0.01 wt. % |
| 25 percentile | 0.01 wt. % |
| 50 percentile | 0.02 wt. % |
| 75 percentile | 0.03 wt. % |
| 95 percentile | 0.17 wt. % |
| Maximum | 16.2 wt. % |
| MAD | ND |
| Robust CV | ND |
Histogram
Boxplot