


The purpose of these interpretive discussions is to provide a perspective on regional- and national-scale variations in element and mineral distributions in soils and their likely causes. The significant spatial variations shown by most elements and minerals can commonly be attributed to geologic sources in underlying parent materials, but other spatial variations seem clearly related to additional factors such as climate, the age of soils, transported source material, and anthropogenic influences. We attempt to distinguish the influence of these various factors on a regional and national scale. Numerous more local features might similarly be related to these same factors, but these features also have some probability of being an artifact of a random sampling of variable compositions, so that there is some probability of samples with similar compositions occurring in clusters of two or more adjacent sites by chance. Distinguishing such random occurrences from true variability is beyond the scope of the data from which these maps are constructed. Some caution, therefore, is advisable in interpreting the significance of these more local features unless some unique sources or processes can clearly be related to them.
Niobium (Nb) is a metallic trace element used in alloys, including stainless steel. Its alloys are used in jet engines, oil and gas pipelines, superconducting magnets, and beams and girders for buildings and oil rigs. This element has no known biological role. Niobium forms a variety of minerals, most of them oxides such as columbite ((Fe,Mn)(Nb,Ta)2)O6). The element occurs in trace amounts in minerals such as biotite, rutile, sphene, cassiterite, and zircon.
The distribution of Nb in soils of the conterminous United States is controlled by the composition of underlying soil parent materials. Niobium has a large ionic radius, so it does not enter the structure of most rock–forming minerals. The average concentration of Nb in the Earth's upper continental crust is estimated to be about 11.6 milligrams per kilogram (mg/kg) (Hu and Gao, 2008). Niobium can replace potassium (K) in the sheet silicate mineral biotite. Biotite occurs in many igneous rocks, but is more common in felsic rocks, such as granite and rhyolite, and in pegmatite. The average concentration of Nb in felsic rocks is approximately 18 mg/kg. Biotite also is commonly formed by metamorphism of clay–rich rocks, such as shale. The average Nb concentration in shale is approximately 17 mg/kg. In magmas, Nb is increasingly concentrated in late–stage liquids and can enter late–forming accessory minerals such as rutile, titanite (also called sphene) and zircon. These accessory minerals also can be present in felsic rocks and pegmatite, as well as in alkalic igneous rocks. The lowest concentrations of Nb occur in limestone with an average of about 0.1 mg/kg.
Because most accessory minerals are resistant to weathering, they commonly are incorporated into derivative sedimentary rocks and unconsolidated materials, such as alluvial, eolian, and glacial deposits. Zircon is a common detrital mineral that, when released from its parent rock by weathering, can accumulate by density sorting in fluvial, lacustrine, or oceanic coastal shoreline settings. Niobium is largely immobile in the soil environment, but can be concentrated through the resistance of refractory accessory minerals to weathering and the removal of more soluble elements.
Statistics and information on the worldwide supply of, demand for, and flow of Nb–bearing materials are available through the U.S. Geological Survey (USGS) National Minerals Information Center (NMIC) website.
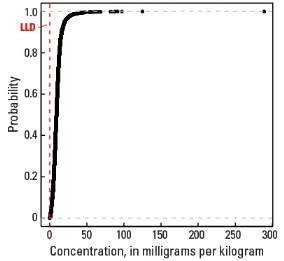
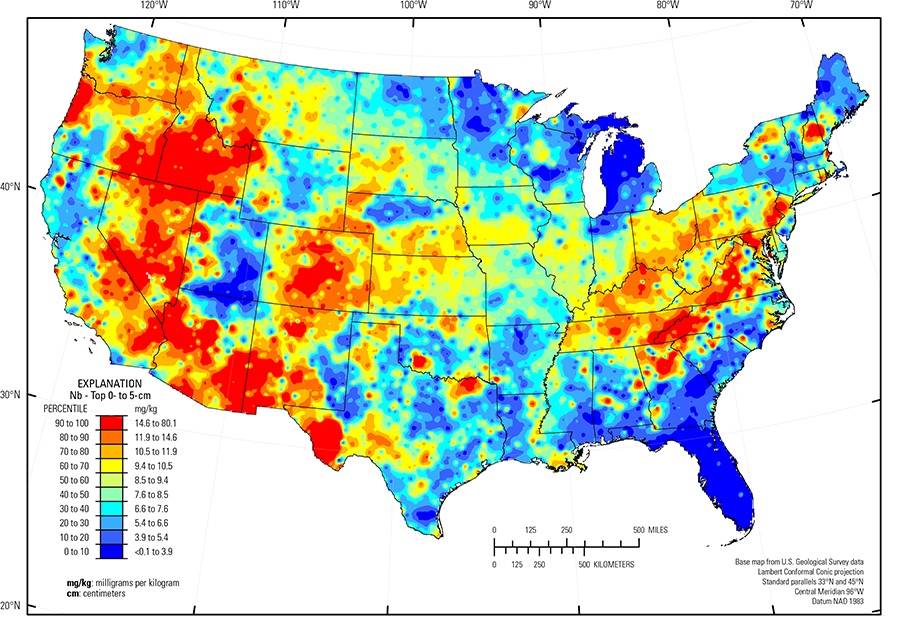
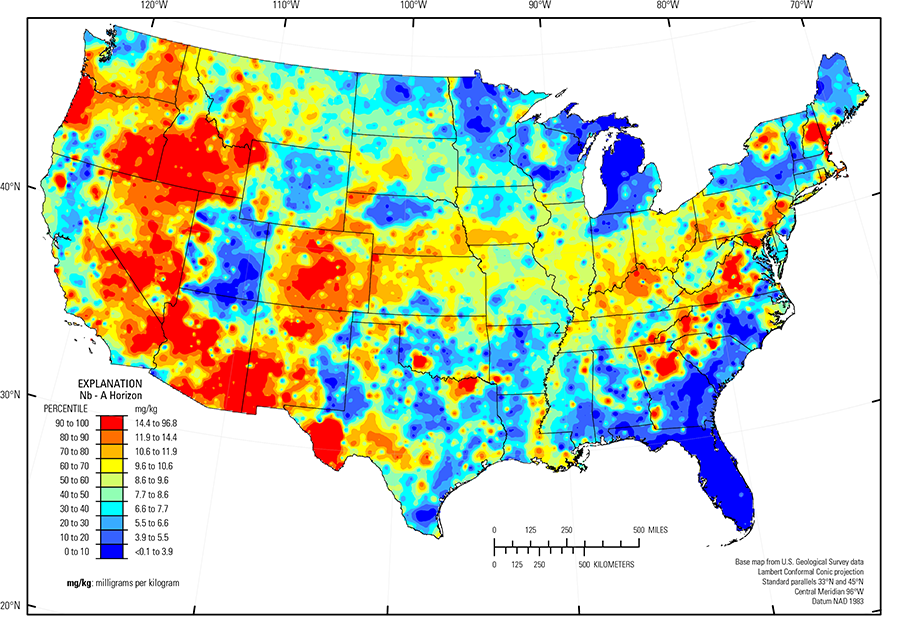
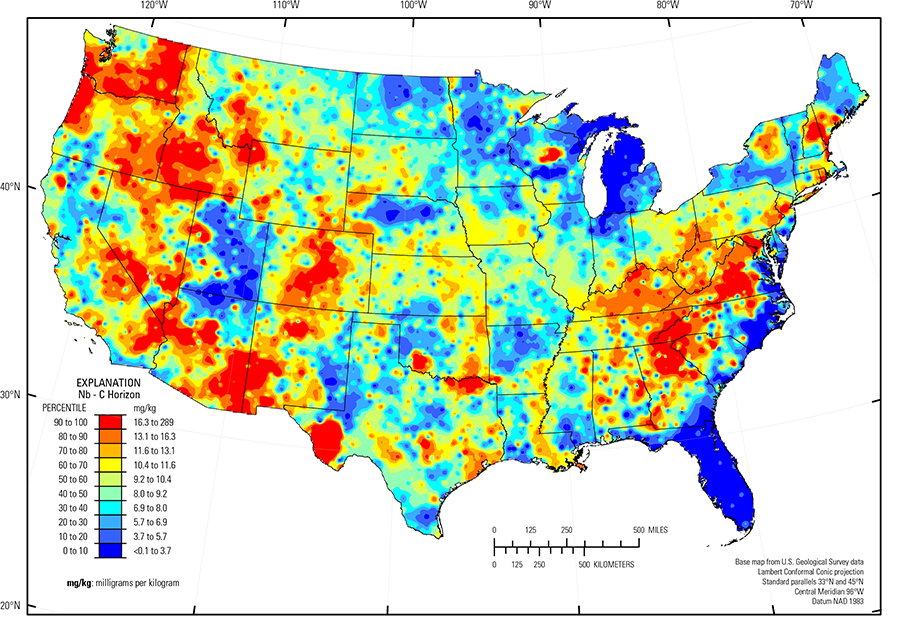
In our data, Nb has a median concentration of 9.2 mg/kg in the soil C horizon, 8.6 mg/kg in the soil A horizon, and 8.5 mg/kg in the top 0- to 5-cm layer (see the summary statistics [open in new window]). Nearly all samples have Nb concentrations above the lower limit of determination (LLD) of 0.1 mg/kg . Regional map patterns for Nb are somewhat consistent among the three soil sample types.
High Nb concentrations occur in soils developed on felsic rocks (granite and rhyolite and metamorphic equivalents) that are scattered throughout the West, for example in northern, central, and southwestern New Mexico, southeastern and central Arizona, central Colorado, southern Idaho, and Yellowstone National Park in northwestern Wyoming. In Texas, soils developed on rhyolite, alkalic volcanic rocks, and derived alluvium in the Trans–Pecos volcanics (Schruben and others, 1997) have elevated Nb concentrations as do soils formed on Precambrian granite in the Wichita Mountains (USDA, 2006) of Oklahoma. In the east, Nb–enriched soils in central New Hampshire, eastern Massachusetts, and in Rhode Island developed on till likely influenced by local felsic sources from the White Mountains (Fenneman and Johnson, 1946). Precambrian and Paleozoic granite and metamorphosed felsic rocks are the parent materials for many soils in the Piedmont (Fenneman and Johnson, 1946) and Southern Blue Ridge (USDA, 2006). Soils in the Piedmont are old and highly weathered. High Nb concentrations in these soils may be related to the presence of resistant accessory minerals, such as zircon or rutile. Occasional high Nb concentrations in soils of the Gulf and Atlantic Coastal Plain (Fenneman and Johnson, 1946) (for example, in Georgia) are likely related to transported detrital minerals eroded from the weathered highlands of the Piedmont.
Soils along the northwestern coast of Oregon and the southwestern coast of Washington that developed on marine tuff, mudstone, and carbonaceous/micaceous siltstone have elevated Nb concentrations in both the soil A and C horizons. Soils with elevated Nb concentrations in the Columbia Plateau (Fenneman and Johnson, 1946) and Palouse and Nez Perce Prairies (USDA, 2006) developed on loess and volcanic ash covering basalt flows.
Soils in the Western and Central Allegheny Plateau (USDA, 2006) and Southern Appalachian Ridges and Valleys (USDA, 2006) that developed on cyclic beds of sandstone, shale, and coal, and related unconsolidated materials have relatively high Nb concentrations. Soil in the Kentucky Bluegrass area (USDA, 2006) that developed on phosphatic limestone also have relatively high Nb concentrations.
Soils developed on sandy glacial deposits in northeastern Minnesota, north central Wisconsin, and western Michigan all have very low Nb concentrations. Other large areas with low Nb concentrations in soils (and soil parent materials) include:
- Colorado Plateau (USDA, 2006) (quartz–rich sandstone and eolian deposits);
- Nebraska Sand Hills (USDA, 2006) (quartz– and plagioclase–rich unconsolidated sand dunes and sand sheets);
- Southern High Plains (USDA, 2006) (quartz–rich eolian sands and alluvial sediments); and
- Florida (fine–grained silt, sand, and calcareous marine deposits).
Statistics - 0 TO 5 CM
| Number of samples | 4,841 |
| LLD | 0.1 mg/kg |
| Number below LLD | 2 |
| Minimum | <0.1 mg/kg |
| 5 percentile | 2.8 mg/kg |
| 25 percentile | 6.0 mg/kg |
| 50 percentile | 8.5 mg/kg |
| 75 percentile | 11.1 mg/kg |
| 95 percentile | 18.3 mg/kg |
| Maximum | 80.1 mg/kg |
| MAD | 3.71 mg/kg |
| Robust CV | 43.6% |
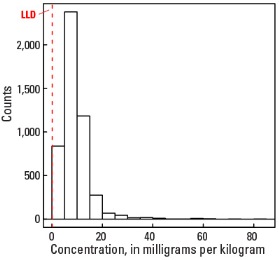
Histogram
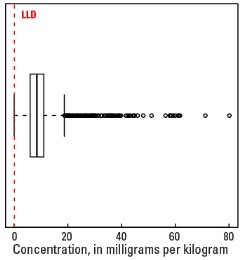
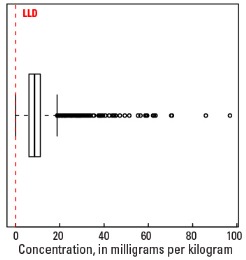
Boxplot
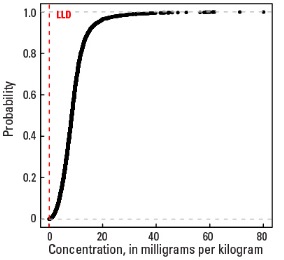
Empirical cumulative distribution function
Statistics - A Horizon
| Number of samples | 4,813 |
| LLD | 0.1 mg/kg |
| Number below LLD | 1 |
| Minimum | <0.1 mg/kg |
| 5 percentile | 2.7 mg/kg |
| 25 percentile | 6.1 mg/kg |
| 50 percentile | 8.6 mg/kg |
| 75 percentile | 11.2 mg/kg |
| 95 percentile | 17.7 mg/kg |
| Maximum | 96.8 mg/kg |
| MAD | 3.71 mg/kg |
| Robust CV | 43.1 % |
Histogram
Boxplot
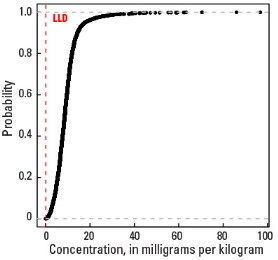
Empirical cumulative distribution function
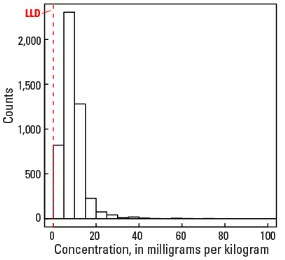
Statistics - C Horizon
| Number of samples | 4,780 |
| LLD | 0.1 mg/kg |
| Number below LLD | 2 |
| Minimum | <0.1 mg/kg |
| 5 percentile | 2.3 mg/kg |
| 25 percentile | 6.3 mg/kg |
| 50 percentile | 9.2 mg/kg |
| 75 percentile | 12.3 mg/kg |
| 95 percentile | 20.3 mg/kg |
| Maximum | 289 mg/kg |
| MAD | 4.45 mg/kg |
| Robust CV | 48.3 % |
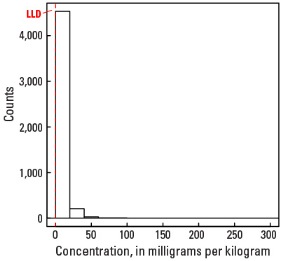
Histogram
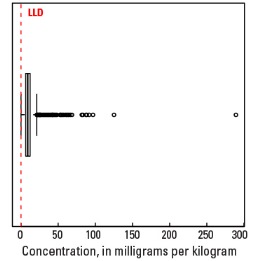
Boxplot