


The purpose of these interpretive discussions is to provide a perspective on regional- and national-scale variations in element and mineral distributions in soils and their likely causes. The significant spatial variations shown by most elements and minerals can commonly be attributed to geologic sources in underlying parent materials, but other spatial variations seem clearly related to additional factors such as climate, the age of soils, transported source material, and anthropogenic influences. We attempt to distinguish the influence of these various factors on a regional and national scale. Numerous more local features might similarly be related to these same factors, but these features also have some probability of being an artifact of a random sampling of variable compositions, so that there is some probability of samples with similar compositions occurring in clusters of two or more adjacent sites by chance. Distinguishing such random occurrences from true variability is beyond the scope of the data from which these maps are constructed. Some caution, therefore, is advisable in interpreting the significance of these more local features unless some unique sources or processes can clearly be related to them.
Silver (Ag) is a metallic trace element that has long been used in jewelry and coinage. Silver also has many industrial uses such as in the manufacture of mirrors, solder and dental alloys, electrical contacts, and batteries. It is still important in photography, though the use of Ag–based imaging has dropped because of the popularity of digital photography. Silver is considered to be nonessential for organisms and has a relatively low toxicity for humans. More information about the toxicity of Ag (or other elements and substances) and its potential negative human health impacts can be found at the Agency for Toxic Substances and Disease Registry (ATSDR) website, or click to download a fact sheet about Ag.
Silver can occur in nature as the native metal; as a primary component in Ag minerals such as acanthite (Ag2S); as an alloy with other metals such as gold (Au); and as a constituent of the ores of other metals such as galena (PbS), which can contain several percent Ag, chalcopyrite (CuFeS2), and sphalerite ((Zn,Fe)S). In soils, Ag can bind to organic material, iron (Fe) and manganese (Mn) oxides and hydroxides, and clay minerals.
The average concentration of Ag in the Earth's upper continental crust is estimated to be about 0.053 milligrams per kilogram (mg/kg) (Rudnick and Gao, 2003). Of the common rock types, the average concentration of Ag is about 0.08 mg/kg for shale, 0.05 mg/kg for granite, 0.01 mg/kg for limestone, and 0.003 mg/kg for sandstone.
The distribution of mineral resource deposits with Ag as a commodity (major or minor) in the United States, extracted from the U.S. Geological Survey (USGS) Mineral Resource Data System (MRDS) website can be seen by hovering the mouse here. Statistics and information on the worldwide supply of, demand for, and flow of Ag are available through the USGS National Minerals Information Center (NMIC) website.
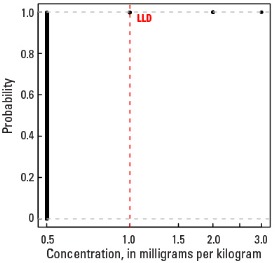
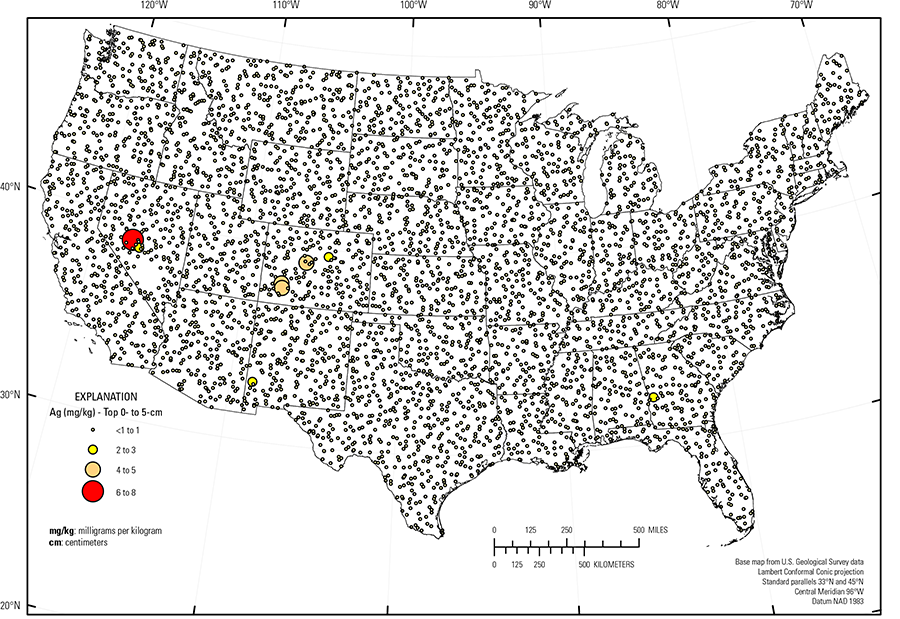
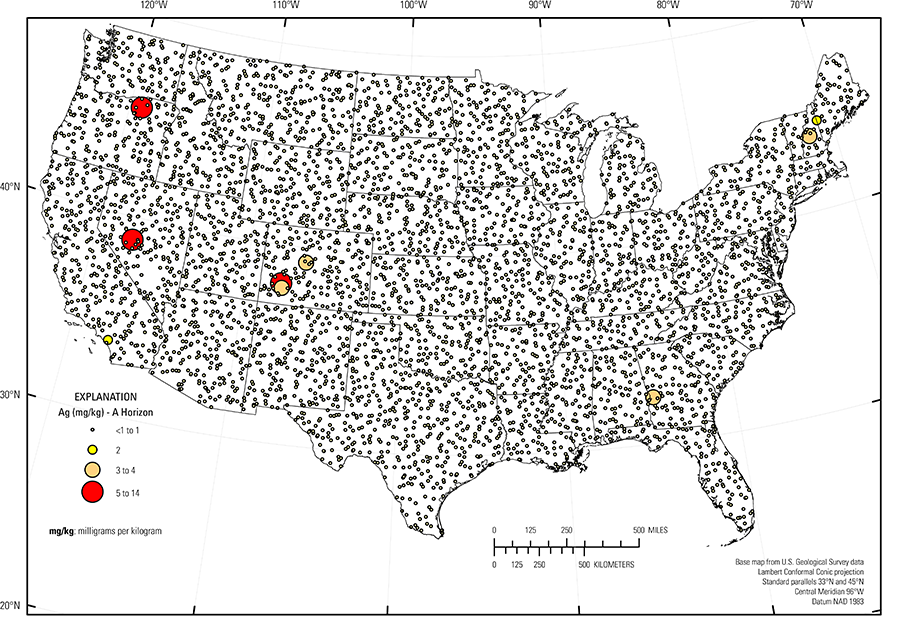
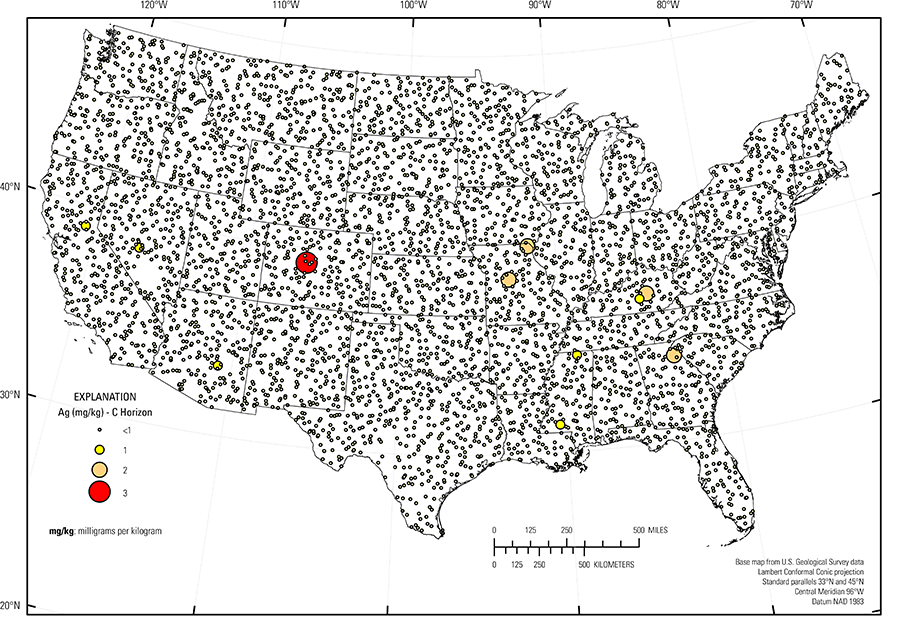
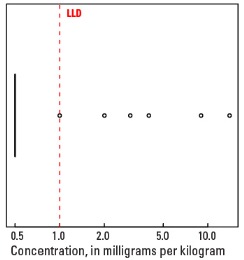
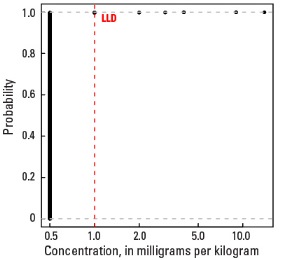
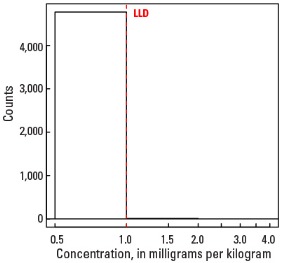
In our study, Ag was determined by inductively coupled plasma–mass spectrometry following a near–total four–acid digestion of the <2–mm fraction of the soil samples. The lower limit of determination (LLD) for Ag by this method is 1 mg/kg as compared to the average upper crustal abundance of 0.053 mg/kg. Therefore, very few samples collected in this study have Ag concentrations above the LLD. Silver concentrations are above the LLD in only 13 of 4,841 samples (0.3 percent) in the top 0- to 5-cm layer; 14 of 4,813 samples (0.3 percent) in the soil A horizon; and 11 of 4,780 samples (0.2 percent) in the soil C horizon. Obviously, the median concentration for all three sample types can only be stated as less than 1 mg/kg (see the summary statistics [open in new window]). Because so few of the samples had Ag concentrations above the LLD, the spatial distribution is shown as proportional symbol maps rather than interpolated and smoothed color surface maps and only portrays the distribution of the highest concentrations determined. It is also important to note that even for samples having uncensored concentrations (concentrations above the LLD), most were less than 5 times the LLD. Data this close to the LLD are subject to considerable uncertainty and the map patterns generated from these data must be interpreted with caution.
The distribution of Ag in soils of the conterminous United States seems to be primarily controlled by the composition of underlying soil parent materials. The few samples in this study with concentrations above the LLD are likely influenced by the occurrence of Ag–bearing sulfide minerals such as galena, sphalerite, and chalcopyrite.
Statistics - 0 TO 5 CM
| Number of samples | 4,841 |
| LLD | 1 mg/kg |
| Number below LLD | 4,828 |
| Minimum | <1 mg/kg |
| 5 percentile | <1 mg/kg |
| 25 percentile | <1 mg/kg |
| 50 percentile | <1 mg/kg |
| 75 percentile | <1 mg/kg |
| 95 percentile | <1 mg/kg |
| Maximum | 7.7 mg/kg |
| MAD | ND |
| Robust CV | ND |
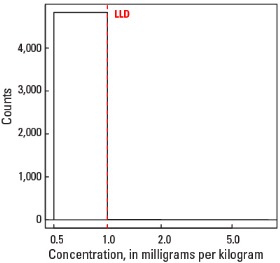
Histogram
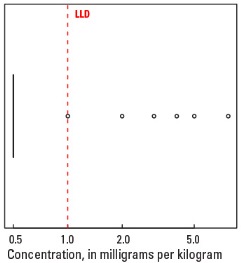
Boxplot
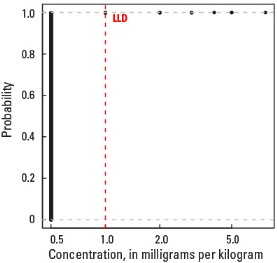
Empirical cumulative distribution function
Statistics - A Horizon
| Number of samples | 4,813 |
| LLD | 1 mg/kg |
| Number below LLD | 4,799 |
| Minimum | <1 mg/kg |
| 5 percentile | <1 mg/kg |
| 25 percentile | <1 mg/kg |
| 50 percentile | <1 mg/kg |
| 75 percentile | <1 mg/kg |
| 95 percentile | <1 mg/kg |
| Maximum | 14 mg/kg |
| MAD | ND |
| Robust CV | ND |
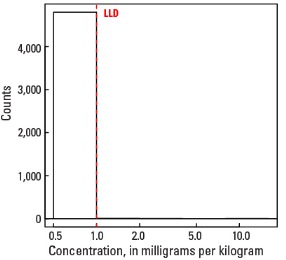
Histogram
Boxplot
Empirical cumulative distribution function
Statistics - C Horizon
| Number of samples | 4,780 |
| LLD | 1 mg/kg |
| Number below LLD | 4,769 |
| Minimum | <1 mg/kg |
| 5 percentile | <1 mg/kg |
| 25 percentile | <1 mg/kg |
| 50 percentile | <1 mg/kg |
| 75 percentile | <1 mg/kg |
| 95 percentile | <1 mg/kg |
| Maximum | 3 mg/kg |
| MAD | ND |
| Robust CV | ND |
Histogram
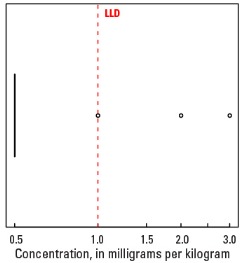
Boxplot