


The purpose of these interpretive discussions is to provide a perspective on regional- and national-scale variations in element and mineral distributions in soils and their likely causes. The significant spatial variations shown by most elements and minerals can commonly be attributed to geologic sources in underlying parent materials, but other spatial variations seem clearly related to additional factors such as climate, the age of soils, transported source material, and anthropogenic influences. We attempt to distinguish the influence of these various factors on a regional and national scale. Numerous more local features might similarly be related to these same factors, but these features also have some probability of being an artifact of a random sampling of variable compositions, so that there is some probability of samples with similar compositions occurring in clusters of two or more adjacent sites by chance. Distinguishing such random occurrences from true variability is beyond the scope of the data from which these maps are constructed. Some caution, therefore, is advisable in interpreting the significance of these more local features unless some unique sources or processes can clearly be related to them.
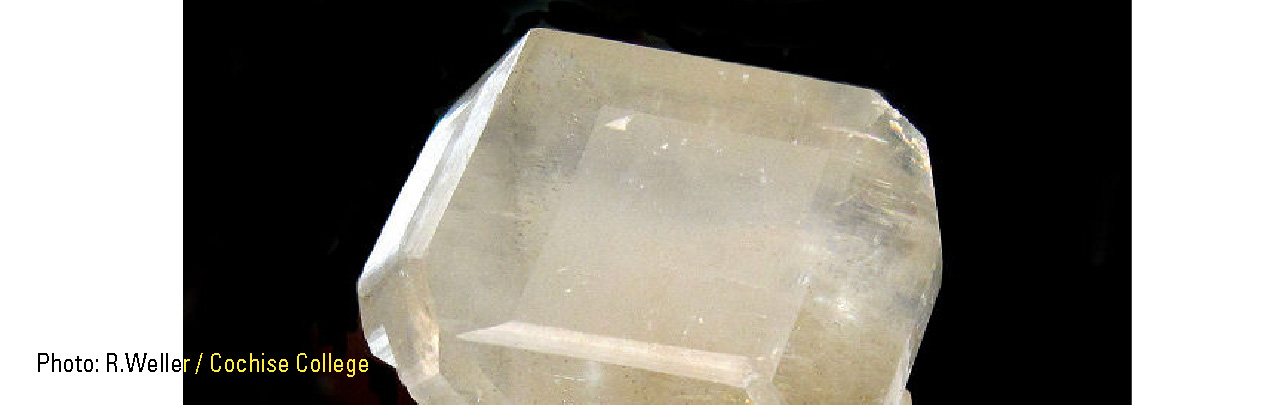
Calcite is composed of calcium (Ca) and carbonate (CO3). It is widely used as a construction material, an abrasive, an agricultural soil amendment, and in the pharmaceutical industry. The construction industry is the primary user of calcite in the form of limestone and marble. These calcite–bearing rocks are used as dimension stones and to produce cement.
Statistics and information on the worldwide supply of, demand for, and flow of dimension stone (including limestone, or calcite) and cement are available through the U.S. Geological Survey (USGS) National Minerals Information Center (NMIC) website.
The occurrence of calcite in soils is complex. Primary calcite may be inherited from carbonate–bearing parent materials or, dependent on biologic, physical, and climatic factors, secondary calcite may develop through leaching and redeposition. Soil parent materials containing primary calcite include limestone, dolostone, and fossiliferous chalk or marl. Calcite in soils is readily dissolved by infiltrating rainwater or groundwater and, in temperate humid climate, dissolved constituents may be leached from the soil profile. Many soils in arid and semiarid environments are calcareous as a lack of rainfall restricts leaching and removal of CaCO3, resulting in accumulation of secondary, pedogenic calcite. Presence of calcareous soils in arid and semiarid areas not directly underlain by carbonate bedrock probably results from atmospheric deposition of fine CaCO3 particles or through the influx of Ca+2 ions dissolved in rainfall (Machette, 1985).
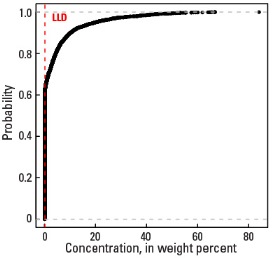
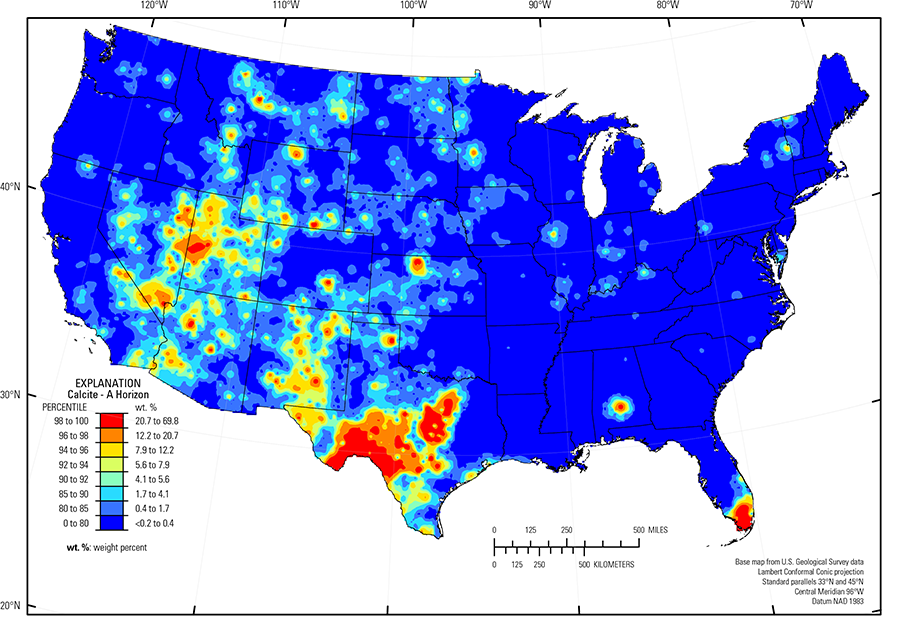
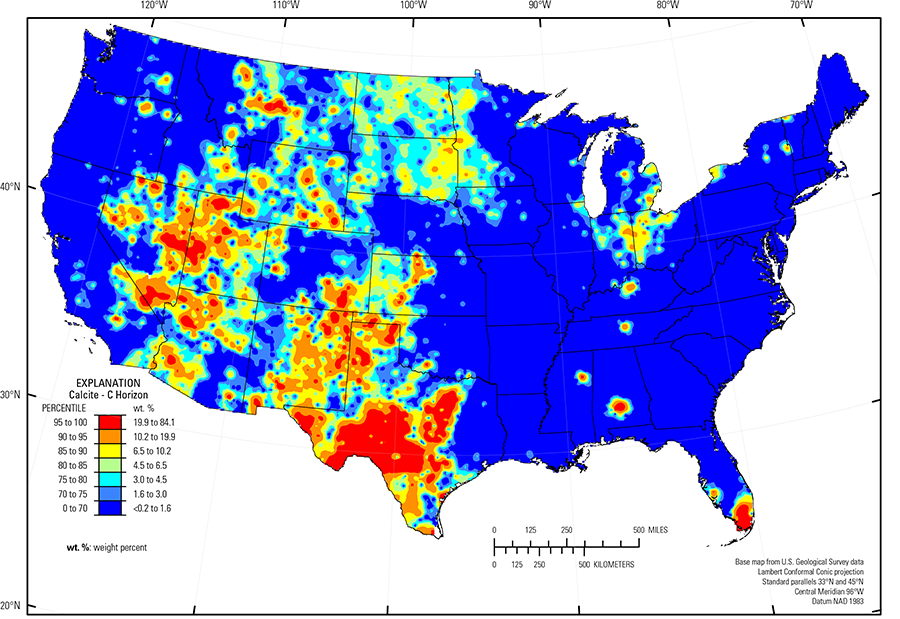
In our data, the concentration of calcite in the soil C horizon ranges from less than the detection limit of 0.2 weight percent (wt. %) to 84.1 wt. %; calcite concentrations in more than 60 percent of the sites across the conterminous United States are below the detection limit. The concentration of calcite in the soil A horizon ranges from less than the detection limit to 69.8 wt. %, with more than 75 percent of the concentrations in all samples being less than the detection limit (see the summary statistics [open in new window]). These samples with concentrations below the detection limit are grouped together in a single class for color coding the mineral concentration in the interpolated maps. Thus, the map for calcite in the soil C horizon has seven classes, whereas the map for calcite in the soil A horizon has eight classes.
Calcite in the soil C horizon largely reflects the presence of calcareous parent materials —for example, soils in the Texas carbonate terrane developed on limestone, chalk, and dolostone, or unconsolidated deposits derived from carbonate bedrock. Chalk is also the parent material for soils containing calcite in the Alabama and Mississippi Blackland Prairie (USDA, 2006) (calcareous soils are often dark–colored and richer in organic carbon than non–calcareous soil, thus the name 'blackland' has been applied to landscape units underlain by calcareous soils). Weathered, phosphatic limestone is the dominant soil parent material in the Kentucky Bluegrass and the Nashville Basin (USDA, 2006). Carbonate bedrock in central Nevada may be an original source of calcite in alluvial and lacustrine soils; however, many calcic soils develop from non–calcareous parent materials in arid to semiarid climate conditions (Machette, 1985). calcareous eolian deposits in the Southern High Plains and Rolling Plains and Breaks (USDA, 2006) across central Kansas contain calcite in the soil C horizon. In the Great Salt Lake Area (USDA, 2006), which includes the Bonneville Salt Flats, evaporation exceeds precipitation in restricted basins and a number of carbonate (calcite, aragonite) and evaporite (gypsum, halite) minerals precipitate in soils. Soils in the Everglades Area (USDA, 2006) developed in shallow freshwater biogenic marl forming on limestone bedrock. In this environment, the precipitation of CaCO3 may have been in the form of aragonite, which with time will recrystallize to calcite.
Calcite is present in soils in the Great Lakes region, where glacial materials derived from sedimentary carbonate rocks were distributed in the down–ice direction by glaciers. In the Upper Midwest, melting of glacial ice following late Wisconsinan period advances (16,000 to 12,000 years ago) left the region north of the southern glacial limit (Soller and others, 2012) mantled with a blanket of mixed, immature sediments, from which present–day soils developed. Individual ice lobes (Grimley, 2000) created distinct patterns in soil mineralogy and geochemistry because of varying provenance and ice transport paths. 'Gray' (carbonate– and shale–rich) till in the James and Des Moines lobes (Grimley, 2000) was derived from Cretaceous sedimentary rocks (dolostone, limestone, and shale). Gray tills were transported significant distances to the south and southeast from their source and deposited in areas underlain by Precambrian bedrock. 'Red' quartz– and feldspar–rich till deposited in northeastern Minnesota, northwestern Michigan and northern Wisconsin have a Precambrian crystalline rock provenance (Rainy lobe (Grimley, 2000)) and Precambrian red sandstone (with variable quantities of quartz and feldspar) provenance (Superior lobe (Grimley, 2000)), with no contributions from carbonate. Soils in eastern Wisconsin, northern Illinois, and northern Indiana developed on carbonate– and shale–bearing till sourced from sedimentary bedrock. Distinct boundaries in the soil C horizon map along the southern glacial limit (Soller and others, 2012) and between 'gray' and 'red' till clearly separate soils containing calcite from soils with no detectable calcite.
Because calcite is highly susceptible to weathering, it has been largely leached out of the soil A horizon of 'gray till' in the humid climate of the Upper Midwest. Old, intensely weathered soils of the Piedmont (Fenneman and Johnson, 1946) contain no calcite, even where the soil parent materials may have originally contained carbonate bedrock. Some parts of the conterminous United States with little or no calcite in soils are areas where the soil parent materials never contained calcite, such as the Pacific Northwest, where many soils developed on mafic volcanic rocks.
Statistics - 0 TO 5 CM
Statistics - A Horizon
| Number of samples | 4,802 |
| LLD | 0.2 wt. % |
| Number below LLD | 3,692 |
| Minimum | <0.2 wt. % |
| 5 percentile | <0.2 wt. % |
| 25 percentile | <0.2 wt. % |
| 50 percentile | <0.2 wt. % |
| 75 percentile | <0.2 wt. % |
| 95 percentile | 9.5 wt. % |
| Maximum | 69.8 wt. % |
| MAD | |
| Robust CV |
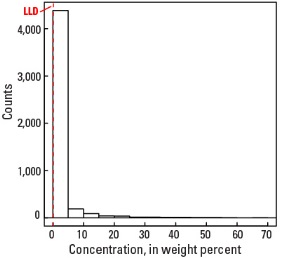
Histogram
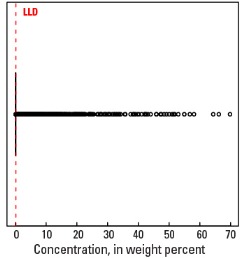
Boxplot
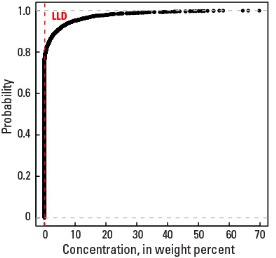
Empirical cumulative distribution function
Statistics - C Horizon
| Number of samples | 4,773 |
| LLD | 0.2 wt. % |
| Number below LLD | 2,941 |
| Minimum | <0.2 wt. % |
| 5 percentile | <0.2 wt. % |
| 25 percentile | <0.2 wt. % |
| 50 percentile | <0.2 wt. % |
| 75 percentile | 3.0 wt. % |
| 95 percentile | 19.9 wt. % |
| Maximum | 84.1 wt. % |
| MAD | |
| Robust CV |
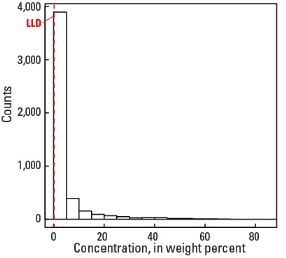
Histogram
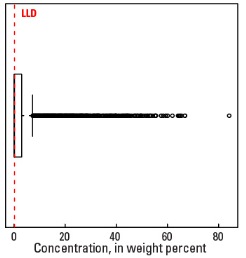
Boxplot