


The purpose of these interpretive discussions is to provide a perspective on regional- and national-scale variations in element and mineral distributions in soils and their likely causes. The significant spatial variations shown by most elements and minerals can commonly be attributed to geologic sources in underlying parent materials, but other spatial variations seem clearly related to additional factors such as climate, the age of soils, transported source material, and anthropogenic influences. We attempt to distinguish the influence of these various factors on a regional and national scale. Numerous more local features might similarly be related to these same factors, but these features also have some probability of being an artifact of a random sampling of variable compositions, so that there is some probability of samples with similar compositions occurring in clusters of two or more adjacent sites by chance. Distinguishing such random occurrences from true variability is beyond the scope of the data from which these maps are constructed. Some caution, therefore, is advisable in interpreting the significance of these more local features unless some unique sources or processes can clearly be related to them.
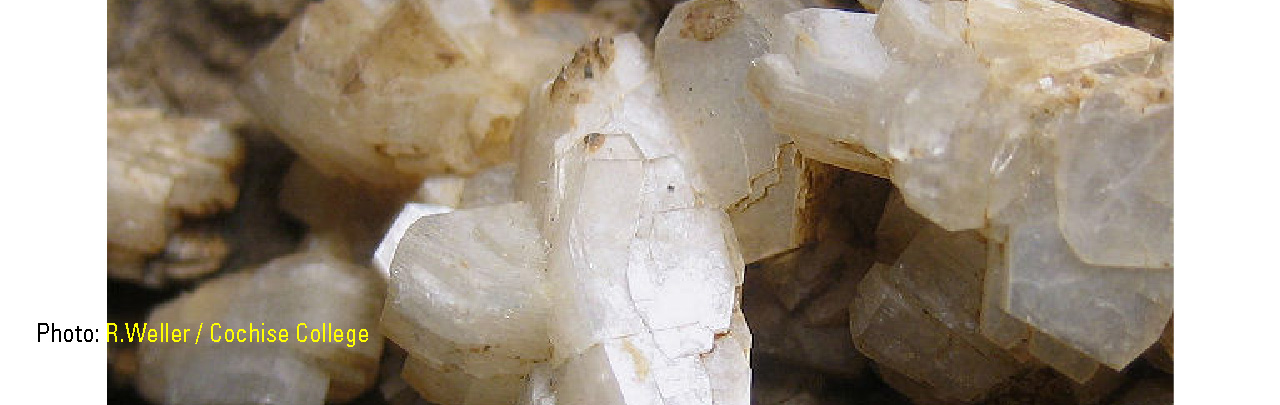
Zeolites are a somewhat remarkable set of minerals in that their open, channel–like crystal structure permits continuous (and in part reversible) dehydration and exchange. These characteristics allow zeolites to absorb, hold, release, and exchange a wide range of natural and manmade constituents. The maps of total zeolite concentrations represent the sum of the concentrations for two zeolite minerals, analcime and heulandite, determined in this study. Analcime is a sodium (Na)–rich, hydrated aluminosilicate mineral with a chemical formula of Na(AlSi2O6)•(H2O). Heulandite is a calcium (Ca), Na, hydrated aluminosilicate mineral with a chemical formula of (Ca,Na)2Al3[Al2Si7O18]•6H2O. In soils, both zeolites can be inherited from soil parent material containing volcanic rock or tuffaceous sediments or rarely may form directly in saline–affected volcanic or nonvolcanic soils, depending on soil pH and the concentration of silicon (Si), aluminum (Al), and other cations (for example, Na, Ca, and potassium (K)) in solution. Zeolites also may be added to soils through eolian or fluvial deposition.
The distribution of mineral resource deposits with zeolites as a commodity (major or minor) in the United States, extracted from the U.S. Geological Survey (USGS) Mineral Resource Data System (MRDS) website, can be seen by hovering the mouse here. Statistics and information on the worldwide supply of, demand for, and flow of zeolites are available through the U.S. Geological Survey (USGS) National Minerals Information Center (NMIC) website.
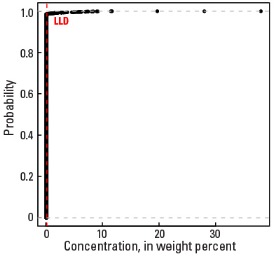
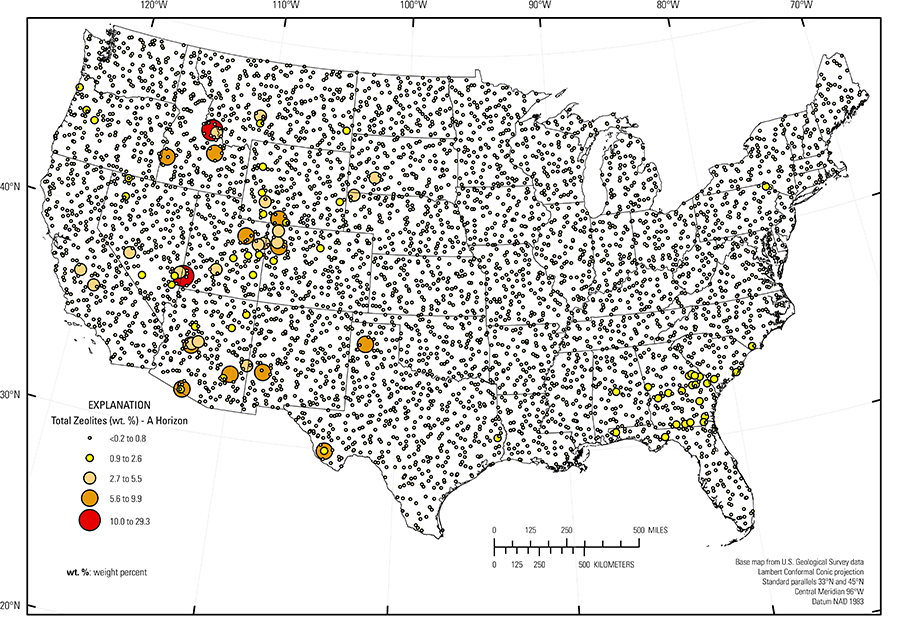
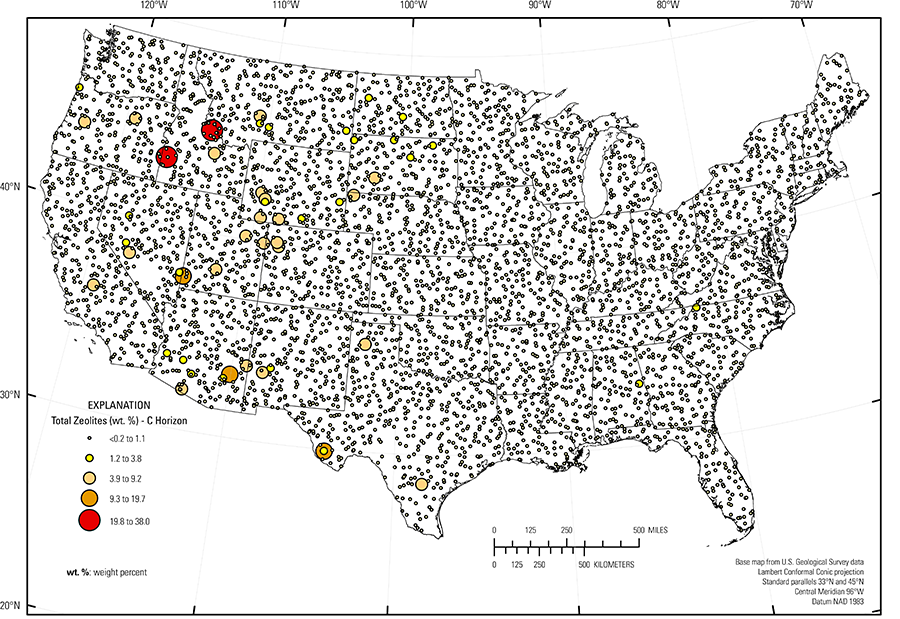
Total zeolite concentrations are above the detection limit (0.2 weight percent (wt. %)) at only 71 of 4,773 sites in the soil C horizon and 115 sites in the soil A horizon. Total zeolite concentrations range from <0.2 to 38.0 wt. % in the soil C horizon, and from <0.2 to 29.3 wt. % in the soil A horizon (see the summary statistics [open in new window]). Because so few samples had total zeolite concentrations above the detection limit, their spatial distribution is shown as a proportional symbol map rather than an interpolated and smoothed color surface map.
For most sites, the occurrence of zeolites can be linked to the local presence of volcanic materials in bedrock or in unconsolidated materials such as alluvial or eolian deposits. For many sites, zeolites in the soil A horizon occur where zeolites are reported for the soil C horizon, suggesting similar sources. A number of occurrences in the western United States can be linked to volcanic sources or, in the case of analcime, to pedogenic sources. Where zeolites are present in the soil A horizon, but not the soil C horizon, as noted for some sites in the southeastern United States, it is possible that zeolites were added as an agricultural supplement. For a more detailed discussion on the distribution of zeolites, see the maps and interpretations for heulandite and analcime.
Statistics - 0 TO 5 CM
Statistics - A Horizon
| Number of samples | 4,802 |
| LLD | 0.2 wt. % |
| Number below LLD | 4,687 |
| Minimum | <0.2 wt. % |
| 5 percentile | <0.2 wt. % |
| 25 percentile | <0.2 wt. % |
| 50 percentile | <0.2 wt. % |
| 75 percentile | <0.2 wt. % |
| 95 percentile | <0.2 wt. % |
| Maximum | 29.3 wt. % |
| MAD | |
| Robust CV |
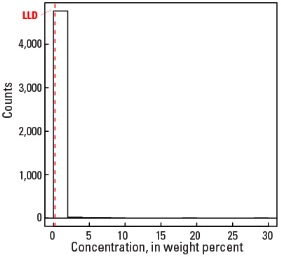
Histogram
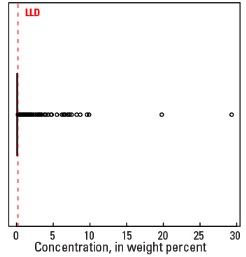
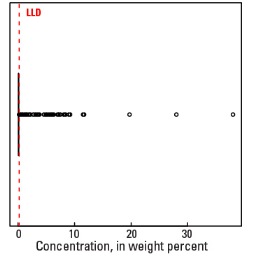
Boxplot
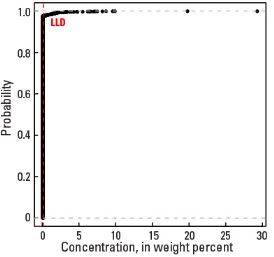
Empirical cumulative distribution function
Statistics - C Horizon
| Number of samples | 4,773 |
| LLD | 0.2 wt. % |
| Number below LLD | 4,702 |
| Minimum | <0.2 wt. % |
| 5 percentile | <0.2 wt. % |
| 25 percentile | <0.2 wt. % |
| 50 percentile | <0.2 wt. % |
| 75 percentile | <0.2 wt. % |
| 95 percentile | <0.2 wt. % |
| Maximum | 38.0 wt. % |
| MAD | |
| Robust CV |
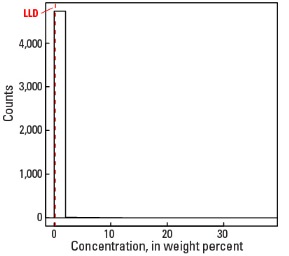
Histogram
Boxplot