


The purpose of these interpretive discussions is to provide a perspective on regional- and national-scale variations in element and mineral distributions in soils and their likely causes. The significant spatial variations shown by most elements and minerals can commonly be attributed to geologic sources in underlying parent materials, but other spatial variations seem clearly related to additional factors such as climate, the age of soils, transported source material, and anthropogenic influences. We attempt to distinguish the influence of these various factors on a regional and national scale. Numerous more local features might similarly be related to these same factors, but these features also have some probability of being an artifact of a random sampling of variable compositions, so that there is some probability of samples with similar compositions occurring in clusters of two or more adjacent sites by chance. Distinguishing such random occurrences from true variability is beyond the scope of the data from which these maps are constructed. Some caution, therefore, is advisable in interpreting the significance of these more local features unless some unique sources or processes can clearly be related to them.
Sodium (Na) is a metallic element with a variety of uses. It is used as a heat exchanger in some nuclear reactors and as a reagent in the chemical industry. Sodium vapor is used in street lights and produces a characteristic brilliant yellow light. Compounds of Na have more uses than the metal itself. Table salt (sodium chloride, NaCl) is used as a seasoning throughout the world and is also important in curing meat. Baking soda (sodium bicarbonate, NaHCO3) is used as a leavening agent for cakes and other pastries. Sodium fluoride (NaF) is used in toothpaste and mouthwash. Sodium is essential for all organisms, including humans. It is important for brain and nervous system functions in the human body. Too much Na is harmful as is Na deficiency.
The distribution of Na in soils is controlled by the mineralogy of the underlying parent material and the fate of these minerals in the soil environment under varying climate conditions acting over time. The average abundance of Na in the Earth's upper continental crust is approximately 2.43 weight percent (wt. %) (Rudnick and Gao, 2003). Minerals that may be a major source of Na in soil are plagioclase (albite is the Na–rich feldspar end member) and other Na–bearing silicate minerals, including pyroxene, mica, and amphibole. Sodium silicate minerals can occur in a wide range of igneous rock types. These include mafic rocks such as basalt and gabbro, with an average Na concentration of 2.0 wt. %, felsic rocks, such as granite and rhyolite, with an average Na concentration of 2.5 wt. %, and intermediate rocks between these two end members (such as andesite and dacite). Metamorphic equivalents of all these rock types also may contain Na silicate minerals. Sedimentary rocks such as sandstone, and unconsolidated materials, such as alluvial, eolian, or glacial deposits, all may contain Na silicate minerals. Many Na silicate minerals are susceptible to weathering in soil, and with time in a sufficiently humid climate, these minerals will break down and dissolve, releasing Na, which leaches out of the soil profile. Sodium in soil also may occur as Na evaporite minerals, such as halite, nahcolite, and borax in arid and semiarid restricted basins.
The distribution of mineral resource deposits with Na as a commodity (major or minor) in the United States, extracted from the U.S. Geological Survey (USGS) Mineral Resource Data System (MRDS) website, can be seen by hovering the mouse here. Statistics and information on the worldwide supply of, demand for, and flow of Na–bearing materials are available through the USGS National Minerals Information Center (NMIC) website. Click here for salt, here for soda ash, and here for sodium sulfate.
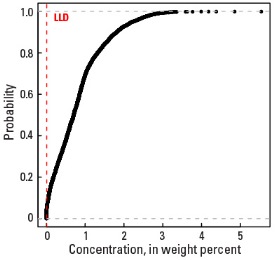
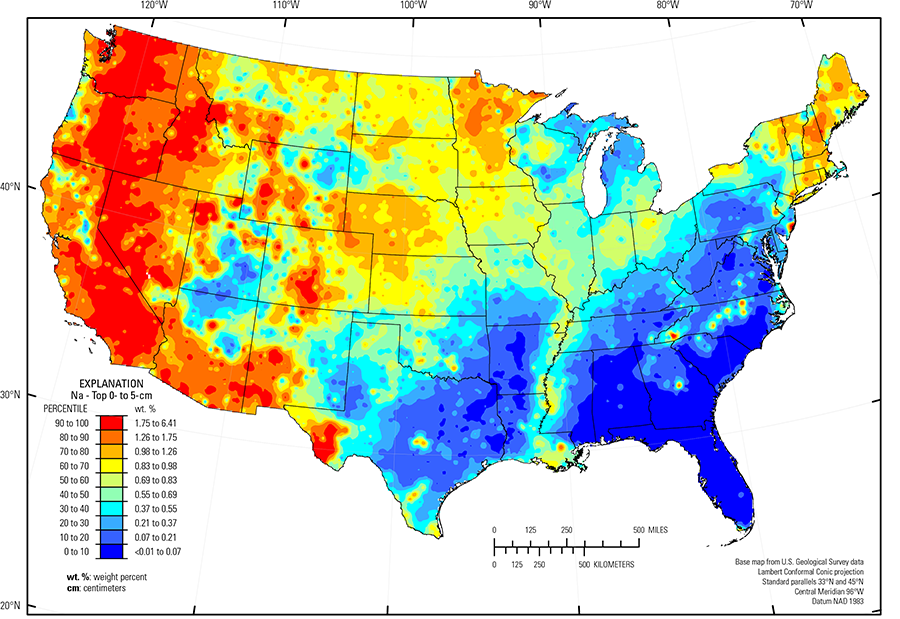
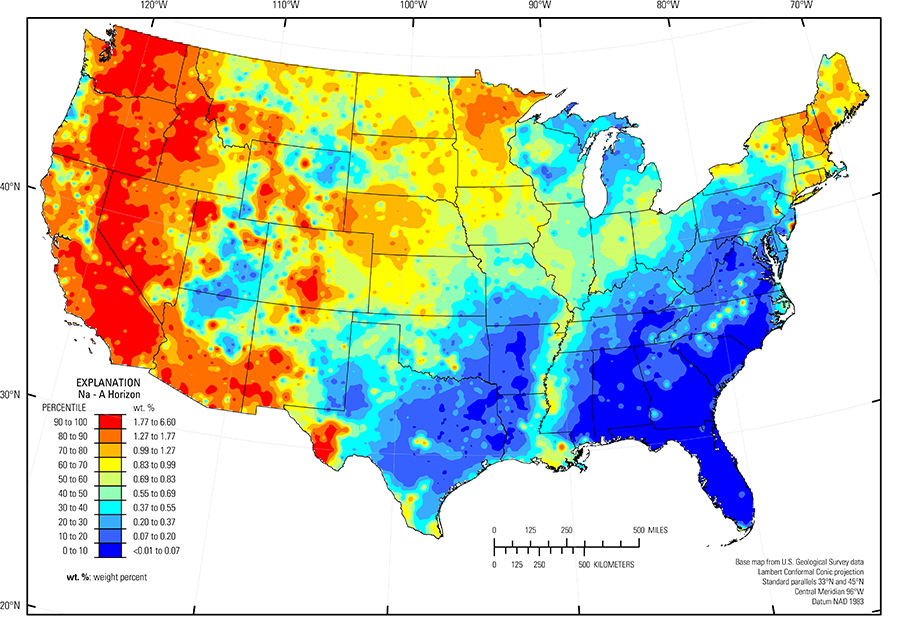
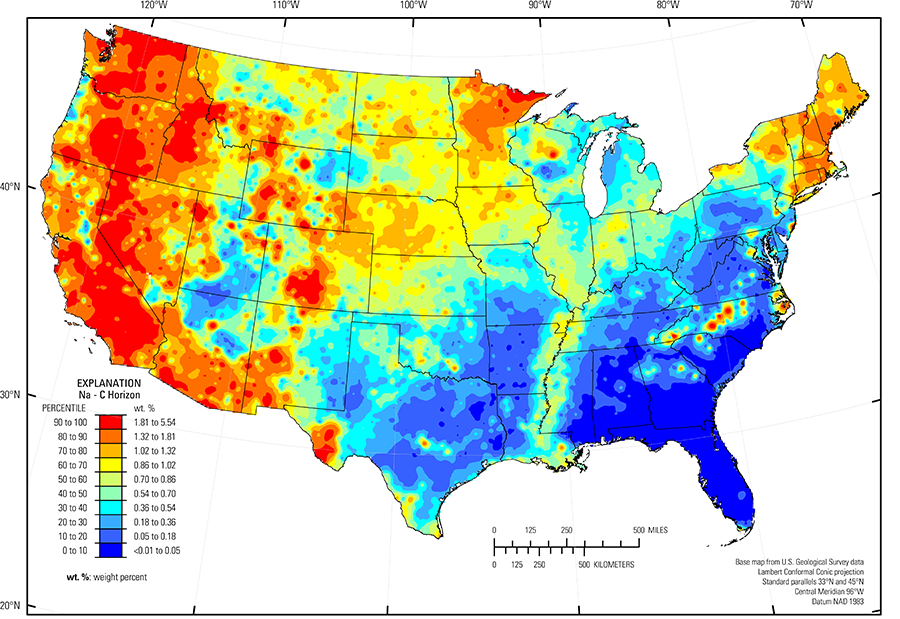
In our data, the median concentration of Na is 0.70 wt. % in the soil C horizon, and 0.69 wt. % in both the soil A horizon and the top 0- to 5-cm layer (see the summary statistics [open in new window]). About 96 percent of all sites have Na concentrations greater than the lower limit of determination (LLD) of 0.01 wt. %. The spatial map patterns for Na concentrations in the soil A and C horizons, and the top 0- to 5-cm layer are all similar to one another.
Most of the map patterns for Na are very similar to the map patterns for the mineral plagioclase, suggesting that the presence or absence of that mineral (and perhaps other related Na silicates) is the principal control on Na concentrations in soil.
Sodium occurs in elevated concentrations in soils developed in areas with mafic and intermediate igneous rocks, or with sedimentary rocks, or more recent alluvial and eolian deposits sourced from these rock types. Examples of such areas (and dominant soil parent materials) include:
- Pacific Northwest (mafic and intermediate volcanic rocks, such as the Columbia River basalts (Swanson and Wright, 1981) and the basalt of the Cascade Range);
- Parts of the Central and Southern Rocky Mountains, and the High Intermountain Valleys (USDA, 2006), Colorado, Wyoming, Montana, and Idaho (a variety of rock types, including basalt and andesite);
- Southern Sierra Nevada Mountains and Carson Basin and Mountains (USDA, 2006), California and Nevada (basalt and andesite);
- Trans–Pecos volcanics (Schruben and others, 1997), Texas (rhyolite, alkalic volcanic rocks, and related alluvium);
- Southeastern Arizona Basin and Range (USDA, 2006), Arizona (basalt and andesite); and
- Parts of New England (stony, local glacial deposits derived from a variety of mafic, intermediate, and felsic igneous rocks).
Soil in southeastern Wyoming and much of northern and western Nebraska, including the Nebraska Sand Hills (USDA, 2006) (an area of unconsolidated sand dunes and sand sheets) has relatively high Na concentrations compared to soil in surrounding areas, such as Northern Rolling High Plains, Southern Part (USDA, 2006) (Wyoming), the Central High Tableland (USDA, 2006) (Colorado), and loess sheets in Kansas and eastern Nebraska. These higher Na concentrations occur where plagioclase is present in soil.
The distribution of Na in soils in the Upper Midwest is influenced by glacial provenance. In this region, melting of glacial ice following late Wisconsinan period advances (16,000 to 12,000 years ago) left the region north of the southern glacial limit (Soller and others, 2012) mantled with a blanket of mixed, immature sediments, from which present–day soil developed. Individual ice lobes (Grimley, 2000) created distinct patterns in soil mineralogy and geochemistry because of varying provenance and ice transport paths. 'Gray' (carbonate– and shale–rich) till in the James and Des Moines lobes (Grimley, 2000) was derived from Cretaceous sedimentary rocks (dolostone, limestone, and shale). Gray tills were transported significant distances to the south and southeast from their source and deposited in areas underlain by Precambrian bedrock. 'Red' quartz– and feldspar–rich till deposited in northeastern and central Minnesota has a combined local Precambrian basalt and gabbro provenance (Duluth Complex), and a more mixed distant Precambrian granite/basalt provenance.
In northwestern Utah, high Na concentrations in soil in the Bonneville Salt Flats are attributed to the occurrence of evaporite minerals in this intermittent playa setting. In arid and semiarid soil environments, strong capillary rise of surface groundwater creates surficial layers of soluble salts. At two sites in this area, plagioclase concentrations are low or below the detection limit, whereas Na concentrations can exceed 6 wt. % in the soil A horizon. Evaporite minerals such as gypsum, dolomite, aragonite, and calcite also occur at these sites, although their distribution in the soil profile is highly variable.
In the south–central and eastern part of the United States, soil Na occurs in only a few areas where plagioclase persists in mafic rocks in the Piedmont (Fenneman and Johnson, 1946). Long–term weathering in these old soils has converted much of the plagioclase in the region to clay minerals, and Na has leached out of the soil profile. Some areas in the United States never had significant Na–bearing minerals in the bedrock that was the ultimate source for soil parent materials. These areas (and dominant soil parent materials) include:
- Texas carbonate terrane, where soil developed on limestone, chalk, and dolostone, or unconsolidated deposits derived from carbonate bedrock; and
- Gulf and Atlantic Coastal Plain (Fenneman and Johnson, 1946) (quartz–rich sedimentary rocks and unconsolidated sediments).
The Gulf and Atlantic Coastal Plain is bisected by the Southern Mississippi River Alluvium and the Southern Mississippi River Valley Loess (USDA, 2006). Alluvial sediments have deposited in the Mississippi River valley as the river flooded in recent geologic time. When these sediments dried, winds picked up the fine material and deposited it in thick loess sheets, mainly along the east side of the river valley. The youngest loess sheets are about 10,000 years old. A pattern of higher Na concentrations in soil developed on these young sediments reflects long–range transport of material from areas containing plagioclase, and thus Na, from the upper part of the Mississippi River drainage basin.
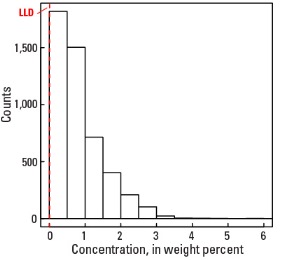
Statistics - 0 TO 5 CM
| Number of samples | 4,841 |
| LLD | 0.01 wt. % |
| Number below LLD | 200 |
| Minimum | <0.01 wt. % |
| 5 percentile | 0.02 wt. % |
| 25 percentile | 0.29 wt. % |
| 50 percentile | 0.69 wt. % |
| 75 percentile | 1.10 wt. % |
| 95 percentile | 2.19 wt. % |
| Maximum | 6.41 wt. % |
| MAD | 0.608 wt. % |
| Robust CV | 88.1% |
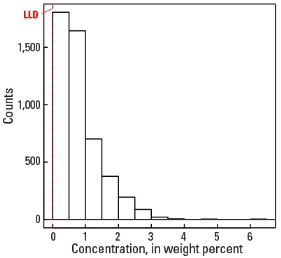
Histogram
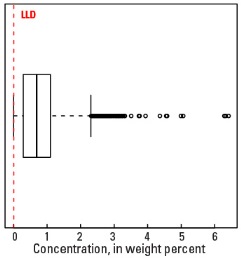
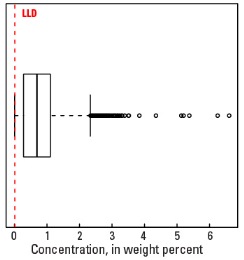
Boxplot
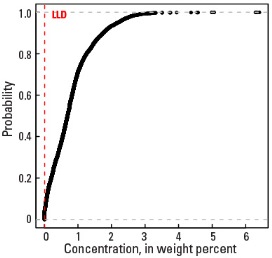
Empirical cumulative distribution function
Statistics - A Horizon
| Number of samples | 4,813 |
| LLD | 0.01 wt. % |
| Number below LLD | 182 |
| Minimum | <0.01 wt. % |
| 5 percentile | 0.02 wt. % |
| 25 percentile | 0.28 wt. % |
| 50 percentile | 0.69 wt. % |
| 75 percentile | 1.10 wt. % |
| 95 percentile | 2.13 wt. % |
| Maximum | 6.6 wt. % |
| MAD | 0.593 wt. % |
| Robust CV | 85.9 % |
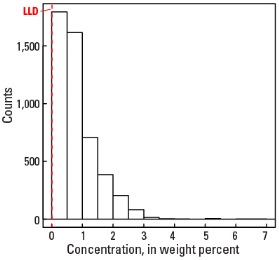
Histogram
Boxplot

Empirical cumulative distribution function
Statistics - C Horizon
| Number of samples | 4,780 |
| LLD | 0.01 wt. % |
| Number below LLD | 214 |
| Minimum | <0.01 wt. % |
| 5 percentile | 0.01 wt. % |
| 25 percentile | 0.27 wt. % |
| 50 percentile | 0.70 wt. % |
| 75 percentile | 1.14 wt. % |
| 95 percentile | 2.21 wt. % |
| Maximum | 5.54 wt. % |
| MAD | 0.623 wt. % |
| Robust CV | 89 % |
Histogram
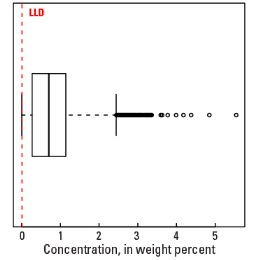
Boxplot