


The purpose of these interpretive discussions is to provide a perspective on regional- and national-scale variations in element and mineral distributions in soils and their likely causes. The significant spatial variations shown by most elements and minerals can commonly be attributed to geologic sources in underlying parent materials, but other spatial variations seem clearly related to additional factors such as climate, the age of soils, transported source material, and anthropogenic influences. We attempt to distinguish the influence of these various factors on a regional and national scale. Numerous more local features might similarly be related to these same factors, but these features also have some probability of being an artifact of a random sampling of variable compositions, so that there is some probability of samples with similar compositions occurring in clusters of two or more adjacent sites by chance. Distinguishing such random occurrences from true variability is beyond the scope of the data from which these maps are constructed. Some caution, therefore, is advisable in interpreting the significance of these more local features unless some unique sources or processes can clearly be related to them.
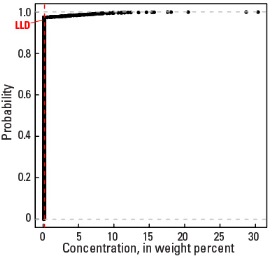
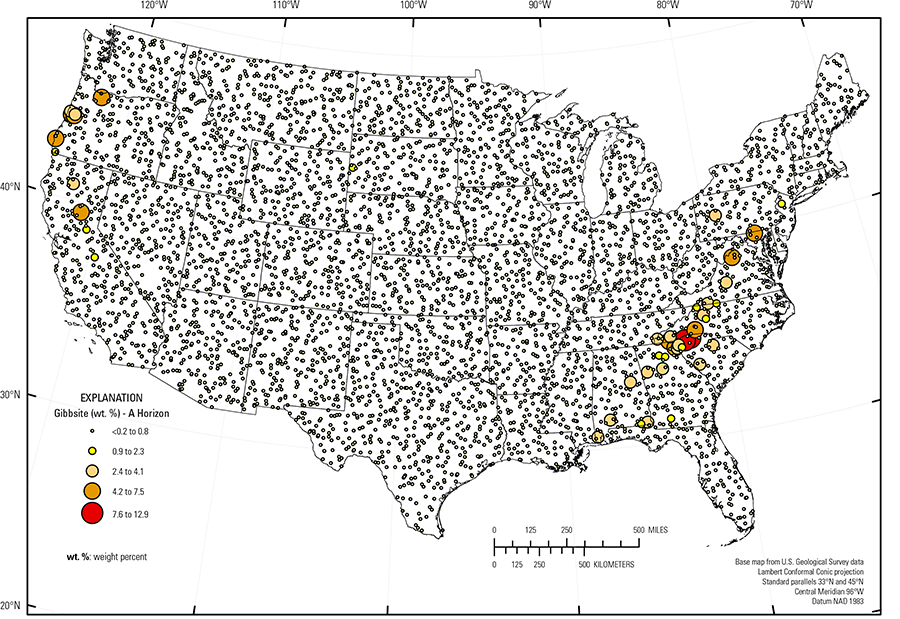
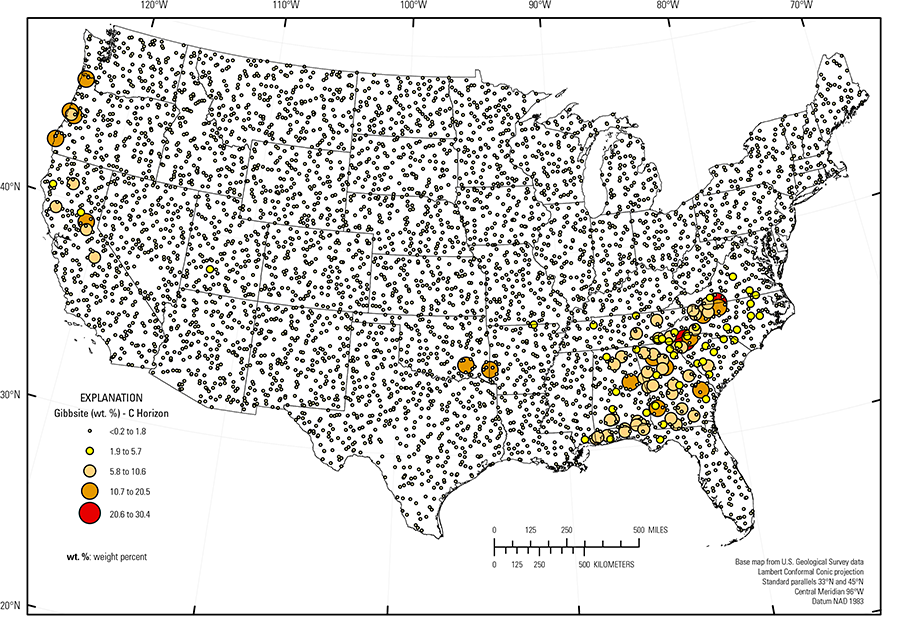
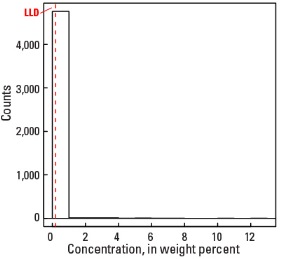
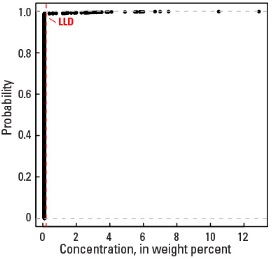
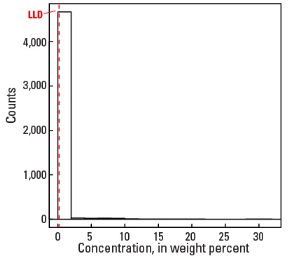
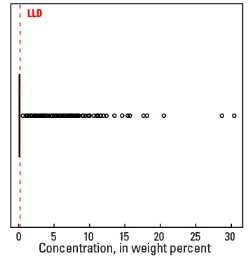
Gibbsite (Al(OH)3) is a chemically simple mineral that is the end product of intense chemical weathering in areas of high rainfall and warm temperatures. It is an important component of aluminum (Al) ores where it is sufficiently concentrated in large volumes. Our survey detected gibbsite only rarely. Gibbsite is reported for only 50 sites in the soil A horizon, with a maximum concentration of 12.9 weight percent (wt. %), and for 122 sites in the soil C horizon, with a maximum concentration of 30.4 wt. % (see the summary statistics [open in new window]). Because of the low percentage of detection, gibbsite distribution is shown by proportional symbol maps rather than as an interpolated and smoothed color surface map.
All gibbsite occurrences correlate with high kaolinite concentrations and, thus, very aluminous soils. The principal area with detectable gibbsite is within the belt of kaolinite–rich soils of the southeastern United States. Kaolinite (Al2Si2O5(OH)4) itself, forms by intense chemical weathering of feldspars and clays, but can be further modified to gibbsite by loss of silica, resulting in the chemically stable aluminum hydroxide. Gibbsite was also detected in some samples in northern California and the coastal region of Oregon and Washington, also in areas of high rainfall and kaolinite–rich soils. Other isolated occurrences are in kaolinite–rich soils of southeastern Oklahoma, western Arkansas, and southern Missouri. In general, gibbsite is more abundant in the soil C horizon than the soil A horizon. At many sites with gibbsite–bearing C–horizon soils, the soil A horizon does not have detectable gibbsite.
Statistics - 0 TO 5 CM
Statistics - A Horizon
| Number of samples | 4,802 |
| LLD | 0.2 wt. % |
| Number below LLD | 4,752 |
| Minimum | <0.2 wt. % |
| 5 percentile | <0.2 wt. % |
| 25 percentile | <0.2 wt. % |
| 50 percentile | <0.2 wt. % |
| 75 percentile | <0.2 wt. % |
| 95 percentile | <0.2 wt. % |
| Maximum | 12.9 wt. % |
| MAD | |
| Robust CV |
Histogram

Boxplot
Empirical cumulative distribution function
Statistics - C Horizon
| Number of samples | 4,773 |
| LLD | 0.2 wt. % |
| Number below LLD | 4,651 |
| Minimum | <0.2 wt. % |
| 5 percentile | <0.2 wt. % |
| 25 percentile | <0.2 wt. % |
| 50 percentile | <0.2 wt. % |
| 75 percentile | <0.2 wt. % |
| 95 percentile | <0.2 wt. % |
| Maximum | 30.4 wt.% |
| MAD | |
| Robust CV |
Histogram
Boxplot