


The purpose of these interpretive discussions is to provide a perspective on regional- and national-scale variations in element and mineral distributions in soils and their likely causes. The significant spatial variations shown by most elements and minerals can commonly be attributed to geologic sources in underlying parent materials, but other spatial variations seem clearly related to additional factors such as climate, the age of soils, transported source material, and anthropogenic influences. We attempt to distinguish the influence of these various factors on a regional and national scale. Numerous more local features might similarly be related to these same factors, but these features also have some probability of being an artifact of a random sampling of variable compositions, so that there is some probability of samples with similar compositions occurring in clusters of two or more adjacent sites by chance. Distinguishing such random occurrences from true variability is beyond the scope of the data from which these maps are constructed. Some caution, therefore, is advisable in interpreting the significance of these more local features unless some unique sources or processes can clearly be related to them.
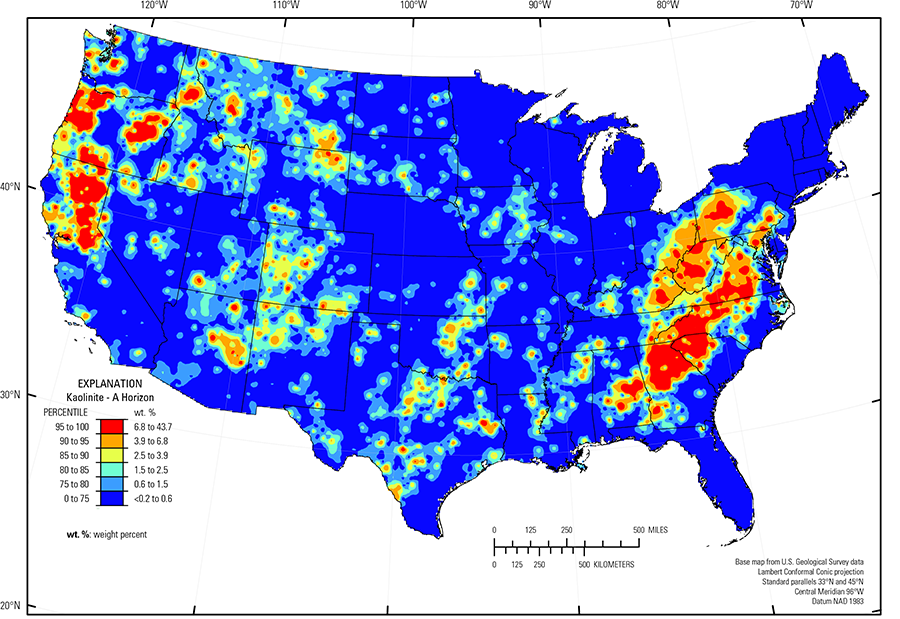
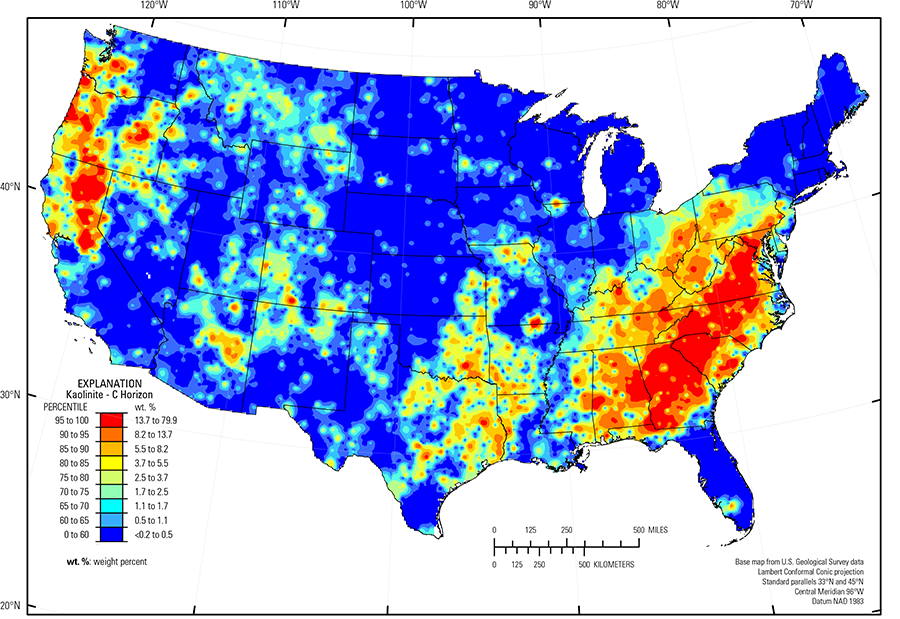
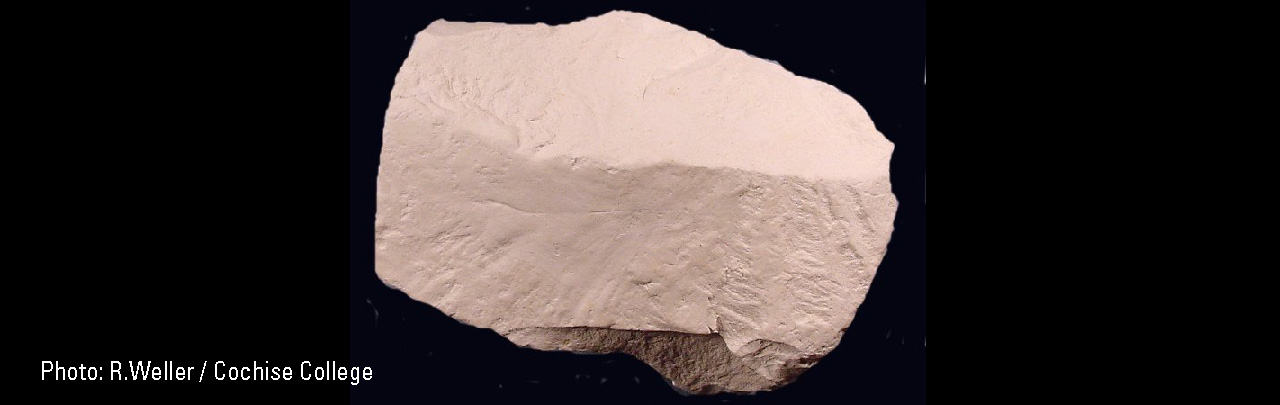
Kaolinite ((Al2Si2O5)(OH)4) is a clay mineral with an interatomic spacing across its principal platy parting direction of 7 Å (1Å (angstrom) = 10-10 meters), the characteristic that we have used to identify and quantify it by X-ray diffraction. Where present in small quantities, it may be masked by interference of 7 Å spacing of other minerals such as chlorite, so that its occurrence as a trace mineral may be more extensive than the maps show. Kaolinite was detected and quantified in 42 percent of samples from the soil C horizon and in 27 percent of samples from the soil A horizon (see the summary statistics [open in new window]). Although its national median concentration is below the detection limit of 0.2 weight percent (wt. %), where present, kaolinite is commonly an important component of soils and displays prominent patterns of abundance.
Kaolinite is an important mineral commodity in the United States and about 6 million tons are mined annually, mostly in Georgia. It is used as a coating on paper, and in ceramics and refractory materials. The distribution of mineral resource deposits with kaolin (a claystone composed primarily of kaolinite) as a commodity (major or minor) in the United States, extracted from the U.S. Geological Survey (USGS) Mineral Resource Data System (MRDS) website, can be seen by hovering the mouse here. Statistics and information on the worldwide supply of, demand for, and flow of clay (including kaolin) are available through the USGS National Minerals Information Center (NMIC) website.
Kaolinite is a mineral that forms largely by soil–forming processes, most commonly the chemical breakdown of feldspars, accompanied by leaching of elements such as calcium (Ca), sodium (Na), and potassium (K), to form the aluminum (Al)–rich product. The geographic distribution of kaolinite shows a strong negative spatial correlation with the distribution of plagioclase and potassium feldspar in accordance with this relationship. Reactions leading to feldspar breakdown are most effective in areas of high rainfall (PRISM climate group) such as the southeastern United States and the Pacific Northwest. Kaolinite is more widespread in the soil C horizon than in the soil A horizon and many sites with significant kaolinite in the soil C horizon have little or none in the soil A horizon (much of the Atlantic and Gulf of Mexico Coastal Plains (Fenneman and Johnson, 1946), for instance). It is likely that kaolinite–forming reactions took place in both the soil A and C horizons, but kaolinite was physically translocated downward from the soil A horizon into the soil C horizon, particularly in sandy porous soils such as on the coastal plains.
The largest area of kaolinite–rich soils is in the southeastern United States where a region from Virginia to Alabama has soils that generally have kaolinite concentrations in the upper 90th percentile. These high kaolinite soils formed mostly in the eastern Piedmont and Blue Ridge physiographic provinces (Fenneman and Johnson, 1946), an area where crystalline bedrock is deeply weathered and most feldspars have been altered to kaolinite. In the soil C horizon, kaolinite is also relatively abundant over much of the Atlantic and Gulf of Mexico Coastal Plains (Fenneman and Johnson, 1946), but the soil A horizon has little kaolinite in those areas. The area of kaolinite–rich soils also extends to the northwest and covers much of the Central Allegheny Plateau (USDA, 2006) where soils formed largely on weathered clastic sedimentary rocks. Soil A horizon samples show a distinct decrease in kaolinite concentration coincident with the Valley and Ridge province (Fenneman and Johnson, 1946), which lies between the Piedmont and the Central Allegheny Plateau (USDA, 2006), perhaps because this relatively steep mountainous topography experiences higher rates of erosion so that soils are not as maturely developed there. The soil C horizon shows this decrease to some extent but not as clearly as the soil A horizon. The northern limit of kaolinite–rich soils corresponds to the southern limit of the youngest (Wisconsinan) Pleistocene glaciation (Soller and others, 2012). North of that boundary, soils are relatively young and formed from glacial deposits containing large amounts of fresh bedrock material.
A second area of widespread kaolinite–rich soils is in the Sierra Nevada Mountains (USDA, 2006) of California and the southern part of the Cascade Range in Oregon and northern California. Here, as in the East, there is a correlation of high kaolinite abundance and areas of high annual precipitation and low feldspar concentrations, indicating that much of this kaolinite may have formed by soil reactions that break feldspar down to kaolinite.
Large regions in which there is little or no detectable kaolinite generally correspond to a variety of factors including arid to semiarid conditions (much of the southwestern United States), areas of young soils (northern glaciated regions), and areas where little feldspar occurs in parent materials, for instance sandy, quartz–rich parent materials in Florida and limestone parent materials in the Texas carbonate terrane.
Statistics - 0 TO 5 CM
Statistics - A Horizon
| Number of samples | 4,802 |
| LLD | 0.2 wt. % |
| Number below LLD | 3,529 |
| Minimum | <0.2 wt. % |
| 5 percentile | <0.2 wt. % |
| 25 percentile | <0.2 wt. % |
| 50 percentile | <0.2 wt. % |
| 75 percentile | 0.6 wt. % |
| 95 percentile | 6.8 wt. % |
| Maximum | 43.7 wt. % |
| MAD | |
| Robust CV |
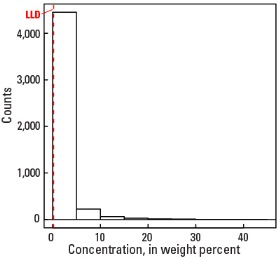
Histogram
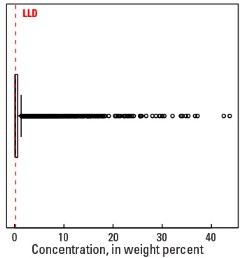
Boxplot
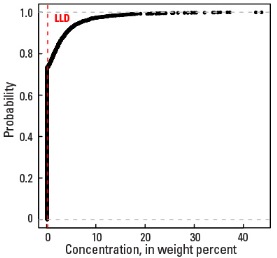
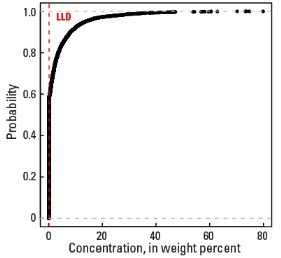
Empirical cumulative distribution function
Statistics - C Horizon
| Number of samples | 4,773 |
| LLD | 0.2 wt. % |
| Number below LLD | 2,770 |
| Minimum | <0.2 wt. % |
| 5 percentile | <0.2 wt. % |
| 25 percentile | <0.2 wt. % |
| 50 percentile | <0.2 wt. % |
| 75 percentile | 2.5 wt. % |
| 95 percentile | 13.7 wt. % |
| Maximum | 79.9 wt. % |
| MAD | |
| Robust CV |
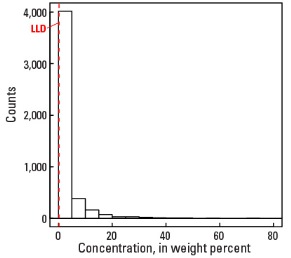
Histogram
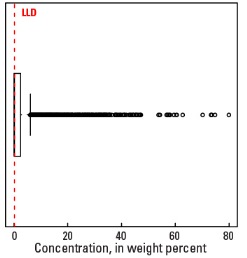
Boxplot