


The purpose of these interpretive discussions is to provide a perspective on regional- and national-scale variations in element and mineral distributions in soils and their likely causes. The significant spatial variations shown by most elements and minerals can commonly be attributed to geologic sources in underlying parent materials, but other spatial variations seem clearly related to additional factors such as climate, the age of soils, transported source material, and anthropogenic influences. We attempt to distinguish the influence of these various factors on a regional and national scale. Numerous more local features might similarly be related to these same factors, but these features also have some probability of being an artifact of a random sampling of variable compositions, so that there is some probability of samples with similar compositions occurring in clusters of two or more adjacent sites by chance. Distinguishing such random occurrences from true variability is beyond the scope of the data from which these maps are constructed. Some caution, therefore, is advisable in interpreting the significance of these more local features unless some unique sources or processes can clearly be related to them.
Uranium (U) is a radioactive metallic element important as the principal fuel for nuclear reactors and the primary raw material for nuclear weapons. It has no known biological role and is toxic and a known carcinogen. More information about the toxicity of U (or other elements and substances) and its potential negative human health impacts can be found at the Agency for Toxic Substances and Disease Registry (ATSDR) website, or click to download a fact sheet about U.
The distribution of U in soils of the conterminous United States is mainly controlled by the composition of underlying soil parent materials, redox reactions, and soil–forming processes, including weathering and microbial activity. The average concentration of U in the Earth's upper continental crust is estimated to be approximately 2.6 milligrams per kilogram (mg/kg) (Hu and Gao, 2008). Both U and thorium (Th) are radioactive elements that commonly occur together. Uranium has a large ionic radius with complex chemical behavior related to varying oxidation states that control its solubility and mobility. In igneous rocks, U is concentrated into accessory minerals such as zircon, monazite, allanite, and apatite. These accessory minerals typically occur in felsic igneous rocks such as granite, rhyolite, and pegmatite. Granite contains, on average, about 4 mg/kg U. Because these accessory minerals are resistant to weathering, they commonly are incorporated into sedimentary rocks, such as shale and sandstone. Shale contains, on average, about 3.2 mg/kg U and sandstone contains about 1.3 mg/kg U. Of the other common rock types, basalts and other mafic rocks contain about 0.5 mg/kg and limestones about 1 mg/kg U. Uranium precipitates out of seawater during deposition of marine phosphorite, calcareous sediment, and organic material. Thus, soil developed from marine sedimentary rocks, such as phosphatic limestone and black shale, can have anomalously high U concentrations. Unconsolidated materials, such as alluvial, eolian, and glacial deposits also may contain U depending on their original source. Uranium is highly mobile during rock weathering, with dissolution and precipitation of U controlled by redox conditions. Uranium in solution can be absorbed by clays, precipitated onto iron (Fe) hydroxides, or form U–rich oxide minerals.
The distribution of mineral resource deposits with U as a commodity (major or minor) in the United States, extracted from the U.S. Geological Survey (USGS) Mineral Resource Data System (MRDS) website, can be seen by hovering the mouse here. Statistics on the worldwide supply of U are available through the World Nuclear Association website.
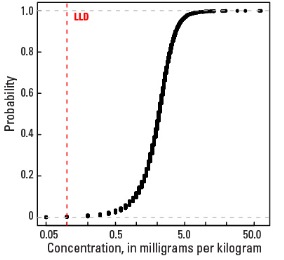
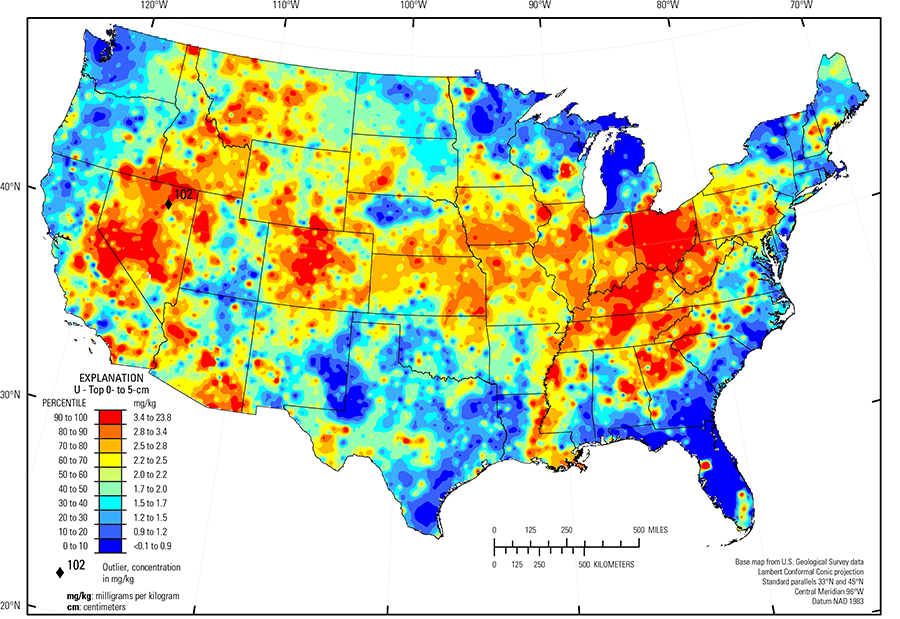
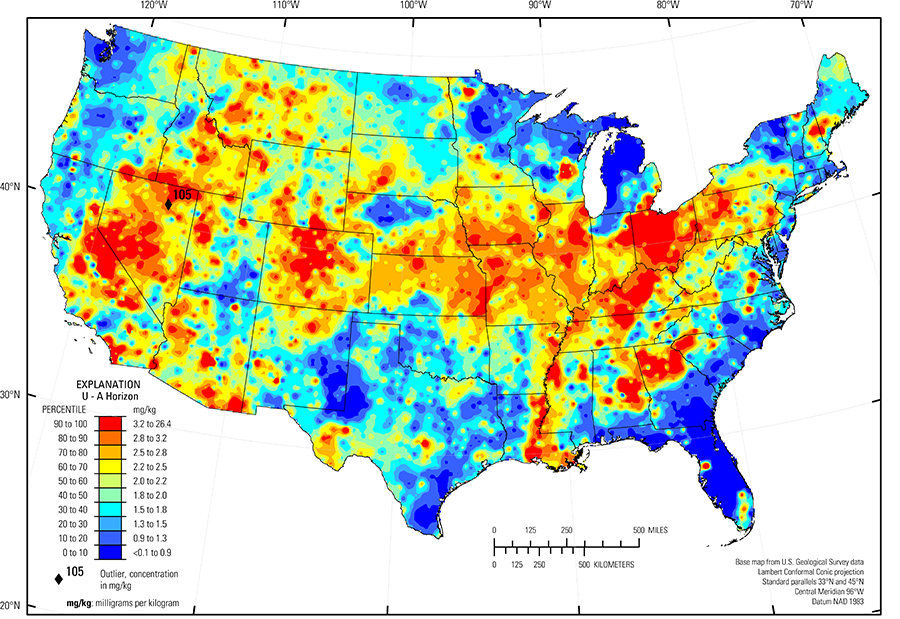
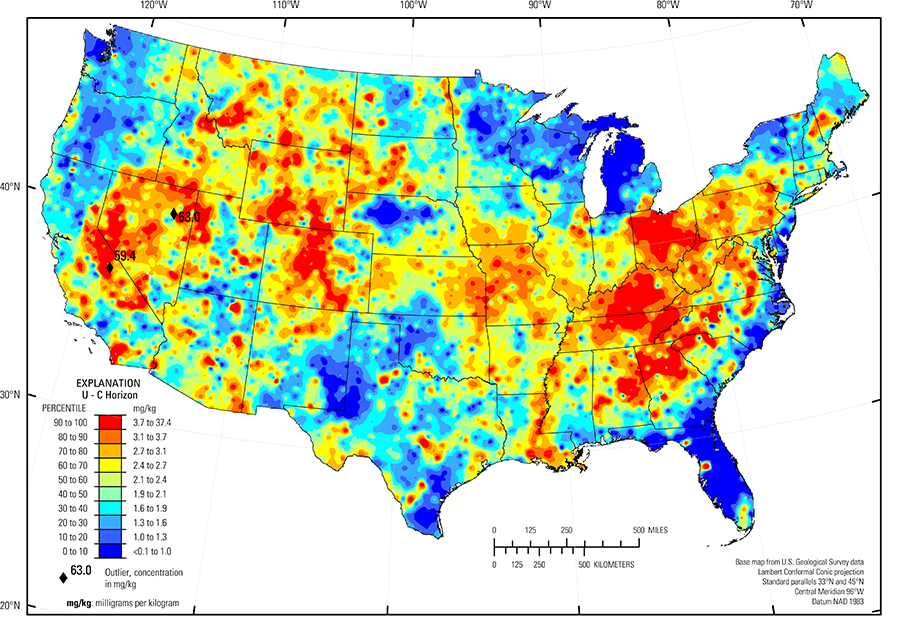
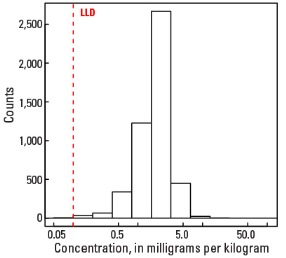
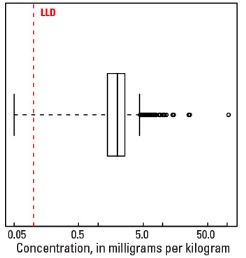
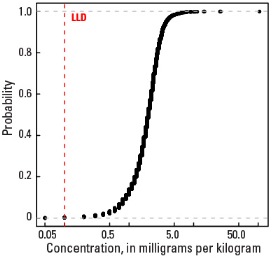
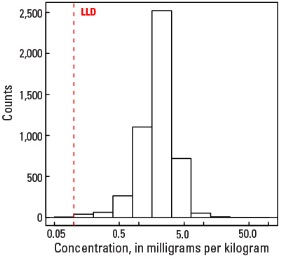
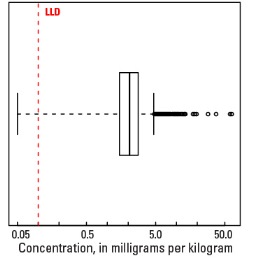
In our data, the median U concentration is 2.1 mg/kg in the soil C horizon, and 2.0 mg/kg in both the soil A horizon and the top 0- to 5-cm layer (see the summary statistics [open in new window]). Nearly all soils have U concentrations above the 0.1 mg/kg lower limit of determination (LLD). Anomalously high U values in the soil C horizon (two sites), the soil A horizon (one site), and the top 0- to 5-cm layer (one site) were removed prior to constructing the interpolated maps and are shown as diamond symbols. Map patterns among the three sample groups are similar to one another, with locally high U concentrations in topsoils (soil A horizon and top 0- to 5-cm layer).
High U concentrations occur in soil developed on felsic rocks (granites and rhyolites and metamorphic equivalents) that are present throughout the West, such as in the southern Sierra Nevada Mountains and in some sites in the Central Nevada Basin and Range, the Owyhee High Plateau, and the Southern Rocky Mountains (USDA, 2006), and in the East, including in central New Hampshire and eastern Maine, and at places within the Piedmont (Fenneman and Johnson, 1946). Soil in the Piedmont is old and highly weathered. Uranium released by weathering of felsic rocks may be retained in the soil profile by secondary Fe–hydroxides and clays.
Soil developed on black shale and phosphatic limestone, as well as alluvium sourced from similar rocks, commonly has elevated U concentrations. Examples of these areas include:
- Southwest and central Wyoming, where soil developed on Eocene–age marine sedimentary rocks;
- Cherokee Prairies (USDA, 2006) in eastern Kansas, western Missouri, and northern Oklahoma where soil developed on shale and limestone;
- Ozark Highlands (USDA, 2006) in southern Missouri where soils developed on cherty limestone;
- Much of the east–central part of the country, where soil developed on cyclic beds of sandstone, shale, and coal in the Western and Central Allegheny Plateau (USDA, 2006), Cumberland Plateau (Fenneman and Johnson, 1946), and Southern Appalachian Ridges and Valleys (USDA, 2006);
- Central Kentucky and Tennessee where soil developed on phosphatic limestone and Devonian–age black shale; and
- Central Florida, where soil developed on phosphatic sands and clays, and the Everglades (USDA, 2006), where modern soil is forming from fresh water biogenic marl developed on limestone bedrock.
Black shale also contributes U to soil in the glaciated lower Great Lakes region. In the Upper Midwest, melting of glacial ice following late Wisconsinan period advances (16,000 to 12,000 years ago) left the region north of the southern glacial limit (Soller and others, 2012) mantled with a blanket of mixed, immature sediments from which present–day soil developed. Individual ice lobes (Grimley, 2000) created distinct patterns in soil mineralogy and geochemistry because of varying provenance and ice transport paths. The distribution of U in soil throughout the glaciated region reflects the presence or absence of a shale contribution. Carbonate– and shale–rich 'gray' till in western Minnesota, North Dakota, South Dakota, and Iowa were derived from Cretaceous sedimentary rocks (dolostone, limestone, and shale). These gray tills have somewhat elevated U concentrations from the gray shale contribution. Somewhat elevated U concentrations along the Minnesota–North Dakota border occur in soil developed on lacustrine clays from Glacial Lake Agassiz in the Red River Valley of the North (USDA, 2006). In contrast, 'red' quartz– and feldspar–rich till in the Lake Superior region have a Precambrian granite/basalt/red sandstone provenance, and typically have relatively low U concentrations. Soil with elevated U concentrations in northern Illinois, eastern Michigan, eastern Indiana, and western Ohio developed on glacial deposits that incorporated black shale. Shale taken up by glacial ice of the Lake Michigan lobe and the Huron–Erie lobes (Grimley, 2000) was spread beyond areas where black shale is near the surface. South of the southern glacial limit (Soller and others, 2012), in southern Iowa, soil developed on loess has somewhat higher U concentrations than soil north of the glacial limit developed on till. The higher concentrations of U in the silt–sized material that makes up the vast loess sheets may be related to the presence of a small, but persistent, quantity of U–rich accessory minerals, such as monazite or zircon, or to U–bearing clays that may be a component of the loess.
Large areas of the conterminous United States with low U concentrations in soil (and dominant soil parent materials) include:
- Sandy glacial deposits in western Michigan;
- Pacific Northwest and northern California (mafic and ultramafic rocks, including the Columbia River basalts (Swanson and Wright, 1981) and basalt and andesite of the Cascade Range);
- Adirondack highlands (Fenneman and Johnson, 1946), New York (anorthosite and gabbro);
- Nebraska Sand Hills ((USDA, 2006) (quartz– and plagioclase–rich unconsolidated sand dunes and sand sheets); and
- Southern High Plains (USDA, 2006) in eastern New Mexico and western Texas (quartz–rich eolian sands and alluvial sediments).
The Gulf and Atlantic Coastal Plain (Fenneman and Johnson, 1946) is bisected by the Southern Mississippi River Alluvium and the Southern Mississippi Valley Loess (USDA, 2006). Alluvial sediments have deposited in the Mississippi River valley as the river flooded in recent geologic time. When these sediments dried, winds picked up the fine material and deposited it in thick loess sheets, mainly along the east side of the river valley. The youngest loess sheets are about 10,000 years old. A pattern of higher U concentrations in soil developed on these young sediments reflects long–range transport of material from areas containing U from the upper part of the Mississippi River drainage basin.
Several sites have higher U concentrations in the soil A horizon and the top 0- to 5-cm layer than the underlying soil C horizon. For example, a site in Nevada (diamond symbol on the maps) has U concentrations greater than 100 mg/kg in these topsoils, whereas the U concentration in the soil C horizon is 3 mg/kg. Uranium is a valuable resource and has been extracted from numerous deposits throughout the West. Surface enrichments in U are likely related to industrial and mining activities.
Statistics - 0 TO 5 CM
| Number of samples | 4,841 |
| LLD | 0.1 mg/kg |
| Number below LLD | 6 |
| Minimum | <0.1 mg/kg |
| 5 percentile | 0.7 mg/kg |
| 25 percentile | 1.4 mg/kg |
| 50 percentile | 2.0 mg/kg |
| 75 percentile | 2.6 mg/kg |
| 95 percentile | 3.9 mg/kg |
| Maximum | 102 mg/kg |
| MAD | 0.89 mg/kg |
| Robust CV | 44.5% |
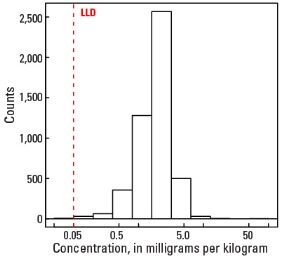
Histogram
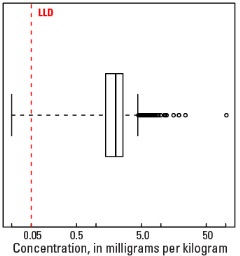
Boxplot
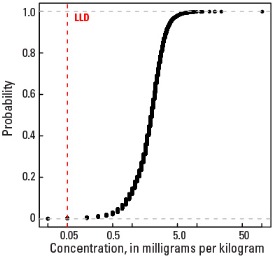
Empirical cumulative distribution function
Statistics - A Horizon
| Number of samples | 4,813 |
| LLD | 0.1 mg/kg |
| Number below LLD | 6 |
| Minimum | <0.1 mg/kg |
| 5 percentile | 0.7 mg/kg |
| 25 percentile | 1.4 mg/kg |
| 50 percentile | 2.0 mg/kg |
| 75 percentile | 2.6 mg/kg |
| 95 percentile | 3.8 mg/kg |
| Maximum | 105 mg/kg |
| MAD | 0.89 mg/kg |
| Robust CV | 44.5 % |
Histogram
Boxplot
Empirical cumulative distribution function
Statistics - C Horizon
| Number of samples | 4,780 |
| LLD | 0.1 mg/kg |
| Number below LLD | 6 |
| Minimum | <0.1 mg/kg |
| 5 percentile | 0.7 mg/kg |
| 25 percentile | 1.5 mg/kg |
| 50 percentile | 2.1 mg/kg |
| 75 percentile | 2.8 mg/kg |
| 95 percentile | 4.4 mg/kg |
| Maximum | 63 mg/kg |
| MAD | 1.04 mg/kg |
| Robust CV | 49.4 % |
Histogram
Boxplot