![]()
![]()
Precipitation
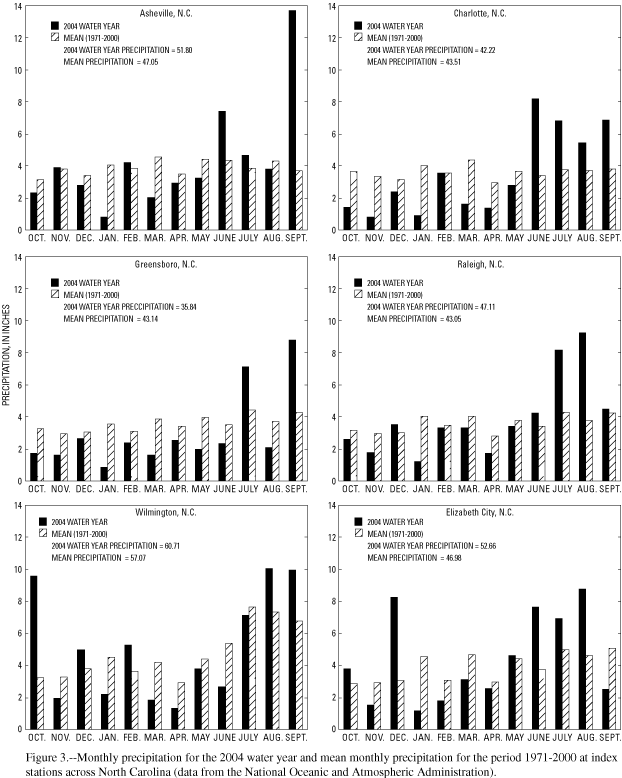
Precipitation amounts for the first quarter (October through December) of the 2004 water year were below average across the State except in Wilmington and Elizabeth City. Precipitation amounts in the western part of the State varied from 1.38 inches below average in Asheville to 5.53 inches below average in Charlotte, in the central part of the State from 1.24 inches below average in Raleigh to 3.28 inches below average in Greensboro, and in the eastern part of the State from 4.72 inches above average in Elizabeth City to 6.23 inches above average in Wilmington. Average precipitation amounts are mean monthly values based on data from 1971 through 2000, the 30-year base period used by the National Weather Service. Precipitation data recorded at two of the six key National Weather Service stations in the State (fig. 1 GIF/PDF) indicate that below-average precipitation amounts occurred in all months during the first quarter at Charlotte and Greensboro.
The second quarter of the 2004 water year (January through March) brought even drier conditions to the State. Precipitation was below average at all six index sites in January and March. The greatest precipitation amount recorded during the quarter was in Wilmington, but the total for the quarter remained 3.09 inches below average. Below-average precipitation for the quarter was recorded at Raleigh (3.66 inches), Asheville (5.43 inches), Greensboro (5.58 inches), and Charlotte (5.86 inches). Elizabeth City had the greatest deficit (6.28 inches below average) and the least amount of total precipitation (6.07 inches) during the second quarter.
The third quarter (April through June) brought above-average precipitation to the western and northeastern part of the State. Elizabeth City had the greatest amount of precipitation during this period (3.63 inches above average); Charlotte and Asheville also had above-average precipitation (2.30 and 1.27 inches, respectively) in the western part of the State. Precipiation amounts ranged from 4.02 (Greensboro) and 0.62 (Raleigh) inches below average in the central part of the State to 4.88 inches below average in Wilmington in the southeastern part of the State. All six National Weather Service stations recorded below-average precipitation amounts in April in all three provinces of North Carolina.
During the fourth quarter (July through September), precipitation amounts were above average throughout the entire State, primarily as a result of an active hurricane season. The six index sites reported precipitation amounts ranging from 3.61 to 10.29 inches above average for the quarter—10.29 inches at Asheville, 7.80 inches at Charlotte, 5.58 inches at Greensboro, 9.58 inches at Raleigh, 5.38 inches at Wilmington, and 3.61 inches at Elizabeth City. During September 2004, high rainfall amounts from two hurricanes, Frances and Ivan, were recorded in several Blue Ridge counties in North Carolina. As much as 18 inches of rainfall was reported during a 5-day period (September 5–9) from Hurricane Frances, and as much as 9 inches of rainfall was reported during a 3-day period (September 16–18) from Hurricane Ivan (Neal Lott, National Oceanic and Atmospheric Administration, Asheville, N.C., written commun., 2004).
In summary, despite the tropical systems affecting North Carolina during the 2004 water year, Charlotte and Greensboro still experienced below-average precipitation for the year; the four remaining sites recorded positive departures from average of less than 5 inches for the year (fig. 3 GIF/PDF). The National Weather Service reported the following total annual precipitation amounts for the 2004 water year: Asheville, 51.80 inches (4.75 inches above average); Charlotte, 42.22 inches (1.29 inches below average); Greensboro, 35.84 inches (7.30 inches below average); Raleigh, 47.11 inches (4.06 inches above average); Wilmington, 60.71 inches (3.64 inches above average); and Elizabeth City, 52.66 inches (5.68 inches above average).
Ground Water
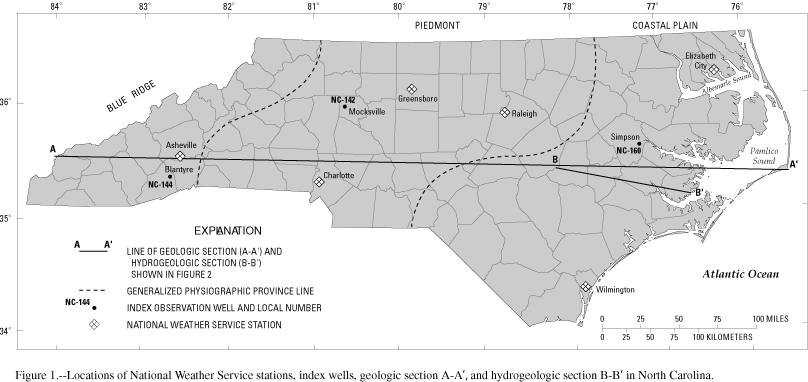
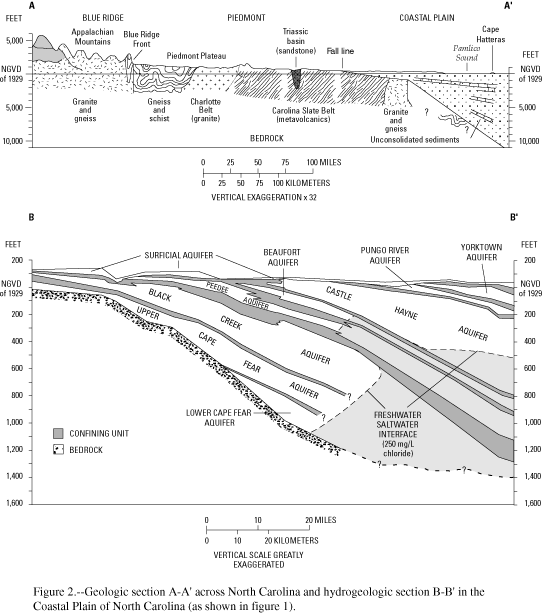
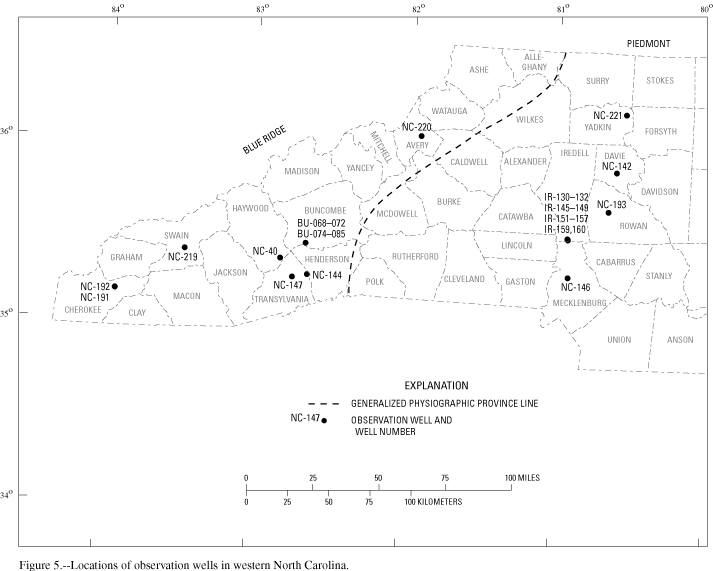
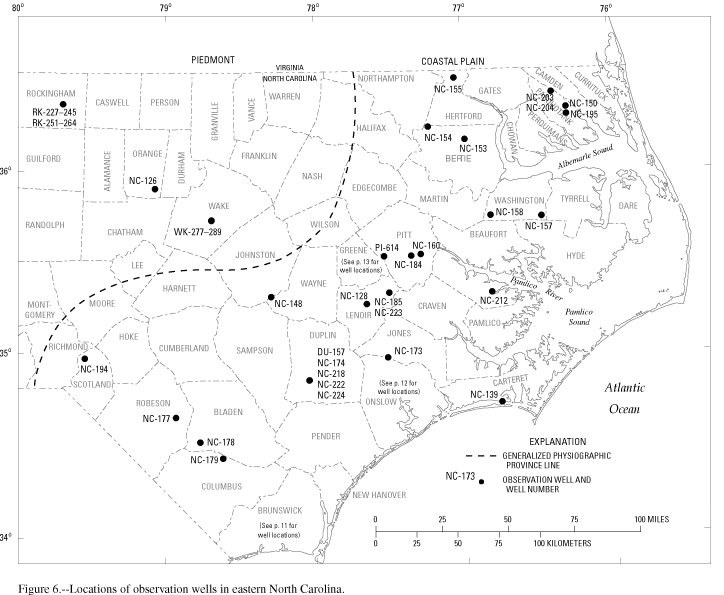
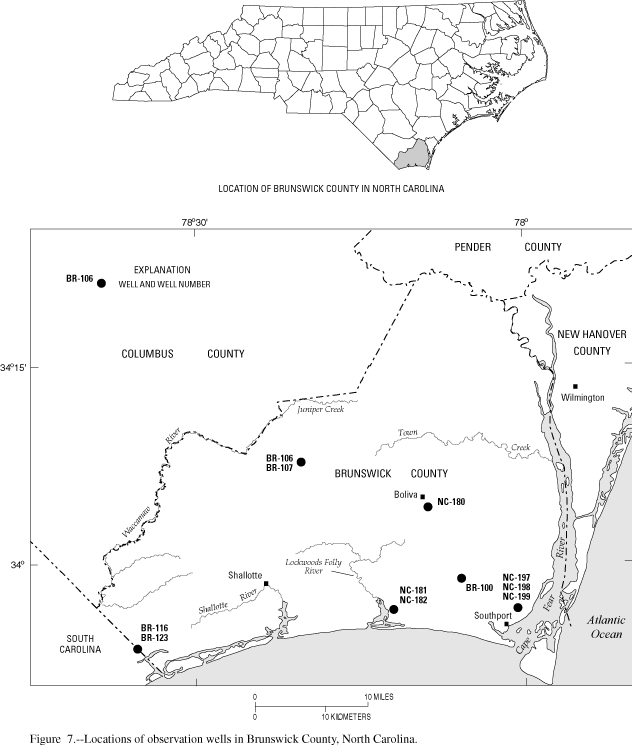
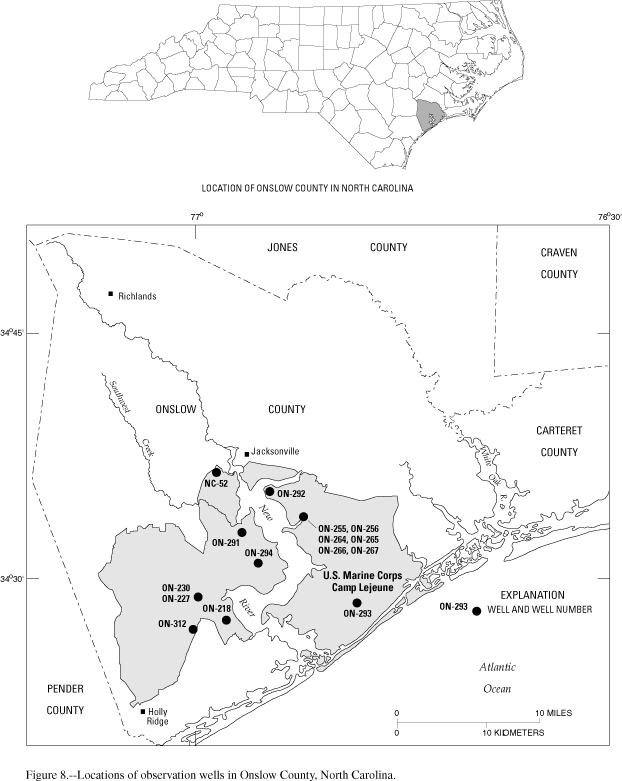
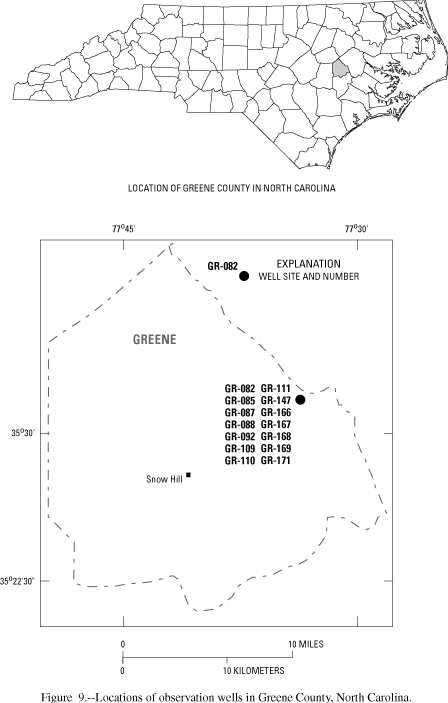
Cross sections (locations shown in fig. 1 GIF/PDF) illustrating the simplified geology and Coastal Plain aquifers of North Carolina are shown in figure 2 (GIF/PDF). Ground-water levels in the surficial aquifer of the Coastal Plain Province and in the weathered surficial layer (regolith) of the Piedmont and Blue Ridge Provinces of North Carolina respond to climatic influences. Water levels are influenced by ground-water recharge from precipitation, evapotranspiration of ground water into the air by plants, movement of ground water to deeper aquifers, and discharge of ground water to streams. Water levels in the unconfined aquifers generally decline through the growing season and typically are highest during the winter months when evapotranspiration losses are lowest (fig. 4 GIF/PDF). In addition to seasonal changes, water levels in deeper, confined aquifers in the Coastal Plain also can respond to pumping. Locations of wells discussed in this report are shown in figures 5–9 (fig. 5 GIF/PDF, fig. 6 GIF/PDF, fig. 7 GIF/PDF, fig. 8 GIF/PDF, fig. 9 GIF/PDF).
Index Wells
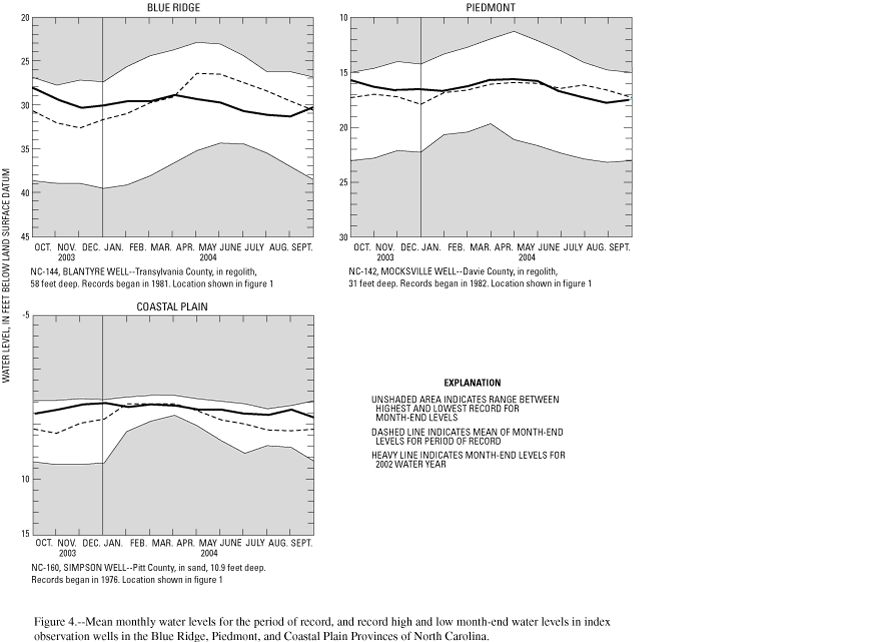
Water levels in index observation wells in the Blue Ridge, Piedmont, and Coastal Plain Provinces (fig. 1 GIF/PDF) provide a general indication of ground-water fluctuations in the shallow aquifers of these provinces. Hydrographs of month-end water levels in these index observation wells during the 2004 water year include mean monthly water levels for the period of record and record high and low month-end water levels (fig. 4 GIF/PDF). Real-time plots of data for these wells can be accessed on-line at http://nc.waterdata.usgs.gov/nwis/gw, and long-term records are available on-line for comparison at http://groundwaterwatch.usgs.gov/. For the fall and winter months of the 2004 water year, shallow ground-water levels in the three index wells across North Carolina were within the normal range (25th to 75th percentiles) and near the historic daily median. During the spring and summer months, however, the water level in the Blue Ridge well declined below the historic daily median. In the Blue Ridge and western Piedmont Provinces, significant rises in ground-water levels occurred during September as a result of increased rainfall amounts from Hurricanes Frances and Ivan.
Water levels in the Blue Ridge index well NC-144 (Blantyre well, fig. 4 GIF/PDF) were within the normal range of mean monthly conditions (25th to 75th percentiles) and near or slightly below the historic daily median throughout most of the 2004 water year. In September, the daily-mean water level rose about 2.7 feet from the lowest daily-mean water level recorded during the 2004 water year (31.3 feet below land surface recorded on September 1, 2004), to the highest daily-mean water level for the 2004 water year (28.6 feet below land surface recorded first on March 16, 2004, and again on September 30, 2004).
The water levels in Piedmont index well NC-142 (Mocksville well, fig. 4 GIF/PDF) were within the normal range of monthly conditions and near the historic daily median for much of the 2004 water year. Similar to the Blue Ridge well (NC-144), the water level in well NC-142 also rose sharply during the month of September 2004, increasing by about 1.4 feet.
Water levels in the Coastal Plain index well NC-160 (Simpson well, fig. 4 GIF/PDF), were within the normal or high (greater than 75th percentile) range for mean monthly conditions and above or near the historical daily median for the 2004 water year. In contrast to water levels in the Blue Ridge and Piedmont index wells, ground-water levels in well NC-160 did not rise during September 2004 because the Coastal Plain Province received no large rainfall amounts from tropical storms or hurricanes.
Natural-Effects Wells
Ground-water levels in North Carolina were influenced by a wide range of rainfall across the State during the 2004 water year. Overall, ground-water levels across the State were at historical median levels during the fall and winter months but declined to below-median water levels during the spring and summer months. Water levels in the Blue Ridge wells and the western Piedmont wells rose sharply during September from the high rainfall amounts associated with Hurricanes Frances and Ivan. Water levels in Blue Ridge well NC-40 (fig. 5 GIF/PDF) in Haywood County were near the historic daily median during the early winter months but dropped to lower levels during the spring and summer. However, a substantial water-level rise was recorded in this well during September following increased rainfall amounts from Hurricanes Frances and Ivan. In well NC-40, where ground-water levels have been recorded since 1955, a period-of-record high water level was recorded on September 17, 2004. The water level in well NC-40 rose more than 5 feet during September 2004. The water levels in Blue Ridge wells NC-192 (Cherokee County, fig. 5 GIF/PDF) and NC-144 (Transylvania County, fig. 5 GIF/PDF) were near the historical daily median during the fall months and declined to below the median, near the period-of-record low, during the winter and spring months. Water levels in well NC-192 recovered to near median levels during the summer months of the 2004 water year, rising by more than 3 feet during September after heavy rainfall from Hurricanes Frances and Ivan. Water levels in two of the Piedmont wells, NC-142 (Davie County) and NC-193 (Rowan County, fig. 5 GIF/PDF), were slightly above the historical daily median water levels during the fall months of the 2004 water year but declined to slightly below the median during the spring and summer months. Similar to the sharp rise in water levels observed in the Blue Ridge wells during September 2004, the water levels in the two western Piedmont wells (NC-142 and NC-193) rose more than 1 foot during that same period. Water levels in Coastal Plain wells NC-160 (Pitt County, fig. 6 GIF/PDF), NC-173 (Jones County, fig. 6 GIF/PDF), and NC-194 (Scotland County, fig. 6 GIF/PDF) were above or near the historical daily median water levels during the 2004 water year.
Induced-Effects Wells
Ground-water withdrawals have resulted in declining water levels in confined aquifers in some areas of the Coastal Plain for a number of years. This declining trend is shown by the long-term record from several induced-effects observation wells that tap four of the major aquifers in eastern North Carolina—the Castle Hayne, Black Creek, upper Cape Fear, and lower Cape Fear aquifers (fig. 2 GIF/PDF).
The water-level record of observation well NC-212 shows the fluctuations of water levels in the Castle Hayne aquifer resulting from changes in pumping at a large mining and manufacturing operation in the eastern part of Beaufort County (fig. 6 GIF/PDF). Major pumping activities have occurred in this area for more than three decades. The range in water-level fluctuation as a result of pumping is about 40 feet during water year 2004. The areal cone of depression resulting from this pumping has covered more than 3,000 square miles (Coble and others, 1989).
The record of observation well NC-139 in Carteret County (fig. 6 GIF/PDF) shows the effects of seasonal pumping from the Castle Hayne aquifer in order to meet increased demand for water in the coastal area during the summer months. The decline in water levels in the long-term record was observed until the early-1990's when water levels became more stable. Water levels recorded in this well during the 2004 water year remained relatively stable. Water levels in observation well ON-227, completed in the Castle Hayne aquifer in Onslow County (fig. 8 GIF/PDF), declined from late 1994 through 2002; however, water levels have remained relatively stable during recent years and the 2004 water year.
Water levels in the Castle Hayne aquifer are not declining everywhere throughout the eastern Coastal Plain Province. This is especially true in areas of the aquifer that are not covered by extensive confining units (Strickland and others, 1992). The water levels in Castle Hayne well NC-52 in Onslow County (fig. 8 GIF/PDF) exhibit climatic-effect fluctuations. Although well NC-52 is near water-supply wells at U.S. Marine Corps Camp Lejeune, no effects of withdrawals from these wells can be observed in the long-term record. Water levels recorded in this well during the 2004 water year generally were near average conditions.
Ground-water withdrawals, estimated at 134 million gallons per day over 15 counties, have resulted in water-level declines in the State's central Coastal Plain Province (Walters, 1997). In August 2002, the State legislature designated those 15 counties as the Central Coastal Plain Capacity Use Area, whereby reductions in ground-water withdrawals in the Cretaceous aquifers, primarily the Black Creek and upper Cape Fear aquifers, are scheduled to begin by the year 2008. Examples of the long-term effects of these withdrawals can be observed in data from several wells. Water levels recorded in well NC-128 (Lenoir County, fig. 6 GIF/PDF) indicate the effects of pumping from the Black Creek aquifer in Lenoir County. Water-level declines of as much as 4 feet per year were recorded in well NC-128 until 1998 when water levels began to recover. The period-of-record hydrograph for well NC-128 shows a long-term decline of almost 80 feet from 1972 to 1997. Since 1998 and through the 2004 water year, water levels recovered more than 20 feet, possibly from reduced pumpage.
Water-level declines in well NC-155, which is completed in the lower Cape Fear aquifer in Hertford County (fig. 6 GIF/PDF), primarily are a result of major withdrawals in Virginia that began in the 1940's. These withdrawals have caused a regional cone of depression in the lower Cape Fear aquifer, which extends about 30 miles into North Carolina (Coble and others, 1989). Water-level records from well NC-155 indicate that the maximum (drawdown) rate of decline of 4 feet per year occurred in the late 1980's. From 1993 to 1998, the rate of decline decreased to less than 2 feet per year. A slight recovery in water levels was observed from 1999 to 2003; however, a decline was observed throughout the 2004 water year.
![]()
Return to WY 2004 Annual Data Report Home Page
![]()