![]()
![]()
Precipitation
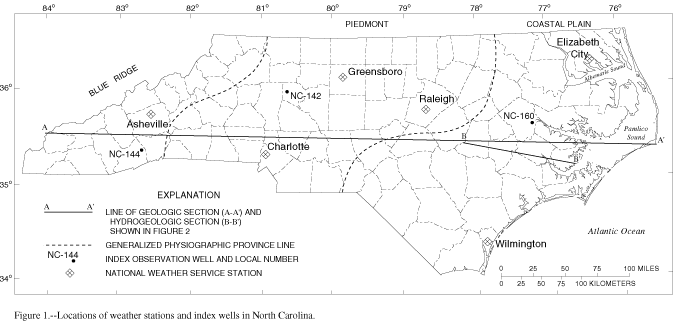
Precipitation amounts for the first quarter, October through December, of the 2001 water year were well below average across the State. Departures in precipitation amounts varied from 3.76 (Asheville) and 6.38 (Charlotte) inches below average in the western part of the State, to 6.20 (Greensboro) and 5.11 (Raleigh) inches below average in the central part of the State, to 4.98 (Elizabeth City) and 3.52 (Wilmington) inches below average in the eastern part of the State. All but one index site (Wilmington) recorded 0.00 inches to a trace of precipitation during the month of October. Asheville and Wilmington were the only locations to report above average precipitation amounts for the quarter; these amounts both occurred in November. Average precipitation amounts are based on data from 1971 through 2000, the 30-year base period used by the National Weather Service. Rainfall data collected at six key National Weather Service stations (figs. 1 GIF/PDF and 3 GIF/PDF) indicate that below average rainfall amounts were recorded in all the Provinces of North Carolina.
The second quarter of the 2001 water year, January through March, brought continued drier conditions to the State. March was the only month during the quarter in which all of the index sites, with the exception of Elizabeth City, reported above-average precipitation amounts. All of the index sites reported below average precipitation amounts for the quarter. The least rainfall was reported in Elizabeth City at 4.49 inches below average. Asheville, Charlotte, Greensboro, and Wilmington all reported rainfall from 0.40 to 2.20 inches below average.
The third quarter, April through June, again brought below-average rainfall amounts across the State. Raleigh and Elizabeth City were the only locations to report above average monthly rainfall, which both occurred in June. Asheville was affected the most by lack of rain, reporting 5.59 inches below average for the quarter.Charlotte, Greensboro, and Wilmington reported rainfall more than 3 inches below average.
During the fourth quarter, July through September, Asheville reported rainfall above average (1.18 inches). The remaining index sites; Charlotte (4.15 inches), Greensboro (1.44 inches), Raleigh (4.25 inches), Wilmington (3.22 inches), and Elizabeth City (5.72 inches) reported below-average conditions.
In summary, drought conditions in North Carolina, which began in 1998, continued throughout the State. The National Weather Service reported below-average annual rainfall amounts at each of the six index sites. Asheville, in the southeastern part of the State recovered somewhat from below-average rainfall amounts during the fourth quarter of the water year. The National Weather Service reported the following annual rainfall amounts for the 2001 water year at these selected stations: Asheville, 36.75 inches (10.29 inches below average); Charlotte, 26.48 inches (17.03 inches below average); Greensboro, 31.77 inches (11.36 inches below average); Raleigh, 32.70 inches (10.35 below average); Elizabeth City, 31.54 inches (15.44 inches below average); and Wilmington, 44.59 inches (12.48 inches below average).
Ground Water
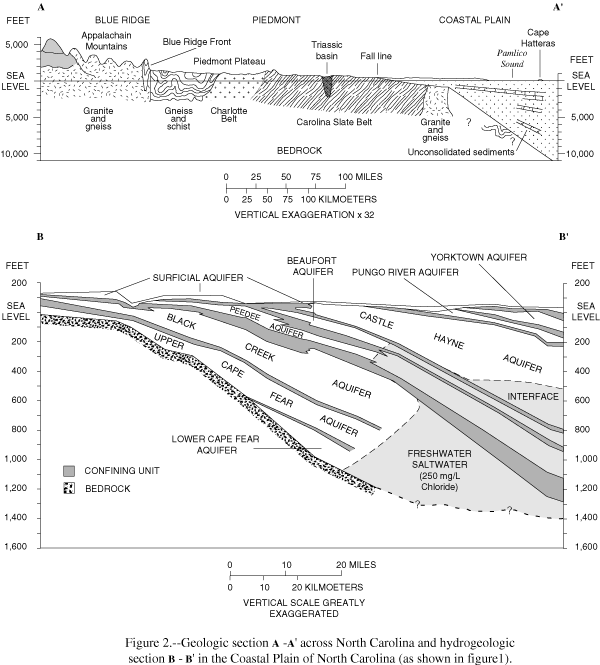
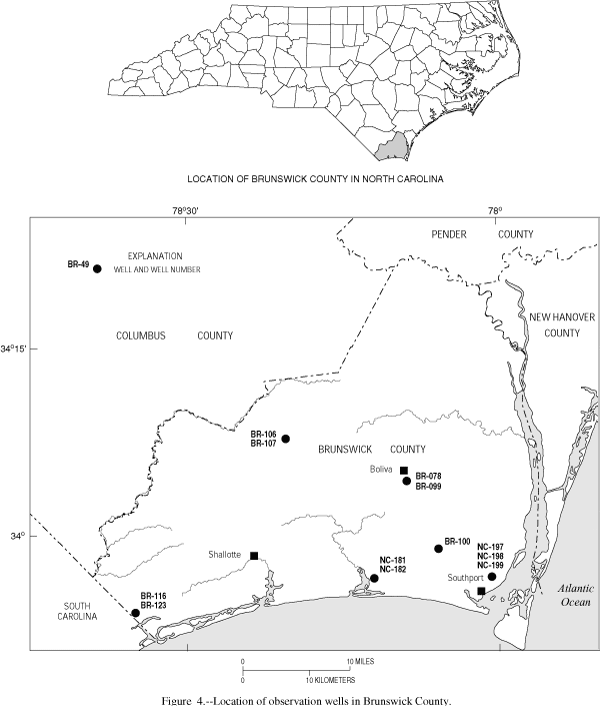
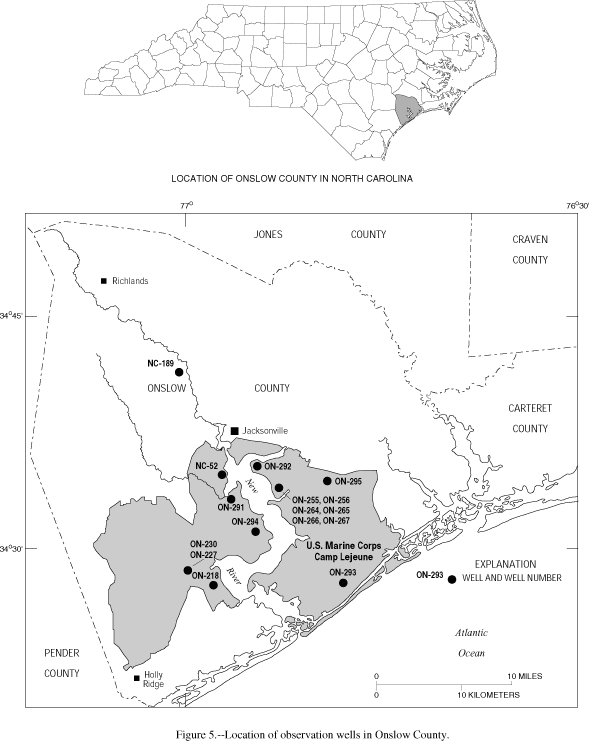
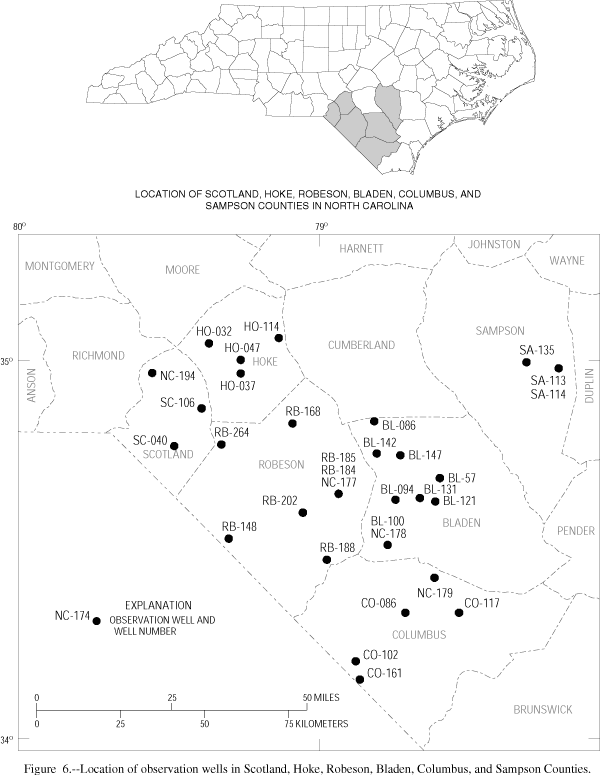
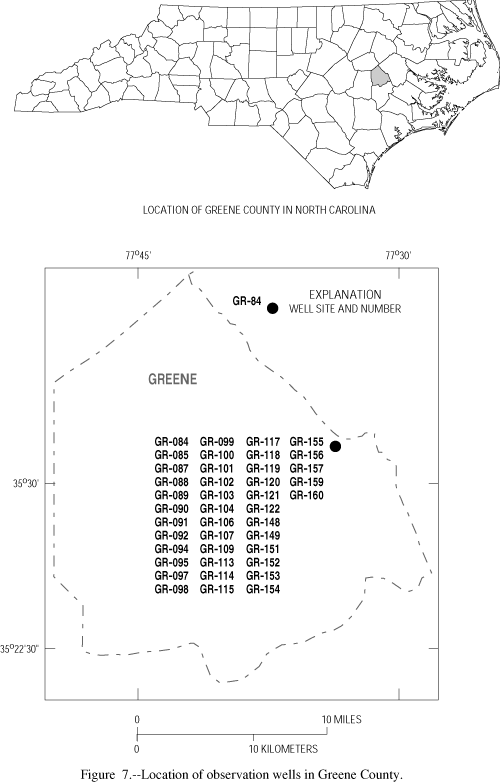
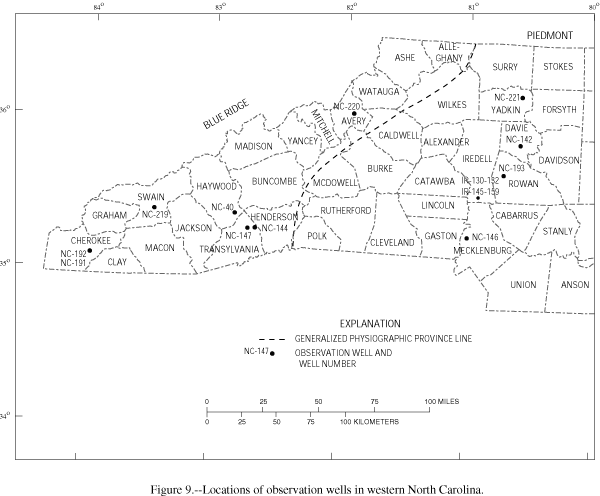
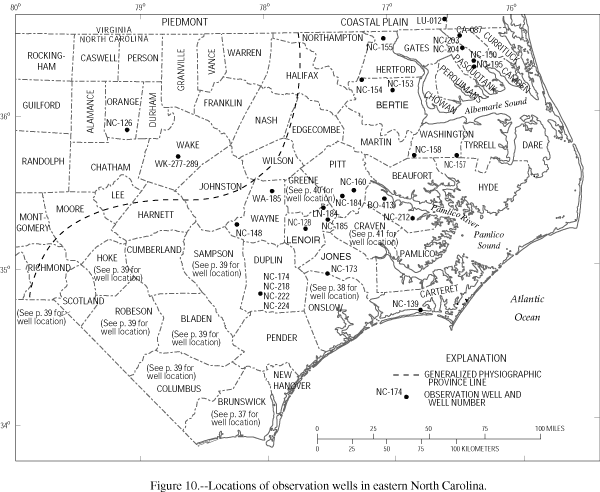
Cross sections illustrating the simplified geology and Coastal Plain aquifers of North Carolina are shown in figure 2 (GIF/PDF). Ground-water levels in the surficial aquifer of the Coastal Plain Province and in the weathered surficial layer (regolith) of the Piedmont and Blue Ridge Provinces of North Carolina respond to climatic influences. The continual discharge of ground water to streams is a function of periodic ground-water recharge by precipitation. Water levels in the unconfined aquifers generally decline throughout the growing season and are typically highest during the winter months when evapotranspiration losses are lowest. In addition to seasonal changes, water levels in deeper, confined aquifers in the Coastal Plain also can respond to induced effects, such as pumping. Locations of wells discussed in this report are shown in figures 4-10, p. 37-43 (fig 4 GIF/PDF, fig 5 GIF/PDF, fig 6 GIF/PDF, fig 7 GIF/PDF, fig 8 GIF/PDF, fig 9 GIF/PDF, fig 10 GIF/PDF).
Index Wells
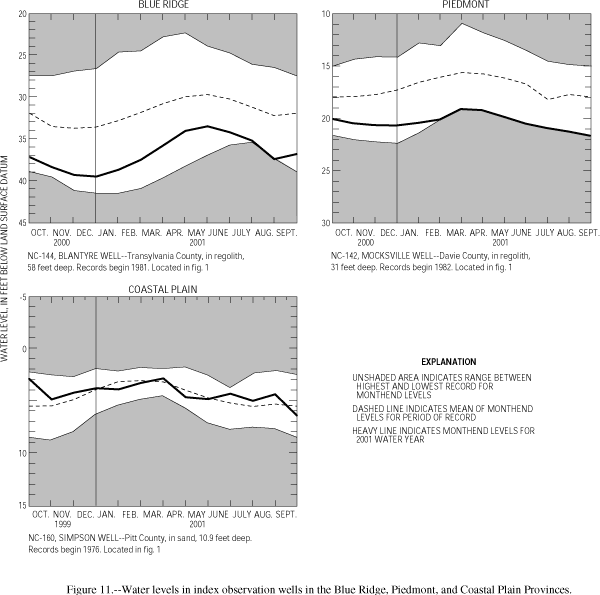
Water levels in index observation wells in the Blue Ridge, Piedmont, and Coastal Plain Provinces (fig. 1 GIF/PDF) provide a general indication of ground-water fluctuations in the shallow aquifers of these provinces. Hydrographs of monthend water levels in these index observation wells (fig. 11 GIF/PDF) include mean monthend water levels for the period of record and record high and low monthend water levels during the 2001 water year.
Water levels in the Blue Ridge index well NC-144 (fig. 11 GIF/PDF) were below the mean for the period of record (1981-2001) throughout the entire 2001 water year. New period-of-record minimums were observed for the month of August (fig. 11 GIF/PDF). This indicates below-average ground-water storage. New period-of-record minimums were observed throughout most of the 2001 water year in the Piedmont index well NC-142 (fig. 11 GIF/PDF). This record also indicates below-average in ground-water storage. In the Coastal Plain index well NC-160 (fig. 11 GIF/PDF), water levels were near the mean for most of the 2001 water year.
Natural-Effects Wells
Ground-water levels in North Carolina were influenced by a wide range of rainfall across the State during the 2001 water year. Overall, the State endured drought conditions for the fourth consecutive year. The effects of the drought conditions on recharge to the ground-water system was most evident in extreme period of record lows observed in the two Piedmont wells, and a Coastal Plain well. The Blue Ridge wells indicated an overall pattern of declining water levels during the last 4 to 5 years. A pattern of declining annual maximum and minimum yearly water levels continued for the fourth year in Blue Ridge well NC-144 (p. 234). The water level in Blue Ridge well NC-191 (p. 88) recovered somewhat from three previous years of decline. The lowest water level in 20 years (period of record) was recorded in Piedmont well NC-142 (p. 106), preceded by a 5-year decline. Since 1997, the yearly mean water level in well NC-142 has declined more than 6 feet, indicating a substantial loss of ground-water storage. The lowest water level in 12 years was recorded in Piedmont well NC-193 (p. 220). Water levels in Coastal Plain climatic-effects well NC-148 (p. 256) were near mean for the 21-year period of record. Water levels in Coastal Plain terrane-effects well NC-194 (p. 226) ended the year about 1.75 ft below the initial water level, indicating an evident change in aquifer storage.
Induced-Effects Wells
Ground-water withdrawals in the Coastal Plain have resulted in declining water levels in confined aquifers in some areas of the Coastal Plain for a number of years. This declining trend is shown by the long-term record from several induced-effects observation wells that tap four of the major aquifers in eastern North Carolina . the Castle Hayne, Black Creek, Upper Cape Fear, and Lower Cape Fear aquifers (fig. 2 GIF/PDF).
The record of observation well NC-212 (p. 46) shows the fluctuations of water levels in the Castle Hayne aquifer resulting from changes in pumping at a large mining and manufacturing operation in the eastern part of Beaufort County. Water-level fluctuations shown in the records from well NC-212 reflect major pumping activities at this facility. The yearly pumping water-level fluctuation is more than 70 ft (p. 47). The areal cone of depression resulting from this pumping historically has covered more than 3,000 mi2 (Coble and others, 1989).
The record of observation well NC-139 (p. 86) in Carteret County shows the effects of seasonal pumping from the Castle Hayne aquifer in order to meet increased demand for water in the coastal area during the summer months. The decline in water levels in the long-term record (p. 87) indicates that annual recharge to the aquifer is less than the amount of water withdrawn. Observation well ON- 227 (p. 166), completed in the Castle Hayne aquifer in Onslow County, shows a similar long-term, water-level decline with more recent drawdown resulting from expanding well fields in the area.
Water levels in the Castle Hayne aquifer are not declining everywhere throughout the eastern Coastal Plain. This is especially true in the subcrop areas of the aquifer that are not covered by extensive confining units (Strickland and others, 1992). The water levels in Castle Hayne well NC-52 (p. 160) in Onslow County exhibits climatic-effect fluctuations. Although well NC-52 is near water-supply wells at U.S. Marine Corps Camp Geiger, no effects of withdrawals from these wells can be observed in the long-term record.
Ground-water withdrawals, estimated at 134 million gallons per day over 15 counties, have resulted in water-level declines in the State's central Coastal Plain (Walters, 1997). The aquifers most affected in this 9,250-mi2 area, which extends from Bertie County in the north to Pender County in the south, are the Peedee, Black Creek, Upper Cape Fear, and Lower Cape Fear aquifers. Examples of the long-term effects of these withdrawals can be observed in data from several wells. Well NC-128 (p. 152) shows the effects of pumping from the Black Creek aquifer in Lenoir County. Water-level declines up to 4 ft per year have been recorded in well NC-128 until 1998 when water levels started to recover. The period of record hydrograph for well NC-128 (p. 153) shows a long-term decline of almost 80 ft from 1972-1997. Major withdrawals for public supply in Onslow County in the southern part of the central Coastal Plain are from the Peedee and Black Creek aquifers. The period of record hydrograph for well NC-189 (p. 162) in Onslow County (Black Creek) shows a long-term water-level decline of about 74 ft resulting from these withdrawals. Declines in the Black Creek aquifer at well NC-189 were more than 6 ft per year in the early 1990's, but water-level declines leveled off in 1997. Well ON-256 (p. 172) in Onslow County is also in the Black Creek aquifer. Declines of about 2 ft per year have been observed in this well over the last 5 years.
Withdrawals for public and industrial use from the Upper Cape Fear aquifer in Bladen County have caused water levels to decline in well NC-177 (p. 206). Prior to 1992, the rate of water-level decline in well NC-177 was about 1.7 ft per year. In mid-October 1992, major withdrawals for industrial use (from the same aquifer) began in northwestern Bladen County; as a result, the rate of decline in well NC-177 was about 7 ft per year between late 1992 and 1996. Between late 1996 and 1999, the rate of decline in well NC-177 was about 3 ft per year (Strickland, 1995, 1999). The current rate of decline for the 2001 water year was 3.9 ft per year.
Water-level declines in well NC-155 (p. 122), which is completed in the lower Cape Fear aquifer in Hertford County, result primarily from major withdrawals in Virginia that began in the 1940's. These withdrawals have caused a regional cone of depression in the Lower Cape Fear aquifer, which extends about 30 miles into North Carolina (Coble and others, 1989). Water-level records from well NC-155 indicate that the maximum (drawdown) rate of decline of 3.5 ft per year occurred in the late 1980's and early 1990's. From 1993 to 1998, the rate of decline decreased to less than 2 ft per year. A slight recovery in water levels was observed from late 1998 through mid-2000; however, recent data for the 2001 water year indicate a return to declining water levels at a rate of more than 1 ft per year.
![]()
Return to WY 2001 Annual Data Report Home Page
![]()