
U.S. Department of the Interior
U.S. Geological Survey
Water-Resources Investigations Report 02-4045
Cheyenne, Wyoming, 2002
Prepared in cooperation with the
WYOMING STATE ENGINEER'S OFFICE and the BUREAU OF LAND
MANAGEMENT
By Timothy T. Bartos and Kathy Muller Ogle
 |
This report is also available in PDF format: wri024045.pdf (17.6 mb). The PDF file has been made Section 508 compliant for users with visual disabilities. It is best viewed with Adobe Acrobat Reader® version 5.0 or above. If you don't already have this free viewing software, or need to upgrade your version, download Adobe Acrobat Reader®. Users with visual disabilities may also wish to visit the Adobe Systems Accessibility Website, which offers conversion tools and information to help make PDF files accessible. |
1. Map showing location of the study area in the Powder River Basin,
Wyoming
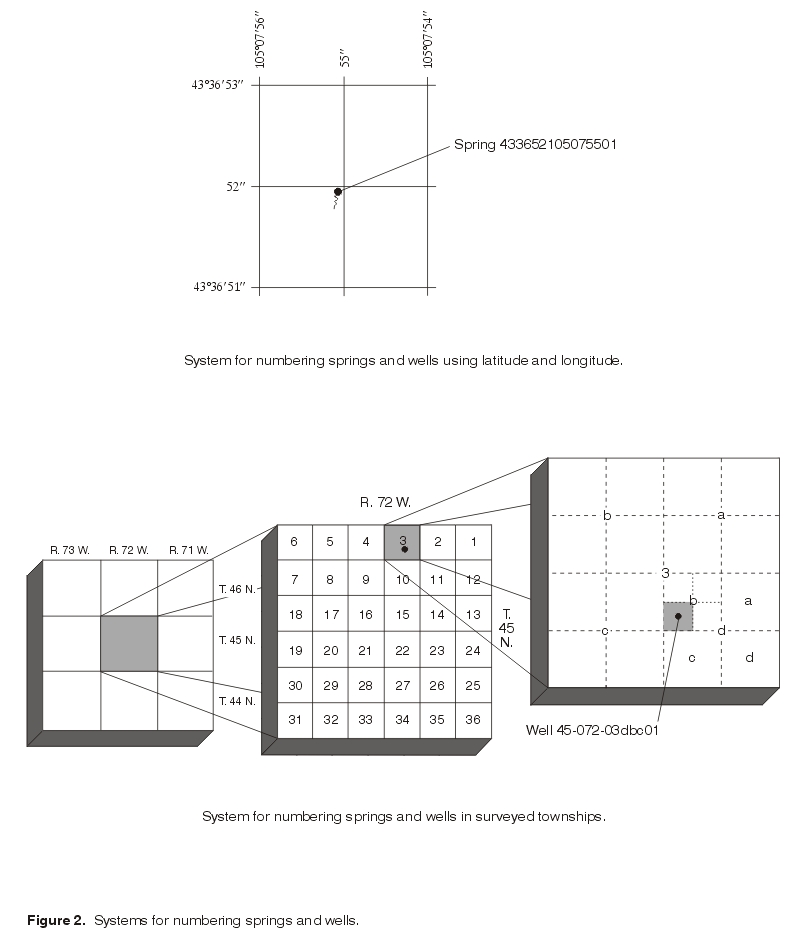
2. Diagram showing systems for numbering springs and wells
3. Generalized stratigraphic column of the Wasatch and Fort Union
Formations in the central Powder River Basin, Wyoming
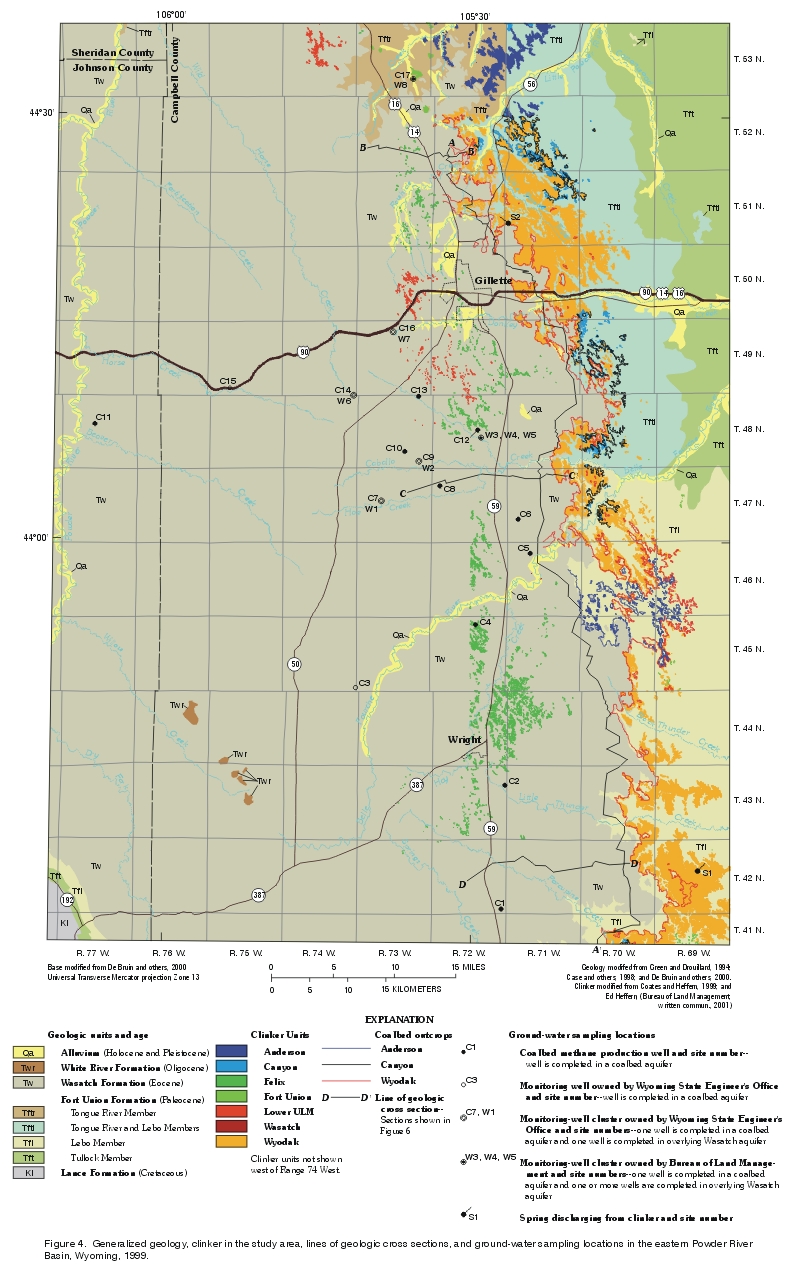
4. Map showing generalized geology, clinker in the study area, lines of
geologic cross sections, and ground-water sampling locations in the eastern
Powder River Basin, Wyoming, 1999
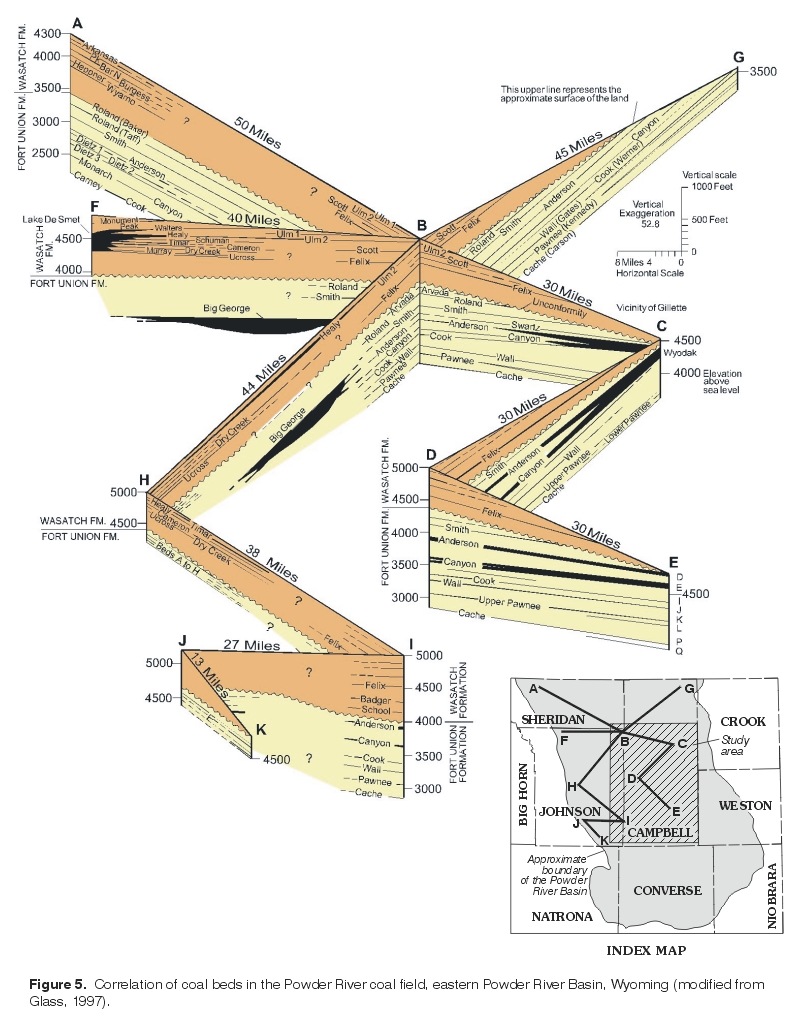
5. Diagram showing correlation of coal beds in the Powder River coal
field, eastern Powder River Basin, Wyoming
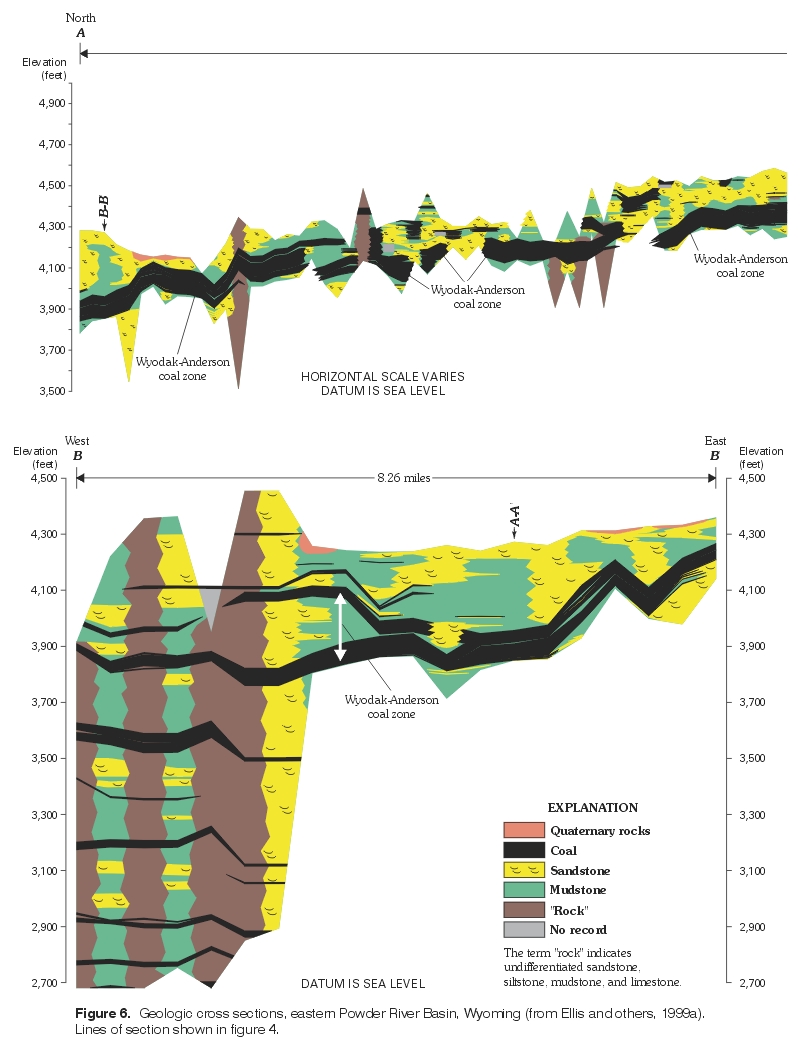
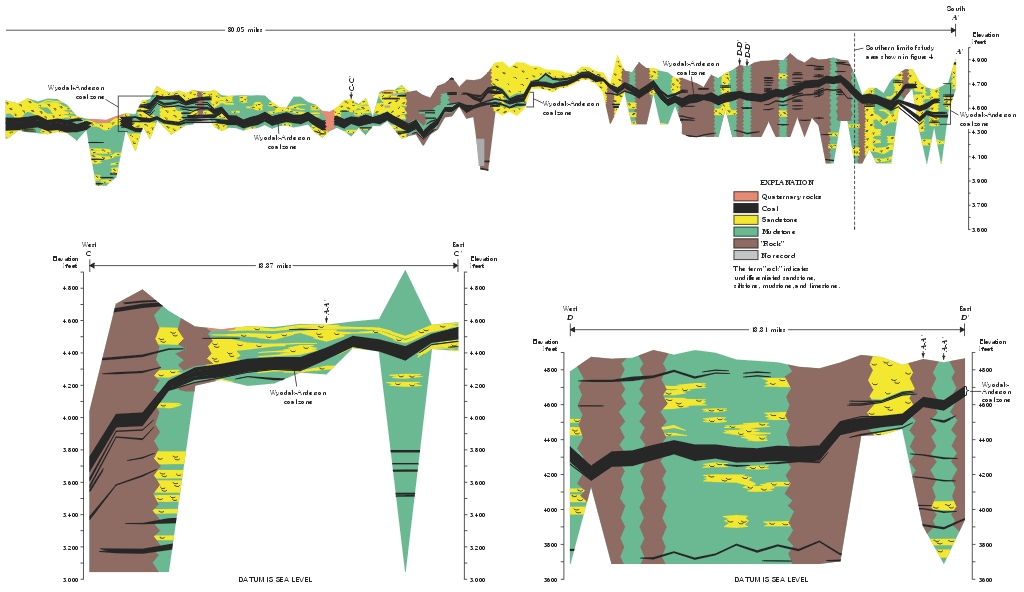
6. (left page, right
page)
Geologic cross sections, eastern Powder River Basin, Wyoming
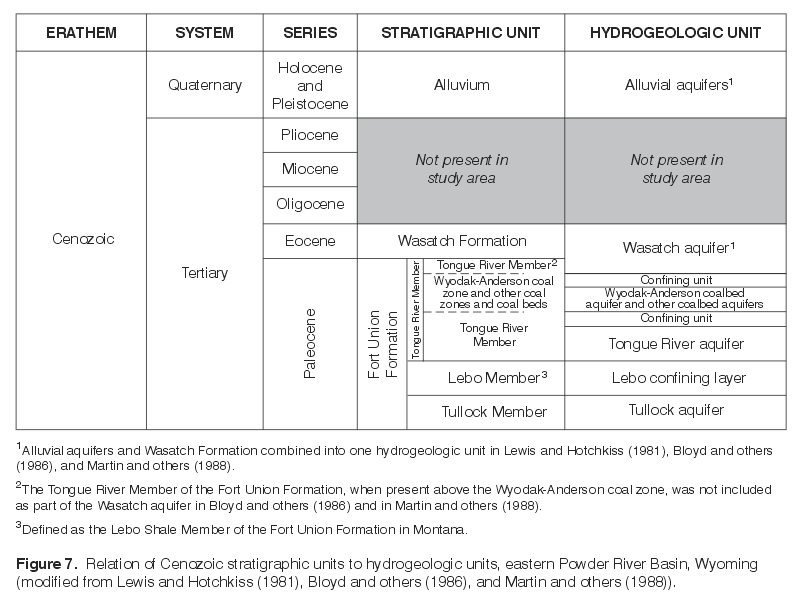
7. Chart showing relation of Cenozoic stratigraphic units to
hydrogeologic units, eastern Powder River Basin, Wyoming
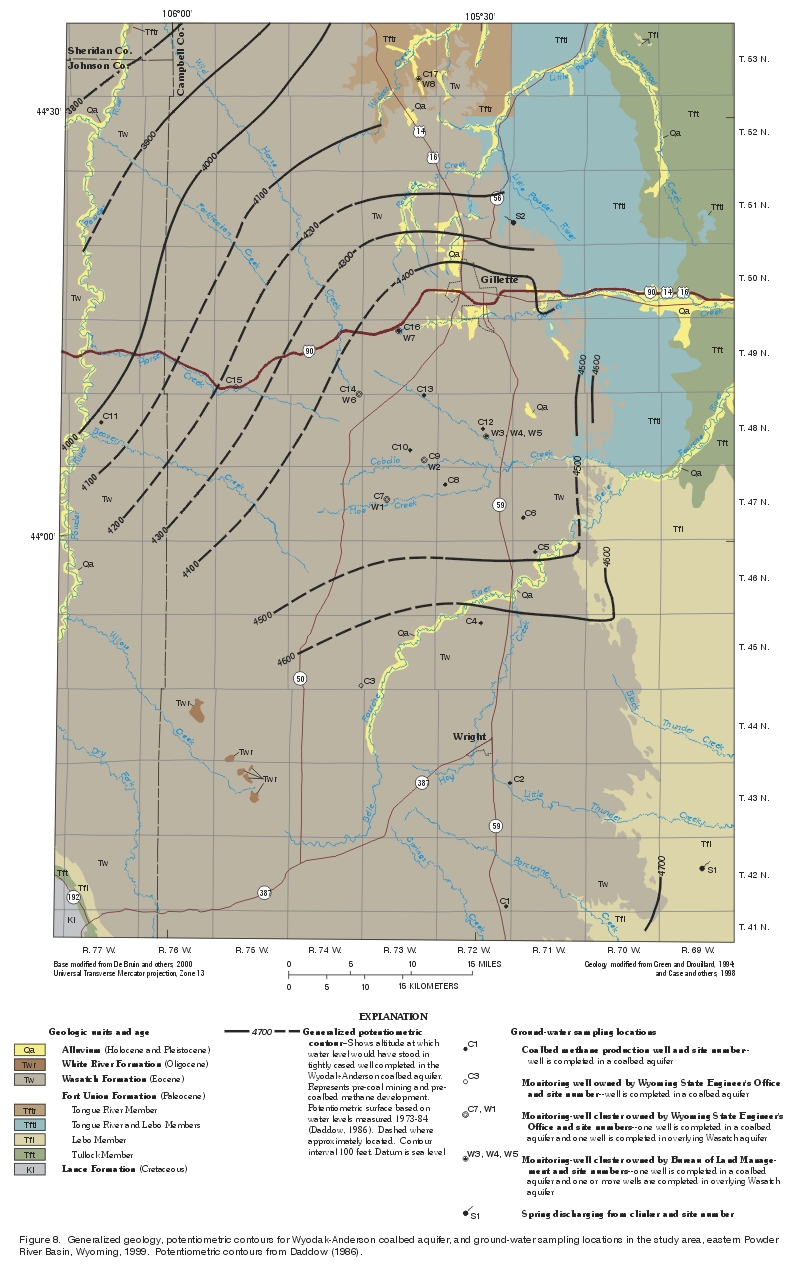
8. Map showing generalized geology, potentiometric contours for Wyodak-Anderson
coalbed aquifer, and ground-water sampling locations in the study area, eastern
Powder River Basin, Wyoming, 1999
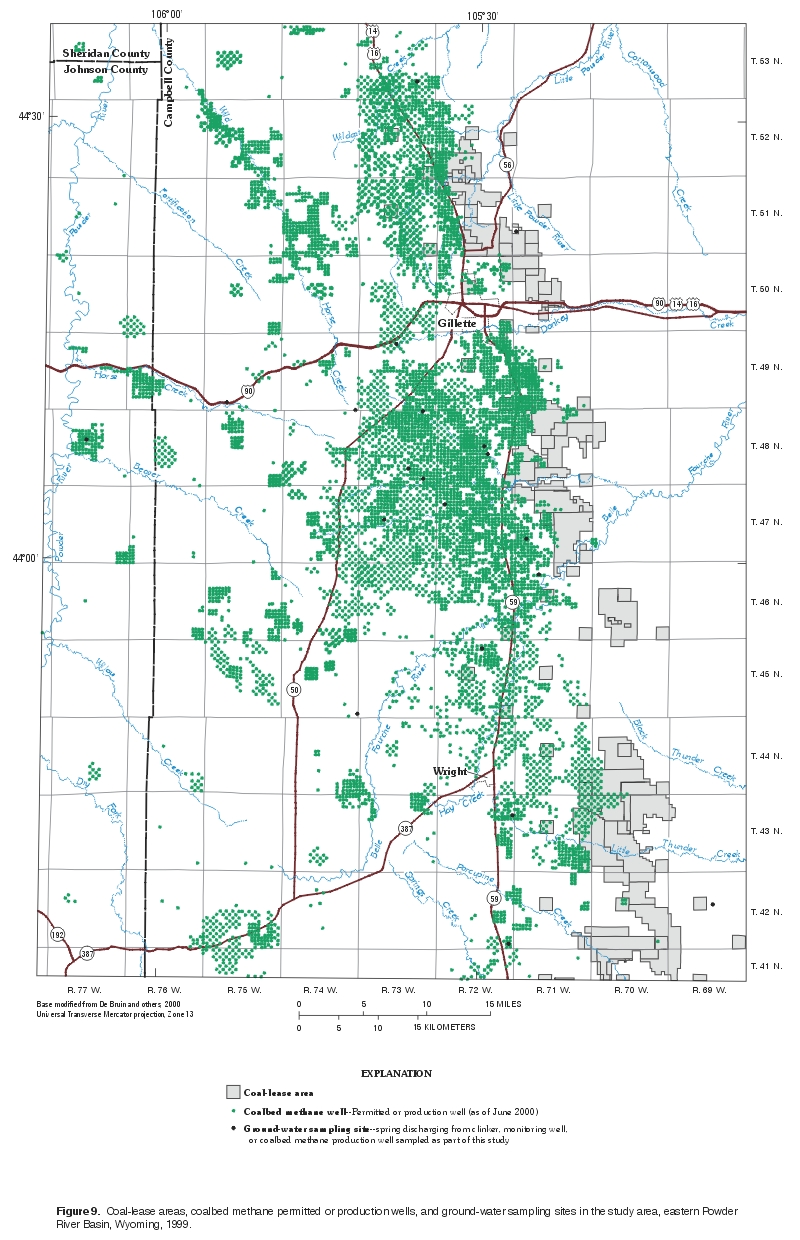
9. Map showing coal-lease areas, coalbed methane permitted or production
wells, and ground-water sampling sites in the study area, eastern Powder River Basin, Wyoming, 1999
10-12. Graphs showing:
10. Physical characteristics of ground water, eastern Powder River Basin, Wyoming, 1999
11. General mineral characteristics of ground water, eastern Powder River Basin, Wyoming, 1999
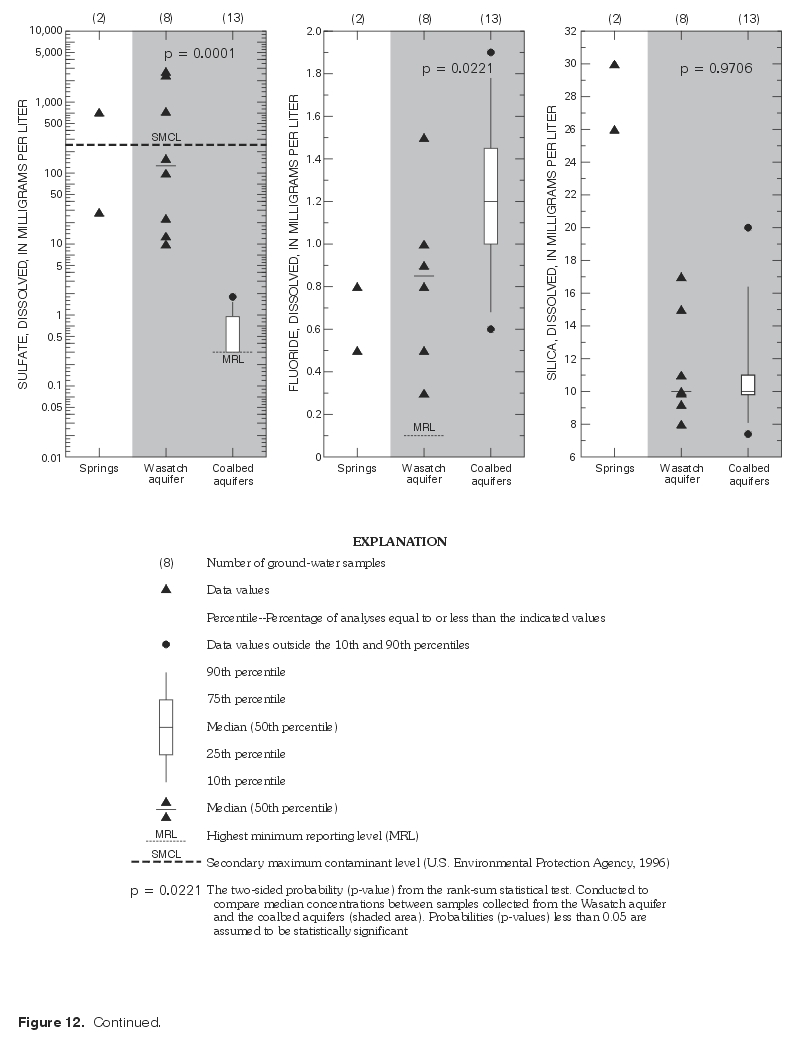
12. (left page, right page) Concentrations of major ions in ground water, eastern Powder River Basin, Wyoming, 1999
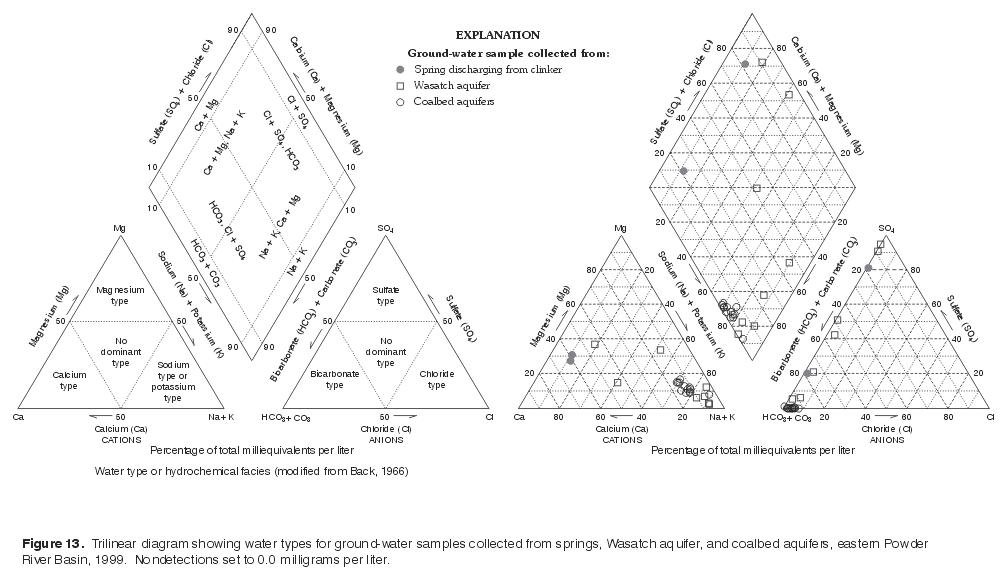
13. Trilinear diagram showing water types for ground-water samples
collected from springs, Wasatch aquifer, and coalbed aquifers, eastern Powder
River Basin, 1999
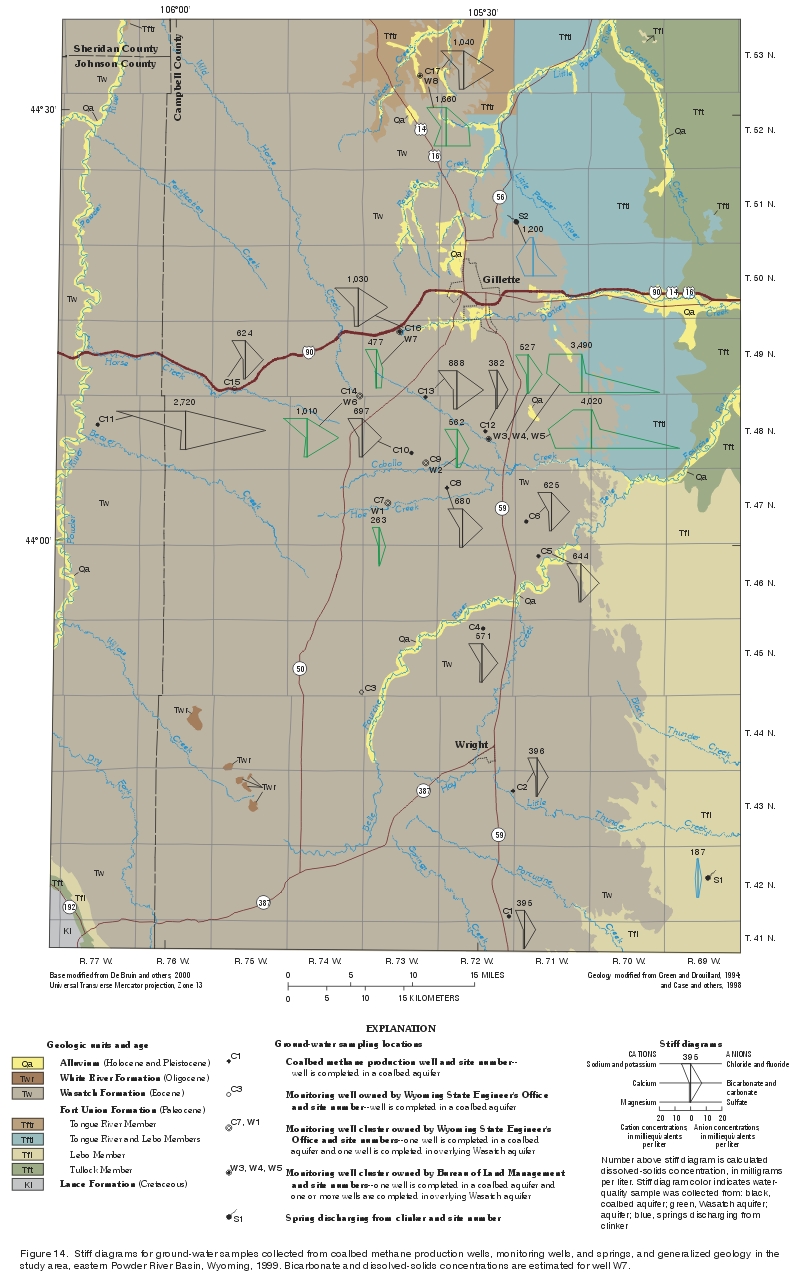
14. Stiff diagrams for ground-water samples collected from coalbed
methane production wells, monitoring wells, and springs, and generalized geology
in the study area, eastern Powder River Basin, Wyoming, 1999
15-19. Graphs showing:
15. Calcium and sulfate concentrations in relation to well depth, Wasatch aquifer, eastern Powder River Basin, Wyoming, 1999
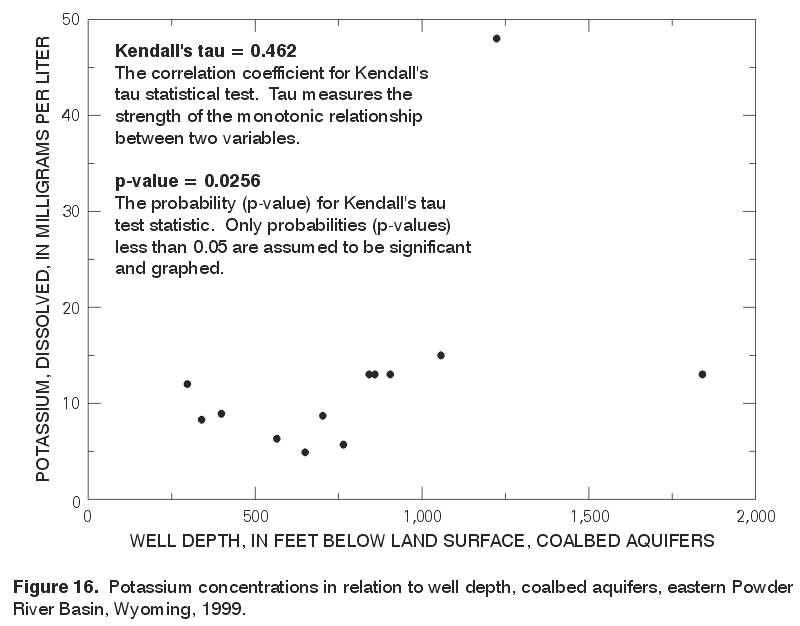
16. Potassium concentrations in relation to well depth, coalbed aquifers, eastern Powder River Basin, Wyoming, 1999
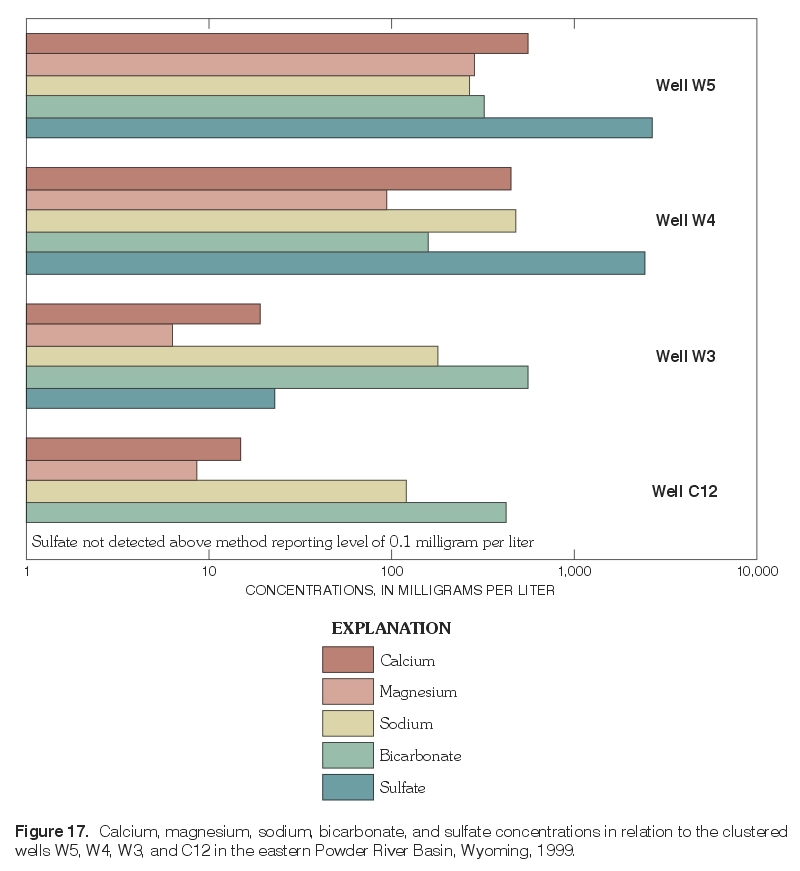
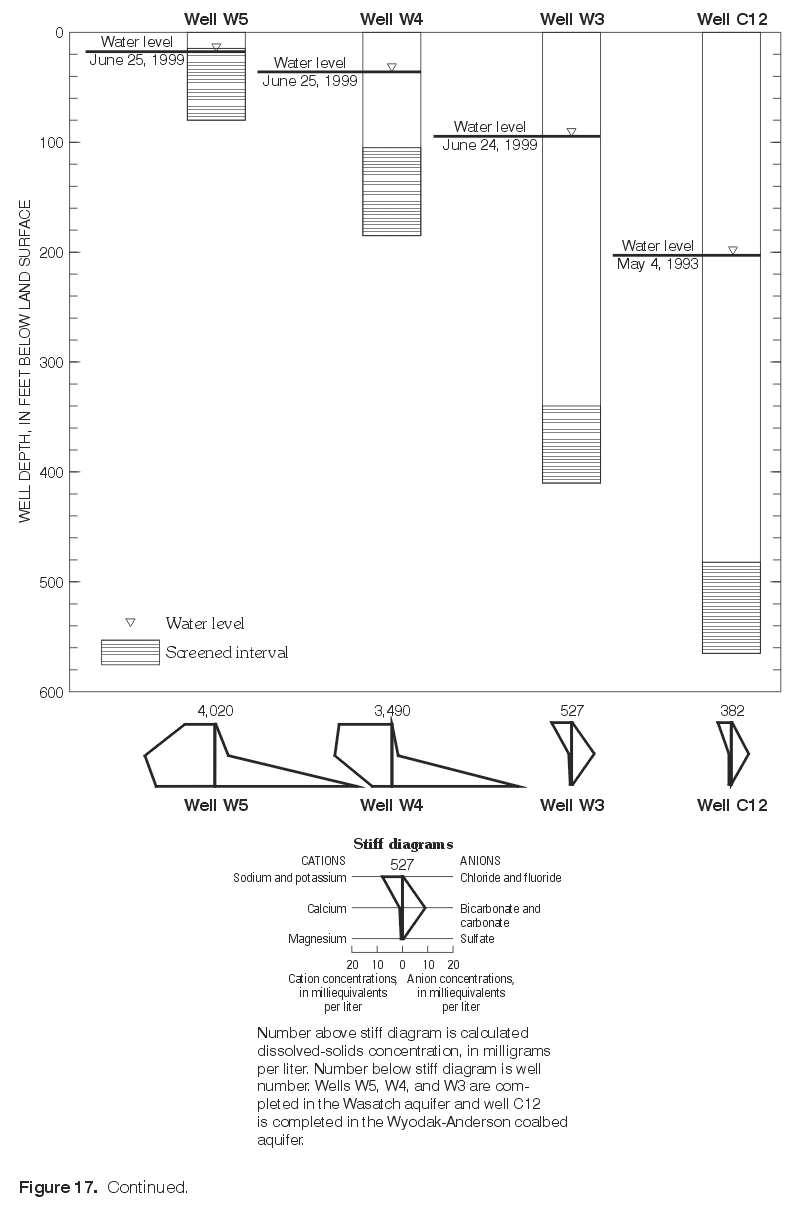
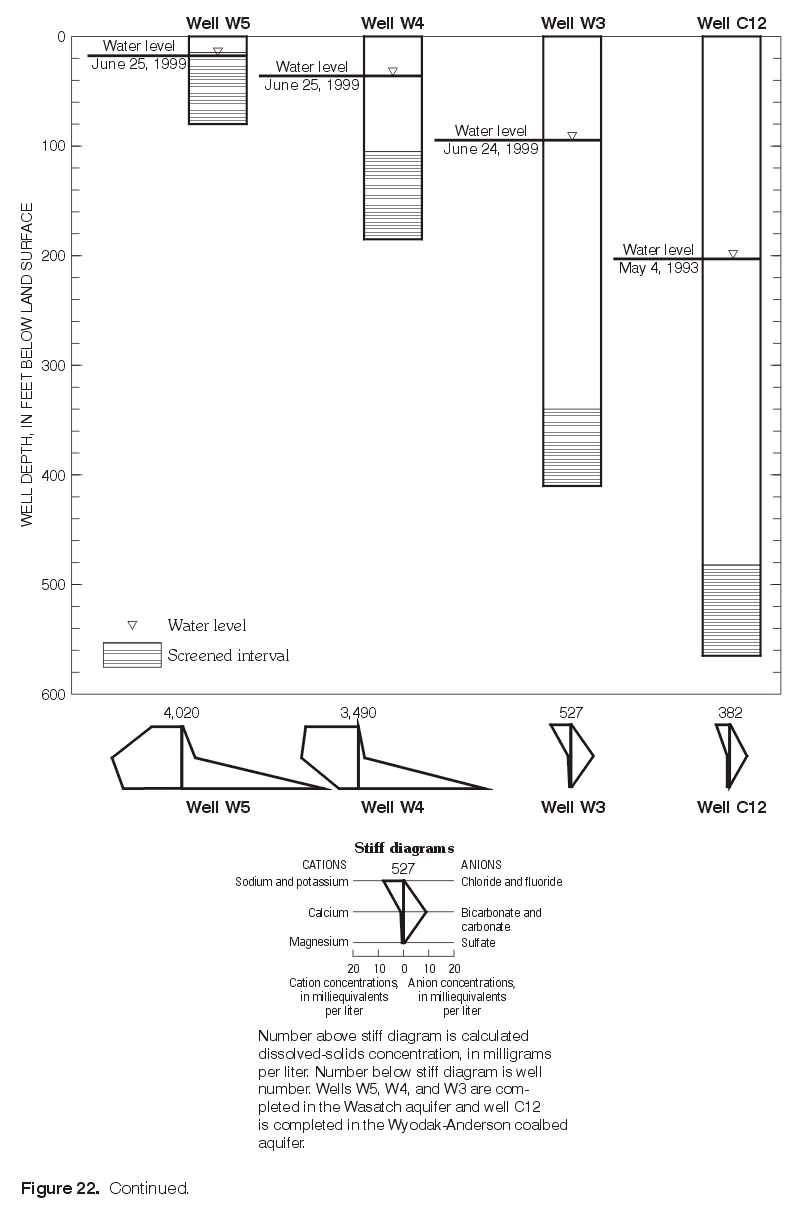
17. (left page, right page) Calcium, magnesium, sodium, bicarbonate, and sulfate concentrations in relation to the clustered wells W5, W4, W3, and C12 in the eastern Powder River Basin, Wyoming, 1999
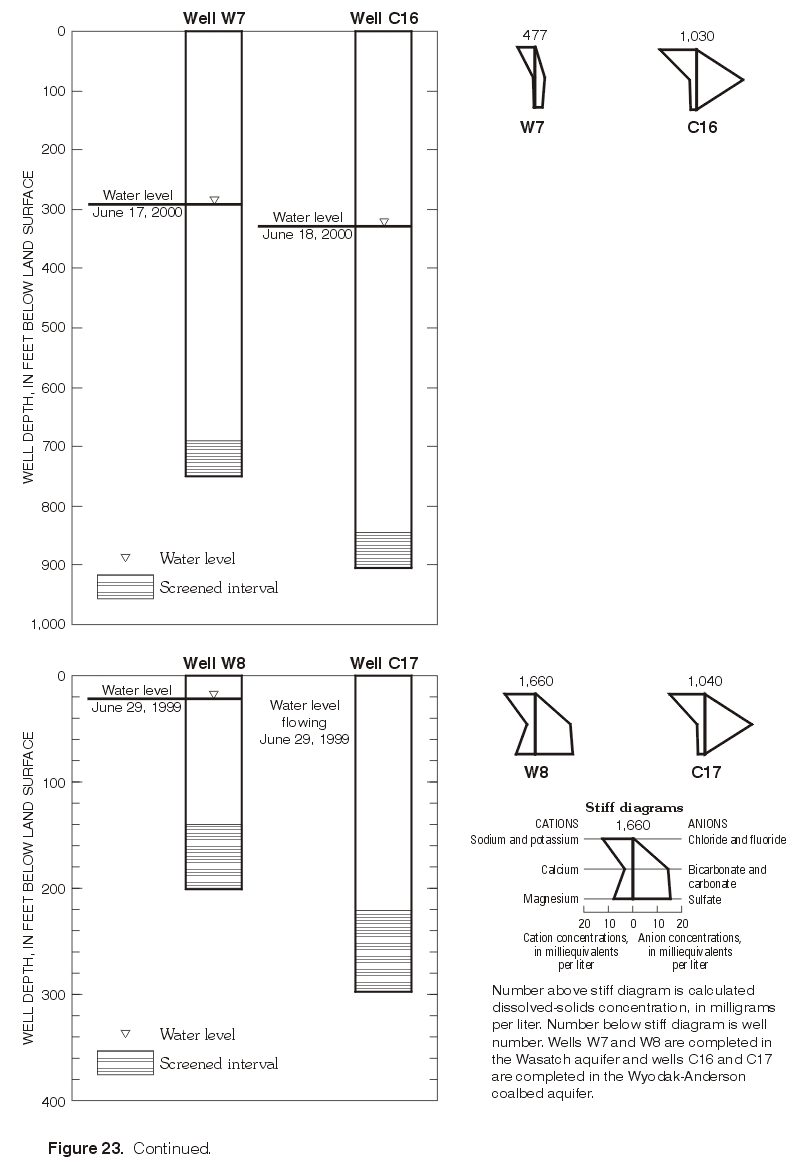
18. (left page, right page) Calcium, magnesium, sodium, bicarbonate, and sulfate concentrations in relation to the clustered wells W8 and C17 in the eastern Powder River Basin, Wyoming, 1999
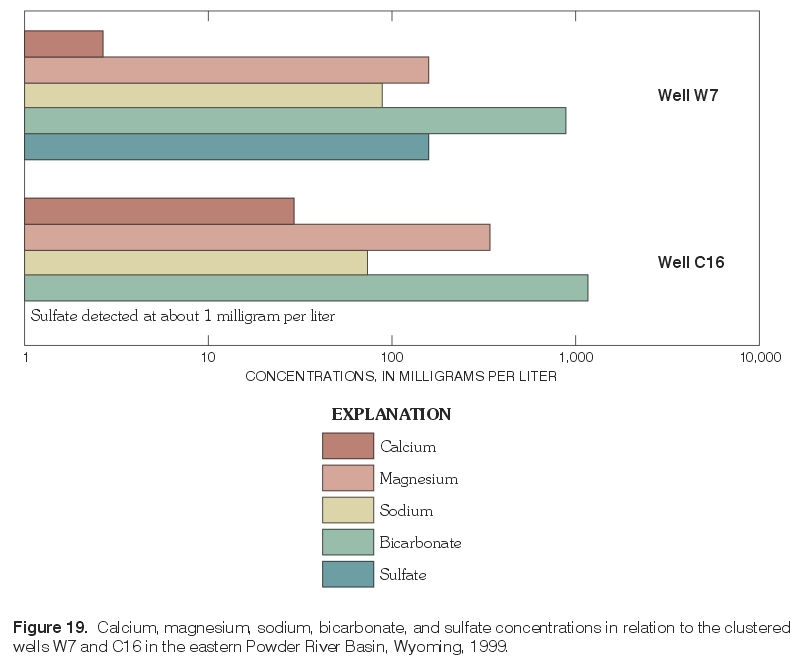
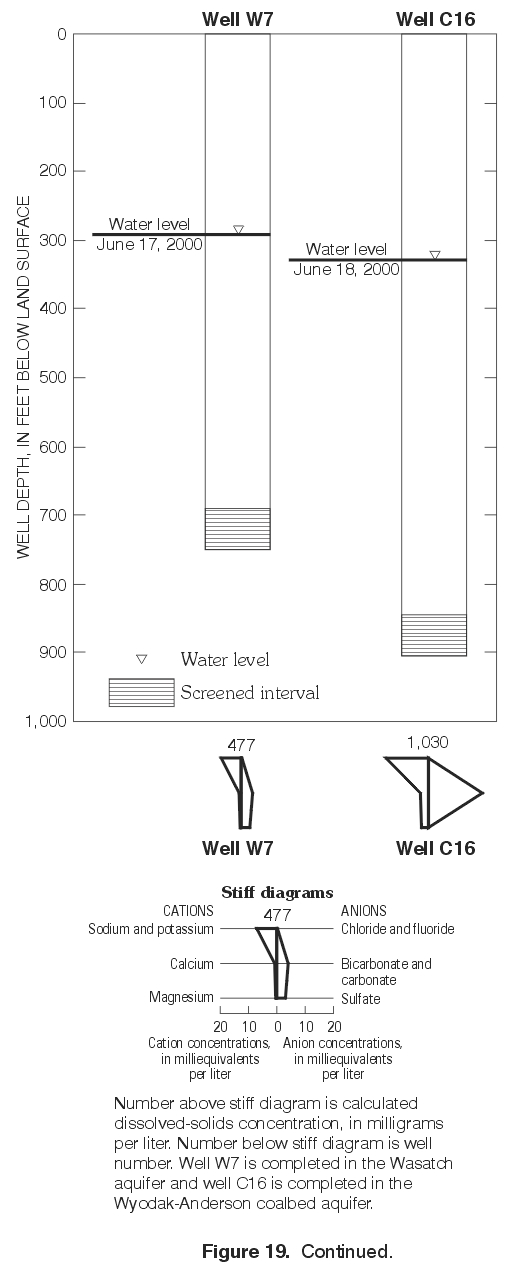
19. (left page, right page) Calcium, magnesium, sodium, bicarbonate, and sulfate concentrations in relation to the clustered wells W7 and C16 in the eastern Powder River Basin, Wyoming, 1999
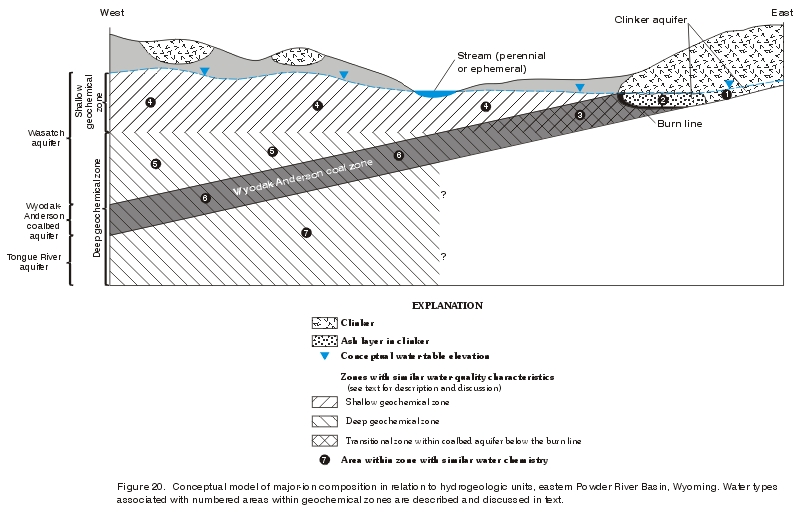
20. Diagram of conceptual model of major-ion composition in relation to hydrogeologic units, eastern Powder River Basin, Wyoming
21-23. Graphs showing:
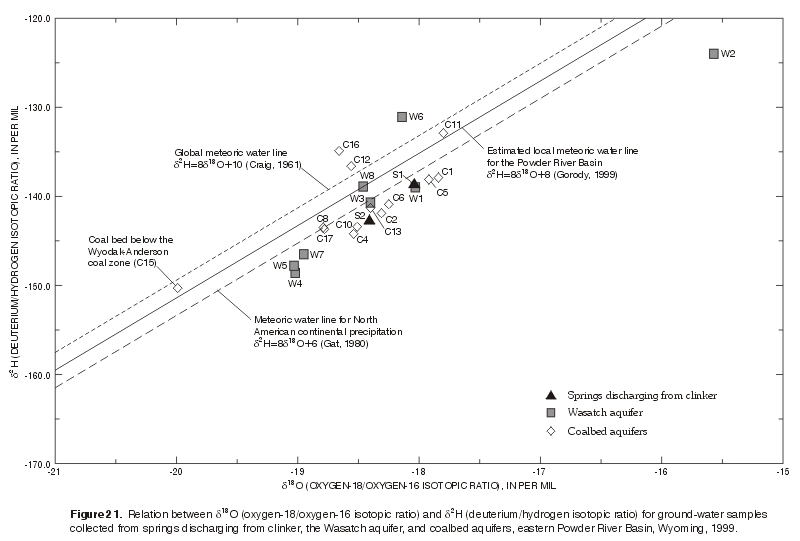
21. Relation between d18O (oxygen-18/oxygen-16 isotopic ratio) and d2H (deuterium/hydrogen isotopic ratio) for ground-water samples collected from springs discharging from clinker, the Wasatch aquifer, and coalbed aquifers, eastern Powder River Basin, Wyoming, 1999
22. (left page, right page) d2H (deuterium/hydrogen isotopic ratio), d18O (oxygen-18/oxygen-16 isotopic ratio), and major-ion chemistry in relation to the clustered wells W5, W4, W3, and C12 in the eastern Powder River Basin, Wyoming, 1999
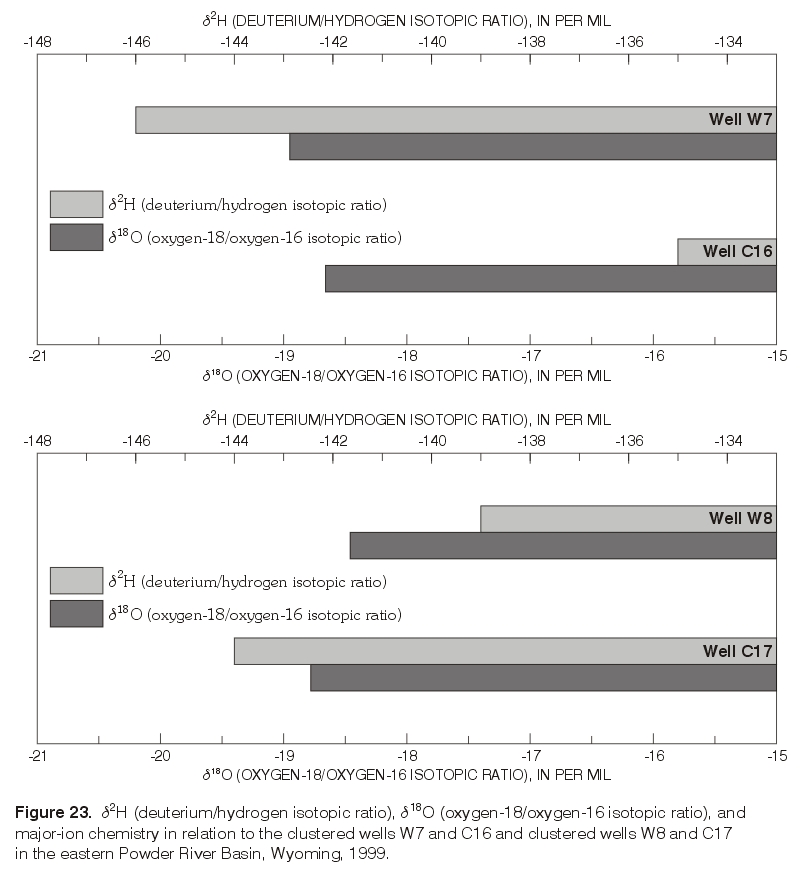
23. (left page, right page) d2H (deuterium/hydrogen isotopic ratio), d18O (oxygen-18/oxygen-16 isotopic ratio), and major-ion chemistry in relation to the clustered wells W7 and C16 and clustered wells W8 and C17 in the eastern Powder River Basin, Wyoming, 1999
24-25. Maps showing:
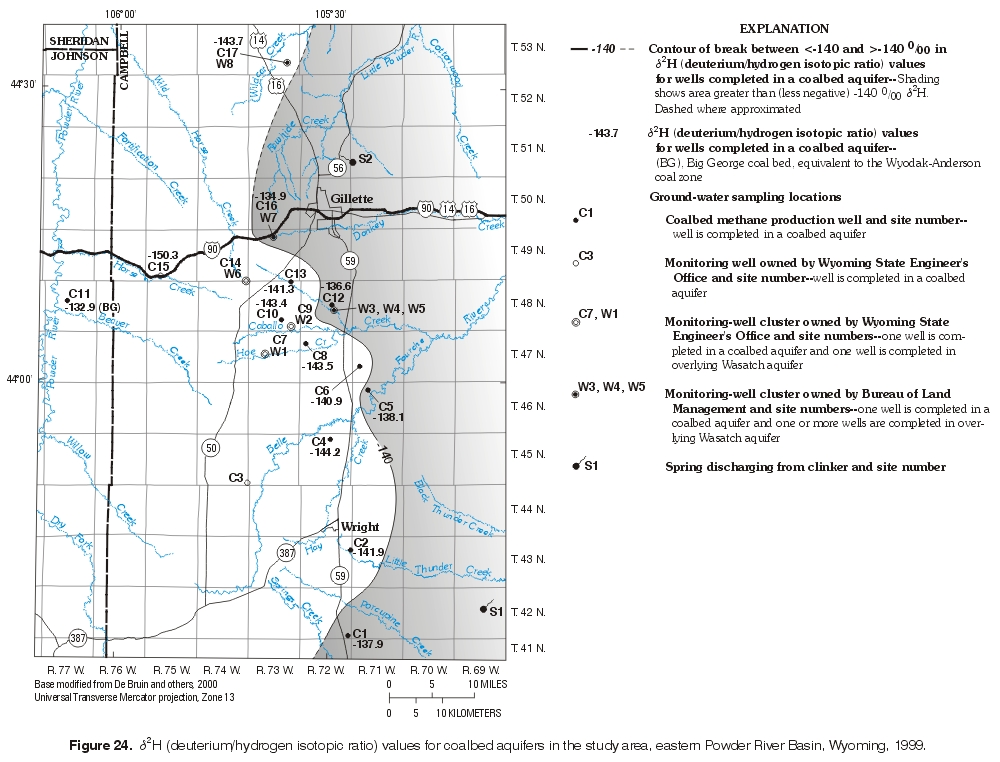
24. d2H (deuterium/hydrogen isotopic ratio) values for coalbed aquifers in the study area, eastern Powder River Basin, Wyoming, 1999
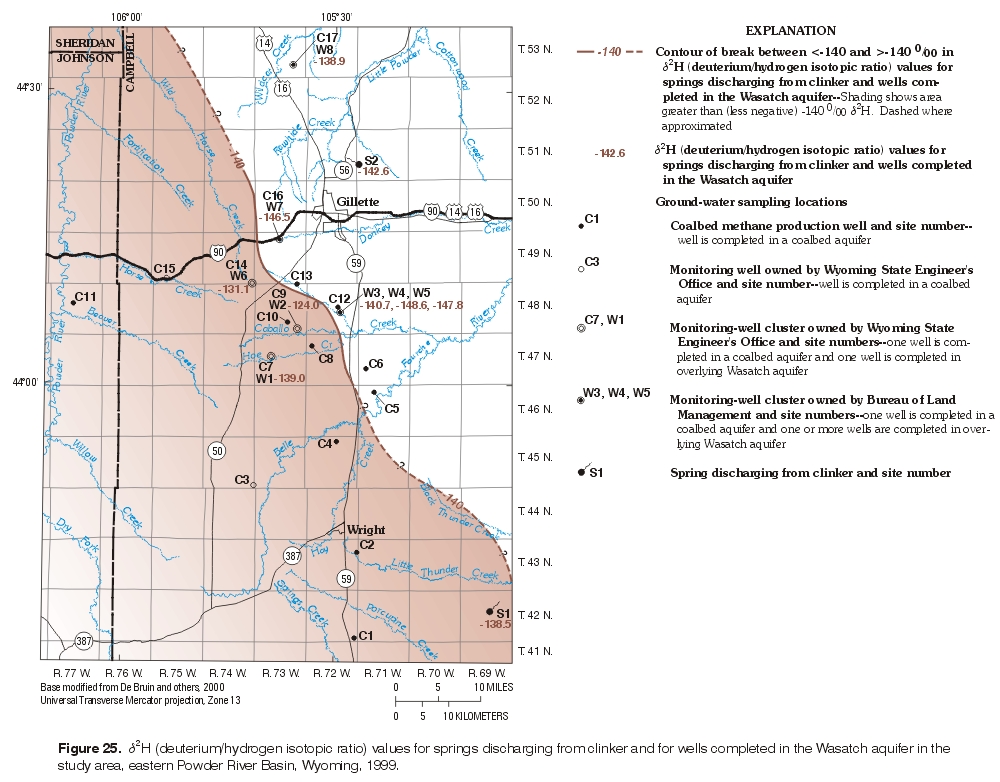
25. d2H (deuterium/hydrogen isotopic ratio) values for springs discharging from clinker and for wells completed in the Wasatch aquifer in the study area, eastern Powder River Basin, Wyoming 1999
26. Diagram showing suitability of water for use in irrigation based on analyses of water from springs, Wasatch aquifer, and coalbed aquifers, eastern Powder River Basin, Wyoming, 1999
1. Identification numbers, well-completion information, water levels,
geologic units, and assigned hydrogeologic units for wells sampled in the study area
2. Differences in water-level elevations and hydraulic potential for
vertical ground-water flow in monitoring-well clusters
3. Source or cause, and significance of dissolved-mineral constituents
and physical properties of water
4. Calculated relative-percent differences between normal environmental
and replicate ground-water samples
5. Summary of water-quality data for ground-water samples collected
from wells completed in the Wasatch aquifer
6. Summary of water-quality data for ground-water samples collected
from wells completed in coalbed aquifers
7. Results of rank-sum tests between Wasatch aquifer and coalbed
aquifers
8. Kendall's tau correlation coefficients and resulting probabilities
(p-values) between dissolved solids or major ions and well depth, Wasatch aquifer
9. Kendall's tau correlation coefficients and resulting probabilities
(p-values) between dissolved solids or major ions and well depth, coalbed aquifers
10. Tritium concentrations in ground-water samples collected from
springs and wells
11. d2H (deuterium/hydrogen isotopic ratio) and
d18O
(oxgen-18/oxygen-16 isotopic ratio) values for ground-water samples collected from springs discharging from clinker and wells
completed in the Wasatch aquifer and coalbed aquifers
12. Comparison of ground-water-quality samples collected from wells
with selected U.S. Environmental Protection Agency maximum and secondary maximum contaminant levels for
public drinking-water supplies
13. Comparison of ground-water-quality samples collected from wells
with selected State of Wyoming standards for domestic use
14. Hardness classification of ground-water-quality samples collected
from wells
15. Comparison of ground-water-quality samples collected from wells
with selected State of Wyoming standards for agricultural (irrigation) and livestock use
| Multiply | By | To obtain |
|---|---|---|
| Length | ||
| inch (in) | 25.40 | millimeter (mm) |
| inch (in) | 72.540 | centimeter (cm) |
| foot (ft) | 0.3048 | meter (m) |
| mile (mi) | 1.609 | kilometer (km) |
| Area | ||
| square mile (mi2) | 2.590 | square kilometer (km2) |
| Volume | ||
| liter (L) | 33.82 | ounce (oz) |
| milliliter (mL) | 0.0338 | ounce (oz) |
| microliter (mL) | 0.0000338 | ounce (oz) |
| Hydraulic Conductivity | ||
| foot per day (ft/d) | 0.3048 | meter per day (m/d) |
| Transmissivity | ||
| foot squared per day (ft2/d) | 0.0929 | meter squared per day (m2/d) |
| Concentration | ||
| milligram per liter (mg/L) | 1.0 | part per million (ppm) |
| microgram per liter (µg/L) | 1.0 | part per billion (ppb) |
Temperature can be converted to degrees Fahrenheit (°F) or degrees Celsius (°C) as follows:
°F = 9/5 (°C) + 32
°C = 5/9 (°F - 32)
Sea level: In this report "sea level" refers to the National Geodetic Vertical Datum of 1929--a geodetic datum derived from a general adjustment of the first-order level nets of the United States and Canada, formerly called Sea Level Datum of 1929.
Abbreviated water-quality units used in this report:
|
‰ |
per mil or parts per thousand |
|
d2H |
deuterium/hydrogen isotopic ratio |
|
d18O |
oxygen-18/oxygen-16 isotopic ratio |
|
meq/L |
milliequivalents per liter |
|
mg/L |
milligram per liter |
|
µg/L |
microgram per liter |
|
µm |
micrometer |
|
µS/cm |
microsiemens per centimeter at 25 degrees Celsius |
|
pCi/L |
picocuries per liter |
|
TU |
tritium units |
Abbreviations used in this report:
|
°C |
degrees Celsius |
|
°F |
degrees Fahrenheit |
|
2H |
deuterium |
|
3H |
tritium |
|
16O |
oxygen-16 |
|
18O |
oxygen-18 |
|
ANC |
acid-neutralizing capacity |
|
BLM |
Bureau of Land Management |
|
C |
carbon |
|
Ca |
calcium |
|
CaCO3 |
calcium carbonate |
|
CH4 |
methane |
|
Cl |
chloride |
|
cm |
centimeter |
|
CO2 |
carbon dioxide |
|
F |
fluoride |
|
ft |
foot |
|
GMWL |
Global meteoric water line |
|
H |
hydrogen |
|
H2S |
hydrogen sulfide |
|
H2O |
water |
|
HCO3 |
bicarbonate |
|
K |
potassium |
|
m |
meter |
|
MCL |
maximum contaminant level |
|
Mg |
magnesium |
|
Na |
sodium |
|
NWQL |
National Water Quality Laboratory of U.S. Geological Survey |
|
RPD |
relative-percent difference |
|
SAR |
sodium-adsorption ratio |
|
Si |
silica |
|
SMCL |
secondary maximum contaminant level |
|
SO4 |
sulfate |
|
TDS |
total dissolved solids |
|
USEPA |
U.S. Environmental Protection Agency |
|
USGS |
U.S. Geological Survey |
|
VSMOW |
Vienna Standard Mean Ocean Water |
WSEO |
Wyoming State Engineer's Office |