U.S. Geological Survey Data Series 542
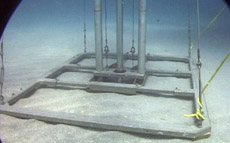
The 07SCC04 vibracores were collected from the 15-meter (m) USGS research vessel R/V G.K. Gilbert using a hydraulic crane to position, deploy, and recover the vibracore rig. A Rossfelder model P-3 electric motor encased in a waterproof housing driving offsetting concentric weights was used to vibrate 7.6-centimeters (cm) diameter by 6.1-m long aluminum core barrels into the sediment. For each core site, the core number, location, local water depth, and recovered core length as well as any other relevant information were recorded in a logbook. A more detailed description of the USGS vibracoring system components and processes is available online at https://pubs.usgs.gov/of/1998/of98-805/html/polloni3.htm.
The 07SCC05 vibracores were collected from the University of New Orleans' (UNO) 6.1-m vessel R/V Greenhead in a similar manner except that the core barrel was positioned through a moon-pool hole in the vessel's deck and was recovered with a manually operated winch. A tripod was used to aid in positioning and recovering cores collected on land. Aluminum core barrels 7.6-cm in diameter and up to 9.1-m long were vibrated into the sediment using a concrete mixer attached to the core barrel with a metal clamp. The concrete mixer was powered by a Stow G-500 gas motor. For each core site, the core number, location, local water depth, and recovered core length as well as any other relevant information were recorded in a logbook.
The 87039 or CI_87 vibracores were taken by Alpine Ocean Seismic using a 12-m-long Alpine pneumatic vibracore apparatus (Kindinger and others, 1989; 1991; Brooks and others, 1995). For more information on the research vessel and vibracoring methods, refer to the FACS logs or contact Alpine Ocean Seismic.
The vibracore description sheets and grain-size analysis methods are described below.
The 07SCC04 and 07SCC05 vibracores were transported to the core-analysis laboratory at the UNO Department of Earth and Environmental Sciences where they were described, sampled, photographed, and archived. Each vibracore was cut into 40-cm sections and split lengthwise. One-half of each core was described using standard sediment-logging methods (below), photographed, and wrapped in plastic sleeves for storage. The other core half was sampled at 80-cm intervals for sediment grain-size analysis. Additional samples were taken from the top and bottom of sand-rich intervals greater than approximately 60 cm thick to allow for more effective textural classification of sandy sedimentary packages.
The 87039 or CI_87 cruise vibracores were processed in a similar fashion by USGS personnel and collaborators. Although the vibracore description sheets used for these cores differ from those used for the 07SCC04 and 07SCC05 cores, most of the column headers and recorded information are the same or similar.
The use of a standard vibracore description sheet ensures that the same set of information is consistently documented for each core. An example vibracore description sheet is shown below (click to enlarge).

The vibracore description sheets consist of seven main parts:
1) The Header lists the basic identifying information for each core: Core ID, elevation, core length, water depth, acquisition date, location, measured compaction, and the name of the person who described the core.
2) Sedimentary Texture and Structures: standard symbols are used to indicate the presence of sedimentary structures such as shells, burrows, plant or root matter, bedding type, sediment deformation, and (or) other physical structures. Sediment grain size is also logged in the appropriate column.
3) Percent Sand: the relative percent of sand, silt, and clay throughout the core is visually estimated and logged in this column.
4) Physical Characteristics: observed physical characteristics (sediment color, deformation features, bedding thickness, and the estimated abundance in percent (0-100%) of shells, organics, and bioturbation) are logged in these columns.
5) Stratification Type: observed bedding structures (wavy, flaser, lenticular, or massive bedding, cross beds, or horizontal or inclined laminations) are logged in these columns.
6) Sample: the depth and type of any sample(s) taken for analysis are logged in these columns. Samples may be collected for grain-size, heavy-mineral, microfossil, and (or) radiometric analyses, and sections of the core that were photographed and (or) x-radiographed are noted.
7) Physical Description: any additional observations or comments are recorded in this section.
The core description sheets were scanned as JPEG files for digital storage and access, and core descriptions consisting of multiple pages were saved as PDF documents. These may be accessed from the Core Data Table or the Core Description Sheets page. The original hardcopy vibracore description sheets are archived at the USGS St. Petersburg Coastal and Marine Science Center (SPC&MSC) and at the UNO core-analysis laboratory.
NOTE: Grain size refers to the diameter of individual sediment grains. Grain-size measurements are not available for the 87039 or CI_87 vibracores; however, the relative percent sand, silt, and clay are available on the vibracore description sheets.
Sediment samples from the 07SCC04 and 07SCC05 vibracores were analyzed at the USGS SPC&MSC using a Beckman Coulter LS 200 particle-size analyzer. The LS 200 uses laser diffraction to quickly and accurately measure the size distribution of sedimentary particles ranging from 0.4 micrometer (![]() m) to 2 millimeters (mm) in diameter. The utility of LS 200 data provides quantitative measurements of size distribution in a customizable data output.
m) to 2 millimeters (mm) in diameter. The utility of LS 200 data provides quantitative measurements of size distribution in a customizable data output.
Sediment sub-samples from intervals down core (approximately 3 to 4 grams) were prepared for analysis by undergoing disaggregation in a sodium hexametaphosphate solution before being resuspended through stirring and sonication, then dispensed by pipette, prior to immersion in the LS 200 module bath. The optimal 8- to 12-percent solution concentration (required for proper instrument sampling) was obtained by the continual addition of prepared sample via pipette until the desired amounts were reached. This procedure was repeated three times per sample, and the measurements were averaged to produce a single analysis per sample. If one measurement departed from the other two by greater than one standard deviation, the measurement was evaluated and removed if necessary. In a few cases samples were reanalyzed to ensure reliable results.
The LS 200 shines a laser on particles suspended in solution. Light is scattered in characteristic patterns based on particle size and these patterns are measured by photodetectors as intensity per unit area, which is broken down into 92 size-classification channels, or "bins." The size-classification boundaries were based on standard American Society for Testing and Materials (ASTM) 11-E sieve (Wentworth, 1922) size scale. The relative amplitude of light intensity for each channel is interpreted as the relative volume of particles of that size.
From the bin counts produced by the LS 200, cumulative weight percents for 5, 10, 16, 25, 50, 75, 84, 90, and 95 percentiles were calculated and mean grin-size and sorting (Inman, 1952) were reported in millimeters and phi intervals for each bin. Percent sand, silt, and clay were reported for each core interval as tables provided in the Core Data Table. Statistical moments that correspond to sorting, skewness, and kurtosis were also calculated following the procedure outlined in Folk (1968). The grain-size data were saved as Microsoft Excel (XLS) files for digital access. Availability of grain-size data for the 07SCC04 and 07SCC05 surveys is provided on the Grain-Size Data page.
Grain-size measurements for mean and sorting were reported in millimeters and phi, respectively, which are recommended as the statistical measures used in assessing the suitability of sediment for nourishment projects (USACE, 1977). The conversion of metric-based measures to the non-dimensional phi (![]() ) categories was completed using the equation
) categories was completed using the equation
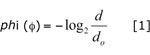
where: d = the millimeter diameter of the measured particle and do = a particle with a 1.0-mm diameter (Krumbein, 1938). In order to accurately establish a correspondence to grain-size data previously acquired by the University of New Orleans Coastal Research Laboratory (UNOCRL) the mean grain size (![]() ) was calculated using the relation
) was calculated using the relation
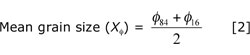
where: ![]() and
and ![]() represent the phi grain sizes for which 84
represent the phi grain sizes for which 84![]() ) from the mean grain size, was calculated through the equation
) from the mean grain size, was calculated through the equation
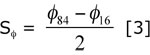
(For example, 68 percent of the spread of a frequency versus grain-size curve lies within ± 1![]() of the mean grain size). The aforementioned statistics are based on procedures developed by Inman (1952) and referenced in the USACE Coastal Engineering Technical Aid No. 79-7 (Hobson, 1979). The completed textural data and core descriptions were integrated for each vibracore to create a data package.
of the mean grain size). The aforementioned statistics are based on procedures developed by Inman (1952) and referenced in the USACE Coastal Engineering Technical Aid No. 79-7 (Hobson, 1979). The completed textural data and core descriptions were integrated for each vibracore to create a data package.
This vibracore package was integrated with existing data such as high-resolution seismic profile (HRSP) data to provide a comprehensive framework of the character and distribution of sedimentary units within the study area.
The core description sheets were digitized using a digitizing tablet, and the data were converted to Microsoft Excel (XLS) spreadsheets using a Visual Basic macro program (Flocks, 2004, 2008 see Software; Dreher and others, 2008). The examples below show how the paper copies of the vibracore description sheets were assigned to a two-dimensional space-value format (click each image to enlarge).

Left: Example of a core description sheet showing column attributes (2A), area being digitized (2B - outlined green box), attached symbol menu (2C), header information (such as latitude, longitude, and elevation) (2D - dashed green box), and locations of first four digitized points: top and bottom of core, and left and right side of symbol menu (2E). Columns are recognized by their distance from origin (x-value), and vertical dimension (y) is either core length or depth of core penetration relative to a datum. Attributes are digitized along their left outer edge.
Below: Close-up example of a core description sheet showing different styles of attributes, such as symbols (4A), curves (4C), and text (4F). The orange dots represent digitized points.

After the core description sheet has been digitized, a conversion method captures all relevant attributes using a translation process that relates the position of an attribute in defined two-dimensional space to the value that the attribute represents (see example below; Flocks, 2008). The relationship between position and data value is dependent on a key table that is customized to the type and format of data being converted.

The digitized core profiles were saved as text (TXT) files that can be accessed from the Core Data Table. These digitized data can be easily accessed and incorporated into statistical and (or) interpretive analyses. Availability of these profiles for all surveys is provided on the Digitized Core Logs page.

![]() U.S. Department of the Interior |
U.S. Geological Survey
U.S. Department of the Interior |
U.S. Geological Survey
URL: pubs.usgs.gov/ds/542/
Page Contact Information: Feedback
Page Last Modified: Tuesday, 12-October-2010 3:00 PM EST
