|
|
|
Figure
1. Location figure showing the study area and location of late
Pleistocene terminal moraines on Long Island, NY. |
|
|
|
|
Figure
2a. Sidescan-Sonar mosaic of the study area, overlain with 2
meter bathymetric contours (See Figure 1 for location). Light tones
depict high backscatter, dark tones areas of low backscatter within
the imagery. |
|
|
|
|
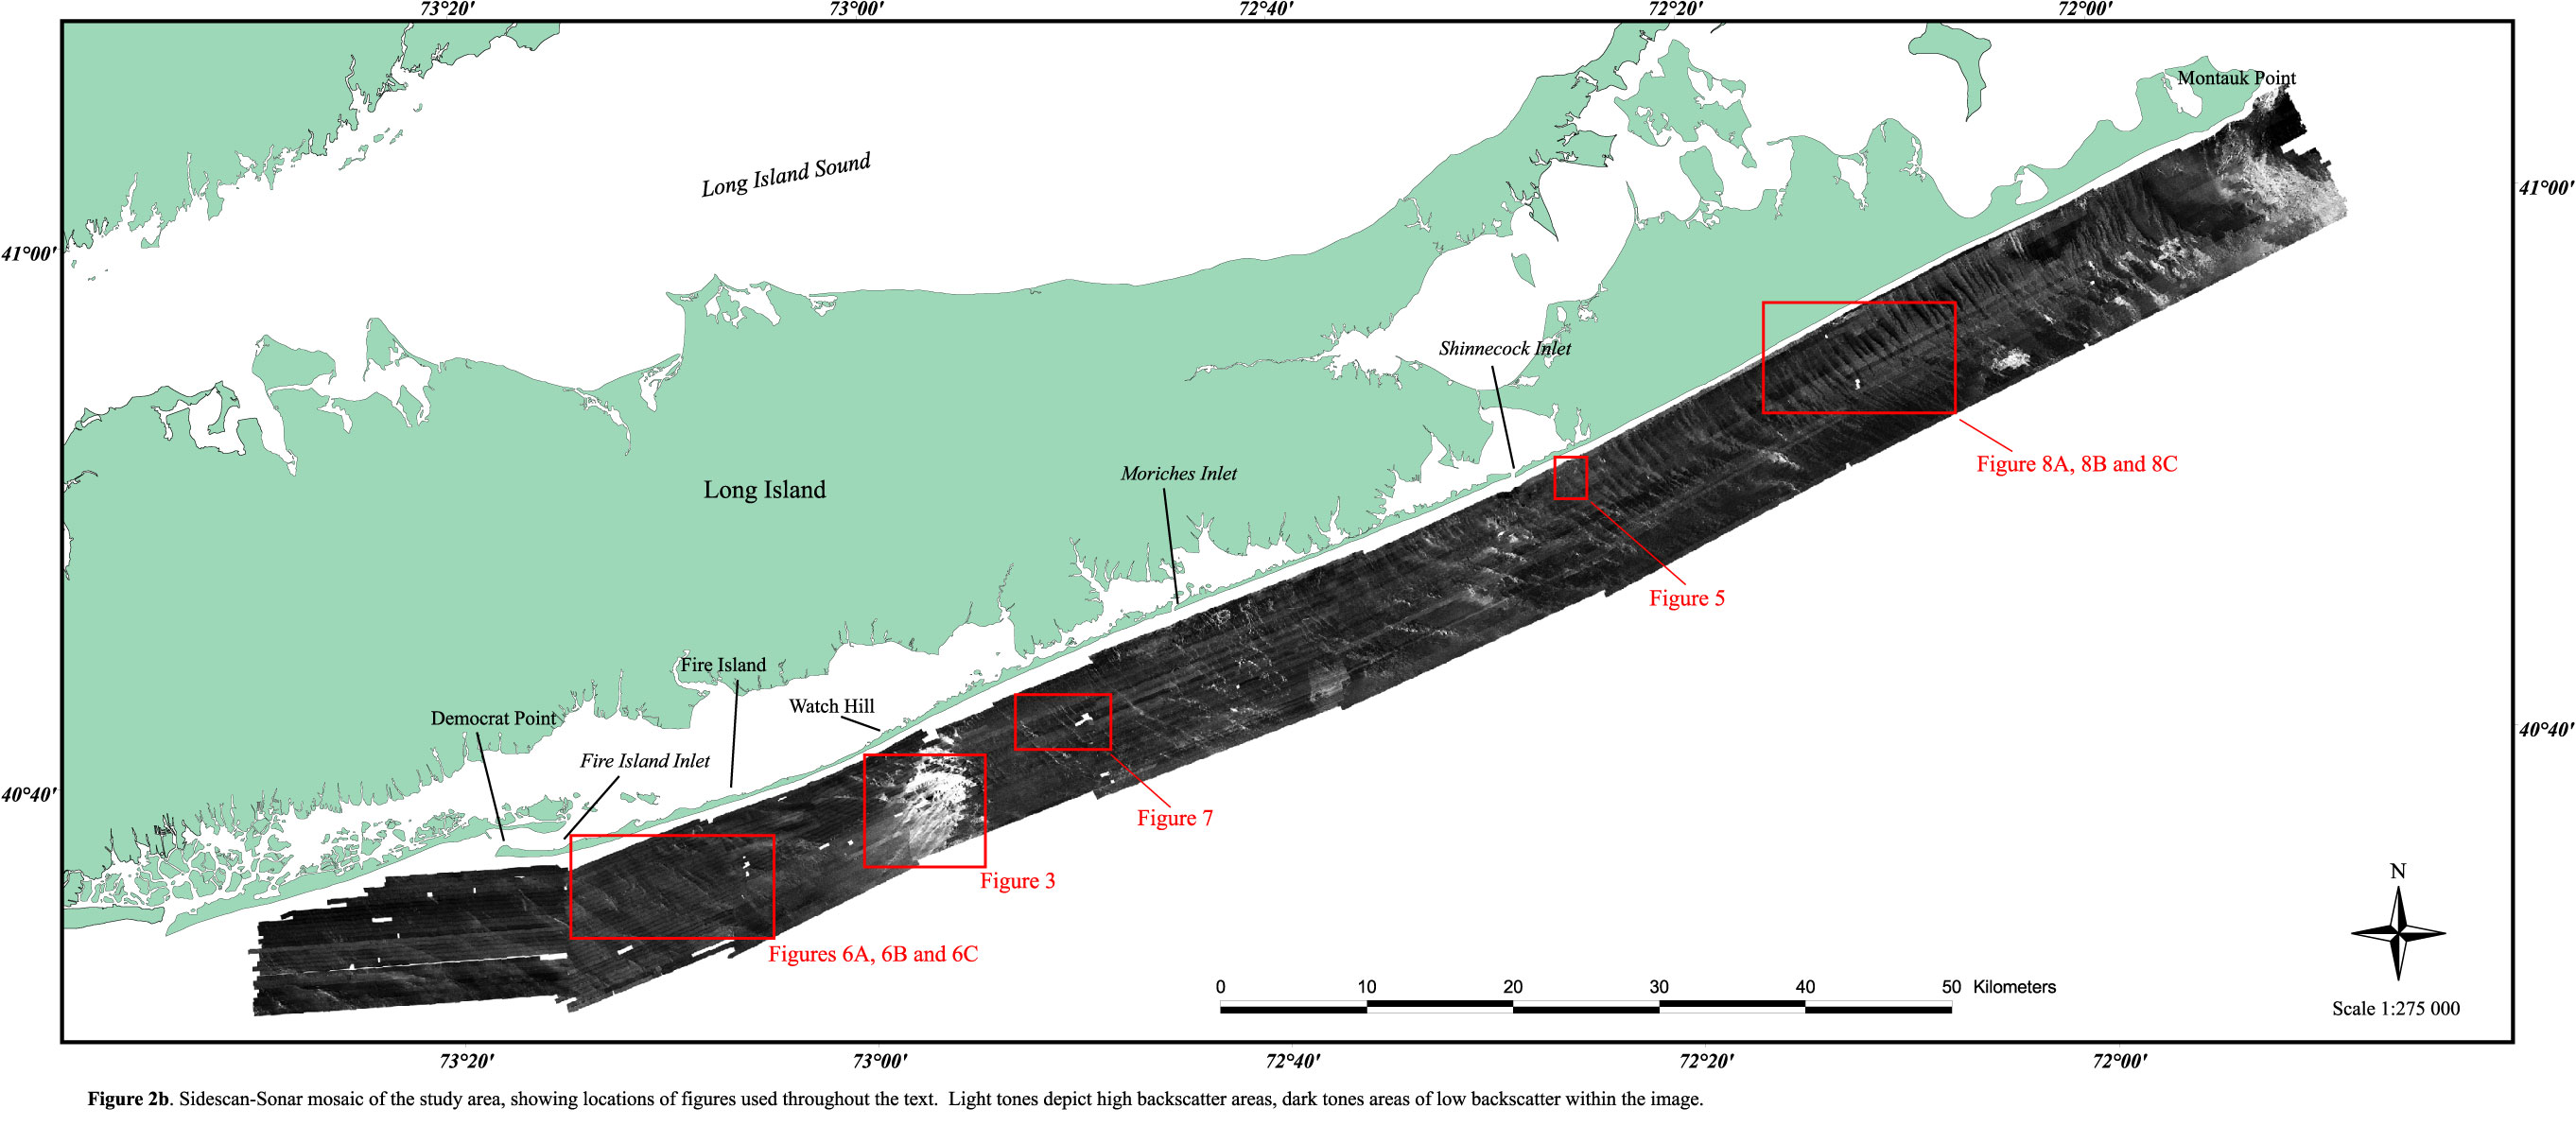
Figure
2b. Sidescan-Sonar mosaic of the study area, showing locations
of figures used throughout the text. Light tones depict high backscatter
areas, dark tones areas of low backscatter within the image. |
|
|
|
|
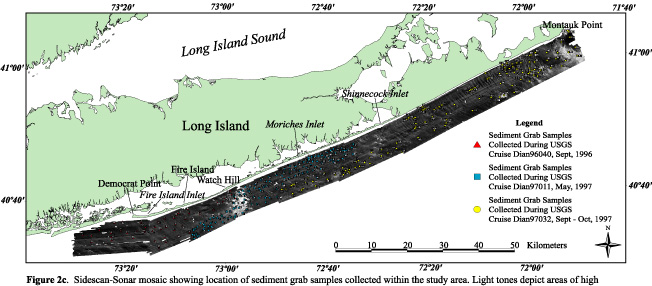
Figure
2c. Sidescan-Sonar mosaic showing location of sediment grab
samples collected within the study area. Light tones depict areas
of high backscatter, dark tones areas of low backscatter within
the image. See Table 1 for sediment texture data. |
|
|
|
|
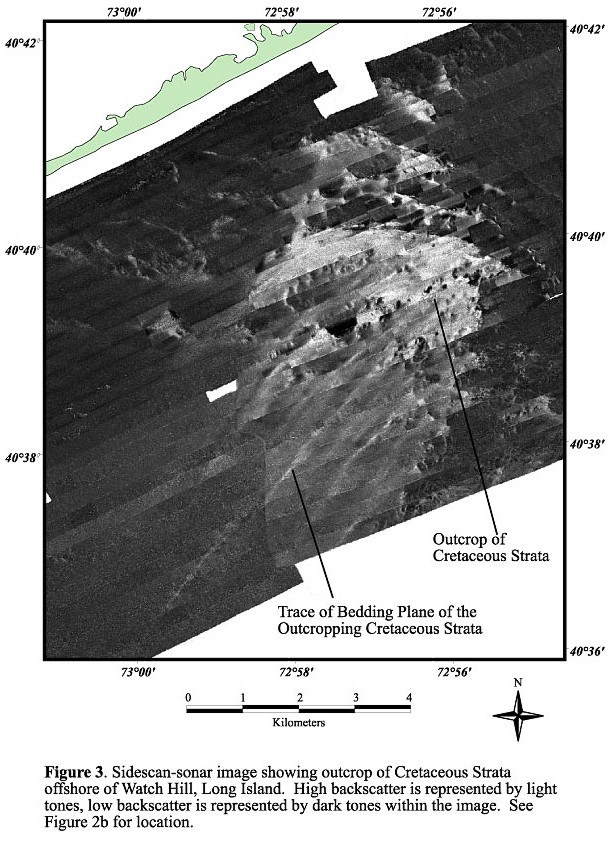
Figure
3. Sidescan-sonar image showing outcrop of Cretaceous Strata
offshore of Watch Hill, Long Island. High backscatter is represented
by light tones, low backscatter is represented by dark tones within
the image. See Figure 2b for location. |
|
|
|
|
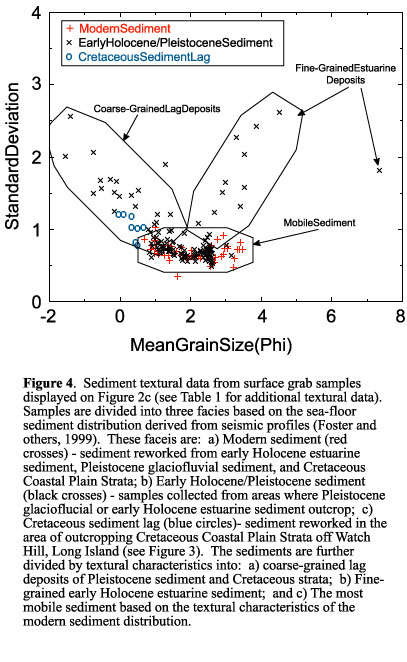
Figure
4. Sediment textural data from surface grab samples displayed
on Figure 2c (see Table 1 for additional textural data). Samples
are divided into three facies based on the sea-floor sediment distribution
derived from seismic profiles (Foster and others, 1999). These facies
are: a) Modern sediment (red crosses) - sediment reworked from early
Holocene estuarine sediment, Pleistocene glaciofluvial sediment,
and Cretaceous Coastal Plain Strata; b) Early Holocene/Pleistocene
sediment (black crosses) - samples collected from areas where Pleistocene
glacioflucial or early Holocene estuarine sediment outcrop; c) Cretaceous
sediment lag (blue circles)- sediment reworked in the area of outcropping
Cretaceous Coastal Plain Strata off Watch Hill, Long Island (see
Figure 3). The sediments are further divided by textural characteristics
into: a) coarse-grained lag deposits of Pleistocene sediment and
Cretaceous strata; b) Fine-grained early Holocene estuarine sediment;
and c) The most mobile sediment based on the textural characteristics
of the modern sediment distribution. |
|
|
|
|
Figure
5. Sidescan-sonar image showing filled paleochannels exposed
on the seafloor. These paleochannels are cut into the Pleistocene
sedimentary deposit and filled with an early Holocene transgressional
sequence. High backscatter is represented by light tones, low backscatter
is represented by dark tones within the image. See Figure 2b for
location. |
|
|
|
|
Table
1. Sediment grab samples collected off of the southern Long
Island shore. |
|
|
|
|
Figure
6a. Simrad EM 1000 Echo Sounder backscatter image of the shoreface-attached
sand ridges west of Watch Hill. Light tones depict areas of high
backscatter, dark tones areas of low backscatter within the image.
See Figure 2b for location. |
|
|
|
|
Figure
6b. Simrad EM 1000 Echo Sounder shaded relief image of the shoreface-attached
sand ridges west of Watch Hill. Bathymetric profile from A to B
is displayed in the insert. See Figure 2b for location. |
|
|
|
|
Figure
6c. Simrad EM 1000 Echo Sounder pseudo-color backscatter image
of the shoreface-attached sand ridges west of Watch Hill. See Figure
2b for location. |
| |
|
|
|
Figure
7. Sidescan-sonar mosaic of the high-backscatter lineaments
east of Watch Hill formed by reworking
of Pleistocene glaciofluvial and early Holocene estuarine sedimentary
deposits exposed at the sea floor. Light tones depict areas of high
backscatter, dark tones areas of low backscatter within the image.
See Figure 2b for location. |
|
|
|
|
Figure
8a. Simrad EM 1000 Echo Sounder backscatter image of the sand
waves offshore of eastern Long Island. Light tones depict areas
of high backscatter, dark tones areas of low backscatter. See Figure
2b for location. |
|
|
|
|
Figure
8b. Simrad EM 1000 Echo Sounder shaded relief image of the sand
waves offshore of eastern Long Island. Bathymetric profile from
A to B is displayed in the insert. See Figure 2b for location. |
|
|
|
|
Figure
8c. Simrad EM 1000 Echo Sounder pseudo-color backscatter image
of the sand waves offshore of eastern Long Island. See Figure 2b
for location. |
|
|
|
|
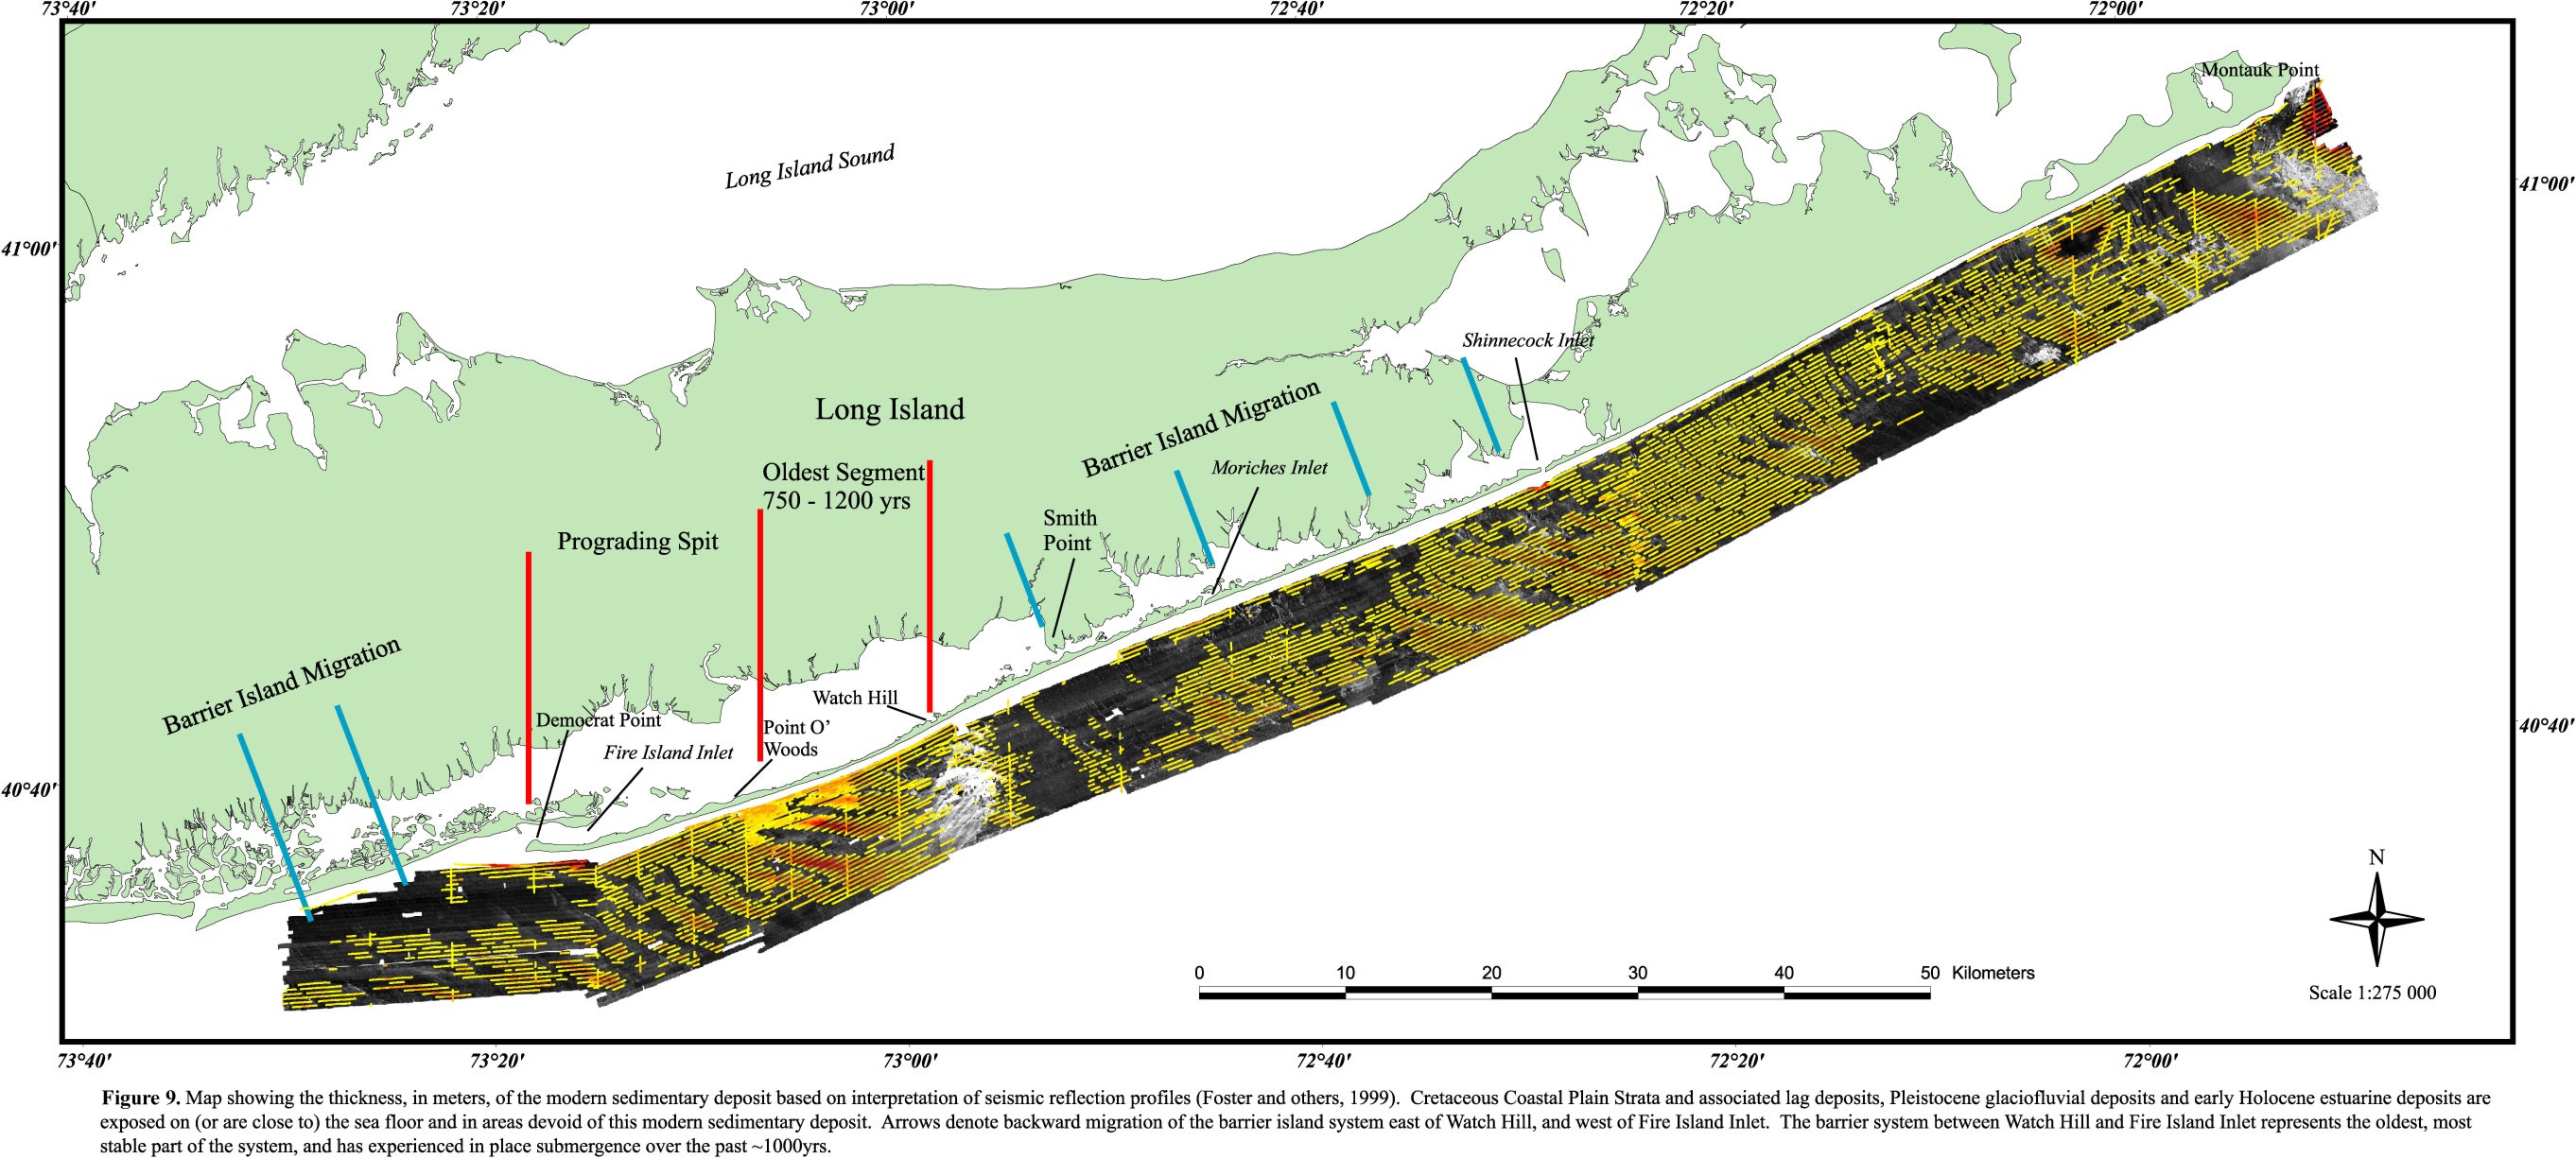
Figure
9(a). Map showing the thickness, in meters of the modern sedimentary
deposit based on interpretation of seismic reflection profiles (Foster
and others, 1999). Cretaceous Coastal Plain Strata and associated
lag deposits, Pleistocene glaciofluvial deposits, and early Holocene
estuarine deposits are exposed on (or are close to) the sea floor
in areas devoid of this modern sedimentary deposit. Arrows denote
landward migration of the barrier island system east of Watch Hill,
and west of Fire Island Inlet. The barrier island system between
Watch Hill and Fire Island Inlet represents the oldest, most stable
part of the system, and has experienced in place submergence over
the past ~1000yrs. |
|
|
|
|
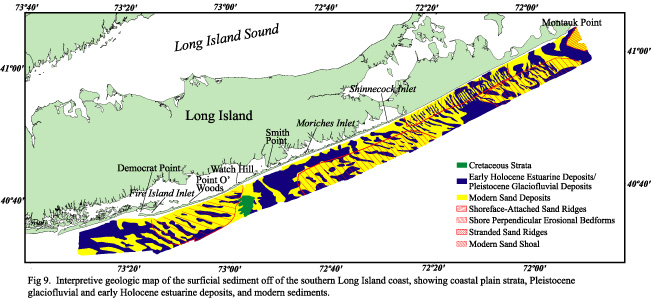
Figure
9(b). Interpretive geologic map of the surficial sediment off
of the southern Long Island coast, showing coastal plain strata,
Pleistocene glaciofluvial and early Holocene estuarine deposits,
and modern sediments. |


